United Kingdom Metals & Mining - gata.org
56
www.cheuvreux.com United Kingdom Metals & Mining Sector report January 2006 Remonetisation of gold: Start hoarding We are raising our mid-cycle gold price estimate to USD900/oz from USD750/oz and see the possibility of a spike to USD2,000, or higher. Covert selling (via central bank lending) has artificially depressed the price for a decade. Central banks have 10–15k tonnes of gold less than their officially reported reserves of 31k. This gold has been lent to bullion banks and their counterparties and has already been sold for jewellery, etc. Non-gold producers account for most and may be unable to cover shorts without causing a spike in the gold price. There is a supply deficit in the gold market of around 1,300 tonnes p.a. before any central bank selling and perhaps 700 tonnes p.a. after "official" sales, but before covert selling. This compares with world gold mine output of only 2,500 tonnes p.a.. Some central banks, notably Russia, are starting to buy gold. Gold acts as an early warning of potential crisis such as rising inflationary/deflationary pressures and general confidence in paper currency, especially the USD. A strongly rising gold price could have severe consequences for US monetary policy and the USD. History suggests that gold always wins against an inflating paper currency (i.e. one subject to excessive supply growth). Gold and gold mining stocks are poised for an unprecedented rise in prices and profile. Investors in UK/European equities need to assess the implications for their portfolios. Global/hedge funds may be better placed to respond. Anglo American is the only large cap gold/precious metals play domiciled in Europe. Paul Mylchreest Investment Analyst +44 20 7621 5257 [email protected]
Transcript of United Kingdom Metals & Mining - gata.org
www.cheuvreux.com
United Kingdom Metals & Mining
Sector report
January 2006
Remonetisation of gold: Start hoarding
� We are raising our mid-cycle gold price estimate to USD900/oz from USD750/oz and see the possibility of a spike to USD2,000, or higher. Covert selling (via central bank lending) has artificially depressed the price for a decade.
� Central banks have 10–15k tonnes of gold less than their officially reported reserves of 31k. This gold has been lent to bullion banks and their counterparties and has already been sold for jewellery, etc. Non-gold producers account for most and may be unable to cover shorts without causing a spike in the gold price.
� There is a supply deficit in the gold market of around 1,300 tonnes p.a. before any central bank selling and perhaps 700 tonnes p.a. after "official" sales, but before covert selling. This compares with world gold mine output of only 2,500 tonnes p.a.. Some central banks, notably Russia, are starting to buy gold.
� Gold acts as an early warning of potential crisis such as rising inflationary/deflationary pressures and general confidence in paper currency, especially the USD. A strongly rising gold price could have severe consequences for US monetary policy and the USD. History suggests that gold always wins against an inflating paper currency (i.e. one subject to excessive supply growth).
� Gold and gold mining stocks are poised for an unprecedented rise in prices and profile. Investors in UK/European equities need to assess the implications for their portfolios. Global/hedge funds may be better placed to respond. Anglo American is the only large cap gold/precious metals play domiciled in Europe.
Paul MylchreestInvestment Analyst +44 20 7621 5257 [email protected]

2
CHEUVREUX UNITED KINGDOM
Metals & Mining Sector
CONTENTS
Investment recommendation..........................................................................................Page 03
I— Introduction and gold price forecast ..............................................................Page 06
II— Anglo American & gold mining stocks...........................................................Page 09
III— Gold: central banks and derivatives ...............................................................Page 12
Introduction .............................................................................................................................................................................................. P.12
IV— Analysis of the gold market..................................................................................Page 16
Exposing gold price suppression................................................................................................................................................ P.16
How big is the gold short position?........................................................................................................................................... P.21
"Official" statistics on the gold market .................................................................................................................................... P.26
Gold mining industry........................................................................................................................................................................... P.30
V— Gold versus the US dollar: only one winner...............................................Page 33
History tells us gold, not paper, is "real money" ............................................................................................................... P.33
What drives the gold price?............................................................................................................................................................ P.36
VI— Gold and the US economy ...................................................................................Page 40
Gold and Bernanke.............................................................................................................................................................................. P.43
Appendix 1.................................................................................................................................Page 46
End of Bretton Woods & last remnants of Gold Standard........................................................................................... P.46
Appendix 2.................................................................................................................................Page 47
The covert war on inflation indicators ...................................................................................................................................... P.47
CHEUVREUX'S METALS & MINING TEAM
Alfred Glaser France +33 1 41 89 74 42 [email protected]
Mikael Jafs Nordic +46 8 723 51 71 [email protected]
Paul Mylchreest Author UK +44.20 7621.52.57 [email protected]
Francisco Riquel Spain +34 91 432 75 51 [email protected]

3
CHEUVREUX UNITED KINGDOM
Metals & Mining Sector
INVESTMENT RECOMMENDATION
Strategically, gold is one of the two most important commodities (with crude oil) on the planet, but its role as the ultimate store of value and method of payment has been forgotten by many investors. The perception of gold has been affected by the last remnants of a Gold Standard being as long ago as 1971, a 20-year bear market and persistent central bank selling. In a scenario of financial stability and fiscal prudence, gold's monetary role retreats into the background, but even then it never goes away. In today's world of massive deficit spending, inflating currencies (i.e. excessive growth in the money supply) and financial imbalances, gold's monetary role is reasserting itself. Investment demand for gold is increasing and the remonetisation of gold has begun.
We are raising our mid-cycle gold price estimate from USD750/oz to USD900/oz. Covert selling (via central bank lending) of gold has artificially depressed the price for about a decade, but Bank for International Settlements' data on gold derivatives suggests its impact is on the wane. Our USD900/oz mid-cycle estimate takes into account the long-term average ratios between the gold price and the prices of oil and the Dow Jones Industrial Average. We also see the possibility of a spike to USD2,000, or higher, if the story on diminished central bank gold reserves becomes widely accepted, if central banks in countries with large US dollar holdings compete to buy gold and diversify forex reserves away from dollars and if the US economy slides into either high rates of inflation or deflation.
Central banks have loaned out 10,000–15,000 tonnes of their gold reserves, between a third and a half of the reported total. Gold loaned by central banks to bullion banks or their counterparties is immediately sold into the physical market for conversion into jewellery, etc. This creates a short position between the central bank and the bullion bank/its counterparty. This short position is the foundation for the gold derivatives market which grew rapidly in the 1990s and currently has a notional value of c.USD300bn. Non-gold producers account for the majority of the short position and may not be able to cover their shorts without causing a spike in the gold price.
Since the mid-1990s, much of this gold lending has been aimed at suppressing the gold price. A low gold price has served to:
− calm financial markets during several periods of financial crisis in the last decade (e.g. Japan, Asian currency crisis, Russia and LTCM);
− improve the perception of US monetary policy; a low gold price suggests a benign inflation outlook, keeps US interest rates low and is supportive of a stronger US dollar;
− prevent substantial losses in the gold derivatives market (notably from the gold "carry trade").
The leader in the fight to expose the suppression of the gold price is the Gold Anti-Trust Action Committee (GATA). GATA was established in 1999 in the US, but is little known outside the world of "gold bugs". Despite official denials, there is much evidence to back the gold price suppression claims. Support for GATA has come from senior Russian officials. Our analysis confirms the view that central banks have loaned out 10,000-15,000 tonnes of gold, although the settlement of some of these lease contracts may be being made in cash rather than physical gold.
We estimate that there is a substantial supply deficit in the gold market of around 1,300 tonnes p.a. before any central bank selling and perhaps 700 tonnes p.a. after the publicly announced sales, but before covert selling. This compares with world gold mine output of only 2,500 p.a. Unlike their unlimited ability to create paper money, central banks' gold reserves are finite and the 7-10 year lead time on new mining projects rules out any quick fix. In addition, there is no way that the market can accommodate renewed buying by central banks like Russia.
The gold price acts as an early warning of potential crisis, such as rising inflationary/deflationary pressures and general confidence in paper currency, especially the US dollar:
− Historically low real yields and accelerating growth in the money supply (currently 8%) suggest that the Fed's monetary tightening is largely illusory. Indeed, while the Fed Funds has been hiked 325bp, the 10-year bond yield has declined by 7bp.

4
CHEUVREUX UNITED KINGDOM
Metals & Mining Sector
− The result of the accommodative policy has been asset and commodity price inflation almost across the board. As new money supply enters the system the transmission mechanism is not uniform. Originating in the bond market, new money chases price inflation as it moves from one asset class to another while remaining largely contained in the financial and commodity sectors. Purchasing power of paper currency is falling sharply in relation to a wide range of asset classes.
− The impact of rapid money supply growth on the prices of consumer goods is masked by cheap Asian imports and distortions in the calculation of the CPI.
− While asset inflation rages, the debt-laden US economy remains vulnerable to recession (possibly even a deflationary slump) if credit expansion and consumer expenditure slow. The yield curve is close to inverting and consumer credit is growing at its slowest rate for more than a decade. It is worth remembering the economist, Ludwig von Mises's (Austrian school), warning: "There is no means of avoiding the final collapse of a boom brought about by credit expansion".
− The Fed Chairman-elect, Ben Bernanke, has given many speeches on the means to stave off deflation, even if it requires highly inflationary measures. Our suspicion is that Bernanke will try to keep the US credit expansion going as long as possible, with the inevitable consequences.
− The US economy will walk a fine line between inflation (possibly hyperinflation) and a deflationary slump in the next few years. In the short term, we see further reinflation with continuing asset inflation as slightly more likely. Even if the US economy somehow muddles through, the short position in gold, central bank buying and low real yields will support the gold price.
Gold and precious metals are the only asset class that should perform well in either an inflationary or deflationary scenario.
The only European-domiciled "large cap" play on gold and precious metals is Anglo American, which controls the third largest gold producer (51% stake in AngloGold Ashanti) and the largest platinum producer (75% holding in Anglo Platinum). AngloGold Ashanti (AGA) is not perfect play on the gold price, given the unfavourable position of its hedge book. That said, it should still be a major beneficiary of a strong gold price. Developing its gold and platinum group metals positions would seem to make more sense than reducing its AGA stake as recently outlined. We are concerned that Anglo may give up control of the third largest gold producer without even extracting a premium. To us, it does not make sense for Anglo to be a "poor man's Rio Tinto or BHP Billiton". Instead, we believe it should focus on its strong positions in gold, platinum group metals and diamonds, while also maintaining a solid portfolio of other mining activities.
Gold and gold mining stocks are poised for an unprecedented rise in prices and profile. Investors in European and UK equities need to assess the implications for their portfolios. Global and hedge funds may be better placed to respond since they can purchase overseas-listed gold and precious metal stocks, exchange-traded funds (ETFs) based on gold, or gold bullion itself. The largest "pure play" gold company in Europe, Peter Hambro, has a market capitalisation of just USD1.5bn. Even investors who are able to invest in overseas stocks may be surprised to find that the market capitalisation of the 10 largest gold stocks on world stock markets is equivalent to only 30% and 40% of the market capitalisations of GE and BP respectively.

5
CHEUVREUX UNITED KINGDOM
Metals & Mining Sector
Gold price 1998-2006 (USD) Gold/oil ratio
GOLDBLN/OILBREN
FROM 1/1/82 TO 24/1/06 MONTHLY
1982 1984 1986 1988 1990 1992 1994 1996 1998 2000 2002 20042006
5
10
15
20
25
30
35
40
DowJones Industrials/gold ratio US M3 money supply diverges from CPI
DJINDUS/GOLDBLN~U$
FROM 1/1/72 TO 24/1/06 MONTHLY
72 74 76 78 80 82 84 86 88 90 92 94 96 98 00 02 04 06
0
5
10
15
20
25
30
35
40
45 USM3....B 24/1/06
87 88 89 90 91 92 93 94 95 96 97 98 99 00 01 02 03 04 05
80
100
150
200
250
300
US MONEY SUPPLY M3 CURA
US CPI - ALL URBAN: ALL ITEMS SADJ
Source: DATASTREAM
Gibson's Paradox: real yield (US 10 year bond – CPI) is inversely correlated to the gold price
FRTCM10-USEBMCPI% 31/1/06
72 74 76 78 80 82 84 86 88 90 92 94 96 98 00 02 04
-6
-4
-2
0
2
4
6
8
10 100
200
300
400
500
600
700
800
900
FRTCM10-USEBMCPI%
Gold Bullion $/Troy Ounce(R.H.SCALE)
S DATASTREAM
Source: Datastream

6
CHEUVREUX UNITED KINGDOM
Metals & Mining Sector
I— INTRODUCTION AND GOLD PRICE FORECAST
Since we first published a mid-cycle gold price forecast of USD750/oz in October 2005, the gold price has risen from USD467/oz to USD557/oz, a rise of 19%. To some extent, the rapidity of this move has taken us by surprise as we expected the bull market in gold to progress at a more measured pace. It is also interesting that during this period the US dollar has remained very stable, weakening by less than 50bp versus the euro. The following chart shows how the bullish trend in the gold price is now well-established.
Gold price since 1998 (USD)
Gold Bullion $/Troy OunceFROM 1/1/98 TO 10/1/06 WEEKLY
1998 1999 2000 2001 2002 2003 2004 2005 2006
250
300
350
400
450
500
550
HIGH 527.50 5/ 1/06 LOW 253.25 26/ 8/99 LAST 527.50Source: DATASTREAM
Source: Datastream
Several reasons for the strength in the gold price have been put forward. These have included:
− rising inflation concerns;
− the change of Fed Chairman;
− rising geopolitical risk;
− rising commodity prices in general; and
− fears over dollar weakness (as yet unfounded).
While all these issues have contributed at various times, we believe they are missing a key issue driving the gold market. The central banks have sold up to half their gold reserves and seem increasingly reluctant to part with more. "Official" demand estimates for the gold market understate the true position, in our view. At the same time, major holders of US Treasuries, such as Russia and China, are beginning to diversify their forex reserves out of US dollars and are buying gold as part of this process.
Gold prices: bullish trend now looks well established…
… with several explanations advanced for this…
… all of which miss the real story, in our view

7
CHEUVREUX UNITED KINGDOM
Metals & Mining Sector
In updating our mid-cycle forecast for the gold price we have considered the following:
− The recent price strength reflects a "catch-up" as strong jewellery demand and growing investment demand (especially from central banks like Russia) overwhelms efforts to suppress the price.
− The long-term average in the Gold/Oil (Brent) ratio has been around 16x, but is currently only 8.6x. The argument that oil has experienced a structural price increase due to the difficulty in finding new reserves could equally apply to gold as production flattens off and reserve lives deteriorate. In addition, empirical evidence shows that gold maintains its purchasing power versus other commodities over time. Looking at the forward curve for oil, the market is assuming a Brent crude price in excess of USD60/bbl three years out. A 16x multiple on a Brent crude price of USD60/bbl would give a gold price of USD960/bbl.
Gold/Oil ratio (Brent crude)
GOLDBLN/OILBREN
FROM 1/1/82 TO 10/1/06 MONTHLY
1982 1984 1986 1988 1990 1992 1994 1996 1998 2000 2002 20042006
5
10
15
20
25
30
35
40
Source: Datastream
− The Dow Jones Industrial Average/gold ratio compares the performance of paper financial assets, in this case equities, with gold (the ultimate store of value). Equities outperformed gold for 20 years until 2000, but this has been moving sharply in reverse. At its peak in 2000, the Dow Jones traded at more than 40x the gold price. At the bottom of the two major credit cycles in the last 100 years, in 1933 and 1980, the Dow/Gold ratio fell to only 1–2x. Since the collapse of Bretton Woods in late 1971, the Dow/Gold ratio has averaged c.12.5x. Applying this ratio to the Dow's current level of 10,688 would suggest a gold price of about USD850.

8
CHEUVREUX UNITED KINGDOM
Metals & Mining Sector
Dow Jones Industrials/Gold ratio
DJINDUS/GOLDBLN~U$
FROM 1/1/71 TO 10/1/06 MONTHLY
71 73 75 77 79 81 83 85 87 89 91 93 95 97 99 01 03 05
0
5
10
15
20
25
30
35
40
45
Source: DATASTREAM
Source: Datastream
We have taken the average of the prices suggested by the long-term Gold/Oil ratio and Dow/Gold ratio to give an estimate for the mid-cycle price of gold of USD900/oz. At this point, we are assuming that this price is reached by 2008 in fairly steady increments, although the reality may be very different. Our price deck for 2006 through to 2010 (mid-cycle) is as follows.
Gold price forecast
(USD/oz) 2005 2006E 2007E 2008E 2009E 2010Emid-cyc
Gold 445.3 625 700 800 900 900
Source: Cheuvreux
We also believe that there is a reasonable chance that we could see the gold price spike up much further, possibly to USD2,000/oz or even higher. This could occur if the following scenarios materialise:
− The consensus in the gold market starts to believe, as we do, that central banks have far less gold in their vaults than they say and traders start to trade against the short position in the gold market.
− The central banks with large holding of US dollar reserves, like Russia and China, compete to buy gold as they diversify their foreign exchange reserves away from the US dollar.
− The US economy enters a phase of either deflation or rapidly rising inflation (hyperinflation?) and confidence in paper currencies in general declines.
9
CHEUVREUX UNITED KINGDOM
Metals & Mining Sector
II— ANGLO AMERICAN & GOLD MINING STOCKS
Anglo American (2157p) Mining - 30 January 2006
Rating: 2/Outperform/Buy - Target price: +15.9% 2500p Paul Mylchreest
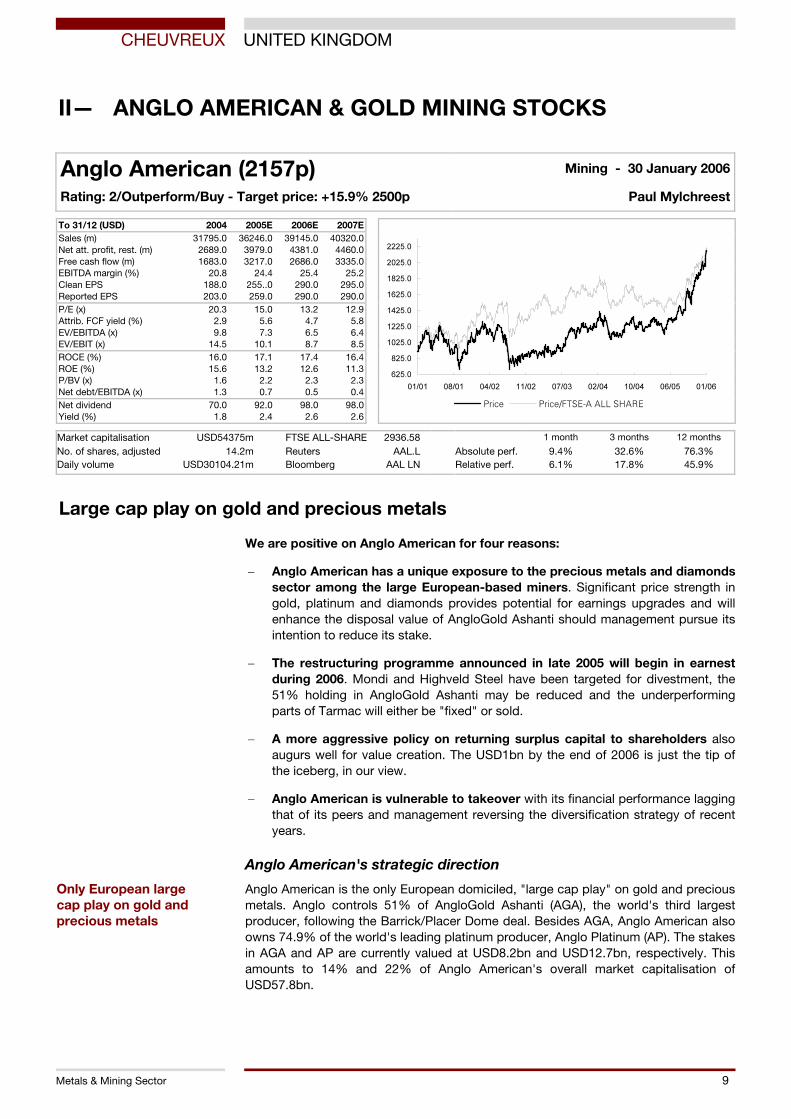
To 31/12 (USD) 2004 2005E 2006E 2007E Sales (m) 31795.0 36246.0 39145.0 40320.0 Net att. profit, rest. (m) 2689.0 3979.0 4381.0 4460.0 Free cash flow (m) 1683.0 3217.0 2686.0 3335.0 EBITDA margin (%) 20.8 24.4 25.4 25.2 Clean EPS 188.0 255..0 290.0 295.0 Reported EPS 203.0 259.0 290.0 290.0 P/E (x) 20.3 15.0 13.2 12.9 Attrib. FCF yield (%) 2.9 5.6 4.7 5.8 EV/EBITDA (x) 9.8 7.3 6.5 6.4 EV/EBIT (x) 14.5 10.1 8.7 8.5 ROCE (%) 16.0 17.1 17.4 16.4 ROE (%) 15.6 13.2 12.6 11.3 P/BV (x) 1.6 2.2 2.3 2.3 Net debt/EBITDA (x) 1.3 0.7 0.5 0.4 Net dividend 70.0 92.0 98.0 98.0 Yield (%) 1.8 2.4 2.6 2.6
625.0
825.0
1025.0
1225.0
1425.0
1625.0
1825.0
2025.0
2225.0
01/01 08/01 04/02 11/02 07/03 02/04 10/04 06/05 01/06
mêáÅÉ mêáÅÉLcqpbJ^=^ii=pe^ob
Market capitalisation USD54375m FTSE ALL-SHARE 2936.58 1 month 3 months 12 months
No. of shares, adjusted 14.2m Reuters AAL.L Absolute perf. 9.4% 32.6% 76.3% Daily volume USD30104.21m Bloomberg AAL LN Relative perf. 6.1% 17.8% 45.9%
Large cap play on gold and precious metals
We are positive on Anglo American for four reasons:
− Anglo American has a unique exposure to the precious metals and diamonds sector among the large European-based miners. Significant price strength in gold, platinum and diamonds provides potential for earnings upgrades and will enhance the disposal value of AngloGold Ashanti should management pursue its intention to reduce its stake.
− The restructuring programme announced in late 2005 will begin in earnest during 2006. Mondi and Highveld Steel have been targeted for divestment, the 51% holding in AngloGold Ashanti may be reduced and the underperforming parts of Tarmac will either be "fixed" or sold.
− A more aggressive policy on returning surplus capital to shareholders also augurs well for value creation. The USD1bn by the end of 2006 is just the tip of the iceberg, in our view.
− Anglo American is vulnerable to takeover with its financial performance lagging that of its peers and management reversing the diversification strategy of recent years.
Anglo American's strategic direction
Anglo American is the only European domiciled, "large cap play" on gold and precious metals. Anglo controls 51% of AngloGold Ashanti (AGA), the world's third largest producer, following the Barrick/Placer Dome deal. Besides AGA, Anglo American also owns 74.9% of the world's leading platinum producer, Anglo Platinum (AP). The stakes in AGA and AP are currently valued at USD8.2bn and USD12.7bn, respectively. This amounts to 14% and 22% of Anglo American's overall market capitalisation of USD57.8bn.
Only European large cap play on gold and precious metals

10
CHEUVREUX UNITED KINGDOM
Metals & Mining Sector
In October 2005, Anglo American announced some preliminary details of its restructuring programme. This puts an end to the diversification strategy that Anglo has pursued for many years that led it to purchasing the Tarmac aggregates business and investing heavily in the Mondi paper and packaging business.
As well as selling Mondi and some underperfoming parts of Tarmac, Anglo has announced that it will reduce its 51% holding in AGA. The extent and timing of this reduction is uncertain although Anglo has indicated that it will retain a shareholding. According to Anglo American's management, the rationale for the sale of AGA is that its value is not fully reflected in the Anglo American valuation.
We should note here that while we are very bullish on the prospects for gold mining shares, we would caution that AGA is not the perfect gold mining play as a result of its hedging programme. AGA has hedged about 10.5m oz of gold production at an average price of USD330–340/oz. This is equivalent to 1.7 years of annual production. AGA is, therefore, not in a position to fully benefit from the coming rise in the price of gold.
While the mark-to-market on AGA's hedge book is substantial (we estimate about USD2.2bn at a gold price of USD550/oz), AGA should still be a major beneficiary of a rising gold price although the hedge book will act as a drag on earnings over the next decade. That said, much of this has already been discounted in the share price and this is obvious from its roughly USD9.0bn (35%) lower enterprise value compared with non-hedger, Newmont Mining. In terms of financial metrics, AGA is an inferior company to Newmont Mining but much of the difference in enterprise value does reflect AGA's hedge book. By way of comparison, Newmont had gold production of about 6.5m oz in 2005 versus 6.0m for AGA. Newmont's cash costs are also around USD30/oz below AGA's, although they had similar reserve lives at end-2004.
We believe that if Anglo's management was patient, the value of AGA would be an important driver for its share price in the context of a surging gold price. From our conversations with the company, we are concerned that in deciding to reduce its holding in AGA, Anglo American's board of directors may be to be responding to ill-informed shareholder pressure. Gold is one of the two most strategically important commodities on the planet and Anglo American has a controlling interest in the third largest producer. Not only is it planning to cut its holding, but it seems prepared to give up its control of AGA for no premium. This is not sound financial thinking.
In our opinion, the new strategy being pursued by Anglo is flawed with regard to AGA. In comparison with two its major peers, Anglo lacks the substantial iron ore presence of both Rio Tinto and BHP Billiton. Iron ore is a highly profitable commodity, especially after the 71.5% price increase negotiated with steel producers from April 2005. Kumba, Anglo's iron ore business, only has about 30m tonnes of iron ore production compared with 126m tonnes for Rio Tinto and 100m tonnes for BHP Billiton. There is little that the company can do to reverse this portfolio weakness given that Brazilian company CVRD, Rio Tinto and BHP Billiton together control 70% of the seaborne iron ore market. That said, profitability in the iron ore industry will sharply deteriorate when the global economic cycle finally turns down.
In our view, Anglo should develop both its gold and platinum group metals businesses, rather than disposing of its AGA stake. This could involve raising its shareholdings in both AngloGold Ashanti and Anglo Platinum and acquiring junior gold and platinum companies with good exploration prospects. In essence, Anglo should not try to be a "poor man's Rio Tinto or BHP Billiton". Instead, it should focus on its strong positions in gold, platinum group metals and diamonds, while also maintaining a solid portfolio of other mining activities such as copper, iron ore, coal and nickel.
Restructuring plans…
… include proposed disposal of AGA
AGA: not a perfect gold mining play due to hedging…
… but should still benefit from rising gold prices
We think retaining AGA would ultimately boost Anglo's share price…
… and selling it would be a mistake
11
CHEUVREUX UNITED KINGDOM
Metals & Mining Sector
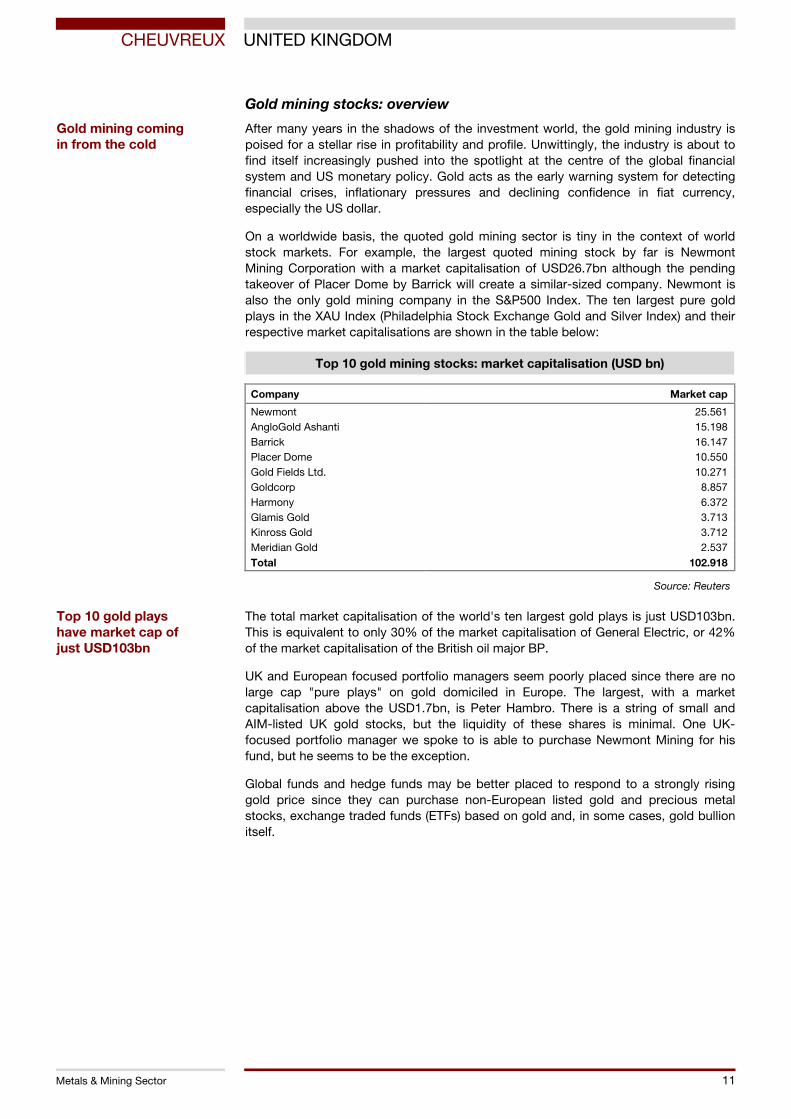
Gold mining stocks: overview
After many years in the shadows of the investment world, the gold mining industry is poised for a stellar rise in profitability and profile. Unwittingly, the industry is about to find itself increasingly pushed into the spotlight at the centre of the global financial system and US monetary policy. Gold acts as the early warning system for detecting financial crises, inflationary pressures and declining confidence in fiat currency, especially the US dollar.
On a worldwide basis, the quoted gold mining sector is tiny in the context of world stock markets. For example, the largest quoted mining stock by far is Newmont Mining Corporation with a market capitalisation of USD26.7bn although the pending takeover of Placer Dome by Barrick will create a similar-sized company. Newmont is also the only gold mining company in the S&P500 Index. The ten largest pure gold plays in the XAU Index (Philadelphia Stock Exchange Gold and Silver Index) and their respective market capitalisations are shown in the table below:
Top 10 gold mining stocks: market capitalisation (USD bn)
Company Market cap
Newmont 25.561 AngloGold Ashanti 15.198 Barrick 16.147 Placer Dome 10.550 Gold Fields Ltd. 10.271 Goldcorp 8.857 Harmony 6.372 Glamis Gold 3.713 Kinross Gold 3.712 Meridian Gold 2.537 Total 102.918
Source: Reuters
The total market capitalisation of the world's ten largest gold plays is just USD103bn. This is equivalent to only 30% of the market capitalisation of General Electric, or 42% of the market capitalisation of the British oil major BP.
UK and European focused portfolio managers seem poorly placed since there are no large cap "pure plays" on gold domiciled in Europe. The largest, with a market capitalisation above the USD1.7bn, is Peter Hambro. There is a string of small and AIM-listed UK gold stocks, but the liquidity of these shares is minimal. One UK-focused portfolio manager we spoke to is able to purchase Newmont Mining for his fund, but he seems to be the exception.
Global funds and hedge funds may be better placed to respond to a strongly rising gold price since they can purchase non-European listed gold and precious metal stocks, exchange traded funds (ETFs) based on gold and, in some cases, gold bullion itself.
Gold mining coming in from the cold
Top 10 gold plays have market cap of just USD103bn

12
CHEUVREUX UNITED KINGDOM
Metals & Mining Sector
III— GOLD: CENTRAL BANKS AND DERIVATIVES
Introduction The starting point for the real story on gold is the quantity of gold held by central banks and the financial derivatives related to part of this gold. According to the IMF, the official figure for gold held by central banks in their vaults is 31,000 tonnes, but the reality is much lower, as we will explain.
The table below shows the top twenty official holders of gold reserves and the percentage of their reserves held in gold in September 2005. Unsurprisingly, most of the largest holders are the major industrialised nations such as the US, Germany and France, etc, as well as the IMF and ECB. The UK has slipped well down the list, but its role in the gold price suppression has been important, as we will show.
Central banks: officially reported gold holdings
Rank Country/entity tonnes at Sep-05 Gold as % of reserves
1 US 8 134 68% 2 Germany 3 428 52% 3 IMF 3 217 n/a 4 France 2 857 59% 5 Italy 2 452 59% 6 Switzerland 1 290 35% 7 Japan 765 1% 8 ECB 720 n/a 9 Netherlands 717 52%
10 China 600 1% 11 Spain 473 43% 12 Taiwan 423 3% 13 Portugal 408 58% 14 Russia 387 4% 15 India 358 4% 16 Venezuela 357 18% 17 UK 311 10% 18 Austria 308 37% 19 Lebanon 287 29% 20 Belgium 228 27%
35 Australia 80 3%
79 Canada 3 0%
Source: World Gold Council
The origin of today's problems in the gold market date back to the 1980s when central banks began to lend or deposit part of their gold holdings with leading bullion banks (such as JPMorgan Chase, Goldman Sachs, Citibank, etc) in return for a fee, the gold lease rate, typically about 1-2% p.a then (currently about 0.2%). This was seen as a sensible use for an asset that otherwise earned no income for central banks. The gold lent by central banks was additional to the well publicised "official" selling by many of them, including the UK, Switzerland, Netherlands, Australia, Canada, etc.
From the mid 1990s onwards, however, the nature of much of the central bank gold lending and sales changed. By lending and selling gold, central banks were able to depress the gold price. The suppression of the gold price served three main purposes:
What is the truth about central bank reserves and related derivatives?
Trouble started in 1980s, when central banks started to lend and sell…
… leading to price suppression in the mid 1990s

13
CHEUVREUX UNITED KINGDOM
Metals & Mining Sector
− It helped to calm financial markets at times of actual or feared economic/political crisis. For example, the Japanese economic crisis in the mid-1990s, the Asian financial crisis, Russian debt default and the collapse of LTCM in 1998 and the 9/11 attack.
− It is positive for the perception of US monetary policy. A low gold price suggests that US inflation is under control and is therefore supportive of a stronger USD and lower nominal interest rates.
− It prevented major commercial and investment banks incurring substantial losses from the "gold carry trade" in the face of a rising gold price.
Central bank lending dramatically increased liquidity in the gold market which is created when the bullion banks, which act as intermediaries and have no direct use for the metal, sell the gold borrowed from the central bank into the physical market. The gold itself is then most likely to be turned into jewellery. This gold sale is the starting point for a number of transactions, generally involving derivatives, at the centre of which are the bullion banks.
Having sold the gold borrowed from the central bank, the bullion bank can reinvest the proceeds from the spot gold sale in other markets, e.g. the bond market in a "carry trade". A "carry trade" is where an asset carrying a low yield is sold short and the proceeds reinvested in a higher-yielding asset. This can be very profitable, but only as long as the price of the lower-yielding asset doesn't rise. Given the very low cost of leasing gold, it is a very cheap source of finance. With low lease rates and the gold price expected to remain weak, hedge funds and the proprietary trading desks of banks saw huge profit potential in the 1990s. The gold carry trade gathered pace through this period, but when the price started to rise, the bullion banks and their counterparties had built up substantial short positions and were "caught".
If the bullion bank chooses not to hedge the gold price risk, there will be no associated derivative other than a simple swap with the central bank. Gold derivatives arise if the bullion bank hedges the gold price risk by buying, for example, a long position in the forward market. On the other side of the bullion banks forward purchase could be a gold producer hedging future production or a speculator (hedge fund, bank, etc) that wants to short the gold market. All market participants are also able to adjust their risk positions through buying and selling gold options.
When bullion banks enter into derivatives transactions with non-producers, or if the bullion bank itself is unhedged on a gold carry trade, the ultimate source of gold for repayment to the central bank has to be the physical gold market. The parties short of gold are then exposed to upside in the gold price.
The gold-lending policies of central banks distort the supply and demand picture for the gold market. Gold borrowed from central banks and sold into the spot market has the effect of increasing supply in the short term and depressing the gold price. Many commentators seem relaxed, believing that almost all the gold lent by the central banks is used to cover the forward selling of production by gold producers. This is the assumption made by the World Gold Council in its "official" estimates of gold supply and demand. Even if this were true, which it isn't, we are less sanguine. Since forward selling by producers accelerates supply, the delivery of the gold back to central banks will therefore restrict supply in the future. If gold demand is rising and producers are reducing forward selling at the same time, as is currently the case, the deficit in the gold market will become more exaggerated (we analyse the deficit in gold supply below).
Bullion banks borrow from central banks, sell into physical market…
… leading to a host of further transactions (mostly derivatives)
Central banks' gold lending practices distort gold market

14
CHEUVREUX UNITED KINGDOM
Metals & Mining Sector
In a report entitled Gold Derivatives: The Market View by Jessica Cross (August 2000) and commissioned by the World Gold Council, the author divides the gold derivatives market into swaps, forwards and options. She identifies seven types of derivatives in the "forwards" category: fixed, floating gold rate, floating, spot deferred, participating, advance premium and short-term averaging. For each of these forward contracts, she estimates the negative impact on the gold price of setting up the respective derivative. For every one of the forwards, she classes the impact as:
"100% – the executing bank borrows the equivalent amount of gold and sells it immediately into the market".
This confirms that forward derivatives contracts create short positions relating to central bank gold and that these sales fully impact the spot gold price in a negative manner.
In the "options" category, Ms Cross identifies six types: put, call, cap and collar, up and in, down and out and convertible forward. When an option contract is set up, the initial impact on the gold price is less clear so we have summarised Ms Cross's findings for each category:
− Call: widely used by the miners and "some central banks" to earn premium. Calls written by hedger are left naked. Ms Cross states that "the hedger (especially the central banks) may be willing to deliver against the calls should they be exercised". The buyer (bullion bank) is initially a seller depending on the delta.
− Put/cap and collar/convertible forward: widely used by the mining industry for downside protection to the gold price. The buyers will tend not to delta hedge. The writer (bullion bank) will delta hedge and is initially a seller.
− Up and in/down and out: these are of little use to the mining industry and are more for speculation. The options (puts or calls) are triggered if a price level is broken at any stage of the contract term. The bullion bank is initially a delta hedge seller.
It is not obvious from the above that central bank gold is initially required to provide liquidity in order to generate these options although delta hedging by the bullion banks does involve buying and selling gold. It is interesting, however, that Ms Cross believes that central banks do write calls against their gold. While having no impact when the option is created, if it is subsequently exercised, the central bank will have to deliver physical gold. This suggests that central banks are at risk of losing gold over and above the level implied solely by the forwards/swaps (we incorporate this into our analysis of the short position in the gold market below).
It is clear from the above that the foundation of liquidity in the gold derivatives market is the short position created by central bank lending. The net position of all the longs and shorts in the derivative market, including all forwards, swaps and options, must balance out. Between the bullion banks/their counterparties and the central banks, however, there is a short position which is the basis for the liquidity. This short position is held by the bullion banks and/or their counterparties.
The above-mentioned report, Gold Derivatives: The Market View, Ms Cross states
"The growth of the derivatives market has been made possible by the existence of large stocks of gold, largely in the official sector… The future stability of the derivatives market depends on the continuing readiness of the official sector to lend its gold."
This suggests a relationship between the size of the derivatives market and the level of gold lending.
Gold derivatives can be swaps, forwards or options Seven types of forwards identified…
… and six types of options
Central banks believed to be writing calls against their gold
Gold derivatives liquidity based on short position created by central bank lending
15
CHEUVREUX UNITED KINGDOM
Metals & Mining Sector
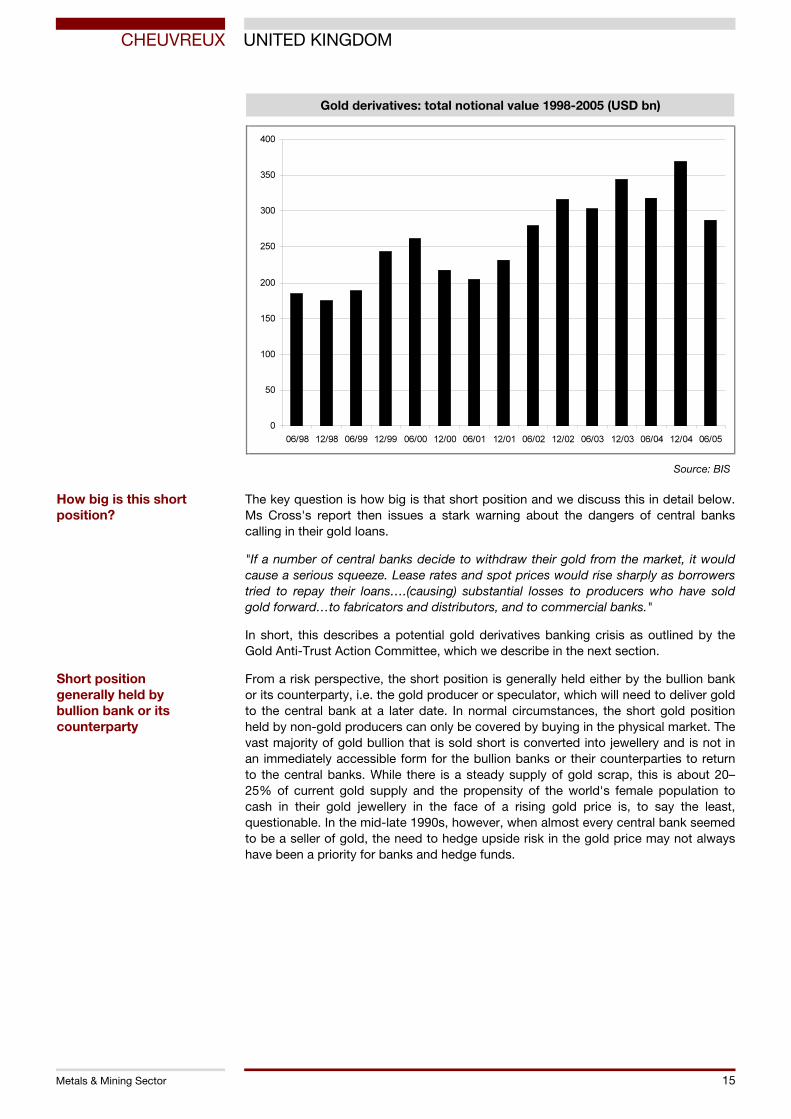
Gold derivatives: total notional value 1998-2005 (USD bn)
0
50
100
150
200
250
300
350
400
06/98 12/98 06/99 12/99 06/00 12/00 06/01 12/01 06/02 12/02 06/03 12/03 06/04 12/04 06/05
Source: BIS
The key question is how big is that short position and we discuss this in detail below. Ms Cross's report then issues a stark warning about the dangers of central banks calling in their gold loans.
"If a number of central banks decide to withdraw their gold from the market, it would cause a serious squeeze. Lease rates and spot prices would rise sharply as borrowers tried to repay their loans….(causing) substantial losses to producers who have sold gold forward…to fabricators and distributors, and to commercial banks."
In short, this describes a potential gold derivatives banking crisis as outlined by the Gold Anti-Trust Action Committee, which we describe in the next section.
From a risk perspective, the short position is generally held either by the bullion bank or its counterparty, i.e. the gold producer or speculator, which will need to deliver gold to the central bank at a later date. In normal circumstances, the short gold position held by non-gold producers can only be covered by buying in the physical market. The vast majority of gold bullion that is sold short is converted into jewellery and is not in an immediately accessible form for the bullion banks or their counterparties to return to the central banks. While there is a steady supply of gold scrap, this is about 20–25% of current gold supply and the propensity of the world's female population to cash in their gold jewellery in the face of a rising gold price is, to say the least, questionable. In the mid-late 1990s, however, when almost every central bank seemed to be a seller of gold, the need to hedge upside risk in the gold price may not always have been a priority for banks and hedge funds.
How big is this short position?
Short position generally held by bullion bank or its counterparty

16
CHEUVREUX UNITED KINGDOM
Metals & Mining Sector
IV— ANALYSIS OF THE GOLD MARKET
Exposing gold price suppression The leader in the fight to expose suppression of the gold price is the Gold Anti-Trust Action Committee (GATA). GATA was created in January 1999 as a non-profit Delaware-based corporation and consists of a range of gold market participants. The GATA website can be found at www.gata.org and the GATA Chairman's gold website is www.lemetropolecafe.com. While many so-called "gold bugs" are aware of GATA, most equity and other financial market participants (especially in Europe) are not.
GATA presented a report, Gold Derivative Banking Crisis, to the Speaker of the House and every member of the House and Senate Banking Committees in 2000. This outlined the suppression of the gold price and the related risks to the financial system. In addition, manipulating a free market like gold is illegal under US law and contravenes the Sherman Anti-Trust Act. Questions on gold price suppression were asked of Alan Greenspan and US Treasury officials and received denials of any wrongdoing. Two lawsuits have been filed. One was dismissed on a legal technicality and the other has gone to discovery and continues.
High profile support for GATA has come from Russia. One source, although his comments were carefully worded, was Oleg Mozhaiskov, Deputy Chairman of the Bank of Russia, in a speech to the LBMA in June 2004. He said:
"Many have heard of the group of economists who came together in the society known as the Gold Anti-Trust Action Committee… They believe that with the assistance of a number of major financial institutions…some senior officials have been manipulating the market since 1994… As a result, the price dropped below USD300 an ounce at a time when it should, if it had kept up with inflation, have reached USD740-760. I prefer not to comment on this information but dare assume that the specific facts included in the lawsuits might have given ground to suspicion that the real forces acting on the gold market are far from those of classic textbook that explain to students how prices are born in a free market."
Russian interest in GATA views was confirmed with the attendance of Andrey Bykov at the GATA conference, "Gold Rush 21", on 8-9 August 2005 in the Yukon, Canada. Andrey Bykov is President of the Academic Center for Strategic Partnership and Energy Security in Moscow and is an economic adviser to Vladamir Putin.
GATA argues that the suppression of the gold price may have begun with the Japanese deflation crisis which pushed the gold price over the USD400/oz level in early 1996.
GATA: fighting suppression of the gold price
Suppression may have been triggered by Japanese deflation crisis in 1996

17
CHEUVREUX UNITED KINGDOM
Metals & Mining Sector
Gold price and Japanese crisis 1995-96 (USD/oz)
Gold Bullion $/Troy OunceFROM 30/6/95 TO 28/6/96 DAILY
JUN JUL AUG SEP OCT NOV DEC JAN FEB MAR APR MAY JUN
375
380
385
390
395
400
405
410
415
420
HIGH 415.40 2/ 2/96 LOW 379.25 5/ 9/95 LAST 382.25Source: DATASTREAM
Source: Datastream
Major bullion banks which had put on the gold carry trade (perhaps 5,000 tonnes at the time) had no way of covering their short positions without causing the gold price to spike, exacerbating their losses. If true, the "powers that be" presumably saw the operation as a success, having saved various banks and prevented the meltdown of the Japanese financial system (with the potential liquidation of its huge portfolio of US bonds).
Gold market followers became suspicious when movements in the gold price seemed at odds with events. James Turk (founder of the GoldMoney newsletter), explained:
"By early 1997, I sensed that we faced something that could not be explained by normal market forces… after a much higher than expected inflation number was released… prices reversed sharply in an unusual and abrupt change of trend. I said: "It appeared that some powerful force had entered the market".
The major catalysts which sparked GATA's belief that the gold price was being were twofold:
− The bailout of Long Term Capital Management (LTCM), whose collapse in September 1998, following the Russian debt default, threatened the global banking system. There were strong rumours that LTCM was short of 300 tonnes of gold when it crashed at the end of 1998 (equivalent to USD2.9bn then). This short position is thought to have been assumed by the banks involved in the bailout operation.
Gold price movements "at odds with events"
GATA saw two major catalysts:…
… LTCM…
18
CHEUVREUX UNITED KINGDOM
Metals & Mining Sector
− The handling of the Bank of England's announcement in May 1999 that it would sell 415 tonnes of gold. In GATA's view this was a political decision to keep the gold price below USD300oz at the time. The public announcement of the sale seemed to ensure the UK would achieve the lowest possible price rather than the highest. In fact, the price subsequently collapsed to USD252/oz and the first sale of 25 tonnes was made at a price of USD261.20/oz, or USD26/oz below the price at the time of the announcement. Unlike the case of major European central banks, the UK's gold reserves are ultimately controlled by HM Treasury, i.e. politicians not the Bank of England. The Bank of England's action followed the failure of the US (in a high profile campaign by Treasury Secretary Robert Rubin and supported by the UK Government) to achieve IMF gold sales (officially to fund debt-relief for developing countries and actually opposed by many of them).
From the UK's standpoint, the handling of the sale was a fiasco. We believe the current loss to UK taxpayers of about USD2.0bn makes a mockery of Tony Blair's comment to the House of Commons:
"It was carried through perfectly sensibly and we actually got the best deal for the country".
In their public comments, neither the Prime Minister, the Chancellor, HM Treasury nor the Bank of England could agree on who was ultimately responsible for the decision to sell. Unusually, the former head of foreign exchange and gold at the Bank of England, Terry Smeeton, even released a statement in which he said:
"It's clearly a Treasury decision in which the Bank has had to acquiesce".
There are precedents for the UK coming to the rescue of the US (and vice versa) and the banking system in the past. For example, the UK tried in vain to support the doomed Bretton Woods system in the late-1960s to early-1970s. Between 1958 and 1965, the amount of gold in the UK's reserves varied between 2,000 and 2,500 tonnes, but during 1966 and 1972, the UK Treasury sold 1,356 tonnes in a futile attempt to support the value of the US dollar versus gold. Once again, the cost of this ill-fated scheme was borne by the British public.
As events unfolded, others probed further into activities in the gold market and more evidence – some clear-cut (such as comments by Alan Greenspan) and some circumstantial – of gold price suppression emerged.
Officially, the Federal Reserve and the US Treasury do not trade in the gold market. Indeed, suppressing the free market price of gold contravenes US anti-trust legislation. Publicly available evidence may suggest otherwise, however. A comment by Alan Greenspan in his testimony to the House Banking Committee in July 1998 confirmed both intervention and its aim of restraining strength in the gold price:
"…central banks stand ready to lease gold in increasing quantities should the price rise".
He later elaborated on this comment in a letter to Senator Joseph Lieberman.
"This observation simply describes the limited capacity of private parties to influence the gold market by restricting the supply of gold, given the observed willingness of some foreign reserves – not the Federal Reserve – to lease gold in response to price increases."
This appears to be clear evidence from Greenspan that central banks do intervene in the gold market, even if he denies the involvement of the Federal Reserve.
… and BoE's gold sale announcement
We believe the BoE's move was disastrous for the UK…
… but who made the decision?
Would not be first time UK has stepped in to help
Further evidence of price suppression: Greenspan's comments…

19
CHEUVREUX UNITED KINGDOM
Metals & Mining Sector
Besides the Fed, the US Treasury operates in the financial markets through the Exchange Stabilisation Fund (ESF). The ESF has assets of about USD38.0bn and operates in the forex markets. It is under the exclusive control of the Treasury Secretary and the President and, therefore, largely escapes Congressional oversight. Ironically, the ESF was created from the paper profits made following the confiscation of gold from US citizens in 1933 at USD20.67/oz and the subsequent devaluation of the US dollar to USD35.0/oz. Lower level Treasury officials have denied that the ESF operates in the gold market. Despite this, the following comment was found in a 1995 FOMC (Federal Open Markets Committee) transcript attributed to the general counsel of the Federal Reserve and FOMC:
"The (ESF) statute is very broadly worded in terms of words like 'credit' – it has covered things like gold swaps".
Further work by James Turk in his publication Freemarket Gold & Money Report ("The Smoking Gun", December 2000) has shown discrepancies between the Federal Reserve's "Gold Stock" on its balance sheet and the "Gold Stock including the Exchange Stabilisation Fund" in its statement on US Reserve Assets. This is shown in the table below (note that the Fed accounts for gold at an historic price of USD42.22/oz).
Discrepancies in gold holdings: Federal Reserve and ESF
USD m 1995 1996 1997 1998 1999
FRB Year-End Audit 11050 11048 11047 11046 11048 US Reserve Assets incl. ESF 11050 11049 11050 11041 11089 Difference in USD 0 -1 -3 5 -41 Difference in oz (,000s) -24 -71 118 -971
Source: Federal Reserve
The key points from this table are:
− At the end of 1995, US gold reserves are identical in the two sources. Differences began to emerge in 1996, consistent with GATA's claim that the suppression of the gold price began in the mid-1990s.
− The differences between US gold reserves and US gold reserves including the ESF are likely to represent either long or short positions in gold taken by the ESF and, therefore, may suggest intervention in the gold market.
James Turk concludes that there was a disconnect within the Fed/US Government; i.e. that:
"…one arm of the government at a very low level was reporting events that other people at higher levels in another arm of the government were denying ever happened".
On 26 September 1999 the first Washington Agreement was signed by the ECB and 14 European central banks (including the Bank of England) to limit their gold sales and leasing to 400 tonnes per year and 2,000 tonnes over the next five years. Within the agreement was provision for the UK to sell the remaining 365 tonnes gold from the 415 tonne sale announced earlier that year.
… and suggestions that ESF may have intervened
Discrepancies in the Fed's gold stock?
First Washington Agreement: limiting gold sales
20
CHEUVREUX UNITED KINGDOM
Metals & Mining Sector
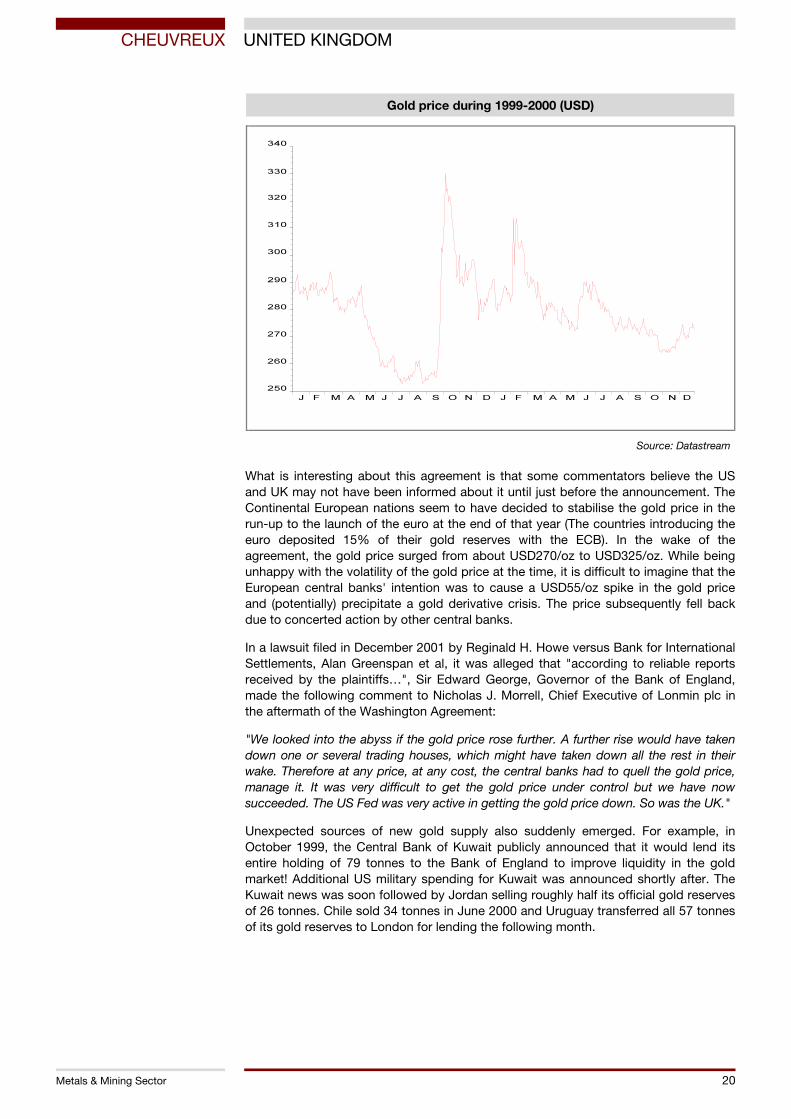
Gold price during 1999-2000 (USD)
Gold Bullion $/Troy OunceFROM 1/1/99 TO 29/12/00 DAILY
J F M A M J J A S O N D J F M A M J J A S O N D
250
260
270
280
290
300
310
320
330
340
HIGH 330.00 5/10/99 LOW 252.85 20/ 7/99 LAST 272.95Source: DATASTREAM
Source: Datastream
What is interesting about this agreement is that some commentators believe the US and UK may not have been informed about it until just before the announcement. The Continental European nations seem to have decided to stabilise the gold price in the run-up to the launch of the euro at the end of that year (The countries introducing the euro deposited 15% of their gold reserves with the ECB). In the wake of the agreement, the gold price surged from about USD270/oz to USD325/oz. While being unhappy with the volatility of the gold price at the time, it is difficult to imagine that the European central banks' intention was to cause a USD55/oz spike in the gold price and (potentially) precipitate a gold derivative crisis. The price subsequently fell back due to concerted action by other central banks.
In a lawsuit filed in December 2001 by Reginald H. Howe versus Bank for International Settlements, Alan Greenspan et al, it was alleged that "according to reliable reports received by the plaintiffs…", Sir Edward George, Governor of the Bank of England, made the following comment to Nicholas J. Morrell, Chief Executive of Lonmin plc in the aftermath of the Washington Agreement:
"We looked into the abyss if the gold price rose further. A further rise would have taken down one or several trading houses, which might have taken down all the rest in their wake. Therefore at any price, at any cost, the central banks had to quell the gold price, manage it. It was very difficult to get the gold price under control but we have now succeeded. The US Fed was very active in getting the gold price down. So was the UK."
Unexpected sources of new gold supply also suddenly emerged. For example, in October 1999, the Central Bank of Kuwait publicly announced that it would lend its entire holding of 79 tonnes to the Bank of England to improve liquidity in the gold market! Additional US military spending for Kuwait was announced shortly after. The Kuwait news was soon followed by Jordan selling roughly half its official gold reserves of 26 tonnes. Chile sold 34 tonnes in June 2000 and Uruguay transferred all 57 tonnes of its gold reserves to London for lending the following month.

21
CHEUVREUX UNITED KINGDOM
Metals & Mining Sector
How big is the gold short position? An analysis of central bank activity in the gold market is further complicated by the opaque methods used by most central banks to account for their gold reserves. Under IMF guidelines for central bank accounting of gold reserves, almost all of them do not discriminate between the amount of gold remaining in their vaults and the amount that has been leased or swapped out.
In their annual reports, most central banks report "Gold and gold receivables" or "Gold and gold deposits" as one item. This "accounting sleight of hand" appears to have originated from an IMF meeting in Santiago, Chile, in October 1999 (just at the time of huge upward pressure on the gold price after the first Washington Agreement).
One GATA supporter, Andrew Hepburn asked the IMF "why does the IMF insist that members record swapped gold as an asset when a legal change of ownership has occurred?". The IMF's reply was:
"This is not correct: the IMF in fact recommends that swapped gold be excluded from reserve assets (see Data Template on International Reserves and Foreign Currency Liquidity, Operational Guidelines, para. 72,)."
Despite this, public filings from a number of central banks contradict the IMF's statement. Italy's central bank describes Gold and Gold Receivables in its balance sheet as follows:
"Comprises the gold owned by the Bank of Italy and receivables in respect of deposits denominated in gold and swaps".
The central bank of the Philippines stated:
"Beginning January 2000, in compliance with the requirements of the IMF's reserves and foreign currency liquidity template under the Special Data Dissemination Standard (SDDS), gold swaps undertaken by the BSP with non-central banks shall be treated as collateralized loan. Thus, gold under swap arrangement remains to be part of reserves and a liability is deemed incurred corresponding to the proceeds of the swap."
The IMF has even contradicted itself in a December 2004 paper for a meeting of the Advisory Expert Group (AEG) on National Accounts entitled "Repurchase agreements, securities lending, gold swaps and gold loans". On the subject of gold swaps and gold loans/deposits, it acknowledged that these transactions:
"…are complex and have not been fully worked through. Work is still being undertaken by the Committee to address the implications."
Most interestingly, however, it highlights the problem of double-counting of gold loaned by central banks that has subsequently been sold into the physical market:
"In particular, gold may be double-counted with either a gold swap or gold loan/deposit if the party acquiring the gold were to on-sell it outright, because both the original owner and the outright purchaser would report ownership of the gold".
GATA generally cites a figure for the short position of 10,000–15,000 tonnes. This estimate is supported by the analysis of three GATA supporters in work done during 2001-03. Below we have summarised the three different methodologies:
Difficult to assess central banks' gold reserves…
… when they make no distinction between gold and gold receivables
GATA estimates short position at 10–15k tonnes…
22
CHEUVREUX UNITED KINGDOM
Metals & Mining Sector
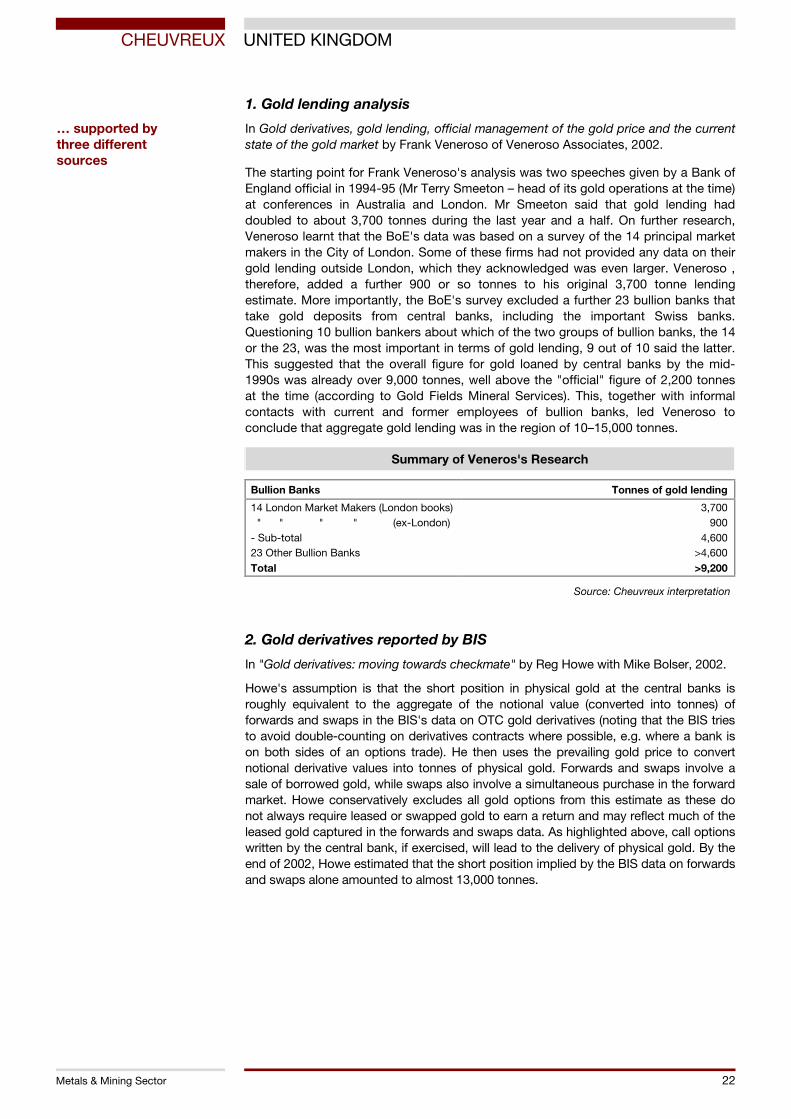
1. Gold lending analysis
In Gold derivatives, gold lending, official management of the gold price and the current state of the gold market by Frank Veneroso of Veneroso Associates, 2002.
The starting point for Frank Veneroso's analysis was two speeches given by a Bank of England official in 1994-95 (Mr Terry Smeeton – head of its gold operations at the time) at conferences in Australia and London. Mr Smeeton said that gold lending had doubled to about 3,700 tonnes during the last year and a half. On further research, Veneroso learnt that the BoE's data was based on a survey of the 14 principal market makers in the City of London. Some of these firms had not provided any data on their gold lending outside London, which they acknowledged was even larger. Veneroso , therefore, added a further 900 or so tonnes to his original 3,700 tonne lending estimate. More importantly, the BoE's survey excluded a further 23 bullion banks that take gold deposits from central banks, including the important Swiss banks. Questioning 10 bullion bankers about which of the two groups of bullion banks, the 14 or the 23, was the most important in terms of gold lending, 9 out of 10 said the latter. This suggested that the overall figure for gold loaned by central banks by the mid-1990s was already over 9,000 tonnes, well above the "official" figure of 2,200 tonnes at the time (according to Gold Fields Mineral Services). This, together with informal contacts with current and former employees of bullion banks, led Veneroso to conclude that aggregate gold lending was in the region of 10–15,000 tonnes.
Summary of Veneros's Research
Bullion Banks Tonnes of gold lending
14 London Market Makers (London books) 3,700 " " " " (ex-London) 900 - Sub-total 4,600 23 Other Bullion Banks >4,600 Total >9,200
Source: Cheuvreux interpretation
2. Gold derivatives reported by BIS
In "Gold derivatives: moving towards checkmate" by Reg Howe with Mike Bolser, 2002.
Howe's assumption is that the short position in physical gold at the central banks is roughly equivalent to the aggregate of the notional value (converted into tonnes) of forwards and swaps in the BIS's data on OTC gold derivatives (noting that the BIS tries to avoid double-counting on derivatives contracts where possible, e.g. where a bank is on both sides of an options trade). He then uses the prevailing gold price to convert notional derivative values into tonnes of physical gold. Forwards and swaps involve a sale of borrowed gold, while swaps also involve a simultaneous purchase in the forward market. Howe conservatively excludes all gold options from this estimate as these do not always require leased or swapped gold to earn a return and may reflect much of the leased gold captured in the forwards and swaps data. As highlighted above, call options written by the central bank, if exercised, will lead to the delivery of physical gold. By the end of 2002, Howe estimated that the short position implied by the BIS data on forwards and swaps alone amounted to almost 13,000 tonnes.
… supported by three different sources

23
CHEUVREUX UNITED KINGDOM
Metals & Mining Sector
3. Gold dishoarding and imports/exports
In More Proof by James Turk, April 2003.
Turk uses the publicly available data on dishoarding provided by the Federal Reserve Bank of New York (FRBNY) and import/export data on gold entering and leaving the UK. He calculates that from 1991-2002, over 7,000 tonnes of gold were dishoarded from the UK and FRBNY. The rest of his argument is less quantitative, requiring a major assumptions on the activities of other central banks. While London and New York are the centres for pricing gold, they are only secondary centres for the physical gold market along with Frankfurt, Hong Kong, Perth and others. The physical market in gold, and consequently gold lending activity, is dominated by Zurich. Turk believes that if around 7,000 tonnes of gold were dishoarded from the UK/FRBNY, it is not unreasonable to assume that an equal amount was mobilised from Zurich (given its dominant position) and other centres although there is no evidence for this. Once again, this would give an overall figure in the region of 15,000 tonnes. One startling statistic is that in 1997, exports of gold from the UK amounted to 2,473 tonnes, i.e. roughly equivalent to all the gold production on the planet that year. This makes the 415 tonne sale announced by the Bank of England in 1999 seem small by comparison.
The three analytical pieces summarised above were published during 2001-03. The question is what is likely to have happened to the short position in physical gold since then. Unfortunately, the Bank of England has not given any update on its estimates of gold lending so updating Frank Veneroso's analysis is difficult. We have also been unable to find recent data on UK gold exports. However, the BIS continues to publish information on OTC gold derivatives so Reg Howe's work can be updated and we have used it as the basis for making our own estimate for the size of the short position in the gold market.
The BIS publishes semi-annual data for commercial banks in the G-10 and triennial data from a broader survey covering banks in about 50 countries. The most recent semi-annual data was for end-June 2005 and the most recent triennial survey was for end-June 2004. The following chart shows the trend in tonnes of gold relating to forwards/swaps, options and the total gold derivatives market.
OTC gold derivatives 1998-2005 (tonnes of gold)
0
5 000
10 000
15 000
20 000
25 000
30 000
35 000
12/98 06/99 12/99 06/00 12/00 06/01 12/01 06/02 12/02 06/03 12/03 06/04 12/04 06/05
Triennial Semi - Total Semi - Options Semi - Fwds/Swaps
Source: BISTriennial and Semi-annual OTC derivatives surveys
24
CHEUVREUX UNITED KINGDOM
Metals & Mining Sector
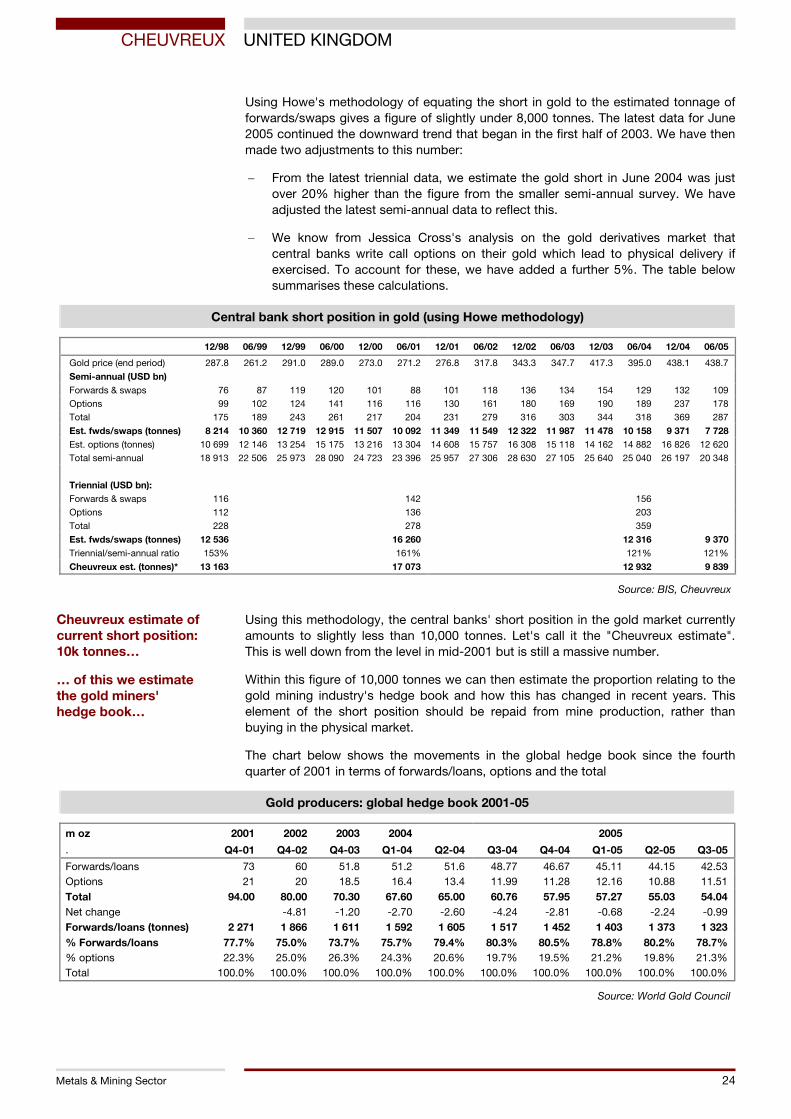
Using Howe's methodology of equating the short in gold to the estimated tonnage of forwards/swaps gives a figure of slightly under 8,000 tonnes. The latest data for June 2005 continued the downward trend that began in the first half of 2003. We have then made two adjustments to this number:
− From the latest triennial data, we estimate the gold short in June 2004 was just over 20% higher than the figure from the smaller semi-annual survey. We have adjusted the latest semi-annual data to reflect this.
− We know from Jessica Cross's analysis on the gold derivatives market that central banks write call options on their gold which lead to physical delivery if exercised. To account for these, we have added a further 5%. The table below summarises these calculations.
Central bank short position in gold (using Howe methodology)
12/98 06/99 12/99 06/00 12/00 06/01 12/01 06/02 12/02 06/03 12/03 06/04 12/04 06/05
Gold price (end period) 287.8 261.2 291.0 289.0 273.0 271.2 276.8 317.8 343.3 347.7 417.3 395.0 438.1 438.7
Semi-annual (USD bn)
Forwards & swaps 76 87 119 120 101 88 101 118 136 134 154 129 132 109 Options 99 102 124 141 116 116 130 161 180 169 190 189 237 178 Total 175 189 243 261 217 204 231 279 316 303 344 318 369 287
Est. fwds/swaps (tonnes) 8 214 10 360 12 719 12 915 11 507 10 092 11 349 11 549 12 322 11 987 11 478 10 158 9 371 7 728 Est. options (tonnes) 10 699 12 146 13 254 15 175 13 216 13 304 14 608 15 757 16 308 15 118 14 162 14 882 16 826 12 620 Total semi-annual 18 913 22 506 25 973 28 090 24 723 23 396 25 957 27 306 28 630 27 105 25 640 25 040 26 197 20 348
Triennial (USD bn):
Forwards & swaps 116 142 156 Options 112 136 203 Total 228 278 359
Est. fwds/swaps (tonnes) 12 536 16 260 12 316 9 370 Triennial/semi-annual ratio 153% 161% 121% 121%
Cheuvreux est. (tonnes)* 13 163 17 073 12 932 9 839
Source: BIS, Cheuvreux
Using this methodology, the central banks' short position in the gold market currently amounts to slightly less than 10,000 tonnes. Let's call it the "Cheuvreux estimate". This is well down from the level in mid-2001 but is still a massive number.
Within this figure of 10,000 tonnes we can then estimate the proportion relating to the gold mining industry's hedge book and how this has changed in recent years. This element of the short position should be repaid from mine production, rather than buying in the physical market.
The chart below shows the movements in the global hedge book since the fourth quarter of 2001 in terms of forwards/loans, options and the total
Gold producers: global hedge book 2001-05
m oz 2001 2002 2003 2004 2005
. Q4-01 Q4-02 Q4-03 Q1-04 Q2-04 Q3-04 Q4-04 Q1-05 Q2-05 Q3-05
Forwards/loans 73 60 51.8 51.2 51.6 48.77 46.67 45.11 44.15 42.53 Options 21 20 18.5 16.4 13.4 11.99 11.28 12.16 10.88 11.51 Total 94.00 80.00 70.30 67.60 65.00 60.76 57.95 57.27 55.03 54.04 Net change -4.81 -1.20 -2.70 -2.60 -4.24 -2.81 -0.68 -2.24 -0.99 Forwards/loans (tonnes) 2 271 1 866 1 611 1 592 1 605 1 517 1 452 1 403 1 373 1 323 % Forwards/loans 77.7% 75.0% 73.7% 75.7% 79.4% 80.3% 80.5% 78.8% 80.2% 78.7% % options 22.3% 25.0% 26.3% 24.3% 20.6% 19.7% 19.5% 21.2% 19.8% 21.3% Total 100.0% 100.0% 100.0% 100.0% 100.0% 100.0% 100.0% 100.0% 100.0% 100.0%
Source: World Gold Council
Cheuvreux estimate of current short position: 10k tonnes…
… of this we estimate the gold miners' hedge book…
25
CHEUVREUX UNITED KINGDOM
Metals & Mining Sector
The total notional interest in tonnes has declined by 43% since the end of 2001. Focusing on the forwards/loans category (like Reg Howe), we estimate that the hedge book has fallen from 2,271 tonnes to 1,323 tonnes, a 42% decline.
Our conclusion is that, based solely on the BIS data, the central banks' short position in gold is around 10,000 tonnes, of which only 1,300-1,400 tonnes relates to producer hedge books. This 10,000 tonne short position equates to nearly one third of reported central bank holdings.
However, there is a further and very important complication. This is easily illustrated by looking at the period from end-June 2004 to end-June 2005. Using the more conservative semi-annual BIS data on forwards/swaps, the central banks' short position declined by 2,430 tonnes during mid-2004 to mid-2005. During the same period, the global hedge book, based on forwards/loans, declined by 232 tonnes.
The magnitude of the reduction in the producers' hedge book should lead to mined gold being delivered back to the bullion banks and, hence, to the central banks. The difference between the decline in the overall short position and the decline in the producers' hedge book should represent actual purchases in the physical gold market to reduce the overall short. Using the BIS's semi-annual data on forwards/swaps, the reduction in the central banks' short position through covering in the physical market was 2,198 tonnes (the difference between 2,430 and 232 tonnes). Let's further assume that all of the "official" central bank sales under the current Washington Agreement, a maximum of 500 tonnes per annum, were just swapped between central banks rather than hitting the market, this still leaves about 1,700 tonnes.
This is an enormous number, representing about 50% of the World Gold Council estimate of the global supply and demand balance. Now the World Gold Council's statistics understate the true level of supply and demand but this just doesn't make any sense. The conclusion is that the unwinding of some of these transactions is being done without the delivery of physical bullion. As Reg Howe commented when asked for help in clarifying our calculations on this issue:
"Although the terms of the original transactions almost certainly contemplated repayment in (physical gold), my guess is that under the prevailing circumstances most of the reductions reflect cash settlements, thus converting the original loan, deposit or swap into a sale and obviating the need for the short to go long in the physical market to close the transaction".
Does this matter? The answer is yes. It means further distortion of the gold market and that, in some cases, the central banks are giving up any hope of getting the gold back. While it may somewhat reduce the amount of short covering driving the gold price, this should be overwhelmed by investment demand for gold and the structural supply deficit (both discussed below). Furthermore, while paper currencies are no longer directly linked to gold, the amount of gold (being the ultimate store of value) backing paper currencies is further reduced.
Given the evidence that reductions in the central banks' short position apparent from the derivatives market is not being reduced by physical delivery, the true level of the short position (or gold that central banks say they have but don't) is obviously higher than suggested by the analysis of the BIS data above. The "Cheuvreux estimate" of almost 10,000 tonnes based on the BIS data is, therefore, likely to be too low. Given the analysis of the changes between end-June 2004 and end-June 2005 above, the real position is likely to be some thousands of tonnes higher.
Our conclusion is, therefore, that the estimate of 10,000-15,000 tonnes is broadly correct.
… relates to 1.3–1.4k tonnes
Difference between decline in short position and decline in producers' hedgebook… … represents actual purchases of gold…
… and some transactions must be going through without physical gold changing hands…
… distorting the market further
Short position must be greater than BIS suggests…
… 10–15k estimate looks about right

26
CHEUVREUX UNITED KINGDOM
Metals & Mining Sector
Further confirmation is provided by the Bank for International Settlements. Despite the "sleight of hand" advocated by the IMF for central bank accounting, the Bank for International Settlements (BIS - the central bank for central banks) does separately identify gold in the vaults from "gold deposits" that have been loaned out.
The BIS has its own gold reserves and also holds gold on behalf of other central banks. The separate identification of gold and gold deposits relates to the aggregate of these gold reserves. Roughly speaking, the BIS's own gold accounts for 20% (about 190 tonnes) of the total. The table below shows the percentage of BIS gold on deposit since 1996 (the BIS has a March year-end).
Bank for International Settlements: Gold lending 1996-2005
March year-end 1996 1997 1998 1999 2000 2001 2002 2003 2004 2005
Gold bars % 87.3% 78.8% 73.0% 72.2% 64.6% 62.3% 59.5% 60.1% 60.2% 60.0% Gold deposits % 12.7% 21.2% 27.0% 27.8% 35.4% 37.7% 40.5% 39.9% 39.8% 40.0%
Source: BIS annual reports
The percentage of BIS gold on "deposit" is exactly in line with the GATA claim that between one third and one half of central bank hold has been loaned out. There are only two other central banks which separately identify gold in their vaults and gold out on loan, the Swiss National Bank and the Bank of Portugal. The prudent Swiss had approximately 10% of its gold on loan at the end of 2004 while the Portuguese had 30%.
"Official" statistics on the gold market At this point, it is worth examining the World Gold Council's (WGC) "official" estimates for supply and demand in the gold market. These are summarised in the table below with supply shown both before and after the publicly announced sales by central banks.
World gold supply and demand: 2002- September 2005
(tonnes) 2002 2003 2004 9M05
Supply: Mine production 2 589 2 593 2 461 1 842 Net producer hedging -412 -270 -427 -123 Total mine supply 2 177 2 323 2 035 1 719 Gold scrap 835 939 829 608 Supply before official sales 3 012 3 262 2 864 2 327 Total demand 3 365 3 191 3 498 2 874 -5.2% 9.6% 14.9% Supply shortfall -353 71 -634 -547 Official sector sales 545 617 475 489 Balance 192 688 -159 -58
Source: World Gold Council
There are a number of points arising from this table:
− Even using the WGC's estimate of official sales, there is a substantial deficit between "supply before central bank sales" and demand in most years, e.g. 353 tonnes and 634 tonnes in 2002 and 2004, respectively. In the first nine months of 2005, the shortfall is running at 547 tonnes, or an annualised rate of 729 tonnes (despite a sharp reduction in producer dehedging last year).
Support for GATA claim that 33–50% of central bank hold has been loaned out

27
CHEUVREUX UNITED KINGDOM
Metals & Mining Sector
− While central bank gold sales are ongoing, they are ultimately finite. The existing Washington Agreement between European Central Banks for 500 tonnes per year ends in 2009. It is possible that the higher the gold price rises, the more public opinion could turn against further sales in European countries. This would only exaggerate the supply deficit.
− Central bank sales in the WGC statistics are confined to those under the Washington Agreements and other publicly announced sales by central banks. They do not contain the non-publicised, or covert, gold sales from central bank leasing activity outside of that related to producer hedging. If we can estimate the level of "unofficial" selling by central banks, we may be able to get a better picture of the "true" supply deficit.
In 1995, when the suppression of the gold price may have begun, the global producer hedgebook was approximately 2,000 tonnes. It may be possible to add another (say) 1,000 tonnes for gold borrowed by the world jewellery industry to help manage its inventory, making a total of 3,000 tonnes of gold borrowed from central banks for "legitimate" reasons by the end of 1995. If we conservatively assume that the central banks' short position was 10,000 tonnes by the end of 2005, the WGC statistics have underestimated demand by an average of 700 tonnes per annum during the last 10 years. This means that before any "official" central bank selling (currently about 600 tonnes per annum), the annual shortfall in supply could now be running as high as 1,300 tonnes.
Furthermore, this shortfall developed at a time when investment demand for physical gold, especially in the West, has been low. This is now changing. Although WGC demand estimates understate reality in absolute terms, recent levels of demand growth for gold are impressive. According to the WGC, global gold demand increased by 9.5% in 2004 and surged 14.9% in 9M05 due to strong jewellery demand in India and China and higher levels of gold investment. Jewellery demand in India has risen 37% in 9M05 versus the corresponding period in 2004. India accounted for 20% of the world market for gold jewellery in 2004. Gold investment has surged in 2005, rising by 62% in 9M05. The following table shows the breakdown of world gold demand since 2002:
Breakdown of world gold demand 2002-September 2005
(tonnes) 2002 2003 2004 9M05
Fabrication: Jewellery 2 667 2 481 2 613 2 129 Industrial & Dental 356 379 409 316 Subtotal fabrication 3 023 2 860 3 022 2 444 Net retail investment 339 292 342 305 ETFs 3 39 133 125 Total demand 3 365 3 191 3 498 2 874 % Chg -5.2% 9.6% 14.9%
Source: World Gold Council
The level of investment demand shown above relates to private and institutional money. Ironically, in contrast to the trends of recent years, a much bigger source of near-term investment demand for gold could come from central banks themselves, especially those outside North America and Western Europe.
We believe several central banks are already beginning to accumulate gold, one of which is certainly Russia. There is a strong possibility that central banks in Asia and the Middle East will become net accumulators of gold reserves as they diversify their growing foreign exchange reserves away from US dollars.
Central bank sales continue, but not indefinitely
Estimate of "unofficial" sales could point to level of supply deficit…
… which we believe could be around 1.3k tonnes/year
Demand growth strong
Central banks: source of near-term investment demand for gold?

28
CHEUVREUX UNITED KINGDOM
Metals & Mining Sector
Looking at the official statistics for central bank gold holdings, most of the big creditor nations to the US, like Japan and several other Asian economies, and the big natural resource producers, like Russia and Saudi Arabia, have generally maintained their gold holdings relatively constant in recent years. China is the exception and has significantly increased its gold reserves since 2000. However, as the last column in the table below shows, all of these nations (including China) have very limited gold holdings as a percentage of total foreign exchange reserves.
US creditors & natural resource holders: official gold holdings
Country 1990 1995 2000 2005 Gold as % reserves
1. Japan 754 754 765 765 1% 2. China 395 395 395 600 1% 3. Taiwan 421 422 422 423 2% 4. Russia n/a 293 384 387 4% 5. India 333 398 358 358 4% 6. Saudi Arabia 143 143 143 143 7% 7. Singapore 0 0 0 127 2% 8. Indonesia 97 97 97 96 4% 9. Thailand 77 77 74 84 2%
10. Kuwait 79 79 79 79 12% 11. Malaysia 73 74 36 36 1% 12. Korea 10 10 14 14 0% 13. Brazil 142 142 59 14 0% 14. Chile 58 58 2 0 0%
Source: World Gold Council
To put the situation in context, the seven leading Asian nations held USD2,300bn of reserves at the end of 2004, equivalent to 10 times those of the G7 nations. China's foreign exchange reserves increased by nearly USD200bn to almost USD800bn in 2005.
As shown on page 12, Western countries like the US, Germany, France, Netherlands, etc, have at least 50% of their reserves in gold according to the official figures anyway. Spain has over 40% and Switzerland over 30%. The UK has only 9%, but still far more than the major US creditors and natural resource holders. Indeed, the global average is 9%. Any sudden readjustment of even a small part of these reserves away from the US dollar and into gold by these nations could have a major impact on the gold price. It is also worth remembering that as central banks battled unsuccessfully to support the US dollar in 1968, the London Gold Pool lost 400 tonnes of gold in just one day.
In November 2005, the Russian central bank announced its intention to double its gold reserves and this plan was subsequently endorsed by President Putin. Interfax reported him saying:
"I support the proposal that the Central Bank pay greater attention to precious metals in forming our gold and foreign exchange reserves".
The Russian News and Information Agency reported that first deputy chairman of the Central Bank of Russia, Alexei Ulyukayev, said that the bank would be:
"…buying gold on all markets on which it is available…"
We also believe that there is a strong possibility that China is increasing its gold reserves. A statement by the State Administration of Foreign Exchange (SAFE) outlined its objective:
"…to improve the currency structure and asset structure of our foreign exchange reserves, and to continue to expand the investment area of our reserves".
Gold reserves average 9% globally
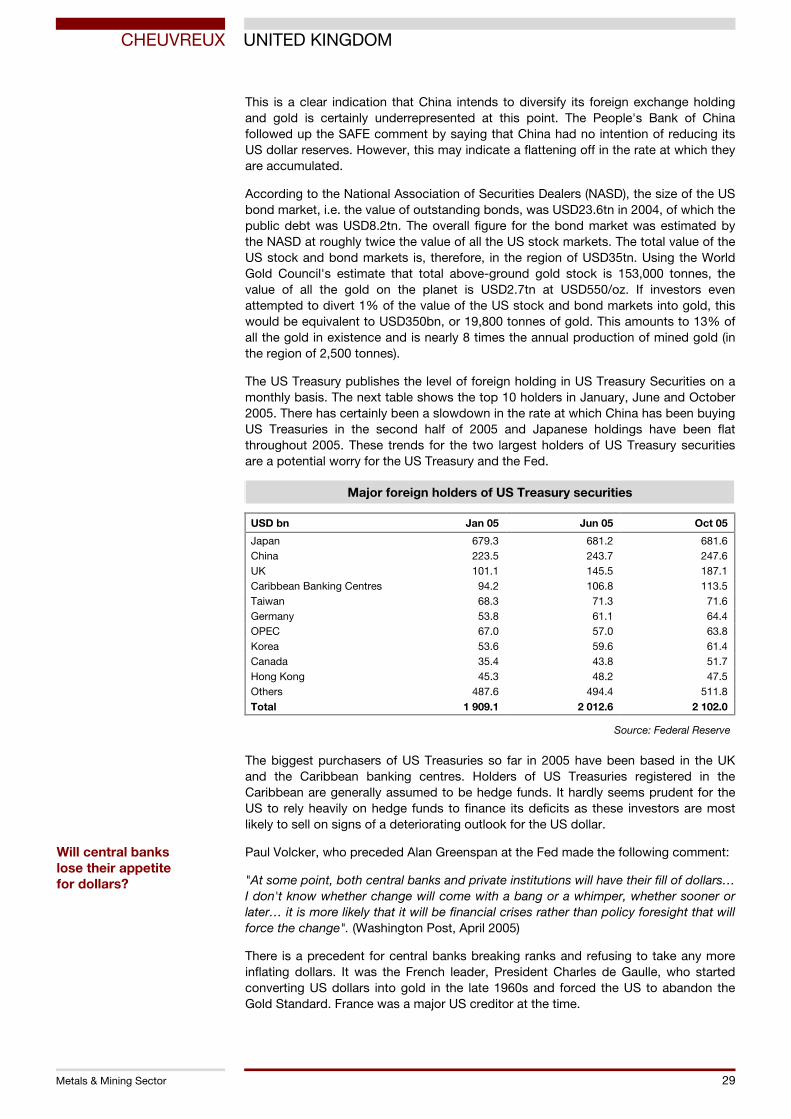
29
CHEUVREUX UNITED KINGDOM
Metals & Mining Sector
This is a clear indication that China intends to diversify its foreign exchange holding and gold is certainly underrepresented at this point. The People's Bank of China followed up the SAFE comment by saying that China had no intention of reducing its US dollar reserves. However, this may indicate a flattening off in the rate at which they are accumulated.
According to the National Association of Securities Dealers (NASD), the size of the US bond market, i.e. the value of outstanding bonds, was USD23.6tn in 2004, of which the public debt was USD8.2tn. The overall figure for the bond market was estimated by the NASD at roughly twice the value of all the US stock markets. The total value of the US stock and bond markets is, therefore, in the region of USD35tn. Using the World Gold Council's estimate that total above-ground gold stock is 153,000 tonnes, the value of all the gold on the planet is USD2.7tn at USD550/oz. If investors even attempted to divert 1% of the value of the US stock and bond markets into gold, this would be equivalent to USD350bn, or 19,800 tonnes of gold. This amounts to 13% of all the gold in existence and is nearly 8 times the annual production of mined gold (in the region of 2,500 tonnes).
The US Treasury publishes the level of foreign holding in US Treasury Securities on a monthly basis. The next table shows the top 10 holders in January, June and October 2005. There has certainly been a slowdown in the rate at which China has been buying US Treasuries in the second half of 2005 and Japanese holdings have been flat throughout 2005. These trends for the two largest holders of US Treasury securities are a potential worry for the US Treasury and the Fed.
Major foreign holders of US Treasury securities
USD bn Jan 05 Jun 05 Oct 05
Japan 679.3 681.2 681.6 China 223.5 243.7 247.6 UK 101.1 145.5 187.1 Caribbean Banking Centres 94.2 106.8 113.5 Taiwan 68.3 71.3 71.6 Germany 53.8 61.1 64.4 OPEC 67.0 57.0 63.8 Korea 53.6 59.6 61.4 Canada 35.4 43.8 51.7 Hong Kong 45.3 48.2 47.5 Others 487.6 494.4 511.8 Total 1 909.1 2 012.6 2 102.0
Source: Federal Reserve
The biggest purchasers of US Treasuries so far in 2005 have been based in the UK and the Caribbean banking centres. Holders of US Treasuries registered in the Caribbean are generally assumed to be hedge funds. It hardly seems prudent for the US to rely heavily on hedge funds to finance its deficits as these investors are most likely to sell on signs of a deteriorating outlook for the US dollar.
Paul Volcker, who preceded Alan Greenspan at the Fed made the following comment:
"At some point, both central banks and private institutions will have their fill of dollars… I don't know whether change will come with a bang or a whimper, whether sooner or later… it is more likely that it will be financial crises rather than policy foresight that will force the change". (Washington Post, April 2005)
There is a precedent for central banks breaking ranks and refusing to take any more inflating dollars. It was the French leader, President Charles de Gaulle, who started converting US dollars into gold in the late 1960s and forced the US to abandon the Gold Standard. France was a major US creditor at the time.
Will central banks lose their appetite for dollars?

30
CHEUVREUX UNITED KINGDOM
Metals & Mining Sector
Gold mining industry If, as we predict, there is a sustained wave of gold investment buying, the upward pressure on the gold price will be exacerbated by the inability of the gold mining industry to respond with higher production. The WGC estimates that mine production has been essentially flat since the end of the 1990s and fell by 5% in 2004 as shown in the following chart.
Gold: world production 1992-2005E (m oz)
20
30
40
50
60
70
80
90
1992 1993 1994 1995 1996 1997 1998 1999 2000 2001 2002 2003 2004 2005E
mil
lio
ns o
z.
Source: World Gold Council, Cheuvreux
For the foreseeable future, there seems little chance that this situation will change very much. Newmont sees gold production "slightly down in 2005" and, in a recent presentation, Barrick recently noted "mine production flat to declining" as one of the key industry challenges in the years ahead. Overall, the consensus is for a generally flat production profile for several years.
The following chart shows the production trend for the five largest gold producers during 1999-2004. Gold mined by these five producers amounted to just over 800 tonnes in 2004, almost one-third of the world total. These are the "elite" in the gold mining industry, yet for most of them the recent production record is unimpressive. Two of these miners, AngloGold Ashanti and Barrick, have suffered production declines in the period 2000-04 and Newmont has suffered a decline during 2002-04. Only Placer Dome and Gold Fields Ltd. have seen a meaningful increase during the period, and even they have seen temporary declines in some years.
Miners cannot boost production to meet any upswing in demand
Gold production "flat to declining"

31
CHEUVREUX UNITED KINGDOM
Metals & Mining Sector
Top 5 gold miners: production trend 1999-2004 (m oz)
0
1000
2000
3000
4000
5000
6000
7000
8000
1999 2000 2001 2002 2003 2004
AGA Barrick Newmont Placer D. Gold Fields
Source: Company accounts
Gold reserves are coming under pressure as existing gold mines mature, ore grades decline and gold miners find it increasingly difficult to replace production with new discoveries. Looking at published reserve lives of the gold miners can be misleading. In Barrick's case, for example, its reserve life has increased due to production falling more rapidly than reserves have risen. In the period 2001-04, Barrick's production fell by 19%, easily outstripping growth in proved and probable reserves of 8%. As a consequence the reported reserve life rose from 13.4 years to 18.0 years during these three years. To get a clearer idea of the trend in reserve lives for leading gold miners during 1999-04, we have compared reported 2004 proved and probable reserves with the highest level of gold production since 1999.
Top 5 gold miners: reserve life in 1999 and 2004
Reserve life in years 1999 2004
Newmont 11.4 12.1 AngloGold Ashanti 15.4 10.9 Barrick 10.2 14.5 Placer Dome 20.9 15.5 Gold Fields Ltd. 23.0 17.4
Source: Company accounts
In an interview, President of Newmont Mining, Pierre Lassonde, explained that new technologies developed in the 1980s (especially heap leaching) made previously uneconomic gold deposits viable, leading to a period of higher production. In the last twenty years, however, there has been no such new technological development. Lassonde argues that for most of the 1990s, there were between 3-5 greenfield discoveries with over 5m oz of gold each year. In the last seven years, however, he could only name two.
Besides the lack of technological development, the other issue holding back world gold production has been the low level of exploration spend since the late-1990s. The weakness in the gold price during the late 1990s/early 2000s led to a sharp cutback on exploration budgets. The trend in AngloGold Ashanti's spend on exploration since 1999 is typical for the industry:
Production held back by recent lack of technological development…
… and low exploration spend

32
CHEUVREUX UNITED KINGDOM
Metals & Mining Sector
AngloGold Ashanti exploration spend 1999-2005E (USD m)
0
10
20
30
40
50
60
70
80
90
1999 2000 2001 2002 2003 2004 2005E
Source: AngloGold Ashanti
Ironically, those parties who sought to suppress the gold price sowed the seeds of the industry's current inability to respond to increased demand. Pierre Lassonde highlighted this:
"…when exploration has been sharply cut it takes at least 7-8 years for a rise in price to generate not just exploration but the subsequent exploitation of the results, let alone sufficient new output to compensate in addition for the exhaustion of existing mines."
The long lead times in gold mining mean that as long as demand for gold remains firm, there is no quick fix to the supply deficit apart from a higher price.
Long mining lead times…
… mean no quick fix

33
CHEUVREUX UNITED KINGDOM
Metals & Mining Sector
V— GOLD VERSUS THE US DOLLAR: ONLY ONE WINNER
History tells us gold, not paper, is "real money" Strategically, gold is one of the two most important commodities on the planet along with crude oil. Money is vital to society since without it, commerce and trade on a large scale are almost impossible. Gold, rather than paper currency, is the ultimate store of value and method of payment. Without delving too deeply into this subject, gold is unique in being able to perform this role for the following reasons:
− It is durable, homogenous and divisible.
− Gold's rarity gives it intrinsic value and that value is high per unit of volume.
− Its value is recognised across the globe and is traded in a continuous market.
− Gold plays little role in economic growth and is produced for accumulation not consumption.
− Annual gold production only adds about 2% per annum on average to theoretical supply, amounting to all that remains above ground. With other commodities, short-term volatility in supply or demand cannot be easily accommodated.
− Gold is the only form of money that cannot be debased (unless the gold market is rigged) by the same authorities who print paper currency. Indeed, at times a rising gold price acts as a measure of currency debasement.
− Gold is the only financial medium of exchange that is not someone else's liability.
Most participants in the financial markets and the general public seem to have forgotten gold's role as the ultimate form of money. To them, it is probably just the "barbarous relic" to use the words of Keynes. There are perhaps four reasons for this:
− The Gold Standard, in its latter manifestation as the Bretton Woods system, ended in 1971. While it was in operation, major world currencies were linked to the USD which, in turn, was guaranteed by the US Government to be convertible into gold at USD35/oz.
− The prolonged bear market in gold that lasted 20 years after the price hit an all-time high of USD850/oz in 1980.
− Persistent disinvestment by central banks in recent years mainly in the form of publicly announced sales by European central banks.
− The suppression of the gold price since the mid-1990s by the US monetary authorities and others.
For someone who started work aged 21 to remember the 1980 peak in the gold price during their professional career, they need to be at least 46 years old. To remember the Gold Standard, they need to be at least 55 years old. The vast majority of people currently working in the financial sector, even in senior positions, are younger than this.
The issues cited above led to the a general perception that gold has become "just another commodity" during the last 20-30 years and its traditional role as a store of financial value has diminished.
Most people do not even stop to think that today's fully-floating fiat currency system only arose from the US Government's default on its guarantee to convert its currency into gold because the market devalued the US dollar. History shows that fiat currencies fail.
Gold: ultimate store of value and method of payment…
… a role that appears to have been forgotten by some
Most people in finance too young to remember gold standard, or even last gold price peak…
… and tend to view gold as "another commodity"
History shows that fiat currencies eventually fail
34
CHEUVREUX UNITED KINGDOM
Metals & Mining Sector
It is true that in today's system, central banks do not guarantee convertibility of fiat currency into gold and almost no economic transactions are settled in gold. In a world of financial stability and fiscal prudence, gold's monetary role retreats into the background, but even then it never goes away. Of course, the world's monetary authorities would rather you believe it had, so you remain happy with their inflating paper (i.e. subject to excessive supply growth).
Just like conventional paper money, gold has its own exchange rate versus other currencies, i.e. its price in US dollars. It also has its own interest rate, i.e. the "gold lease rate". The latter is the rate of interest charged (usually by central banks) for lending gold to third parties. Typically the gold lease rate is very low, e.g. 1-2%, or even much less as it is currently. In times of financial crisis, gold is the soundest money and cannot be debased, so it makes sense that it (almost always) has a lower interest rate than any other currency.
Currencies with lower interest rates are always in contango (i.e. future prices are higher than the spot price) against those with higher interest rates. Since gold has the lowest interest rate and (as with currencies) there is basically no immediate concern regarding future supply, the gold market is almost always in contango. With regard to available gold supply, most of the gold ever produced is still in existence today and is, therefore, still theoretically available as supply. This is obviously a simplification because, unlike paper currencies, the supply of gold is finite. The World Gold Council estimates that the quantity of above-ground gold stocks at the end of 2004 was approximately 153,000 tonnes. If the gold price was in backwardation and there were no liquidity concerns, any trader could sell gold on the spot market, put the proceeds on deposit, and be sure of buying it back at a lower price in the future. With other commodities like copper and oil, uncertainty about future supply means that the price is generally in backwardation.
It is worth highlighting some quotes from well-respected people on the subject of gold as money:
The French President, Charles de Gaulle described gold as
"…the unalterable fiduciary value par excellence."
De Gaulle was instrumental in breaking the Bretton Woods system by betting that gold was sounder money than an inflating US dollar during the Vietnam War and he was proved right. In fact the French seem to have a particular affinity for gold and were hoarding it in the run-up to the Great Depression of the 1930s.
J.P Morgan was quoted as saying about gold
"Gold is money. That's it".
Alan Greenspan, in justifying the US's decision to continue holding gold reserves, said in 1999:
"Gold still represents the ultimate form of payment in the world. Germany in 1944 could buy materials during the war only with gold. Fiat money in extremis is accepted by nobody. Gold is always accepted."
The monetary history of the twentieth century contains several attempts by major industrialised nations to adopt and then adhere to a Gold Standard, i.e. guaranteeing that their currencies are convertible into gold and that money supply growth is backed by gold. The period of the "Classical Gold Standard" is considered to be 1815-1914. The massive cost of the First World War eventually forced all nations to come off the Gold Standard as deficit spending inflated their currencies. Readoption for many nations took place in the years following the Versailles Treaty, but once again it was short-lived as the UK abandoned it in 1931 and the US in 1933.
In times of financial stability, gold's monetary role is obscured…
… yet gold has its own exchange rate and interest rate
WGC estimates above-ground gold stocks at 153k tonnes at end-2004
35
CHEUVREUX UNITED KINGDOM
Metals & Mining Sector
A search on the internet will reveal an intriguing essay by Alan Greenspan titled "Gold and Economic Freedom" published in Ayn Rand's 1967 book, Capitalism, the Unknown Ideal. In it he argues in favour of the Gold Standard and against today's fiat currency system:
"As the supply of money (of claims) increases relative to the supply of tangible assets in the economy, prices must eventually rise… In the absence of a gold standard, there is no way to protect savings from confiscation through inflation…"
And:
"Deficit spending is simply a scheme for the confiscation of wealth. Gold stands in the way of this insidious process. It stands as the protector of property rights."
With the Gold Standard, when the banks became fully loaned on the basis of a country's gold reserves, interest rates would rise until new loan demand would be chocked off.
In the essay Greenspan dwells on the "hysterical antagonism toward the gold standard which unites statists", i.e. the political and financial authorities. Greenspan characterises the gold standard and a banking system limited by the level of gold reserves as acting as:
"..the protector of an economy's stability and balanced growth."
Oleg V. Mozhaiskov, Deputy Chairman, Bank of Russia, extolled the benefits of the Gold Standard in a speech to the LBMA in June 2004.
"The obligations on debtor countries to pay off the trade deficits with gold (upon demand of the creditor countries) severely limited the exporter countries' opportunities for trade expansion. The importer countries were made to live within their means, predicated by their gold reserves. Gold was therefore considered… as an instrument guaranteeing order and justice in international economic relations…"
The last attempt to establish at least a "quasi" gold standard was the Bretton Woods system negotiated in 1944. This involved other countries pegging their currencies to the US dollar, which became the world's reserve currency, and maintaining them within +/-1% of parity. Par values could be renegotiated in circumstances of "fundamental disequilibrium" in their balance of payments. To maintain "confidence" in the US dollar, the US agreed to guarantee convertibility of the USD in to gold at USD35/oz to foreign governments. With hindsight, the flaw in Bretton Woods was that it didn't ultimately prevent the US, at the centre of this system, from engaging in deficit spending and creating a huge oversupply of dollars. The demise of the Bretton Woods system is summarised in Appendix 1.
The lesson of history is that, time and time again, fiat currency systems have failed because governments have been unable to sustain the purchasing power of their paper currencies in relation to gold. This does not augur well for the current fiat currency based on the USD as the world's reserve currency with no link to gold whatsoever. The advantages of using a Gold Standard were summarised by Greenspan in a speech on "Issues for Monetary Policy" to the Economic Club of New York.
"Although the gold standard could hardly be portrayed as having produced a period of price tranquillity, it was the case that the price level in 1929 was not much different, on net, from what it had been in 1800. But, in the two decades following the abandonment of the gold standard in 1933, the consumer price index in the United States nearly doubled. And, in the four decades after that, prices quintupled. Monetary policy, unleashed from the constraint of domestic gold convertibility, had allowed a persistent overissuance of money. As recently as a decade ago, central bankers, having witnessed more than a half-century of chronic inflation, appeared to confirm that a fiat currency was inherently subject to excess".
Gold Standard: championed by Greenspan…
.. and the Bank of Russia
Bretton Woods: last attempt at "quasi" gold standard
Doubts over future of USD as world's reserve currency

36
CHEUVREUX UNITED KINGDOM
Metals & Mining Sector
That was in 2002. Less than three years later in July 2005 we hear a very different Greenspan as he tells Congress:
"Would there be any advantage, at this particular stage, in going back to the gold standard? And the answer is: I don't think so, because we are acting as though we were there… So I think central banking, I believe, has learned the dangers of fiat money, and I think, as a consequence of that, we've behaved as though there are, indeed, real reserves underneath the system".
This is ironic given that during Greenspan's 18 years as Chairman of the Federal Reserve, he has presided over the biggest deficit spending and monetary expansion by any government in world history. For example, during Greenspan's tenure, the money supply (M3) has risen from USD3.6tn to USD10.3tn. The four year bull market in the dollar gold price suggests that the market does not believe the Fed has acted as though it is still on the gold standard either. Which Greenspan do you agree with? We prefer the one who favours gold, sound money and the lesson of history on its side. In this vein, George Bernard Shaw said:
"You have to choose between trusting to the natural stability of gold and the natural stability of the honesty and intelligence of members of the government. And with due respect to these gentlemen, I advise you, as long as the capitalist system lasts, to vote for gold".
When shrewd investors and, ultimately, the general populace, identify rampant debasement of a currency, Gresham's Law kicks in: "bad money drives good money out of circulation" and "true" money is hoarded.
What drives the gold price? The value of gold has been subject to intense debate for centuries. Baron von Rothschild commented:
"I only know of two men who really understand the true value of gold – an obscure clerk in the basement vault of the Banque de Paris and one of the directors of the Bank of England. Unfortunately, they disagree".
The research and commentary on the gold price over many years has been filled with the debate about gold's ability to act as a hedge in periods of inflation and deflation. While deflations (outside Japan) are confined to history books as far as most people are concerned, there currently appear to be two main schools thought:
1. Gold is a hedge against inflation
In the minds of many people today, this view is probably based on the simultaneous rise of both the gold price and inflation during the 1970s. Much longer time periods also confirm that gold holds its purchasing power. Since the creation of the Federal Reserve in 1913, the Fed's own inflation calculator (which underestimates the true level of inflation in recent years) shows that the purchasing power of the USD has fallen to one twentieth (5%) of its 1913 level. Over the same period, the gold price has risen by a factor of 26.6 from USD20.67 to USD550.
Greenspan now says we've learned to beware of fiat money…
… though this is not necessarily borne out by recent history

37
CHEUVREUX UNITED KINGDOM
Metals & Mining Sector
Gold price matches CPI 1970-79
GOLDBLN 31/1/06
1970 1971 1972 1973 1974 1975 1976 1977 1978 1979
35
40
45
50
55
60
65
70
75
80
0
50
100
150
200
250
300
350
400
450
500
550
Gold Bullion $/Troy Ounce(R.H.SCALE)
US CPI - ALL URBAN: ALL ITEMS SADJSource: DATASTREAM
Source: Datastream
During the last century, the most extreme example of gold acting as a hedge against inflation was the German hyperinflation in 1923. Germany came off the Gold Standard at the outbreak of the First World War and the costs of the conflict led to a huge debt burden. The Reichsbank subsequently monetised this debt by printing money. As confidence in the mark weakened, the populace hurried to spend the rapidly increasing number of marks in circulation. For a short period, there was an illusion of prosperity. However, inflation became so gargantuan and the purchasing power of the mark so small that the economy collapsed and deflation set in. Only those people who had converted their marks to gold and foreign currencies protected their capital (In November 1923, one ounce of gold was worth USD20 and twenty trillion marks).
2. Gold is a hedge against deflation and a poor short-term hedge against inflation
Supporters of this view often cite the a study entitled The Golden Constant by R.W. Jastram published in 1977. Jastram looked at the experience of England during 1560-1976 and the US from 1800-1976. Over these very long periods, Jastram found that gold prices soared during deflations (deflations and inflations were measured in terms of commodity prices) but lost purchasing power during inflations. However, even Jastram noted that gold maintains its purchasing power over long periods. Furthermore, he observed that in the period 1951-76 in the US, both gold and commodity prices rose by roughly similar amounts.
The discussion above suggests that there have been periods in history when both view points have been correct. What about recent history? Outside Japan, there have been no experiences of deflation in the major industrialised world. Looking at the performance of the gold price from its peak in 1980 until 1995 (before central banks are believed to have suppressed the price) seems to show that gold has not been a good hedge against inflation.

38
CHEUVREUX UNITED KINGDOM
Metals & Mining Sector
Gold price fails to match CPI 1980-2000
GOLDBLN 31/1/06
80 81 82 83 84 85 86 87 88 89 90 91 92 93 94 95 96 97 98 99 00
70
80
90
100
110
120
130
140
150
160
170
180
200
250
300
350
400
450
500
550
600
650
700
Gold Bullion $/Troy Ounce(R.H.SCALE)
US CPI - ALL URBAN: ALL ITEMS SADJSource: DATASTREAM
Source: Datastream
There is also another school of thought that is little known these days outside the world of gold bugs and academic economists:
Gibson's paradox
This is the observation by the economist, J.M. Keynes, that during the period of the Gold Standard, there was a direct correlation between the long-term interest rate (Keynes used the yield on British "Consols") and the general price level. The paradox stemmed from the way it differed from the consensus view that the long-term interest was correlated with the rate of change in prices, i.e. inflation. Under Gibson's Paradox, with a gold standard, a falling price level corresponded with falling real interest rates. With the gold price fixed, the purchasing power of gold is obviously increasing.
The thinking behind Gibson's Paradox can be transferred into today's world of floating gold prices and fiat money. A rising gold price equates to a falling price level (in terms of gold purchasing power) and lower real interest rates. This makes sense as falling real yields make holding financial assets less attractive, while rising real interest rates increase the opportunity cost of holding gold (which has zero or a minimal yield). In simple terms and outside of a Gold Standard, Gibson's Paradox suggests that the gold price rises as the attraction and confidence in financial/paper assets declines. This was neatly outlined by former Fed Governor, Wayne Angell, in the minutes of an FOMC meeting in July 1993 (before price suppression began).
"The price of gold is pretty well determined by us… But the major impact on the price of gold is the opportunity cost of holding the US dollar… We can hold the price of gold very easily; all we have to do is to cause the opportunity cost in terms of interest rates and US Treasury bills to make it unprofitable to own gold".
The following chart shows the relationship between real US interest rates (10-year Treasury yield minus CPI) and the gold price (inverted on the right-hand axis) since the end of Bretton Woods:
Keynes saw direct correlation between LT interest rates and general price levels

39
CHEUVREUX UNITED KINGDOM
Metals & Mining Sector
Gibson's Paradox post-Bretton Woods
FRTCM10-USEBMCPI% 31/1/06
72 74 76 78 80 82 84 86 88 90 92 94 96 98 00 02 04
-6
-4
-2
0
2
4
6
8
10 100
200
300
400
500
600
700
800
900
FRTCM10-USEBMCPI%
Gold Bullion $/Troy Ounce(R.H.SCALE)Source: DATASTREAM
Source: Datastream
We would make several points relating to this chart:
− There is a clear correlation between the general trend of real interest rates and the inverse movement in the gold price (NB after gold ownership became legal again in the US in 1974, sales by the US Treasury initially restrained the price).
− The end of the bull market in gold in 1980, clearly shown in the chart, was triggered by Paul Volcker's (then Fed Chairman) unwavering desire to squeeze inflation out of the system using higher interest rates (echoing Fed Governor Angell's comment).
− The chart shows a clear divergence in the trends for several years beginning in the mid-1990s at the time that GATA alleges the recent suppression of the gold price began.
− Gibson's Paradox is a free market phenomenon. Studies have shown that it was disrupted by government intervention in the gold market after World War 1 and the London Gold Pool in the run-up to the collapse of Bretton Woods. In both of these instances, when government intervention was relaxed, the gold price rose strongly and found its correct market level. Given renewed intervention by governments in the gold market from around 1995, it seems reasonable to expect the same to occur this time.
Our conclusion on what drives the gold market is that the gold price "comes out of hiding" as real yields on financial assets decline and especially as the risk of a financial crisis in terms inflation or deflation rises. As the risk rises, the role of gold as "true" money and a store of value reasserts itself. In essence, gold acts as a barometer of the financial attraction and confidence level of paper money.
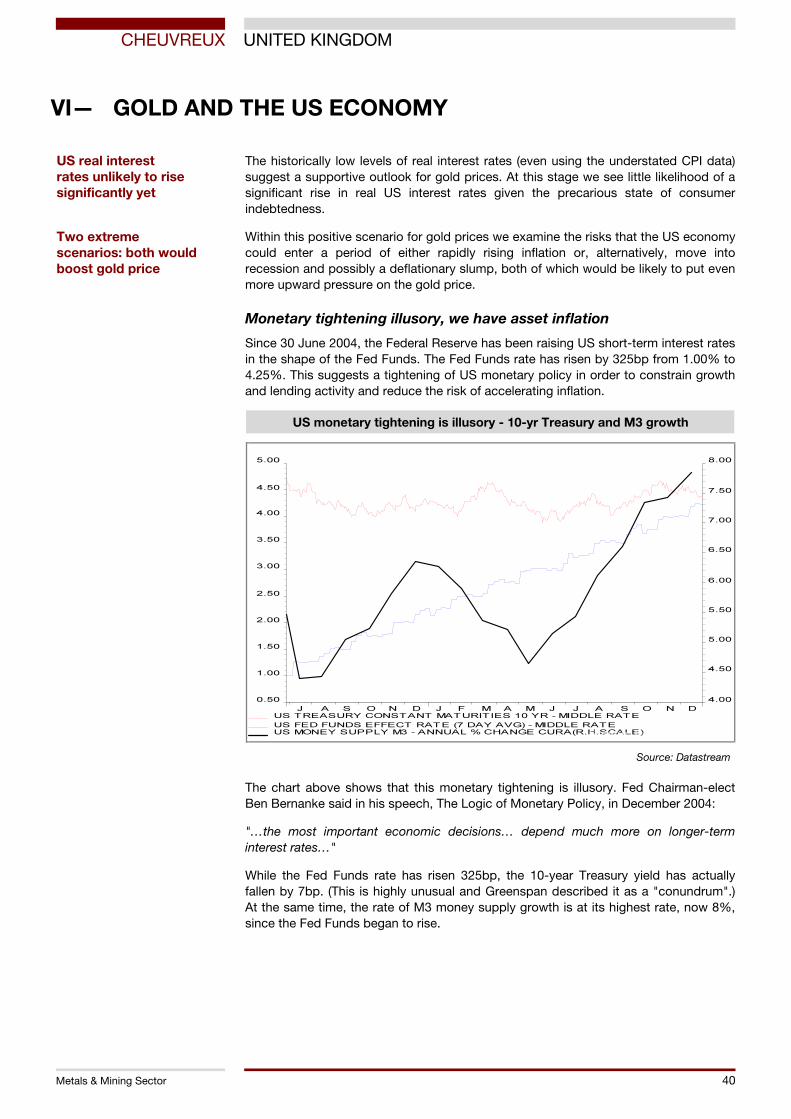
40
CHEUVREUX UNITED KINGDOM
Metals & Mining Sector
VI— GOLD AND THE US ECONOMY
The historically low levels of real interest rates (even using the understated CPI data) suggest a supportive outlook for gold prices. At this stage we see little likelihood of a significant rise in real US interest rates given the precarious state of consumer indebtedness.
Within this positive scenario for gold prices we examine the risks that the US economy could enter a period of either rapidly rising inflation or, alternatively, move into recession and possibly a deflationary slump, both of which would be likely to put even more upward pressure on the gold price.
Monetary tightening illusory, we have asset inflation
Since 30 June 2004, the Federal Reserve has been raising US short-term interest rates in the shape of the Fed Funds. The Fed Funds rate has risen by 325bp from 1.00% to 4.25%. This suggests a tightening of US monetary policy in order to constrain growth and lending activity and reduce the risk of accelerating inflation.
US monetary tightening is illusory - 10-yr Treasury and M3 growth
FRTCM10 25/1/06
J A S O N D J F M A M J J A S O N D
0.50
1.00
1.50
2.00
2.50
3.00
3.50
4.00
4.50
5.00
4.00
4.50
5.00
5.50
6.00
6.50
7.00
7.50
8.00
US TREASURY CONSTANT MATURITIES 10 YR - MIDDLE RATE
US FED FUNDS EFFECT RATE (7 DAY AVG) - MIDDLE RATEUS MONEY SUPPLY M3 - ANNUAL % CHANGE CURA(R.H.SCALE)Source: DATASTREAM
Source: Datastream
The chart above shows that this monetary tightening is illusory. Fed Chairman-elect Ben Bernanke said in his speech, The Logic of Monetary Policy, in December 2004:
"…the most important economic decisions… depend much more on longer-term interest rates…"
While the Fed Funds rate has risen 325bp, the 10-year Treasury yield has actually fallen by 7bp. (This is highly unusual and Greenspan described it as a "conundrum".) At the same time, the rate of M3 money supply growth is at its highest rate, now 8%, since the Fed Funds began to rise.
US real interest rates unlikely to rise significantly yet
Two extreme scenarios: both would boost gold price
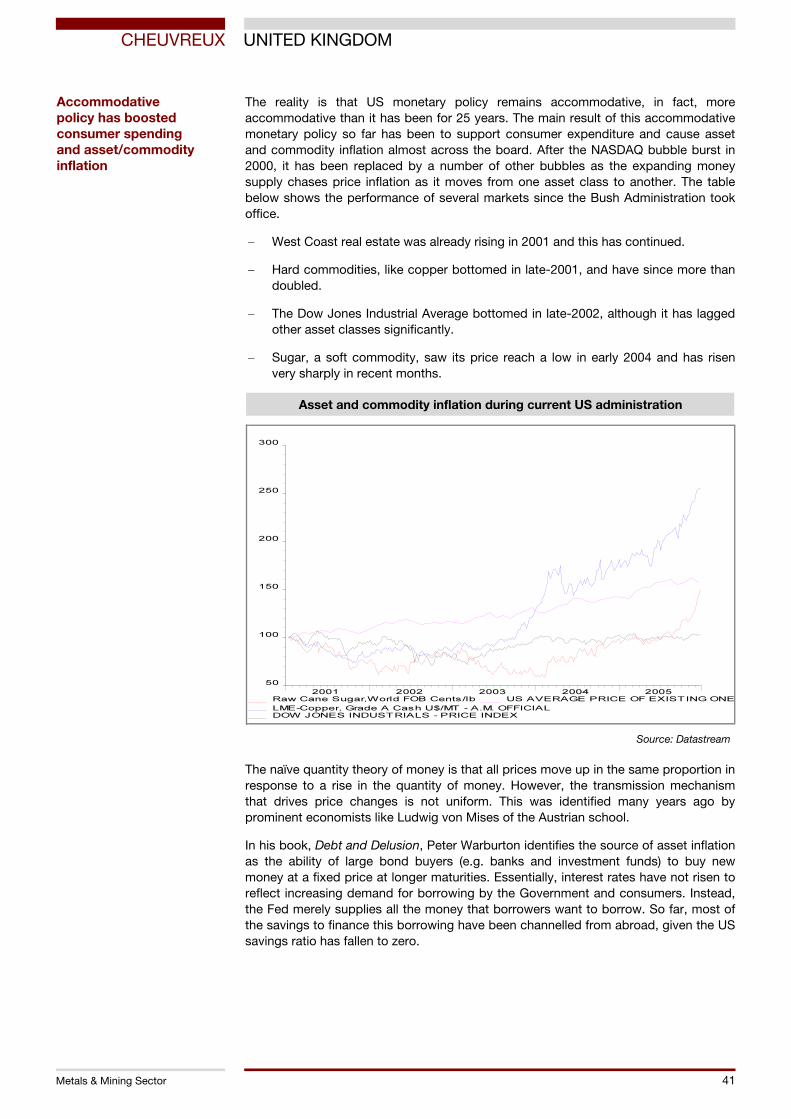
41
CHEUVREUX UNITED KINGDOM
Metals & Mining Sector
The reality is that US monetary policy remains accommodative, in fact, more accommodative than it has been for 25 years. The main result of this accommodative monetary policy so far has been to support consumer expenditure and cause asset and commodity inflation almost across the board. After the NASDAQ bubble burst in 2000, it has been replaced by a number of other bubbles as the expanding money supply chases price inflation as it moves from one asset class to another. The table below shows the performance of several markets since the Bush Administration took office.
− West Coast real estate was already rising in 2001 and this has continued.
− Hard commodities, like copper bottomed in late-2001, and have since more than doubled.
− The Dow Jones Industrial Average bottomed in late-2002, although it has lagged other asset classes significantly.
− Sugar, a soft commodity, saw its price reach a low in early 2004 and has risen very sharply in recent months.
Asset and commodity inflation during current US administration
SUGCNRW 26/1/06
2001 2002 2003 2004 2005
50
100
150
200
250
300
Raw Cane Sugar,World FOB Cents/lb
LME-Copper, Grade A Cash U$/MT - A.M. OFFICIALDOW JONES INDUSTRIALS - PRICE INDEX
US AVERAGE PRICE OF EXISTING ONE
Source: DATASTREAM
Source: Datastream
The naïve quantity theory of money is that all prices move up in the same proportion in response to a rise in the quantity of money. However, the transmission mechanism that drives price changes is not uniform. This was identified many years ago by prominent economists like Ludwig von Mises of the Austrian school.
In his book, Debt and Delusion, Peter Warburton identifies the source of asset inflation as the ability of large bond buyers (e.g. banks and investment funds) to buy new money at a fixed price at longer maturities. Essentially, interest rates have not risen to reflect increasing demand for borrowing by the Government and consumers. Instead, the Fed merely supplies all the money that borrowers want to borrow. So far, most of the savings to finance this borrowing have been channelled from abroad, given the US savings ratio has fallen to zero.
Accommodative policy has boosted consumer spending and asset/commodity inflation
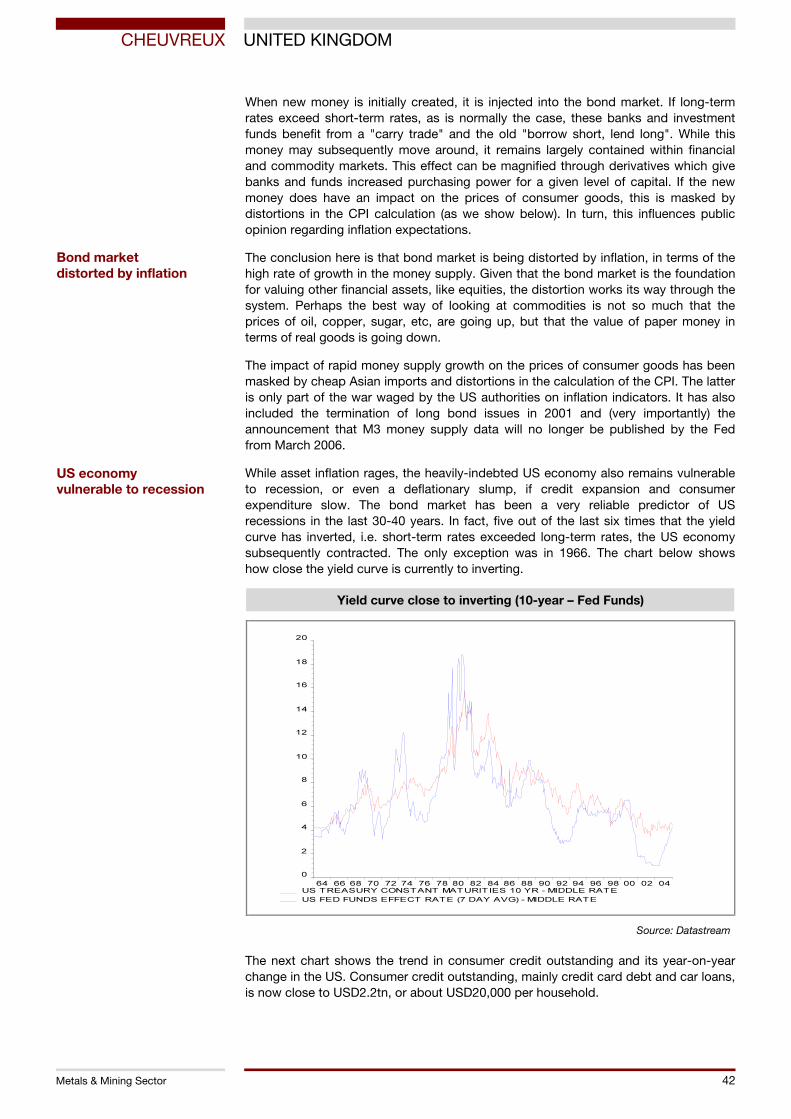
42
CHEUVREUX UNITED KINGDOM
Metals & Mining Sector
When new money is initially created, it is injected into the bond market. If long-term rates exceed short-term rates, as is normally the case, these banks and investment funds benefit from a "carry trade" and the old "borrow short, lend long". While this money may subsequently move around, it remains largely contained within financial and commodity markets. This effect can be magnified through derivatives which give banks and funds increased purchasing power for a given level of capital. If the new money does have an impact on the prices of consumer goods, this is masked by distortions in the CPI calculation (as we show below). In turn, this influences public opinion regarding inflation expectations.
The conclusion here is that bond market is being distorted by inflation, in terms of the high rate of growth in the money supply. Given that the bond market is the foundation for valuing other financial assets, like equities, the distortion works its way through the system. Perhaps the best way of looking at commodities is not so much that the prices of oil, copper, sugar, etc, are going up, but that the value of paper money in terms of real goods is going down.
The impact of rapid money supply growth on the prices of consumer goods has been masked by cheap Asian imports and distortions in the calculation of the CPI. The latter is only part of the war waged by the US authorities on inflation indicators. It has also included the termination of long bond issues in 2001 and (very importantly) the announcement that M3 money supply data will no longer be published by the Fed from March 2006.
While asset inflation rages, the heavily-indebted US economy also remains vulnerable to recession, or even a deflationary slump, if credit expansion and consumer expenditure slow. The bond market has been a very reliable predictor of US recessions in the last 30-40 years. In fact, five out of the last six times that the yield curve has inverted, i.e. short-term rates exceeded long-term rates, the US economy subsequently contracted. The only exception was in 1966. The chart below shows how close the yield curve is currently to inverting.
Yield curve close to inverting (10-year – Fed Funds)
FRTCM10 26/1/06
64 66 68 70 72 74 76 78 80 82 84 86 88 90 92 94 96 98 00 02 04
0
2
4
6
8
10
12
14
16
18
20
US TREASURY CONSTANT MATURITIES 10 YR - MIDDLE RATE
US FED FUNDS EFFECT RATE (7 DAY AVG) - MIDDLE RATE
Source: DATASTREAM
Source: Datastream
The next chart shows the trend in consumer credit outstanding and its year-on-year change in the US. Consumer credit outstanding, mainly credit card debt and car loans, is now close to USD2.2tn, or about USD20,000 per household.
Bond market distorted by inflation
US economy vulnerable to recession
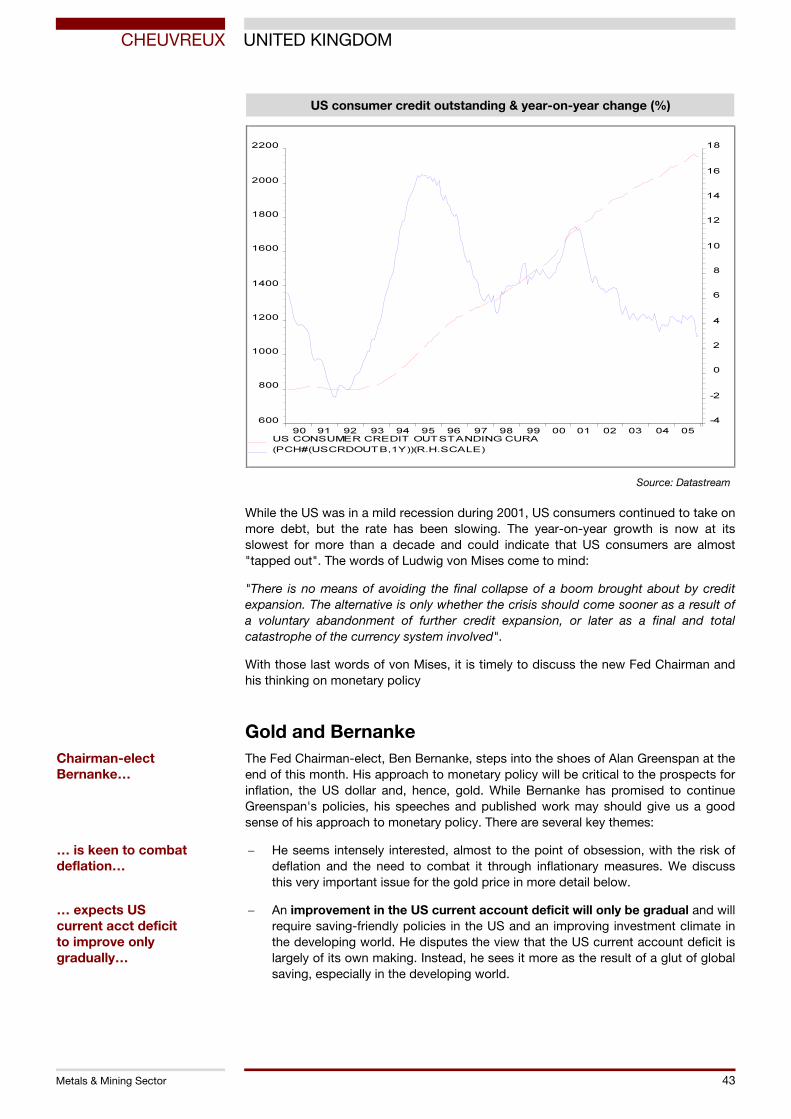
43
CHEUVREUX UNITED KINGDOM
Metals & Mining Sector
US consumer credit outstanding & year-on-year change (%)
USCRDOUTB 26/1/06
90 91 92 93 94 95 96 97 98 99 00 01 02 03 04 05
600
800
1000
1200
1400
1600
1800
2000
2200
-4
-2
0
2
4
6
8
10
12
14
16
18
US CONSUMER CREDIT OUTSTANDING CURA
(PCH#(USCRDOUTB,1Y))(R.H.SCALE)
Source: DATASTREAM
Source: Datastream
While the US was in a mild recession during 2001, US consumers continued to take on more debt, but the rate has been slowing. The year-on-year growth is now at its slowest for more than a decade and could indicate that US consumers are almost "tapped out". The words of Ludwig von Mises come to mind:
"There is no means of avoiding the final collapse of a boom brought about by credit expansion. The alternative is only whether the crisis should come sooner as a result of a voluntary abandonment of further credit expansion, or later as a final and total catastrophe of the currency system involved".
With those last words of von Mises, it is timely to discuss the new Fed Chairman and his thinking on monetary policy
Gold and Bernanke The Fed Chairman-elect, Ben Bernanke, steps into the shoes of Alan Greenspan at the end of this month. His approach to monetary policy will be critical to the prospects for inflation, the US dollar and, hence, gold. While Bernanke has promised to continue Greenspan's policies, his speeches and published work may should give us a good sense of his approach to monetary policy. There are several key themes:
− He seems intensely interested, almost to the point of obsession, with the risk of deflation and the need to combat it through inflationary measures. We discuss this very important issue for the gold price in more detail below.
− An improvement in the US current account deficit will only be gradual and will require saving-friendly policies in the US and an improving investment climate in the developing world. He disputes the view that the US current account deficit is largely of its own making. Instead, he sees it more as the result of a glut of global saving, especially in the developing world.
Chairman-elect Bernanke…
… is keen to combat deflation…
… expects US current acct deficit to improve only gradually…

44
CHEUVREUX UNITED KINGDOM
Metals & Mining Sector
− Bernanke is a strong believer in the importance of communication of, and clarity in, monetary policy. Indeed, he believes that Fed's credibility on inflation would be enhanced by setting a target range for the medium-term.
As mentioned above, a disproportionate number of Bernanke's speeches and publications deal with the threat of deflation. We found eight on the Federal Reserve website, although there may be more.
− Deflation (November 2002)
− Speech on Milton Friedman's 90th birthday (November 2002)
− Deflation Making Sure "It" Doesn't Happen Here in (2002)
− Some thoughts on Monetary Policy in Japan (May 2003)
− An Unwelcome Fall in Inflation (July 2003)
− Money, Gold and the Great Depression (March 2004)
− Monetary Policy Alternatives at the Zero Bound: An Empirical Assessment (September 2004)
− The Logic of Monetary Policy (December 2004)
Many of these speeches and reports examine the mistakes in monetary policy during the last two major deflationary episodes, the US during the Great Depression and Japan in the 1990s. His views on these two major events can be summarised as follows:
− He agrees with Milton Friedman that the Great Depression of the 1930s was caused by tightening of monetary policy at the wrong time in a misguided attempt to keep a lid on the stock market bubble. This led to a contraction in the money supply and deflation.
− When Japan suffered from deflation, Bernanke notes that although the Japanese cut short-term nominal interest rates to almost zero, monetary policy remained too tight. His thinking is that even zero short-term interest rates are consistent with positive real rates equivalent to the rate of deflation. Secondly, even if short-term rates are at zero, rates at the longer end of the yield curve tends to remain higher.
The lessons for Bernanke from these two events were:
− Do not try to counteract asset bubbles.
"…First, the Fed cannot reliably identify bubbles in asset prices. Second, even if it could identify bubbles in asset prices, monetary policy is far too blunt a tool for effective use against them."
− Aggressive monetary inflation is the answer as he expounded in the famous "printing press" speech, Deflation: Making sure it doesn't happen here given to the National Economists Club in November 2002:
"The conclusion that deflation is always reversible under a fiat money system follows from basic economic reasoning... Like gold, US dollars have a value only to the extent that they are strictly limited in supply. But the US government has a technology called a printing press (or, today, its electronic equivalent) that allows it to produce as many US dollars as it wishes at essentially no cost. By increasing the number of dollars in circulation… the US government can reduce the value of a dollar in terms of goods and services, which is equivalent to raising the prices in dollars of those goods and services."
… believes in clear communication, perhaps with medium-term inflation target
1930s depression…
… and Japanese deflation…
… hold lessons for Bernanke

45
CHEUVREUX UNITED KINGDOM
Metals & Mining Sector
− If cutting short-term interest rates to zero (the "zero bound" in Bernanke speak) is ineffective at preventing deflation, he advocates the use of "non-traditional" means to lower yields across the whole of the yield curve and flood the system with liquidity. Bernanke lists several ways in these speeches and publications that a big injection of liquidity could be made:
"…I see the first stages of a non-traditional campaign is focused on lowering long-term interest rates… Such measures might include... increased purchases of longer-term government bonds by the Fed, an announced program of oversupplying bank reserves… and the issuance of options to borrow from the Fed at low rates."
"…the Federal Reserve might be able to influence term premiums, and thus overall yields, by shifting the composition of its holdings, say from shorter-to longer-dated securities… Perhaps the most extreme… is an announced ceiling on some longer-term yield below the prevailing rate. This policy entails (in principle) an unlimited commitment to purchase the targeted security at the announced price."
"… announce explicit yields on longer-maturity Treasury debt… through unlimited purchases of securities up to two years from maturity… operate in the markets for agency debt (for example mortgage-backed securities issued by Ginnie Mae, the Government National Mortgage Association)."
All of Bernanke's suggestions risk rapid monetary inflation and would be picked up in M3 data if the latter was available beyond March 2006. He has become increasingly convinced of the benefits of these non-traditional approaches:
"Should the funds rate approach zero, the question will arise again about so-called non-traditional monetary policy measures. I first discussed some of these measures in a speech last November. Thanks in part to a great deal of fine work by the staff, my understanding of these measures and my confidence in their success has been greatly enhanced since I gave that speech."
Our suspicion is that Bernanke will try to keep the US credit expansion going as long as possible (probably with the inevitable consequences). A further leg in the current credit expansion and inflationary boom in assets (with hyperinflationary risk) seems most likely outcome at this stage. At the same time, the heavily debt-laden US economy is also at risk of a deflationary slowdown. .There is only one asset class that will perform under both of these extreme scenarios: gold (and precious metals).

46
CHEUVREUX UNITED KINGDOM
Metals & Mining Sector
APPENDIX 1
End of Bretton Woods & last remnants of Gold Standard Bretton Woods worked reasonably well until the late 1950s when the US moved from a current account surplus in 1957 to significant deficits during 1958-60. During this period, US treasury gold reserves declined by 22%. Concerns about the dollar began to mount, especially in the run-up to the US election in late 1960. The price suddenly rose to over USD40/oz and the Bank of England and Federal Reserve were forced to sell gold reserves to maintain the price at USD35/oz. In early 1961 a formal agreement was reached between the US and eight European nations (including the UK, Germany and France) to keep the gold price at USD35/oz, leading to the creation of the London Gold Pool.
The Vietnam War caused the system to break down again as the US budget deficit soared and there was a rush to convert US dollars into gold. By 1968, when the Gold Pool was disbanded, US gold reserves had fallen 52% from their 1957 level. Prior to this, the Chairman of the Federal Reserve had said that he would defend the US dollar "down to the last ingot"! France, under the direction of President de Gaulle, withdrew from the Gold Pool and was particularly aggressive in converting US dollars into gold, thereby triggering the dollar's devaluation.
After the collapse of the Gold Pool, a two-tier market developed in gold. Central banks would continue to trade between themselves at a price of USD35/oz but the price could float freely in the private sector. In August 1971, Nixon imposed a wage freeze in an attempt to contain inflation and the gold backing of the US dollar was removed. Many commentators at the time expected a break in the direct link between currencies and gold to lead to a fall in the gold price. In reality, this just showed the weakness of paper currency and the gold price quickly rose to over USD200/oz.

47
CHEUVREUX UNITED KINGDOM
Metals & Mining Sector
APPENDIX 2
The covert war on inflation indicators For the last decade, the US monetary authorities have been waging war on anything that could warn markets about rising inflation. Besides the gold price, this has included the methodology for calculating the Consumer Price Index (CPI), the elimination of the Long Bond and, most recently, the announcement that M3 will no longer be reported. Rising inflation, in the sense of the official CPI figure, is considered so dangerous by the US authorities for a variety of reasons:
− It increases the cost to the US Government of welfare programmes, such as pensions, social security, veterans and other benefits. These costs are all adjusted by the CPI annually.
− It means higher interest rates and, therefore, a higher cost of servicing the massive US debt burden and higher mortgage costs for US consumers.
− It has a negative impact on stock, bond and real estate markets which have become critical to the confidence, spending patterns and balance sheets of US consumers. Consumer expenditure accounts for 70% of US GDP.
In more detail, the covert war on the true level of inflation has been waged as follows:
Changes in CPI calculation methodology
John Williams is a consulting economist and has specialised in US Government economic reporting for more than 20 years. His work (see www.shadowstats.com) has received coverage in the New York Times and other media and eventually led to a meeting with representatives of all the US Government's statistical agencies. However, Williams notes that:
"Despite minor changes to the system, government reporting has deteriorated sharply in the last decade or so".
In Williams' view the CPI statistics were reasonably good until the early 1990s but have "succumbed to pressures from miscreant politicians". His report The Consumer Price Index published in September 2004 highlights the most blatant distortions in the calculation of the CPI used by the Bureau of Labor Statistics to reduce the published CPI (CPI-U) numbers:
− Substitution of cheaper alternatives. Williams uses the example that when steak gets too expensive, the CPI calculation assumes that consumers replace more expensive steak with cheaper hamburgers, rather than buying more expensive steak.
− Geometric weightings. Over several years the arithmetic weighting of CPI components was changed to a geometric weighting. This had the effect of lowering the weighting of CPI components rising in price and increasing the weighting of those with falling prices.

48
CHEUVREUX UNITED KINGDOM
Metals & Mining Sector
− Hedonic regression. This is the strangest change of all and is used to offset rising costs with increased pleasure experienced by consumers (hence its derivation from the word "hedonism"). There are numerous studies by the Bureau of Labor Statistics explaining why actual prices of consumer items are substituted for "quality adjusted" lower prices based on consumer enjoyment. In his work, Williams uses the examples of an increase in the cost of gasoline due to the cost of a federally mandated gasoline additive and the increase in the cost of washing machines due to more technically advanced washing machine technology. The full impact of price increases such as these does not show up in the CPI figures due to the alleged incremental enjoyment consumers gain from cleaner air and cleaner clothes.
− Intervention analysis. This is used to moderate the seasonal swings in goods such as food and energy. While price rises never get fully reflected in the CPI, Williams notes that "declining prices sure do".
The changes in CPI methodology since the Clinton Administration are estimated by Williams to have led to the CPI figures systematically understating the true level of US inflation by 2.7% on an ongoing basis.
The Fed's focus on the "core" level of inflation is also misleading. The core CPI is calculated by excluding the "volatile food and energy" components. At around one quarter of total consumer expenditure, these categories are very significant, especially when energy prices are so high.
The Long Bond
On Halloween in 2001, the US Treasury announced that it would no longer issue new 30-year Treasury bonds. This instrument was seen as a bellwether for monitoring inflation expectations and the most important measure of risk-free nominal returns. It was also used as the benchmark from which to price mortgages which, for most consumers, represented their biggest monthly cash outflow.
The announcement came just after the Q3-01 US GDP number had been published, signalling the first contraction in the US economy for a decade. The information was on the Treasury's website 15 minutes before the announcement was made and certain leading banks were active in the market prior to the announcement. At the time, the Long Bond was trading very close to its all-time low, the US Treasury argued that it would be cheaper to dispense with it and that expected future budget surpluses meant that the US did not need to borrow money over such a long period of time. These surpluses have obviously not materialised.
The end of new Long Bond issuance raised much debate at the time. Adam Hamilton was particularly vociferous in his report Long Bond Assassinated in November 2001:
"The bottom line is the Long Bond would not participate in the great scam of denying inflation while at the same time the Federal Reserve was frantically flooding the US economy with new money… the Fed had brazenly manipulated short-term rates down by 400bp in 10 short months, the Long Bond had coughed-up 12bp in yield... It had to go… The Long Bond was assassinated to silence a key warning sign for the impending inflationary tsunami rapidly approaching American shores!"
We was initially sceptical when we read this, but the chart of the Long Bond, the 10-year Treasury Bond and the Fed Funds rate in the run-up to the announcement is revealing. Not only was the Long Bond stubbornly refusing to track the Fed Funds rate but it was also showing increasing divergence from the 10-year Treasury Bond. With the demise of the Long Bond, the more "malleable" 10-year Treasury Bond became the benchmark US interest rate by default.
CPI thought to understate true level of US inflation by 2.7%

49
CHEUVREUX UNITED KINGDOM
Metals & Mining Sector
Long Bond, the 10 year and Fed Funds 2000-01
FRTCM10 12/1/06
J F M A M J J A S O N D J F M A M J J A S O
2.00
2.50
3.00
3.50
4.00
4.50
5.00
5.50
6.00
6.50
7.00
US TREASURY CONSTANT MATURITIES 10 YR - MIDDLE RATE
US TREASURY CONSTANT - 30 YR (D'DEAD' - MIDDLE RATEUS FED FUNDS EFFECT RATE (7 DAY AVG) - MIDDLE RATESource: DATASTREAM
Source: Datastream
The end of M3 reporting
In November 2005, the Fed quietly announced that it would suspend publication of the M3 monetary aggregate data from 23 March 2006 onwards. M3 is the broadest of the monetary aggregates and effectively equates to the money supply. When asked why M3 publication was being discontinued, the Fed's reply was that M3 does not contain any more relevant economic data than M2 and its role in monetary policy has diminished. In addition, it will save the mighty Fed all of USD0.5m per annum. These reasons are spurious.
From this March, currency traders, investors and foreign holders of the massive US Treasury debt burden will not be able to track the rate at which the US monetary authorities are debasing the US dollar. The value of the US dollar is essentially a claim against the assets and future income of the US economy, just as an ordinary share or corporate bond is a claim against the assets and future income of a company. Imagine the impact on a company which gave itself the power to issue an undisclosed quantity of new shares indefinitely without communicating the amounts publicly. If this was possible, confidence in the company and its board of directors would evaporate, the market's ability to assess the per share value would disappear and its share price would collapse. This is effectively what the Federal Reserve will do in respect of the dollar. A GATA supporter, Chuck Augustin, commented amusingly:
"…it looks like the boys are getting ready to unleash Weimar Republic II on the world. Perhaps we should all be sure our wheelbarrows are in good working order…"
The exact details of the Fed's announcement are important, but first it is important to understand the components of M3. M3 includes:
− M2, i.e. notes & coin + demand & other checkable deposits + savings deposits + small-denomination time deposits + retail money funds; and
− large time deposits + repos (repurchase agreements) + institutional money market accounts + Eurodollars.

50
CHEUVREUX UNITED KINGDOM
Metals & Mining Sector
The Fed will continue to report data on institutional money market accounts and large denomination time deposits will still be seen in the Fed's Flow of Funds Accounts. The only items investors will no longer be able to see are Repurchase Agreements and Eurodollars. Is this significant? You bet!
In a Repo, the Fed purchases securities, i.e. US Treasury bonds, from the banking system and credits the reserve accounts of the banks, thus adding liquidity to the banking system and expanding the money supply. The fear is that the Fed will covertly accelerate the monetisation of securities, flood the economy with liquidity and create monetary inflation. Such action will no longer be observable to the market after 26 March this year.
During Greenspan's 18-year tenure, the money supply in terms of M3 has increased by USD6.67tn, or 189%. The trend in the growth rate shows how an almost continuous acceleration took the US out of the recession of the early 1990s and sustained it through various shocks during the second half of the decade including the Japanese deflation, Asian currency crisis, the Russian debt default and LTCM.
M3 money supply during the Greenspan era 1987-06
USM3....B 18/1/06
87 88 89 90 91 92 93 94 95 96 97 98 99 00 01 02 03 04 05
000'S
3
4
5
6
7
8
9
10
11
-2
0
2
4
6
8
10
12
14
US MONEY SUPPLY M3 CURA
US MONEY SUPPLY M3 - ANNUAL % CHANGE CURA(R.H.SCALE)
Source: DATASTREAM
Source: Datastream
The following chart shows on an indexed basis the trend in US M3 money supply and the reported CPI during Greenspan's Chairmanship. This chart shows that the sharp divergence in the gradients of the two lines began in the mid-1990s. This is very revealing in terms of the covert policies of the US monetary authorities. There is a close fit with the timing that John Williams' alleges the distortion of the CPI data began and GATA's view of the beginning of the suppression of the gold price.

51
CHEUVREUX UNITED KINGDOM
Metals & Mining Sector
US M3 money supply growth diverges from CPI
USM3....B 24/1/06
87 88 89 90 91 92 93 94 95 96 97 98 99 00 01 02 03 04 05
80
100
150
200
250
300
US MONEY SUPPLY M3 CURA
US CPI - ALL URBAN: ALL ITEMS SADJ
Source: DATASTREAM
Source: Datastream

52
CHEUVREUX UNITED KINGDOM
Metals & Mining Sector
Intentionally blank

53
CHEUVREUX UNITED KINGDOM
Metals & Mining Sector
Intentionally blank

54
CHEUVREUX UNITED KINGDOM
Metals & Mining Sector
Important disclosures
Applicable disclosure clauses
Company Share price 30.01.06 Rating Disclosures
Anglo American 2157p 2/Outperform E
A. One or more companies in the Crédit Agricole S.A. group own more than 1% of the total issued share capital of the Company.
B. The Company owns more than 5% of the total issued share capital of Crédit Agricole SA.
C. One or more companies in the Crédit Agricole S.A. group held as of the last trading day of the past month, a net sales position
higher than 1% of the total issued share capital of the Company.
D. The trading portfolio of one or more companies in the Crédit Agricole S.A. group contains shares of the Company.
E. Crédit Agricole Cheuvreux and/or a company in the Crédit Agricole S.A. group is a market maker or a liquidity provider for the
financial instruments of the Company.
F. Calyon and/or a company of the Crédit Agricole S.A. group has been involved within the last three years in a publicly disclosed offer
of financial instruments of the Company.
G. Calyon and/or a company in the Crédit Agricole S.A. group has concluded or is party to a non confidential agreement relating to the
provision of investment banking services (except publicly disclosed offers) to the Company during the past 12 months or that has
given rise during the same period to the payment of compensation or to the promise to get a compensation paid.
H. This research has been communicated to the Company and following this communication, its conclusions have been amended
before its dissemination.
I. A director or a board member of the Crédit Agricole S.A. group is an officer, director, or board member of the Company.
Specific disclosure clauses
None.
Cheuvreux's rating and target price system
Ratings are built for a 6 to 12 month time horizon.
1/Selected List Expected to outperform the market and is in our country selected list 2/Outperform Expected to outperform the market 3/Underperform Expected to perform at best in line with the market 4/Sell Expected to underperform the market substantially No Rating or Suspended The investment rating and target price have been suspended. Such suspension is pursuant to
Cheuvreux's policy in circumstances when Cheuvreux's parent company, Calyon, is acting in an advisory capacity in a merger or strategic transaction involving this company or when Calyon or Crédit Agricole has a beneficial interest in this company and in certain other circumstances.
Target price methodology Cheuvreux's target prices are derived from one or more of the following methodologies: DCF, SOTP, peer comparison and EVA.
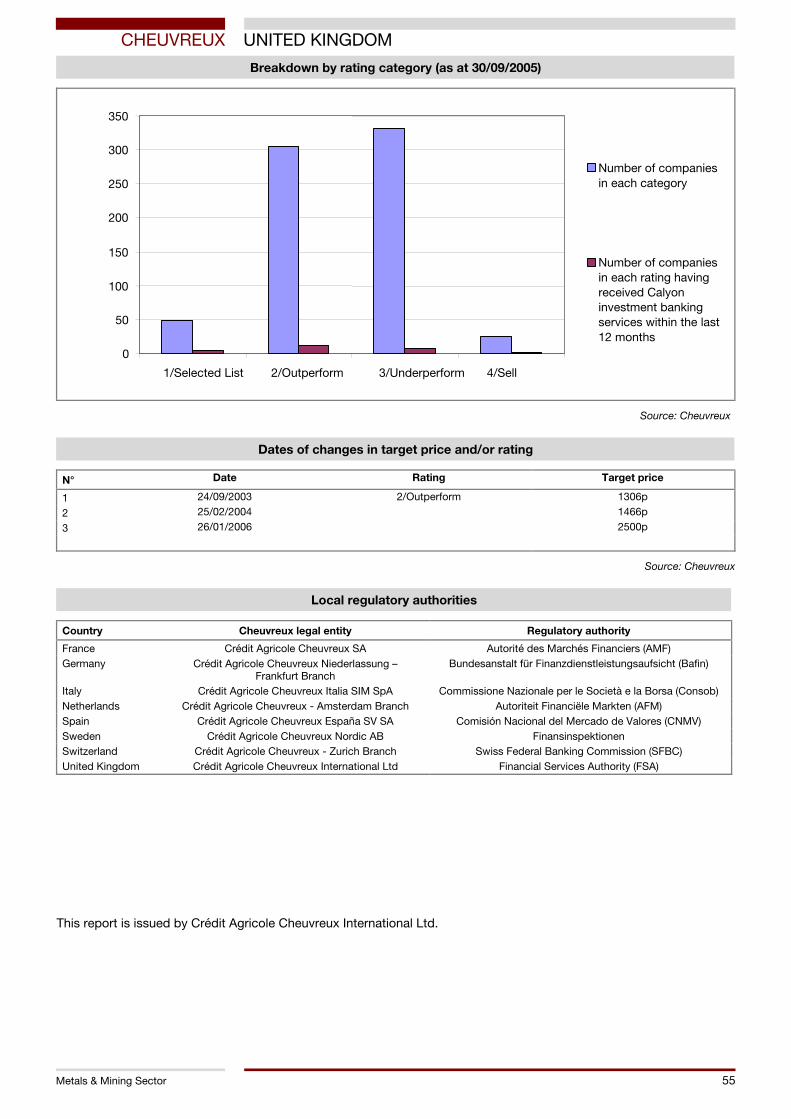
55
CHEUVREUX UNITED KINGDOM
Metals & Mining Sector
Breakdown by rating category (as at 30/09/2005)
0
50
100
150
200
250
300
350
1/Selected List 2/Outperform 3/Underperform 4/Sell
Number of companiesin each category
Number of companiesin each rating havingreceived Calyoninvestment bankingservices within the last12 months
Source: Cheuvreux
Dates of changes in target price and/or rating
N° Date Rating Target price
1 24/09/2003 2/Outperform 1306p
2 25/02/2004 1466p
3 26/01/2006 2500p
Source: Cheuvreux
Local regulatory authorities
Country Cheuvreux legal entity Regulatory authority
France Crédit Agricole Cheuvreux SA Autorité des Marchés Financiers (AMF) Germany Crédit Agricole Cheuvreux Niederlassung –
Frankfurt Branch Bundesanstalt für Finanzdienstleistungsaufsicht (Bafin)
Italy Crédit Agricole Cheuvreux Italia SIM SpA Commissione Nazionale per le Società e la Borsa (Consob) Netherlands Crédit Agricole Cheuvreux - Amsterdam Branch Autoriteit Financiële Markten (AFM) Spain Crédit Agricole Cheuvreux España SV SA Comisión Nacional del Mercado de Valores (CNMV) Sweden Crédit Agricole Cheuvreux Nordic AB Finansinspektionen Switzerland Crédit Agricole Cheuvreux - Zurich Branch Swiss Federal Banking Commission (SFBC) United Kingdom Crédit Agricole Cheuvreux International Ltd Financial Services Authority (FSA)
This report is issued by Crédit Agricole Cheuvreux International Ltd.

RESEARCH & DISTRIBUTION CENTRES
BENELUX CRÉDIT AGRICOLE CHEUVREUX – AMSTERDAM BRANCH
HONTHORSTSTRAAT 9 1071 DC AMSTERDAM
TEL: +31 20 573 06 66 FAX: +31 20 672 40 41
FRANCE CREDIT AGRICOLE CHEUVREUX S.A.
9, QUAI PAUL DOUMER 92400 COURBEVOIE
TEL: +33 1 41 89 70 00 FAX: +33 1 41 89 70 05
GERMANY CREDIT AGRICOLE CHEUVREUX – FRANKFURT BRANCH
MESSETURM - FRIEDRICH-EBERT-ANLAGE 49 D-60308 FRANKFURT AM MAIN
TEL: +49 69 47 897 100 FAX: +49 69 47 897 530
ITALY CRÉDIT AGRICOLE CHEUVREUX ITALIA SIM S.P.A.
VIA BRERA 21 20121 MILAN
TEL: +39 02 80 62 83 00 FAX: +39 02 86 46 15 70
SPAIN CREDIT AGRICOLE CHEUVREUX ESPAÑA S.V. S.A.
PASEO DE LA CASTELLANA 1 28046 MADRID
TEL: +34 91 432 78 21 FAX: +34 91 432 75 13
SWEDEN CRÉDIT AGRICOLE CHEUVREUX NORDIC AB
REGERINGSGATAN 38 10393 STOCKHOLM
TEL: +468 723 5100 FAX: +468 723 5101
SWITZERLAND CRÉDIT AGRICOLE CHEUVREUX – ZURICH BRANCH
BAHNHOFSTRASSE 18 8001 ZURICH
TEL: +41 44 218 17 17 FAX: +41 44 212 25 50
UNITED KINGDOM CRÉDIT AGRICOLE CHEUVREUX INTERNATIONAL LIMITED
8TH FLOOR 122 LEADENHALL STREET
LONDON EC3V 4QH TEL: +44 207 621 5100 FAX: +44 207 621 5101
DISTRIBUTION CENTRES
JAPAN CHEUVREUX CALYON CAPITAL MARKETS ASIA B.V., TOKYO BRANCH SHIODOME SUMITOMO BUILDING, 15TH FLOOR 1-9-2 HIGASHI-SHIMBASHI MINATO-KU TOKYO 105-0021 TEL: +81 3 4580 8522 FAX: +81 3 4580 5534
UNITED STATES CRÉDIT AGRICOLE CHEUVREUX NORTH AMERICA, INC. NEW YORK
1301 AVENUE OF THE AMERICAS 15TH FLOOR NEW YORK, NY 10019 TEL: +1 (212) 492 8800 FAX: +1 (212) 492 8801 SAN FRANCISCO
ONE MARKET SPEAR TOWER, SUITE 1610 SAN FRANCISCO, CA 94105 TEL: + 1 (415) 543.3111 FAX: + 1 (415) 618.0821
Copyright © Crédit Agricole Cheuvreux, 2006. All rights reserved This research report or summary has been prepared by Crédit Agricole Cheuvreux or one of its affiliates or branches (collectively “CA Cheuvreux”) from information believed to be reliable. Such information has not been independently verified and no guarantee, representation or warranty, express or implied, is made as to its accuracy, completeness or correctness. Any opinions or estimates expressed herein reflect the judgment of CA Cheuvreux at this date and are subject to change at any time without notice. Unless otherwise stated, the information or opinions presented, or the research or analysis upon which they are based, are updated as necessary and at least annually. Not all strategies are appropriate at all times. Past performance is not necessarily a guide to future performance. Independent advice should be sought in case of doubt. In any event, investors are invited to make their own independent decision as to whether an instrument is proper or appropriate based on their own judgment and upon the advice of any relevant advisors they have consulted. CA Cheuvreux, Calyon and their affiliates may effect transactions in the securities described herein for their own account or for the account of others, may have positions with the issuer thereof, or any of its affiliates, or may perform or seek to perform securities, investment banking or other services for such issuer or its affiliates. The organisational and administrative arrangements established by CA Cheuvreux for the management of conflicts of interest with respect to investment research are consistent with rules, regulations or codes applicable to the securities industry. These arrangements can be found in CA Cheuvreux’s policy for managing conflicts of interest, available at www.cheuvreux.com. Current research disclosures regarding companies mentioned in this report are also available at www.cheuvreux.com. This report is provided for information purposes only. It is not intended as an offer, invitation or solicitation to buy or sell any of the securities described herein and is intended for use only by those professional investors to whom it is made available by CA Cheuvreux. To the extent permitted by applicable securities laws and regulations, CA Cheuvreux accepts no liability whatsoever for any direct or consequential loss arising from the use of this document or its contents. The delivery of this research report to U.S. persons in the United States of America is made by and under the responsibility of Crédit Agricole Cheuvreux North America, Inc. (registered with the SEC). This research report is only intended for persons who qualify as Major U.S. Institutional Investors, as defined in Securities Exchange Act Rule 15a-6, and deal with CA Cheuvreux. However, the delivery of this research report or summary to any U.S. person shall not be deemed a recommendation of Crédit Agricole Cheuvreux North America, Inc. to effect any transactions in the securities discussed herein or an endorsement of any opinion expressed herein. Crédit Agricole Cheuvreux North America, Inc. may furnish upon request all investment information available to it supporting any recommendations made in this research report. All trades with U.S. recipients of this research shall be executed through Crédit Agricole Cheuvreux North America, Inc. In the United Kingdom, this report is approved and/or distributed by Crédit Agricole Cheuvreux International Ltd (authorised and regulated by the Financial Services Authority (“FSA”)) and is directed at Market Counterparties and Intermediate Customers (as defined in FSA Rules). As such, the investments referred to herein are only available to such persons. This report is not for distribution to Private Customers and investments mentioned in this report will not be available to such persons. In Italy, this report is approved and/or distributed by Crédit Agricole Cheuvreux Italia SIM S.p.a. (regulated by CONSOB) and is not intended for circulation or distribution either to the public at large or to any other parties other than professional investors, as defined in Art. 100 of decree law No. 58 of 24 February 1998 and in Art. 31 of CONSOB Resolution No. 11522 of 1 July 1998 and later amendments. In Spain, any decision by the recipient to buy should be taken bearing in mind the existing public information on each stock, or, if applicable, the stock exchange prospectus registered in the CNMV (National Securities Market Commission). THE DISTRIBUTION OF THIS DOCUMENT IN OTHER JURISDICTIONS MAY BE RESTRICTED BY LAW, AND PERSONS INTO WHOSE POSSESSION THIS DOCUMENT COMES SHOULD INFORM THEMSELVES ABOUT, AND OBSERVE, ANY SUCH RESTRICTIONS. BY ACCEPTING THIS REPORT YOU AGREE TO BE BOUND BY THE FOREGOING INSTRUCTIONS. No part of this report may be reproduced in any manner or redistributed without the prior written permission of CA Cheuvreux.