United Kingdom 2018 Accounting & Bookkeeping Industry … · * 939 UK accounting and bookkeeping...
42
A United Kingdom 2018 Accounting & Bookkeeping Industry Performance Report See how your practice compares and where you want to get to
Transcript of United Kingdom 2018 Accounting & Bookkeeping Industry … · * 939 UK accounting and bookkeeping...

A
United Kingdom 2018 Accounting & Bookkeeping Industry Performance ReportSee how your practice compares and where you want to get to

B Inside cover: Max Henderson, Hotpod Yoga, London | Xero customerCover: Sian Kelly, Inform Accounting, Birmingham | Xero partner

1
ForewordWe’re very pleased to share with you this accounting and bookkeeping industry
performance report, the 2018 edition of Xero’s partner benchmarking study for the UK
market. This year’s report sharpens the focus on forward planning, as partners have
told us that the most valuable use of previous reports was to inform their strategic and
annual planning. We’ve also added significantly more detail on marketing and advisory
services, in line with the feedback.
We produced our first detailed benchmarking reports – for the United Kingdom, Australia,
New Zealand, and the United States – in 2016 and 2017. Over 2000 practices took part
in those studies, and now over 5000 accounting and bookkeeping firms globally have
participated in providing the rich data that lets Xero partners compare their firm with
other similar practices.
This report includes findings in two new areas.
• It shows results for practices who’ve taken different approaches to positioning their firm
in the market (see tables 3 to 5). It’s evident that raising these questions helps practices
agree and articulate their firm’s strategy for 2018 and the following three to five years.
• It reveals the composition of advisory services revenue and what partners are prioritising
in 2018. In the ‘what if’ scenario in table 6, we show what the 2017 results would have
been for a firm with 250 small business clients. This demonstrates the potential revenue
to be gained from advisory services.
As you read through this report, you’ll see illuminating patterns emerge – in client
management, marketing, pricing, billing, employee compensation and advisory services.
The data shows that, across the industry, practices aren’t investing much into marketing
online accounting and advisory services. This provides a real opportunity for practices to
improve their marketing and to be seen by – and win over – the high proportion of businesses
actively looking to switch advisors.
The findings in this report point to opportunities and ways for firms to achieve their 2018
goals. We’re here to help you move your practice forward and enjoy the benefits of your
efforts, so get in touch with your Xero account manager for assistance to make it happen.
Your account manager can also point you to more resources to assist your practice as we
couldn’t fit everything in here.
Please continue to share your questions and feedback with us as we plan for 2019 and
beyond. You can reach me directly by email.
Doug LaBahn, Ph.D.
Xero Practice Leadership Team

2
We love putting reports like this together to help you plan for the future. Thanks for reading.
Hotpod Yoga, London | Xero customer

3
List of figures
Figure 1. Sources of new clients
Figure 2. Investment in marketing
Figure 3. Growth in client numbers by age of firm
Figure 4. New clients in the last 12 months
Figure 5. Annual revenue per small business client
Figure 6. Revenue contribution per employee
Figure 7. Number of clients per employee
Figure 8. Increases in employee compensation
Figure 9. Advisory service revenue
Figure 10. Regretted client departures
Figure 11. Revenue per employee as percent of clients on Xero grows
Figure 12. Comparison of practices with and without advisory services
List of tables
Table 1. Role and seniority of participants
Table 2. Growth in size and revenue over time
Table 3. Practice approaches
Table 4. Billing options
Table 5. Results for practices taking different approaches
Table 6. Contribution of advisory services to revenue
Table 7. Most attractive areas for firm revenue growth
Table 8. Comparison of different size firms
Table 9. Profile of sole practitioners
Table 10. Profile of small firms
Table 11. Profile of midsize firms
Table 12. Profile of large firms
Table 13. Profile of very large firms
ContentsHighlights ........................................................................................................................... 4
Participant profiles ............................................................................................................ 6
Insights to help your 2018 planning .................................................................................. 7
Marketing, performance and growth .................................................................................. 8
Client metrics for online practices ..................................................................................... 14
Advisory services opportunities ........................................................................................ 21
Ingredients for success ...................................................................................................... 24
Different size firms: a close-up look .................................................................................. 27
How we can help ................................................................................................................ 38
These stats are based on an online survey we did of 939 UK accounting and bookkeeping partners. We aim to be as clear and concise as possible with this info, but we can’t promise that it’s free of rounding or other errors. The info and commentary in this report is just a guide and should not be taken as taxation, financial or legal advice – you should always check with an independent expert that what you’re doing is right for you and your practice.

4
Results across all practices
Highlights
Average revenue growth rate for Xero accounting and bookkeeping practices
in Singapore in the 12 months to December 2017*
Average annual billing per small business client**
Average revenue per employee including contractors
* 139 Singapore accounting and bookkeeping practices in December 2017.
** Small businesses are defined as businesses with up to 100 employees.
£124,600£124,600£124,600£124,600£124,600£124,600£124,600£124,600£124,600£124,600£124,600£124,600£124,600£124,600£124,600£124,600£124,600£124,600£124,600£124,600£124,600£124,600£124,600£124,600£124,600£124,600£124,600£124,600£124,600£124,600£124,600£124,600£124,600£124,600£124,600£124,600£124,600£124,600£124,600£124,600£124,600£124,600£124,600£124,600£124,600£124,600£124,600£124,600£124,600£124,600£124,600£124,600£124,600£124,600£124,600£124,600£124,600£124,600£124,600£124,600£124,600£124,600£124,600£124,600£124,600£124,600£124,600£124,600£124,600£124,600£124,600£124,600£124,600£124,600£124,600£124,600£124,600£124,600£124,600£124,600£124,600£124,600£124,600£124,600£124,600£124,600£124,600£124,600£124,600£124,600£124,600£124,600£124,600£124,600£124,600£124,600£124,600£124,600£124,600£124,600£124,600£124,600£124,600£124,600£124,600£124,600£124,600£124,600£124,600£124,600£124,600£124,600£124,600£124,600£124,600£124,600£124,600£124,600£124,600£124,600£124,600£124,600£124,600
12.3%12.3%12.3%12.3%12.3%12.3%12.3%12.3%12.3%12.3%12.3%12.3%12.3%12.3%12.3%12.3%12.3%12.3%12.3%12.3%12.3%12.3%12.3%12.3%12.3%12.3%12.3%12.3%12.3%12.3%12.3%12.3%12.3%12.3%12.3%12.3%12.3%12.3%12.3%12.3%12.3%12.3%12.3%12.3%12.3%12.3%12.3%12.3%12.3%12.3%12.3%12.3%12.3%12.3%12.3%12.3%12.3%12.3%12.3%12.3%12.3%12.3%12.3%12.3%12.3%12.3%12.3%12.3%12.3%12.3%12.3%12.3%12.3%12.3%12.3%12.3%12.3%12.3%12.3%12.3%12.3%12.3%12.3%12.3%12.3%12.3%12.3%12.3%12.3%12.3%12.3%12.3%12.3%12.3%12.3%12.3%12.3%12.3%12.3%12.3%12.3%12.3%12.3%12.3%12.3%12.3%12.3%12.3%12.3%12.3%12.3%12.3%12.3%12.3%12.3%12.3%12.3%12.3%12.3%12.3%12.3%12.3%
£91,200£91,200£91,200£91,200£91,200£91,200£91,200£91,200£91,200£91,200£91,200£91,200£91,200£91,200£91,200£91,200£91,200£91,200£91,200£91,200£91,200£91,200£91,200£91,200£91,200£91,200£91,200£91,200£91,200£91,200£91,200£91,200£91,200£91,200£91,200£91,200£91,200£91,200£91,200£91,200£91,200£91,200£91,200£91,200£91,200£91,200£91,200£91,200£91,200£91,200£91,200£91,200£91,200£91,200£91,200£91,200£91,200£91,200£91,200£91,200£91,200£91,200£91,200£91,200£91,200£91,200£91,200£91,200£91,200£91,200£91,200£91,200£91,200£91,200£91,200£91,200£91,200£91,200£91,200£91,200£91,200£91,200£91,200£91,200£91,200£91,200£91,200£91,200£91,200£91,200£91,200£91,200£91,200£91,200£91,200£91,200£91,200£91,200£91,200£91,200£91,200£91,200£91,200£91,200£91,200£91,200£91,200£91,200£91,200£91,200£91,200£91,200£91,200£91,200£91,200£91,200£91,200£91,200£91,200£91,200£91,200£91,200£91,200
£382,700£382,700£382,700£382,700£382,700£382,700£382,700£382,700£382,700£382,700£382,700£382,700£382,700£382,700£382,700£382,700£382,700£382,700£382,700£382,700£382,700£382,700£382,700£382,700£382,700£382,700£382,700£382,700£382,700£382,700£382,700£382,700£382,700£382,700£382,700£382,700£382,700£382,700£382,700£382,700£382,700£382,700£382,700£382,700£382,700£382,700£382,700£382,700£382,700£382,700£382,700£382,700£382,700£382,700£382,700£382,700£382,700£382,700£382,700£382,700£382,700£382,700£382,700£382,700£382,700£382,700£382,700£382,700£382,700£382,700£382,700£382,700£382,700£382,700£382,700£382,700£382,700£382,700£382,700£382,700£382,700£382,700£382,700£382,700£382,700£382,700£382,700£382,700£382,700£382,700£382,700£382,700£382,700£382,700£382,700£382,700£382,700£382,700£382,700£382,700£382,700£382,700£382,700£382,700£382,700£382,700£382,700£382,700£382,700£382,700£382,700£382,700£382,700£382,700£382,700£382,700£382,700£382,700£382,700£382,700£382,700£382,700£382,700
14%14%14%14%14%14%14%14%14%14%14%14%14%14%14%14%14%14%14%14%14%14%14%14%14%14%14%14%14%14%14%14%14%14%14%14%14%14%14%14%14%14%14%14%14%14%14%14%14%14%14%14%14%14%14%14%14%14%14%14%14%14%14%14%14%14%14%14%14%14%14%14%14%14%14%14%14%14%14%14%14%14%14%14%14%14%14%14%14%14%14%14%14%14%14%14%14%14%14%14%14%14%14%14%14%14%14%14%14%14%14%14%14%14%14%14%14%14%14%14%14%14%
£113,200£113,200£113,200£113,200£113,200£113,200£113,200£113,200£113,200£113,200£113,200£113,200£113,200£113,200£113,200£113,200£113,200£113,200£113,200£113,200£113,200£113,200£113,200£113,200£113,200£113,200£113,200£113,200£113,200£113,200£113,200£113,200£113,200£113,200£113,200£113,200£113,200£113,200£113,200£113,200£113,200£113,200£113,200£113,200£113,200£113,200£113,200£113,200£113,200£113,200£113,200£113,200£113,200£113,200£113,200£113,200£113,200£113,200£113,200£113,200£113,200£113,200£113,200£113,200£113,200£113,200£113,200£113,200£113,200£113,200£113,200£113,200£113,200£113,200£113,200£113,200£113,200£113,200£113,200£113,200£113,200£113,200£113,200£113,200£113,200£113,200£113,200£113,200£113,200£113,200£113,200£113,200£113,200£113,200£113,200£113,200£113,200£113,200£113,200£113,200£113,200£113,200£113,200£113,200£113,200£113,200£113,200£113,200£113,200£113,200£113,200£113,200£113,200£113,200£113,200£113,200£113,200£113,200£113,200£113,200£113,200£113,200£113,200
Results across all practices*
Highlights
Average revenue growth for practices in the UK in the 12 months to December 2017*
Average revenue per employee including contractors
Average advisory service revenue
* 939 UK accounting and bookkeeping firms in December 2017

5
£124,600£124,600£124,600£124,600£124,600£124,600£124,600£124,600£124,600£124,600£124,600£124,600£124,600£124,600£124,600£124,600£124,600£124,600£124,600£124,600£124,600£124,600£124,600£124,600£124,600£124,600£124,600£124,600£124,600£124,600£124,600£124,600£124,600£124,600£124,600£124,600£124,600£124,600£124,600£124,600£124,600£124,600£124,600£124,600£124,600£124,600£124,600£124,600£124,600£124,600£124,600£124,600£124,600£124,600£124,600£124,600£124,600£124,600£124,600£124,600£124,600£124,600£124,600£124,600£124,600£124,600£124,600£124,600£124,600£124,600£124,600£124,600£124,600£124,600£124,600£124,600£124,600£124,600£124,600£124,600£124,600£124,600£124,600£124,600£124,600£124,600£124,600£124,600£124,600£124,600£124,600£124,600£124,600£124,600£124,600£124,600£124,600£124,600£124,600£124,600£124,600£124,600£124,600£124,600£124,600£124,600£124,600£124,600£124,600£124,600£124,600£124,600£124,600£124,600£124,600£124,600£124,600£124,600£124,600£124,600£124,600£124,600£124,600
12.3%12.3%12.3%12.3%12.3%12.3%12.3%12.3%12.3%12.3%12.3%12.3%12.3%12.3%12.3%12.3%12.3%12.3%12.3%12.3%12.3%12.3%12.3%12.3%12.3%12.3%12.3%12.3%12.3%12.3%12.3%12.3%12.3%12.3%12.3%12.3%12.3%12.3%12.3%12.3%12.3%12.3%12.3%12.3%12.3%12.3%12.3%12.3%12.3%12.3%12.3%12.3%12.3%12.3%12.3%12.3%12.3%12.3%12.3%12.3%12.3%12.3%12.3%12.3%12.3%12.3%12.3%12.3%12.3%12.3%12.3%12.3%12.3%12.3%12.3%12.3%12.3%12.3%12.3%12.3%12.3%12.3%12.3%12.3%12.3%12.3%12.3%12.3%12.3%12.3%12.3%12.3%12.3%12.3%12.3%12.3%12.3%12.3%12.3%12.3%12.3%12.3%12.3%12.3%12.3%12.3%12.3%12.3%12.3%12.3%12.3%12.3%12.3%12.3%12.3%12.3%12.3%12.3%12.3%12.3%12.3%12.3%
£91,200£91,200£91,200£91,200£91,200£91,200£91,200£91,200£91,200£91,200£91,200£91,200£91,200£91,200£91,200£91,200£91,200£91,200£91,200£91,200£91,200£91,200£91,200£91,200£91,200£91,200£91,200£91,200£91,200£91,200£91,200£91,200£91,200£91,200£91,200£91,200£91,200£91,200£91,200£91,200£91,200£91,200£91,200£91,200£91,200£91,200£91,200£91,200£91,200£91,200£91,200£91,200£91,200£91,200£91,200£91,200£91,200£91,200£91,200£91,200£91,200£91,200£91,200£91,200£91,200£91,200£91,200£91,200£91,200£91,200£91,200£91,200£91,200£91,200£91,200£91,200£91,200£91,200£91,200£91,200£91,200£91,200£91,200£91,200£91,200£91,200£91,200£91,200£91,200£91,200£91,200£91,200£91,200£91,200£91,200£91,200£91,200£91,200£91,200£91,200£91,200£91,200£91,200£91,200£91,200£91,200£91,200£91,200£91,200£91,200£91,200£91,200£91,200£91,200£91,200£91,200£91,200£91,200£91,200£91,200£91,200£91,200£91,200
£382,700£382,700£382,700£382,700£382,700£382,700£382,700£382,700£382,700£382,700£382,700£382,700£382,700£382,700£382,700£382,700£382,700£382,700£382,700£382,700£382,700£382,700£382,700£382,700£382,700£382,700£382,700£382,700£382,700£382,700£382,700£382,700£382,700£382,700£382,700£382,700£382,700£382,700£382,700£382,700£382,700£382,700£382,700£382,700£382,700£382,700£382,700£382,700£382,700£382,700£382,700£382,700£382,700£382,700£382,700£382,700£382,700£382,700£382,700£382,700£382,700£382,700£382,700£382,700£382,700£382,700£382,700£382,700£382,700£382,700£382,700£382,700£382,700£382,700£382,700£382,700£382,700£382,700£382,700£382,700£382,700£382,700£382,700£382,700£382,700£382,700£382,700£382,700£382,700£382,700£382,700£382,700£382,700£382,700£382,700£382,700£382,700£382,700£382,700£382,700£382,700£382,700£382,700£382,700£382,700£382,700£382,700£382,700£382,700£382,700£382,700£382,700£382,700£382,700£382,700£382,700£382,700£382,700£382,700£382,700£382,700£382,700£382,700
14%14%14%14%14%14%14%14%14%14%14%14%14%14%14%14%14%14%14%14%14%14%14%14%14%14%14%14%14%14%14%14%14%14%14%14%14%14%14%14%14%14%14%14%14%14%14%14%14%14%14%14%14%14%14%14%14%14%14%14%14%14%14%14%14%14%14%14%14%14%14%14%14%14%14%14%14%14%14%14%14%14%14%14%14%14%14%14%14%14%14%14%14%14%14%14%14%14%14%14%14%14%14%14%14%14%14%14%14%14%14%14%14%14%14%14%14%14%14%14%14%14%
£113,200£113,200£113,200£113,200£113,200£113,200£113,200£113,200£113,200£113,200£113,200£113,200£113,200£113,200£113,200£113,200£113,200£113,200£113,200£113,200£113,200£113,200£113,200£113,200£113,200£113,200£113,200£113,200£113,200£113,200£113,200£113,200£113,200£113,200£113,200£113,200£113,200£113,200£113,200£113,200£113,200£113,200£113,200£113,200£113,200£113,200£113,200£113,200£113,200£113,200£113,200£113,200£113,200£113,200£113,200£113,200£113,200£113,200£113,200£113,200£113,200£113,200£113,200£113,200£113,200£113,200£113,200£113,200£113,200£113,200£113,200£113,200£113,200£113,200£113,200£113,200£113,200£113,200£113,200£113,200£113,200£113,200£113,200£113,200£113,200£113,200£113,200£113,200£113,200£113,200£113,200£113,200£113,200£113,200£113,200£113,200£113,200£113,200£113,200£113,200£113,200£113,200£113,200£113,200£113,200£113,200£113,200£113,200£113,200£113,200£113,200£113,200£113,200£113,200£113,200£113,200£113,200£113,200£113,200£113,200£113,200£113,200£113,200
Results for pacesetting practices*
Average revenue growth for practices in UK in the 12 months to December 2017*
Average revenue per employee including contractors
Average advisory service revenue
* Pacesetting firms are the practices with the largest number of clients (300+) using online
accounting software. These firms grew rapidly with 14% revenue growth and more than
triple the advisory revenue.

6
Participant profilesDefinitions
TYPES OF FIRMS
For the purposes of this study, we defined:
• sole practitioners as having no employees other than the owner
• small firms as having 2 to 9 employees including the owner
• midsize firms as having 10 to 19 employees including partners
• large firms as having 20 to 49 employees including partners
• very large firms as having 50 or more employees including partners
Where there were instances of only a few responses, we’ve omitted the results
from this report.
SMALL BUSINESSES/SMBS
When we talk about small businesses or SMBs, we mean those with up to 20 employees.
Participants’ role in their firm
This table shows the role and seniority of the 939 survey participants in their accounting firm.
By and large, they hold senior positions in their firm.
Number of participants
Owner/Managing
partner/Partner/CEO
Practice manager /team leader
Accountant or bookkeeper
Not disclosed Total
Not disclosed 396 0% 0% 0% 100% 100%
Sole
practitioners101 100% 0% 0% 0% 100%
Small firms 241 93% 5% 3% 0% 100%
Midsize firms 78 78% 19% 3% 0% 100%
Large firms 65 55% 40% 3% 2% 100%
Very large firms 58 45% 43% 9% 3% 100%
Average 47% 8% 2% 42% 100%
Table 1. Role and seniority of participants

7
Insights to help your 2018 planning
“ Last year we turned over seven
million. That was about three-
and-a-half million four years
ago. So it's 25% growth year on
year, for four years running.”
• Malcolm Pope, Shorts Chartered Accountants
“ We're doing a lot of our work more cost-effectively.
We're making better recovery on our jobs, we're not
carrying so much work in progress, we're doing the
jobs faster. All those good things are happening.
We’re in double figures for growth, percentage-wise.”
• Olly Evans, Evans & Partners
8
Other3%
49%
18%
30%
Switched fromanother firm
Were doing iton their own
New businessstartups
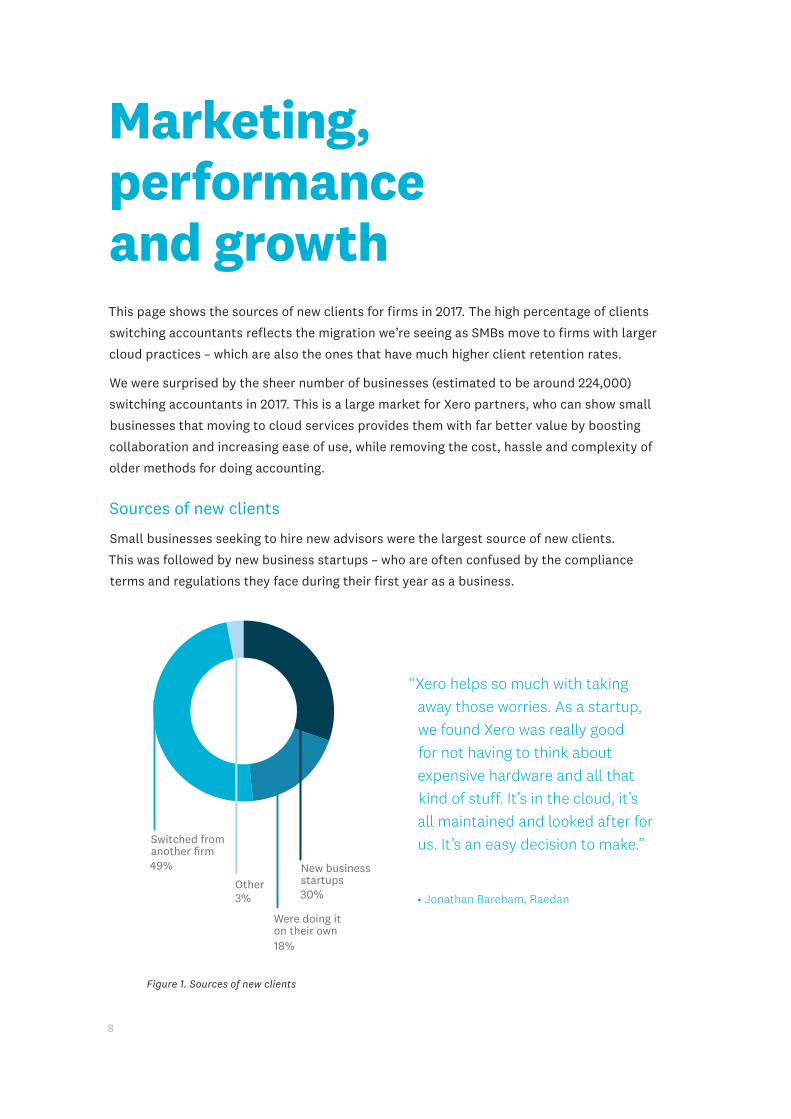
Marketing, performance and growthThis page shows the sources of new clients for firms in 2017. The high percentage of clients
switching accountants reflects the migration we’re seeing as SMBs move to firms with larger
cloud practices – which are also the ones that have much higher client retention rates.
We were surprised by the sheer number of businesses (estimated to be around 224,000)
switching accountants in 2017. This is a large market for Xero partners, who can show small
businesses that moving to cloud services provides them with far better value by boosting
collaboration and increasing ease of use, while removing the cost, hassle and complexity of
older methods for doing accounting.
Sources of new clients
Small businesses seeking to hire new advisors were the largest source of new clients.
This was followed by new business startups – who are often confused by the compliance
terms and regulations they face during their first year as a business.
Figure 1. Sources of new clients
“ Xero helps so much with taking
away those worries. As a startup,
we found Xero was really good
for not having to think about
expensive hardware and all that
kind of stuff. It’s in the cloud, it’s
all maintained and looked after for
us. It’s an easy decision to make.”
• Jonathan Bareham, Raedan

9
Investment in marketing
Most firms – except for the larger ones, which generally have staff dedicated to marketing
and client development activities – are reluctant to invest in marketing.
Figure 2. Average investment in marketing in the past 12 months
“ A lot of accountants have got their
head in the sand - we think we’re
marketing the right way but really
we’re not, and there’s loads
of different things that we could
be doing.”
• Sian Lloyd, Lewis Ballard
“ In terms of marketing, it’s all about
education. Educating clients about
the unique selling points of Xero
to say ‘Look, this is what Xero can
do for you. This is how we can add
value to your business if you use
Xero.’”
• Daniel Lowndes, Mitten Clarke
Ave
rage
mar
keti
ng in
vest
men
t in
last
12
mon
ths
0
£20,000
£40,000
£60,000
£80,000
Largefirms
Very largefirms
Midsizefirms
Smallfirms
Solepractitioner
10
2017
2016
2015
2014
2013
2010
-12
200
5-0
9
200
0-0
4
1990
-99
1970
-89
1950
-69
1930
-49
Bef
ore
1930
1500
1200
900
600
300
0
Num
ber
of s
mal
l bus
ines
s cl
ient
s
Year the firm was formed
All firms Best group: top 15% in each age cohort
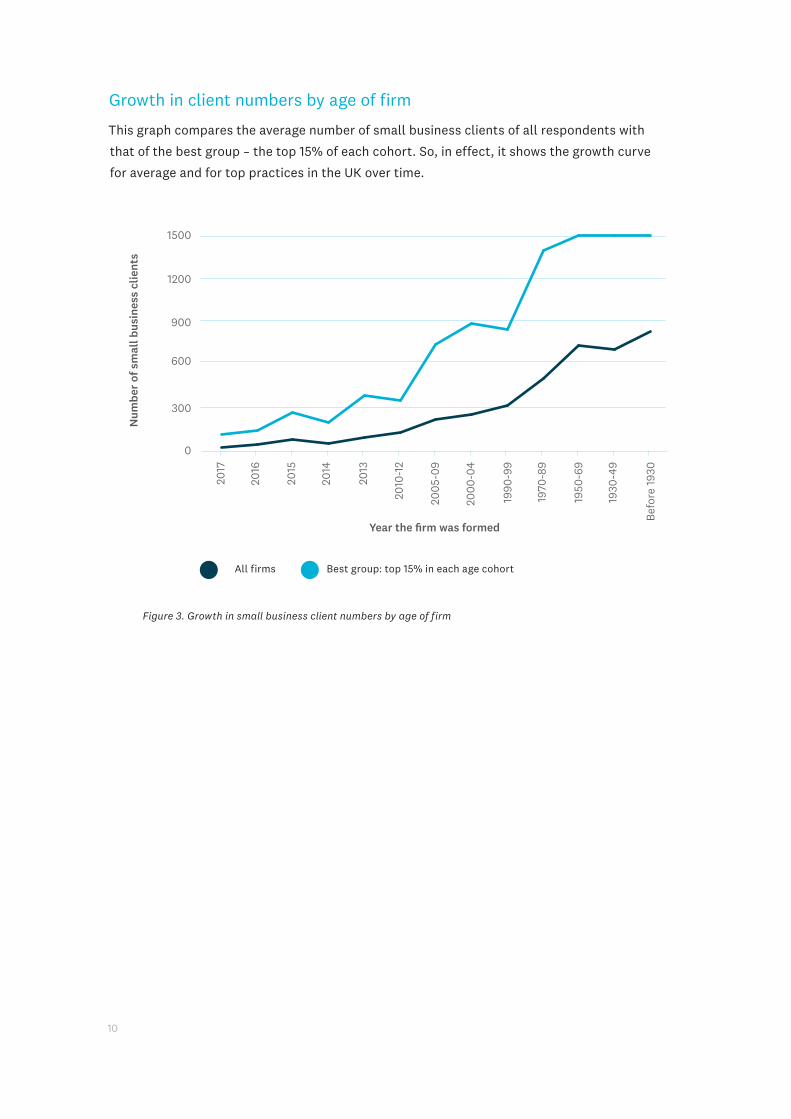
Growth in client numbers by age of firm
This graph compares the average number of small business clients of all respondents with
that of the best group – the top 15% of each cohort. So, in effect, it shows the growth curve
for average and for top practices in the UK over time.
Figure 3. Growth in small business client numbers by age of firm

11
Growth in size and revenue over time
These figures can help you set revenue, staff and client goals for 2018 by knowing what the
top and average firms have achieved.
All respondents Best group*
Year the firm was formed
No. of firms
No. of business clients
New clients in last 12 months
Firm revenue in last 12 months
Average no. of employees
% of regretted staff departures
No. of business clients
Firm revenue in last 12 months
No. of employees
2017 32 26 11 £113,273 2.1 1.3% 114 £252,850 3.0
2016 22 46 20 £739,193 5.6 3.0% 143 £1,147,000 19.5
2015 33 79 20 £577,091 7.6 4.6% 270 £2,514,050 35.4
2014 32 55 16 £176,828 3.8 7.7% 200 £414,750 7.8
2013 43 96 27 £321,663 5.3 6.2% 383 £916,542 13.7
2010-2012 67 127 25 £321,129 6.2 3.7% 350 £749,400 17.0
2005-2009 72 223 28 £724,011 8.8 3.5% 740 £1,130,250 15.4
2000-2004 50 252 25 £764,578 12.5 3.7% 887 £2,648,438 46.3
1990-1999 56 318 39 £1,139,924 20.0 2.1% 844 £3,218,750 51.3
1970-1989 58 505 40 £1,707,649 31.4 1.6% 1,393 £4,703,125 69.4
1950-1969 12 737 48 £3,595,667 42.5 1.8% 1,500 £2,333,333 48.3
1930-1949 19 705 57 £3,268,289 59.0 2.4% 1,500 £8,250,000 108.3
Before
1930 45 832 69 £6,591,706 78.4 1.9% 1,500 £16,321,429 125.0
Average 285 32 £1,359,210 19.5 3.4% 745 £3,385,485 41.7
* Top 15% in each age cohort
Table 2. Growth in size and revenue over time

12
Practice performance based on approach
PRACTICE APPROACHES
We asked participants to select the best fit for their practice from the options below,
then looked at the performance of practices with each approach.
Approach Description
Specialised surgeonOur firm provides the highest level of expertise in a select number
of important areas. We deliver exceptional service in a few areas.
Urgent care centreOur firm provides high quality service when businesses get stuck,
or are in too deep and need fast, smart resolution of their issues.
WeWork shared community, talent, team
Our firm provides services as if we are employees or members of
their team with all the experience and benefits (and without the
high costs and effort) of hiring full-time employees.
Business mentor/counsellor
Our firm provides the wise, experienced advice and counselling
that helps businesses navigate the best path forward for their
business – both now and far into the future.
All-inclusive ‘Amazon’ shopping centreOur firm provides a full set of services that cover virtually every
business need.
Fast and effective service centreOur firm provides great value and service to businesses that want
to get the job done quickly and economically.
Personal fitness trainer/coachOur firm provides regimentation that helps businesses and
business owners excel at work and in life.
Tech-loving accountantsOur firm is filled with qualified accountants who are also tech
geeks or front-runners.
Holistic health centreOur firm provides great accounting (fitness) and holistic business
coaching services (nutrition and lifestyle).
Table 3. Practice approaches
BILLING OPTIONS
We also asked participants about the different ways they billed clients and what proportion
of clients they billed by each method. The options were:
Billing option Description
Service planClients are on a fixed-fee monthly or quarterly service plan and the agreed rate
is automatically collected.
Service plan
plus projectsClients are on both a monthly service plan and they expect to pay for additional project work.
Bill by projectClients are quoted a fixed amount for the service (eg, tax return, general ledger setup) and
billed when the work is complete.
Bill for time Clients are billed for the number of hours (and partial hours) of service provided.
Table 4. Billing options

13
RESULTS FOR PRACTICES TAKING DIFFERENT APPROACHES
See how practices taking different approaches performed on average and the billing options
used to support each strategy.
% of clients on each billing option*
Best fit for the
practice
Annual revenue
per client
Revenue growth
in last 12 months
Popularity of the
approach
No. of small
business clients
Service plan
Service plan plus projects
Bill by project
Bill for
time
% of employees required to
complete timesheets
Specialised surgeon £4,980 13.7% 10% 292 25% 20% 27% 28% 57%
Urgent care centre £4,190 11.6% 2% 75 16% 5% 26% 53% 46%
WeWork shared
community, talent,
team
£3,320 14.5% 14% 99 26% 23% 20% 31% 47%
Business mentor/
counsellor£2,880 13.5% 21% 308 27% 17% 29% 26% 62%
All-inclusive ‘Amazon’
shopping centre£2,570 10.1% 31% 398 27% 17% 34% 20% 65%
Fast and effective
service centre£2,420 13.3% 8% 227 25% 18% 24% 33% 47%
Personal fitness
trainer/coach£2,280 16.7% 3% 249 23% 26% 24% 27% 55%
Tech-loving
accountants£2,120 17.3% 5% 237 33% 9% 32% 26% 43%
Holistic health
centre £2,060 15.8% 6% 191 43% 24% 21% 13% 52%
Average £2,930 13.0% 283 28% 18% 28% 25% 57%
Table 5. How practices performed by approach
Partners often ask us what small businesses are seeking in an advisor when they search for
an accountant or bookkeeper. These results show that practices that provide specialised
services and urgent care are realising the highest annual revenue per client (£4,980 and
£4,190), by offering expertise in solving challenging business problems.
However, these firms are in the middle of the pack in terms of growth. The approaches with
the highest growth rates are personal trainer/coach, tech-loving and holistic coaching.
These approaches match mentoring, coaching, and technological savviness with competitive
billing rates. They also have the most clients on a service plan or a service plan augmented
by charges for specific projects. Partners taking a ‘WeWork’ approach show a positive
combination of good growth and average annual revenue per client.
It’s clear that firms can achieve success pursuing different approaches. We encourage
practices to align their pricing and employee time-keeping strategies to support the
approach they determine is best for them.
* Some respondents use billing methods other than the four shown in table 5, which is why the percentages don’t
add up to the full 100%.

14
Client metrics for online practicesNew clients in the last 12 months
Firms with larger numbers of online accounting clients are onboarding more new clients
The factors that contribute to their success are the lower rates at which they’re able to offer
their services, and being tech savvy.
0 20 40 60 80 100
Average new clients in the last 12 months
Num
ber
of o
nlin
e cl
ient
s
100–299
300+
36–99
6–35
0–5
Figure 4. Average number of new clients in the last 12 months
“For me, the most gratifying thing
is the new work that’s coming in
purely as a result of offering Xero
to clients.”
• Paul Lodder, Sagars
“ Going from desktop stuff and
paperwork, and time sheets and all
that nonsense, and moving over to
Xero has just completely changed
how accountants work. Xero has
modernised how we do things,
and it’s moved with the times.”
• Alex Falcon-Huerta, Soaring Falcon Accountancy
Several findings, including regretted client
departures (figure 10) and practice approaches
(table 5), suggest businesses are placing a
priority on technological know-how when
choosing a new accountant or bookkeeper.

15
£0 £1,000 £2,000 £3,000 £4,000
Num
ber
of o
nlin
e cl
ient
s
Average annual revenue per small business client
300+
100–299
36–99
6–35
0-5
Annual revenue per small business client
With the exception of practices with only a few online clients, the prices firms charged were
consistent across practices. And, while those firms with fewer online clients charged higher
rates – in part to offset higher labour costs – they also experienced dramatically higher rates
of client departures (see figure 10). Evidently, price-based market forces are making it more
difficult for them.
Figure 5. Average annual revenue per small business client
Revenue contribution per employee
A substantial increase in revenue per employee is achieved as the number of online clients
increases, which can be attributed to greater employee efficiency (figure 7) and higher
advisory service revenue (figure 9).
£0 £30,000 £60,000 £90,000 £120,000
Average revenue contribution per employee
Num
ber
of o
nlin
e cl
ient
s
300+
100–299
36–99
6–35
0-5
Figure 6. Average revenue contribution per employee

16
0 10 20 30
Average number of clients per employee
Num
ber
of o
nlin
e cl
ient
s
300+
100–299
36–99
6–35
0-5
Number of clients per employee
There is a substantial increase in the ability of accountants to serve clients efficiently as the
number of online clients increases.
Figure 7. Average number of clients per employee
Increases in employee compensation
Employee compensation increases as the number of online clients grows, illustrating how the
benefits of greater revenue per employee flow on to staff. It also shows the risks to employee
compensation in firms that are slow to move their clients online.
0%
2%
4%
6%
Number of online clients
Ave
rage
em
ploy
ee c
ompe
nsat
ion
incr
ease
100–299 300+36–996–350–5
Figure 8. Average employee compensation increase in the latest review cycle in 2017 (excludes partners)

17
Advisory service revenue
As advisors get closer to their clients due to the use of online accounting, numerous
opportunities for advisory services become apparent, and they’re easier to sell and simpler
to deliver. The jump shown for partners with 300 or more clients is noticeable and suggests
that the scale of the online practice facilitates the uptake and delivery of advisory services.
£0
£400,000
£300,000
£200,000
£100,000
Number of online clients
Ave
rage
adv
isor
y se
rvic
e re
venu
e
100–299 300+36–996–350–5
Figure 9. Average advisory service revenue in the last 12 months
“ Xero moves you more to a trusted
advisor role, where clients use their
accountant for accountancy, but also
for business software, for business
software support, for talking about
KPIs.”
• Nathan Keeley, MHA Carpenter Box
“ This year we’re hoping to hit about
75% growth. But we're getting that
out of what’s still a really small team.
Xero has allowed us, in a way, to
punch above our weight from day
one because we've been able to
streamline so much. We can focus
on doing more interesting things
that make us look like a bigger
firm than we are.”
• Jonathan Bareham, Raedan

18
Regretted client departures
Practices with fewer numbers of online accounting clients have high rates of regretted client
departures. Their ability to retain desirable clients is much weaker than for practices with
larger numbers of online clients. This is one of several indicators that we see of clients
moving to firms adept at using technology and away from firms who are less tech savvy.
One of these indicators is the number of new clients who switched to a Xero partner from
another firm (see figure 1).
Figure 9. Average number of regretted client departures in the last 12 months
0% 2% 4% 6% 8% 10%
Regretted client departures
Num
ber
of o
nlin
e cl
ient
s
300+
100–299
36–99
6–35
0-5
Figure 10. Regretted client departures in the last 12 months as a percentage of total clients
“ I think that there will be firms out there
who are scared of the change. But my
view is, it's happening, and it’s going to
keep happening. And the danger is,
if you don’t move to the cloud, you will
ultimately lose clients. You may have
great relationships with them, but they'll
become more and more aware of Xero
and the apps. And if you can't deliver,
you risk losing them to someone who
can.”
• Paul Lodder, Sagars

19
Figure 9. Average number of regretted client departures in the last 12 months
£0 £30,000 £60,000 £90,000 £120,000
Average revenue per employee
% o
f clie
nts
on X
ero
98-100
60–79
80–97
10–39
40–59
1–9
None
Revenue per employee as percent of clients on Xero grows
Practices that reported that 80% or more of their clients are on Xero are also reporting
higher revenue per employee.
Figure 11. Average revenue per employee as the percent of clients on Xero increases
“ Last year we grew our client base
significantly. That surely has to be
attributable, at least in good part, to
what we’re doing with Xero and how
we’re working.”
• Neil Stevens, Bromhead Chartered Accountants

20Will Farnell, Farnell Clarke, Norwich | Xero partner

21
£0
£2,000
£4,000
£6,000
£8,000
Ave
rage
rev
enue
per
clie
nt
Compliance-only practices
Compliance + advisory practices
£4,200 £3,440
£3,550
Advisor services revenue Compliance revenue
Advisory services opportunitiesThis section explores the 2017 revenue of Xero partners. Here we aim to provide clarity
on the often debated notion of what advisory services encompass and to assist your
2018 planning.
Comparison of practices with and without advisory revenue
Practices that offer advisory services reported higher overall revenue per client, but lower
compliance revenue. When we asked partners for details, they explained that there’s a shift
to charging clients separately for advisory services, instead of simply giving these services
away to justify higher compliance billing.
Figure 12. Comparison of average revenue per client for practices with and without advisory services

22
Contribution of advisory services to revenue
We’ve extrapolated the revenue reported by participants to show the contribution of nine
different advisory services to 2017 revenue and how this would look for a firm with 250
clients.
Service
Share of advisory revenue
What revenue would look like for a firm
with 250 clients
Advisory services, eg, budgeting, cash flow forecasting,
business planning29% £259,000
Virtual or outsourced CFO services 16% £143,000
Startup mentoring, advice, and networking or assistance with business
development12% £110,000
Capital-raising/assistance moving to better interest, terms or
financing options11% £95,000
Succession planning services 10% £92,000
App/software (other than accounting) setup, configuration
and support services7% £65,000
Business performance benchmarking 6% £53,000
For-fee implementations of accounting software for businesses that are
unlikely to become long-term clients5% £40,000
HR advisory services, eg, assistance setting employee compensation,
planning to add/reduce employees 3% £30,000
Total £887,000
Table 6. Contribution of advisory services to revenue

23
Most attractive areas for firm revenue growth
This table shows the areas rated most attractive for advisory services revenue growth
in 2018.
The top opportunity is commonly known as ‘compliance plus services’. The second service
– app/software setup, configuration and support – is showing great promise for firms as an
important differentiator, something that small businesses are looking for, and a potentially
large advisory revenue opportunity. It’s also the one we’ll be watching in 2018
to see how quickly it becomes a large service line for Xero partners.
The third area – startup mentoring – reflects the importance of this large source of new
clients (see figure 1).
Service
Rated as the top service
Rated as one of the top
three
Rated as one of the
top five
Advisory services, eg, budgeting, cash flow forecasting, business planning 57% 92% 98%
App/software (other than accounting) setup, configuration and support services 12% 51% 69%
Startup mentoring, advice, and networking or assistance with
business development11% 60% 84%
Virtual or outsourced CFO services 9% 51% 72%
For-fee implementations of accounting software for businesses that are
unlikely to become long-term clients5% 30% 48%
Business performance benchmarking 3% 38% 68%
Succession planning services 2% 29% 47%
Capital-raising/assistance moving to better interest, terms or financing options 1% 30% 57%
HR advisory services, eg, assistance setting employee compensation,
planning to add/reduce employees1% 22% 32%
Table 7. Most attractive areas for firm revenue growth
“When we started working with Xero
clients, we realised that they didn’t
expect us to just engage with them
once a year. They would come to us
with a lot of questions. So we’re doing a
lot more day-to-day support, and we’re
turning that into a service as well.”
• Olly Evans, Evans & Partners

24
Ingredients for successThe survey results suggest four factors that lead to positive
outcomes and higher growth for accounting firms.
Firms that have larger numbers of online accounting clients grow faster and have an easier time signing on new clients.
“We’re winning clients.
They’re coming to us,
because we proactively
tell them about Xero.
Pretty much all of our
sales staff would say that
their conversion rates have
gone up because they can
speak about Xero and it’s
an easy win.”
• Andrew Perrett, Taylorcocks
Firms that provide advisory services earn considerably more revenue per client than firms that offer only compliance.
“Xero is an opportunity to
bring in new work, bring
in new opportunities,
and develop the advisory
side more.”
• Paul Lodder, Sagars

25
Firms that serve a larger number of online accounting clients generate significantly more revenue per employee.
“A job that might have taken
us three days to do, we can
now do in a day. That means
we can leverage our staff and
get more clients in, without
bringing in more staff.”
• Neil Stevens, Bromhead Chartered Accountants
Firms with the largest numbers of online accounting clients have the lowest rates of regretted client departures.
“Clients haven’t looked
back. They’ve loved online
accounting. I think selling it
to clients has been one of the
easiest parts, really. Xero sells
itself. And it’s really adaptable,
versatile. We’ve got lots of
different kinds of businesses
on it, using all the features.”
• Sam Howells, Lewis Ballard

26
Jon Dudgeon, Blu Sky Chartered Accountants, North Shields | Xero partner

27
Different size firms: a close-up lookIn this section, we profile different size firms, from sole practitioners to very large firms,
as measured by the number of employees and contractors they employ.
Comparison of different size firms
This table compares firms of different sizes, allowing you to see things like how your
practice’s operations, marketing and performance stack up against those of your peers.
Practice sizeNo. of
respondents
Revenue growth in
the last 12 months
No. of smaller businesses*
served in the last 12
months
% of clients
already using
online accounting
No. of new clients in
the last 12 months
Firm revenue in the last 12
months
Sole
practitioners101 10.9% 33 65% 9 £152,689
Small firms 241 16.1% 124 62% 21 £371,722
Midsize firms 78 9.5% 387 43% 42 £847,709
Large firms 65 9.5% 546 36% 52 £1,972,504
Very large firms 58 9.6% 1,006 29% 82 £8,226,425
Average 12.7% 288 53% 32 £1,417,457
* Businesses with up to 20 employees
Table 8. Averages for different size accounting firms

28
Firms by number of business
clients using online accounting
0-5 6-35 36-99
Practice profile
Number of firms participating 37 54 6
Revenue growth in the last 12 months 6.5% 14.4% 6.5%
Annual revenue per small business client £4,377 £2,453 £3,183
% of business clients using online accounting today 55% 69% 75%
Number of small business clients served in the last 12 months 8 30 75
People performance and management
Revenue per employee including contractors £78,000 £106,000 £283,000
Number of small business clients per employee 8 30 75
Employees required to complete timesheets for any purpose 11% 32% 33%
Employees required to complete timesheets for billing clients 17% 29% 33%
Number of clients talked to or chatted with online on a typical day 2.1 2.6 3.3
Practices actively looking to add staff 30% 35% 30%
Clients and marketing
Number of new clients in the last 12 months 3 11 13
Regretted client departures in the last 12 months (as a % of all clients) 9.8% 2.8% 2.3%
Marketing investment or spend in the last 12 months £400 £1,100 £2,300
Advisory revenue in the last 12 months (for all types of advisory) £28,000 £49,000 £57,000
Pricing and billing (% of clients)
Bill for the number of hours (and partial hours) of service provided 34% 39% 49%
Quote a fixed amount for a service and bill when the work is complete 37% 20% 33%
Fixed-fee monthly or quarterly service plan and automatic payment 15% 25% 15%
Monthly service plan and clients pay for additional project work 14% 15% 3%
Another method of billing 0% 0% 0%
Profile of sole practitioners
This table profiles sole practitioners according to their number of online business clients.
It shows averages for the firms in each group

29
Firms by number of business
clients using online accounting
0-5 6-35 36-99
Approach/positioning in the marketplace
WeWork shared community, talent, team 22% 21% 33%
Business mentor/counsellor 19% 19% 17%
Fast and effective service centre 19% 15% 17%
All-inclusive ‘Amazon’ shopping centre 16% 13% 17%
Specialised surgeon 13% 8% 17%
Holistic health centre 6% 8% 0%
Tech-loving accountants 3% 10% 0%
Urgent care centre 3% 6% 0%
Personal fitness trainer/coach 0% 0% 0%
Services offered
Bookkeeping 92% 93% 100%
Payroll 73% 87% 100%
Accounting 68% 65% 100%
Tax preparation 54% 65% 100%
Advisory services, eg, budgeting, cash flow forecasting,
business planning41% 57% 83%
Accounts receivable/control 38% 41% 17%
App/software (other than accounting) setup, configuration and
support services19% 35% 17%
Audit 3% 0% 0%
Table 9. Profile of sole practitioners

30
Profile of small firms
This table profiles small firms (those with 2 to 9 employees including the owner) according to
their number of online business clients. It shows averages for the firms in each group.
Firms by number of business clients
using online accounting
0-5 6-35 36-99 100-299
Practice profile
Number of firms participating 23 110 50 54
Number of employees including contractors 3.5 4.4 5.0 6.3
Revenue growth in the last 12 months 14.8% 14.8% 17.2% 17.5%
Annual revenue per small business client £4,337 £2,407 £3,084 £2,469
Business clients using online accounting today 50% 55% 70% 70%
Number of small business clients served in the
last 12 months14 97 109 227
People performance and management
Revenue per employee including contractors £41,500 £50,000 £95,000 £110,000
Number of small business clients per employee 4 22 25 44
Increase in employee compensation in most recent
cycle, excl. partners3.6% 2.6% 4.3% 4.9%
Regretted staff departures in the last 12 months
(as a % of all employees)4.3% 4.5% 8.7% 8.6%
Employees required to complete timesheets for
any purpose42% 51% 48% 47%
Employees required to complete timesheets for
billing clients43% 48% 43% 33%
Number of clients talked to or chatted with online on a
typical day2 3 3.9 5
Practices actively looking to add staff 49% 67% 69% 81%
Clients and marketing
Number of new clients in the last 12 months 5 15 23 37
New clients per employee 1.4 3.8 5.1 6.5
Regretted client departures in the last 12 months
(as a % of all clients)7.1% 4.3% 2.7% 1.5%
Marketing investment or spend in the last 12 months £1,600 £1,800 £2,900 £4,400
Advisory revenue in the last 12 months
(for all types of advisory)£69,000 £80,000 £88,000 £122,000

31
Firms by number of business clients
using online accounting
0-5 6-35 36-99 100-299
Pricing and billing (% of clients)
Bill for the number of hours (and partial hours) of
service provided21% 27% 15% 8%
Quote a fixed amount for a service and bill when the
work is complete16% 30% 23% 27%
Fixed-fee monthly or quarterly service plan and
automatic payment31% 30% 41% 33%
Monthly service plan and clients pay for additional
project work31% 13% 20% 32%
Another method of billing 2% 0% 1% 1%
Approach/positioning in the marketplace
All-inclusive ‘Amazon’ shopping centre 17% 25% 23% 33%
Business mentor/counsellor 13% 19% 26% 20%
WeWork shared community, talent, team 30% 16% 15% 12%
Specialised surgeon 22% 10% 6% 12%
Fast and effective service centre 13% 7% 4% 8%
Holistic health centre 0% 10% 13% 8%
Tech-loving accountants 4% 6% 6% 4%
Personal fitness trainer/coach 0% 8% 4% 2%
Urgent care centre 0% 1% 2% 0%
Services offered
Bookkeeping 96% 95% 96% 100%
Payroll 83% 94% 100% 98%
Accounting 74% 87% 92% 96%
Advisory services, eg, budgeting, cash flow forecasting,
business planning74% 86% 80% 96%
Tax preparation 65% 82% 92% 93%
App/software (other than accounting) setup,
configuration and support services43% 37% 48% 61%
Accounts receivable/control 48% 44% 34% 31%
Audit 4% 15% 12% 11%
Table 10. Profile of small firms

32
Profile of midsize firms
This table profiles midsize firms (those with 10 to 19 employees including the partners)
according to their number of online business clients. It shows averages for the firms
in each group..
Firms by number of business clients
using online accounting
6-35 36-99 100-299 300+
Practice profile
Number of firms participating 17 15 36 9
Number of employees including contractors 15 15 15 15
Revenue growth in the last 12 months 2.6% 8.8% 11.9% 15.8%
Annual revenue per small business client £1,559 £3,133 £1,972 £1,325
Business clients using online accounting today 14% 41% 50% 75%
Number of small business clients served in the last
12 months275 325 398 655
People performance and management
Revenue per employee including contractors £61,000 £76,000 £73,000 £80,000
Number of small business clients per employee 23.0 27.0 33.0 55.0
Increase in employee compensation in most recent
cycle, excl. partners3.1% 2.8% 4.9% 4.2%
Regretted staff departures in the last 12 months
(as a % of total employees)5.9% 11.1% 6.5% 7.4%
Employees required to complete timesheets for
any purpose82% 77% 78% 64%
Employees required to complete timesheets for
billing clients79% 69% 70% 59%
Number of clients talked to or chatted with online on a
typical day3.4 3.5 4.5 6.3
Practices actively looking to add staff 59% 64% 87% 89%
Clients and marketing
Number of new clients in the last 12 months 26 26 48 75
New clients per employee 1.7 1.7 3.2 5.0
Regretted client departures in the last 12 months
(as a % of all clients)2.4% 2.9% 1.9% 1.7%
Marketing investment or spend in the last 12 months £5,200 £6,600 £10,600 £9,300
Advisory revenue in the last 12 months
(for all types of advisory)£124,000 £163,000 £177,000 £195,000

33
Firms by number of business clients
using online accounting
6-35 36-99 100-299 300+
Pricing and billing (% of clients)
Bill for the number of hours (and partial hours)
of service provided44% 26% 16% 18%
Quote a fixed amount for a service and bill when the
work is complete32% 20% 25% 21%
Fixed-fee monthly or quarterly service plan and
automatic payment19% 24% 35% 33%
Monthly service plan and clients pay for additional
project work5% 23% 24% 28%
Another method of billing 0% 7% 0% 1%
Approach/positioning in the marketplace
All-inclusive ‘Amazon’ shopping centre 53% 29% 33% 25%
Business mentor/counsellor 13% 36% 31% 0%
Specialised surgeon 7% 14% 3% 13%
Fast and effective service centre 7% 7% 8% 13%
WeWork shared community, talent, team 20% 7% 6% 0%
Tech-loving accountants 0% 0% 6% 25%
Holistic health centre 0% 7% 8% 13%
Urgent care centre 0% 0% 0% 13%
Personal fitness trainer/coach 0% 0% 6% 0%
Services offered
Accounting 100% 100% 100% 100%
Payroll 100% 100% 97% 100%
Bookkeeping 100% 93% 100% 100%
Tax preparation 100% 100% 100% 89%
Advisory services, eg, budgeting, cash flow forecasting,
business planning100% 93% 94% 89%
Audit 76% 53% 50% 22%
App/software (other than accounting) setup,
configuration and support services29% 33% 53% 22%
Accounts receivable/control 24% 27% 33% 44%
Table 11. Profile of midsize firms

34
Profile of large firms
This table profiles large firms (those with 20 to 49 employees including the partners)
according to their number of online business clients. It shows averages for the firms
in each group.
Firms by number of business clients
using online accounting
6-35 36-99 100-299 300+
Practice profile
Number of firms participating 17 15 36 9
Number of employees including contractors 35 35 35 35
Revenue growth in the last 12 months 2.6% 8.8% 11.9% 15.8%
Annual revenue per small business client £6,400 £4,206 £2,035 £3,019
Business clients using online accounting today 14% 41% 50% 75%
Number of small business clients served in the
ast 12 months275 325 398 655
People performance and management
Revenue per employee including contractors £75,000 £93,000 £51,000 £84,000
Number of small business clients per employee 11 21 16 30
Increase in employee compensation in most recent
cycle, excl. partners2.9% 2.7% 2.5% 5.8%
Regretted staff departures in the last 12 months
(as a % of total employees)3.6% 5.9% 5.4% 4.4%
Employees required to complete timesheets for
any purpose87% 85% 92% 53%
Employees required to complete timesheets for
billing clients88% 84% 92% 48%
Number of clients talked to or chatted with online
on a typical day2.6 4.2 3.4 6.3
Practices actively looking to add staff 98% 89% 85% 97%
Clients and marketing
Number of new clients in the last 12 months 43 52 44 74
New clients per employee 1.2 1.5 1.3 2.1
Regretted client departures in the last 12 months
(as a % of all clients)2.2% 2.3% 1.9% 1.8%
Marketing investment or spend in the last 12 months £11,100 £16,400 £16,900 £21,400
Advisory revenue in the last 12 months
(for all types of advisory)£74,000 £227,000 £165,000 £387,000

35
Firms by number of business clients
using online accounting
6-35 36-99 100-299 300+
Pricing and billing (% of clients)
Bill for the number of hours (and partial hours) of
service provided26% 39% 23% 11%
Quote a fixed amount for a service and bill when the
work is complete48% 33% 40% 28%
Fixed-fee monthly or quarterly service plan and
automatic payment17% 12% 19% 33%
Monthly service plan and clients pay for additional
project work10% 16% 17% 26%
Another method of billing 0% 1% 1% 2%
Approach/positioning in the marketplace
All-inclusive ‘Amazon’ shopping centre 40% 53% 57% 45%
Business mentor/counsellor 50% 24% 13% 27%
WeWork shared community, talent, team 10% 18% 4% 0%
Tech-loving accountants 0% 0% 0% 18%
Fast and effective service centre 0% 0% 9% 9%
Specialised surgeon 0% 0% 13% 0%
Personal fitness trainer/coach 0% 6% 4% 0%
Holistic health centre 0% 0% 0% 0%
Urgent care centre 0% 0% 0% 0%
Services offered
Payroll 100% 100% 100% 100%
Bookkeeping 100% 100% 96% 100%
Accounting 90% 94% 100% 100%
Tax preparation 90% 94% 100% 100%
Advisory services, eg, budgeting, cash flow forecasting,
business planning90% 94% 96% 100%
Audit 80% 88% 88% 54%
App/software (other than accounting) setup,
configuration and support services50% 41% 46% 62%
Accounts receivable/control 50% 41% 17% 31%
Table 12. Profile of large firms

36
Profile of very large firms
This table profiles very large firms (those with 50 or more employees including the partners)
according to their number of online business clients. It shows averages for the firms in
each group.
Firms by number of business clients
using online accounting
6-35 36-99 100-299 300+
Practice profile
Number of firms participating 6 6 26 19
Number of employees including contractors 92 100 108 101
Revenue growth in the last 12 months 8% 11% 10.7% 8.4%
Annual revenue per small business client £7,292 £1,542 £5,148 £3,987
Business clients using online accounting today 10% 17% 25% 43%
Number of small business clients served in the last
12 months350 650 1038 1282
People performance and management
Revenue per employee including contractors £75,000 £54,000 £99,000 £106,000
Number of small business clients per employee 5 9 12 16
Increase in employee compensation in most recent
cycle, excl. partners3.5% 2% 3.5% 3.6%
Regretted staff departures in the last 12 months
(as a % of total employees)4.9% 4.9% 6.8% 6.9%
Employees required to complete timesheets for
any purpose81% 96% 90% 95%
Employees required to complete timesheets for
billing clients83% 86% 81% 93%
Number of clients talked to or chatted with online
on a typical day2.5 2.3 5.2 4.7
Practices actively looking to add staff 93% 83% 99% 89%
Clients and marketing
Number of new clients in the last 12 months 52 62 84 96
New clients per employee 0.6 0.7 0.8 1.0
Regretted client departures in the last 12 months
(as a % of all clients)3% 1.9% 1.8% 1.8%
Marketing investment or spend in the last 12 months £66,200 £61,500 £81,000 £74,800
Advisory revenue in the last 12 months
(for all types of advisory)£575,000 £247,000 £667,000 £591,000

37
Firms by number of business clients
using online accounting
6-35 36-99 100-299 300+
Pricing and billing (% of clients)
Bill for the number of hours (and partial hours)
of service provided34% 22% 30% 36%
Quote a fixed amount for a service and bill when the
work is complete37% 48% 42% 32%
Fixed-fee monthly or quarterly service plan and
automatic payment5% 11% 13% 15%
Monthly service plan and clients pay for additional
project work23% 19% 9% 17%
Another method of billing 2% 0% 6% 0%
Approach/positioning in the marketplace
All-inclusive ‘Amazon’ shopping centre 80% 67% 48% 41%
Business mentor/counsellor 20% 17% 20% 35%
Specialised surgeon 0% 17% 16% 24%
Tech-loving accountants 0% 0% 4% 0%
WeWork shared community, talent, team 0% 0% 4% 0%
Holistic health centre 0% 0% 4% 0%
Personal fitness trainer/coach 0% 0% 4% 0%
Urgent care centre 0% 0% 0% 0%
Fast and effective service centre 0% 0% 0% 0%
Services offered
Accounting 100% 100% 100% 100%
Payroll 100% 100% 100% 100%
Tax preparation 100% 100% 100% 100%
Bookkeeping 83% 100% 100% 100%
Advisory services, eg, budgeting, cash flow forecasting,
business planning100% 100% 96% 100%
Audit 100% 100% 96% 100%
App/software (other than accounting) setup,
configuration and support services50% 50% 54% 58%
Accounts receivable/control 33% 17% 54% 37%
Table 13. Profile of very large firms

38
How we can help Once you’ve decided that Xero is the way forward for your practice, a Xero account
manager is the perfect person to help you get going. It’s their job to help you with
every aspect of the transition to Xero, and be there for you every step of the way
If you’re not already a Xero partner, sign up to the Xero partner programme at
xero.com/partners or get in touch by emailing [email protected]
Once you’ve become a Xero partner, getting yourself and your team certified is
key to ensuring your practice understands Xero and how it can help your clients.
Our most successful partners are the ones whose teams are certified and where
everyone is singing from the same sheet. Many practices adopt a model where staff
can dedicate a percentage of their work hours (say 10%) to getting certified and
staying up to date on Xero. This quickly becomes productive, as certified staff are
much more effective when helping clients or working on Xero-related tasks in the
business.
We understand that making a significant change within your practice isn’t easy,
which is why we’ve launched migration certification. Migration certification is
perfect for the person at your practice responsible for migrating large numbers
of clients to Xero, and is filled with guidance, resources and tools to support
the switch.
Of course, you need to keep your books current when you’re changing software,
and we have several really good options to help you.
Talk to a Xero account manager today
We’re here to help, with Xero account managers and practice consultants standing
by ready to help you create a business plan for moving your practice forward in 2018
and beyond.

39

40
© 2018 Xero Limited | All rights reserved.
Xero and the Xero logo are registered trademarks of Xero Limited and its affiliates.