United Continental Holdings, Inc. - fisher.osu.edu · United Continental Holdings, Inc. is the...
19
United Continental Holdings, Inc. November 14, 2017 Summary United Continental Holdings, Inc. is the holding company that owns and operates United Airlines. United belongs to the airlines sector of the S&P 500 and is the third largest airline in the world, resulting in classification as a “major” airline by the US Department of Transportation. United competes with other major airlines and some low-cost carriers as well. In FY2016 United generated over $35.5 billion in revenue. Investment thesis United Continental is an attractive investment based on the following key drivers and catalysts: 1. Network initiatives will drive incrementally more revenue than investors are currently pricing in 2. Strategies to compete with ultra-low-cost carriers will protect United from losing market share, a fear which is far overblown by bears on the stock 3. Industry pricing will go through a period of rationalization and excess supply within the industry will be reduced 4. United has a very attractive valuation both relative to peers and on an intrinsic basis Risks As with any investment there are risks. Risks include: 1. Geopolitical threats of conflict in the Pacific 2. Macroeconomic risk of entering an economic slowdown or recession 3. A price war for an extended period with ultra-low-cost carriers $40 $50 $60 $70 $80 $90 Ticker NYSE: UAL Sector Industrials Industry Airlines Price as of 11/13/2017 $57.81 Market cap (mn) $17,126 Shares – diluted (mn) 300.6 Company Information Stock rating BUY Price target $75.00 Implied upside 29.7% Dividend yield N/A Total implied return 29.7% Recommendation 52-week high $83.04 52-week low $57.34 1-year return -8.2% 52-Week Range Performance History Fund OSU SIM (BusFin 4228) Fund manager Royce West, CFA Analyst Colin Lippincott Email [email protected] Phone (330) 814-7364 Contact Information Revenue (TTM - mn) $37,350 EPS (TTM) $7.24 EV/EBITDA 4.8x P/E 8.1x Beta 1.02 Key Statistics
Transcript of United Continental Holdings, Inc. - fisher.osu.edu · United Continental Holdings, Inc. is the...

United Continental Holdings, Inc. November 14, 2017
Summary United Continental Holdings, Inc. is the holding company that
owns and operates United Airlines. United belongs to the airlines
sector of the S&P 500 and is the third largest airline in the world,
resulting in classification as a “major” airline by the US
Department of Transportation. United competes with other
major airlines and some low-cost carriers as well. In FY2016
United generated over $35.5 billion in revenue.
Investment thesis United Continental is an attractive investment based on the
following key drivers and catalysts:
1. Network initiatives will drive incrementally more revenue
than investors are currently pricing in
2. Strategies to compete with ultra-low-cost carriers will
protect United from losing market share, a fear which is
far overblown by bears on the stock
3. Industry pricing will go through a period of rationalization
and excess supply within the industry will be reduced
4. United has a very attractive valuation both relative to
peers and on an intrinsic basis
Risks
As with any investment there are risks. Risks include:
1. Geopolitical threats of conflict in the Pacific
2. Macroeconomic risk of entering an economic slowdown
or recession
3. A price war for an extended period with ultra-low-cost
carriers
$40
$50
$60
$70
$80
$90
Ticker NYSE: UAL
Sector Industrials
Industry Airlines
Price as of 11/13/2017 $57.81
Market cap (mn) $17,126
Shares – diluted (mn) 300.6
Company Information
Stock rating BUY
Price target $75.00
Implied upside 29.7%
Dividend yield N/A
Total implied return 29.7%
Recommendation
52-week high $83.04
52-week low $57.34
1-year return -8.2%
52-Week Range
Performance History
Fund OSU SIM (BusFin 4228)
Fund manager Royce West, CFA
Analyst Colin Lippincott
Email [email protected]
Phone (330) 814-7364
Contact Information
Revenue (TTM - mn) $37,350
EPS (TTM) $7.24
EV/EBITDA 4.8x
P/E 8.1x
Beta 1.02
Key Statistics

2 | 19
Company overview ……………………………………………………………………………………………………………………………… 3
Business segments ……………………………………………………………………………………………………………………… 3
Passenger …………………………………………………………………………………………………………………………… 4
Cargo ………………………………………………………………………………………………………………………………… 4
Other operating revenue …………………………………………………………………………………………………… 5
Market landscape ………………………………………………………………………………………………………………………… 5
Market share ……………………………………………………………………………………………………………………… 5
Pricing environment …………………………………………………………………………………………………………… 5
Growth drivers …………………………………………………………………………………………………………………… 6
Recent stock news ……………………………………………………………………………………………………………………… 8
Investment thesis ………………………………………………………………………………………………………………………………… 9
Catalysts ……………………………………………………………………………………………………………………………………… 9
Network initiatives ……………………………………………………………………………………………………………… 9
New strategies to compete with ultra-low-cost carriers …………………………………………………… 10
Pricing and supply will rationalize ……………………………………………………………………………………… 12
Financial analysis and valuation ………………………………………………………………………………………………… 13
Economic analysis ……………………………………………………………………………………………………………… 13
Financial forecasts ……………………………………………………………………………………………………………… 13
Valuation …………………………………………………………………………………………………………………………… 14
Risks …………………………………………………………………………………………………………………………………………… 14
Industry risks ……………………………………………………………………………………………………………………… 14
Company-specific risks ……………………………………………………………………………………………………… 15
Conclusion …………………………………………………………………………………………………………………………………………… 15
Appendix …………………………………………………………………………………………………………………………………………… 16
Intrinsic valuation ……………………………………………………………………………………………………………………… 16
Relative valuation ……………………………………………………………………………………………………………………… 17
Income statement ……………………………………………………………………………………………………………………… 18
Airline competitors' 1-year share performance ………………………………………………………………………… 19
References ………………………………………………………………………………………………………………………………… 19
3 | 19
Company overview
United Continental is the product of numerous airline acquisitions and constant restructuring in
the airline industry dating back to 2002. In late 2002 United Airlines filed for Chapter 11
bankruptcy after post-9/11 problems including high oil prices, decreased demand, and financing
issues. The airline was able to emerge from bankruptcy in early 2006.i After years of merger talks,
United and Continental agreed on an all-stock deal that valued Continental at $3.2 billion, and
the deal closed in October 2010.ii
The company is headquartered in Chicago, IL but operates worldwide in over 190 countries.
United has major hubs in Denver, CO; Houston, TX; Los Angeles, CA; Newark, NJ; Chicago, IL; San
Francisco, CA; and Washington D.C. in the United States. Hubs in Tokyo, Japan and Guam serve
the Asian markets. Through these hubs United utilizes a “hub and spoke” system by which travels
can reach a vast number of destinations, many of which run through connections to smaller
destinations as opposed to direct flights.
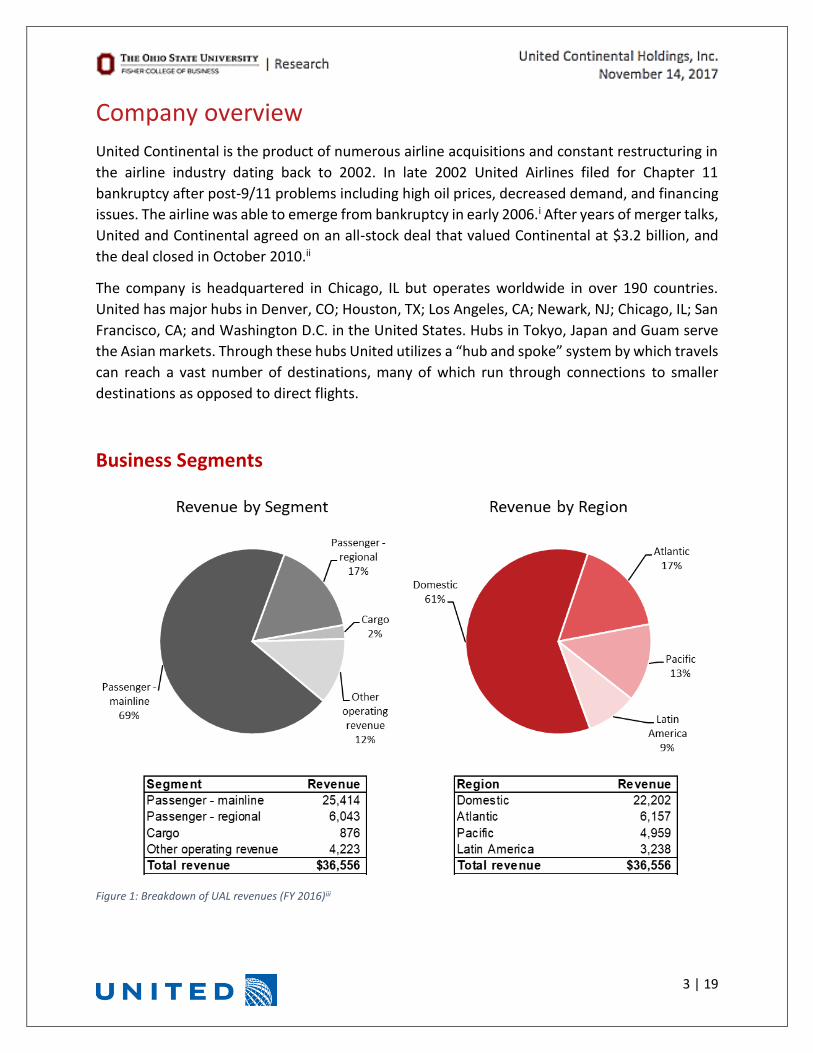
Business Segments
Figure 1: Breakdown of UAL revenues (FY 2016)iii

4 | 19
Passenger
United breaks its passenger revenue into two main categories – mainline and regional.
Mainline passengers are on longer flights that travel to large destination cities. United operates
these flights with a fleet of 737 owned and leased planes (522 owned and 215 leased). Of these
planes 579 are Boeing models while the remaining 158 are Airbus planes. Mainline flights include
flights between United hubs and international flights. Mainline flights made up 69% of company
revenue in FY2016 and 80.8% of total passenger revenue.iii
Regional flights are operated by third-party carriers under the brand name United Express to
service smaller cities that have less demand than major hubs. Regional planes have smaller
capacity, which allows United to reach areas that could not be economically served with the
mainline fleet. Additionally, regional flights are used to make connections to mainline flights.
Regional capacity accounts for approximately 11% of United’s total capacity.iii Contracts with
these third-party carriers specify that United pays all fuel costs, landing fees, facilities rent, as
well as specific rates for various operating expenses such as crew expenses, maintenance, and
aircraft ownership. Because of the short flight times, regional flights are more lucrative on a
passenger revenue per available seat mile (PRASM) basis, but capacity and air time is much less.iii
Figure 2: TTM mainline and regional statisticsiii
Cargo
Companies can ship freight and mail through United’s cargo service along both mainline and
regional routes. Cargo transportation is a very small part of United’s overall business, accounting
$26.3 $0.11
106.7
232.2 191.9
82.6%
311.7
1,813
$5.8
$0.21
40.0
27.7 22.8
82.2%
57.3
558
$32.1 $0.12 146.7
259.9214.7
82.6%
211.5 1,462
Total revenue(billions)
PRASM Passengers(millions)
Available seatmiles (billions)
RPM (billions) Load factor Available seatmiles per plane
(millions)
Average flightlength (miles)
Mainline vs. Regional Flights Key Statistics(TTM)
Mainline
Regional
Consolidated

5 | 19
for just 2% of overall operating profit. International shipments account for the largest portion of
the cargo revenue.
Other operating revenue
United’s other operating revenue comprises 12% of overall revenue. Major components of the
other revenue include third-party revenues associated with frequent flyer programs, such as
selling miles to third-party customers. Additionally, things like ticket change and booking fees are
included in other operating revenue.iii
Market Landscape
Market share
United Airlines is the fourth largest airline in North America according to the number of annual
passengers based on 2016 data. Though they are the fourth largest in terms of passengers, United
has more destinations in North America than any other airline. The huge number of destinations
ties back to the previously mentioned hub-and-spoke system that United utilizes.
Figure 3: Largest airlines in North Americaiv
Pricing environment
Because air travel is essentially a commodity at its core, it is crucial to discuss pricing environment
when evaluating investing in an airline. United competes with all of the major airlines including
America, Delta, and Southwest. Though United has not historically competed in the low-cost and
ultra-low-cost markets, the company has recently ramped up efforts to price competitively
against these carriers.
These low-cost carriers have compressed industry margins resulting in a minor price war. Prior
to the 3Q earnings call, United management pointed to an even more competitive pricing
environment than they originally expected, guiding down for a 1% decline in revenue beyond
original expectations as a result.v
Rank Airline Country Passengers - 2016 (mn) Fleet Destinations
1 American Airlines US 198.7 932 339
2 Delta Airlines US 183.7 842 322
3 Southwest Airlines US 151.7 723 101
4 United Airlines US 143.2 729 342
5 Air Canada Canada 44.8 168 182
6 Alaska Airlines US 41.9 286 118
7 JetBlue Airways US 38.3 227 97
8 WestJet Canada 22.0 119 91
9 Spirit Airlines US 21.6 95 57Source: World Atlas

6 | 19
Despite the blow to margins, United has been taking the low-cost carriers head on. On the 3Q
earnings call, management told investors that they had “made the strategic decision to compete
aggressively with ultra-low-cost carriers, which is essential to the long-term health of our
business.”vi Southwest’s chief revenue officer, Andrew Watterson, told investors at a conference
in August that, “if one or two airlines go off on a price-cutting binge, other airlines go along for
the ride,” showing the vast impact that even one airline can have on industry pricing.vii Some
investors fear pricing concerns could turn to a full-blown price war, which would turn into a war
of attrition that will squeeze margins and hurt earnings until the weakest carriers are forced into
submission by exiting unprofitable markets.
Growth drivers
Passenger growth has been relatively stable in terms of demand since the industry recovered
from the recession, though there has been an uptick in the number of passengers in the last 2-3
years. The number of domestic passengers grew at a CAGR of 2.2% from 2010-2016, and
international passengers grew at a CAGR of 4.8% based on data provided by the US Department
of Transportation.viii
Figure 4: Annual US passengersviii
One large factor playing into the number of flights taken per years is the state of the economy.
As the economy grows and consumers have more discretionary income, they are more likely to
travel for purposes like vacations. Additionally, businesses will likely be experiencing growth,
meaning employees will be flying to engage in various business activities. Stable economic
growth in recent years has benefitted airlines especially as consumer discretionary income and
spending has increased.
-10.0%
-5.0%
0.0%
5.0%
10.0%
15.0%
0
200
400
600
800
1,000
2004 2005 2006 2007 2008 2009 2010 2011 2012 2013 2014 2015 2016
% c
han
ge y
/y
Pas
sen
gers
(m
illio
ns)
Annual Airline Passengers to/from US Destination
Domestic International Domestic y/y change International y/y change

7 | 19
The US is seeing an influx in the total number of available seat miles (ASM). Available seat miles
represent total capacity for airlines as it is calculated as the number of seats on an aircraft
multiplied by the number of miles that plane flies. Load factor is the percentage of ASM that are
filled by revenue-generating passengers, a measure of utilization. The graphs below show both
domestic and international ASM and load factors for major airlines since late 2012.
Figure 5: ASM vs. load factorix
A major point to note from the graphs is the steady increase in ASM. An increase in ASM indicates
that either more airlines are entering the market, current airlines are increasing capacity by
adding planes to their fleets, or airlines are optimizing plane usage and efficiency to keep planes
in the air as much as possible. As shown by the load factor, demand had kept up with the
76.0%
78.0%
80.0%
82.0%
84.0%
50
100
150
200
250
Load
fac
tor
ASM
(b
illio
ns)
Domestic Available Seat Miles vs. Load Factor(4-quarter rolling average)
ASM Load factor
80.5%
81.0%
81.5%
82.0%
82.5%
83.0%
83.5%
70
75
80
85
90
95
100
Load
fac
tor
ASM
(b
illio
ns)
International Available Seat Miles vs. Load Factor(4-quarter rolling average)
ASM Load factor

8 | 19
increased supply in domestic market, but increased supply has outpaced demand in international
markets. As ASM has increased without an equivalent increase in demand in international
markets, a smaller percentage of seats on each flight are filled, thereby decreasing the efficiency
of each plane and failing to generate the maximum amount of revenue possible per flight.
The increased competition and decreased load factors for international travel has created issues
for United because they have historically had higher margins compared to peer when it comes
to international travel but have lagged other airlines in domestic margins. As a result, United
began an initiative to improve the yield and profitability of its fleet in the domestic market as laid
out at the investor day in November 2016, which will be discussed later.
As United built its vast network of hubs and tailored its operations to maximize profitability in
past decades, domestic markets were very saturated while international markets were not, giving
the company an operating advantage in those areas. However, after much consolidation in the
US airline industry in the mid-2000s, the domestic markets became a much more important piece
for margins, while international markets began to see margins fall as more competition entered
the market. As a result, United was on the wrong side of the new industry dynamics. United, thus,
has been focusing on a plan to turn around its domestic business to more closely mirror the
profitability of airlines like American and Delta.x
One of United’s current growth plan for domestic profitability focuses on expanding its influence
by adding more connections from small- to mid-sized cities to the crucial major hubs. For
example, United is considering adding expanding routes to Medford, OR from Las Angeles’s LAX
airport. These short flights strategically offer United a chance to connect more customers to
other destinations vast United network. Also, routes are strategically being picked to limiting the
influence of competitors in the region, as American Airlines and Allegiant Air already have routes
from places like Medford, OR to LAX.xi
Also, United has focused on growing through their Basic Economy offering, which is a new service
the company began offering in mid-2017. Basic Economy was created as an option for very price-
sensitive consumers to compete directly with ultra-low-cost carriers.x The Basic Economy offering
strips away all non-essential offerings of the flight such as in-flight beverages and overhead carry-
ons. Additionally, Basic Economy seats are more narrow and closer together, limiting leg room.
Though there were initial implementation issues with the service, the problems are being as
United adapts to optimize the market potential for the new service.
Recent stock news
United’s stock has underperformed the S&P 500 and airline peers in the past year, down
approximately 8% compared to the S&P’s returns of over 20% (see appendix for a chart of peer
performance). In the past month United had a large sell-off after reporting 3Q17 earnings on
October 18, resulting in a pullback of around 12%.

9 | 19
United actually beat on both top and bottom line earnings compared to consensus forecasts, but
management did not convince the investor community to buy into management’s long-term
growth plans for the company. There were few updates on the progress of the company’s
initiatives that it laid out at the investor day in November 2016. Though there were not
substantial updates, management did not hint at abandoning any of the plans nor did they revise
guidance for the long-term prospects of the growth plans. Accordingly, the sell-off was too drastic
and gives investors a good point to enter.
The company faced a number of headwinds in 3Q17 as they outlined at the Cowen Global
Transportation Conference in September. The company forecasted 1.5% decline in revenue from
the impact of Hurricane Harvey, which shut down operations in Houston, one of United’s largest
hubs. Also, pricing pressures from ultra-low-cost carriers shed another 2% from revenue. Ultra-
low-cost carriers not only grabbed more market share than United originally expected, but the
rollout of Basic Economy experienced trouble as the company struggled to accurately price
against the ultra-low-cost competitors initially. Management cited weakness in the Pacific region
due to oversupply in the market, macro trends, and geopolitical issues in Guam and China for a
decline of an additional 0.5% in revenue.v Though the headwinds had a severely adverse effect
on 3Q earnings, management has already addressed the issues and is working to fix issues.
Investors need to be reminded to focus on the long-term prospects of the company as opposed
to short-sighted mishaps.
Investment thesis
Catalysts
There are 3 main drivers that investors should focus on moving forward that will improve margins
and increase United’s valuation – 1) network initiatives that will drive operating efficiencies, 2)
new strategies to compete with ultra-low-cost competitors, and 3) pricing and supply
rationalization in the airline industry. United’s long-term potential is underappreciated, and all
three of these growth drivers will benefit United’s performance by more than the market is giving
the company credit for.
Network initiatives
In 2015-2016 United’s management and board room were shaken up and went through a series
of new changes as activist investors Par Capital and Altimeter Capital took stakes in the airline.xii
Scott Kirby, an industry veteran with a proven track record of success, was then hired from
American Airlines as president to provide a fresh perspective for the company.
In November 2016 Kirby introduced a number of initiatives the company would undertake to
increase efficiency of the company’s assets including improving upon the hub-and-spoke system
that United utilizes.
10 | 19
The hub-and-spoke system means that many customers fly from small cities to large hubs and
then on to the rest of the world. These connecting flights are critical for United to service
customers to their final destination, which are often times high margin trips. Though connections
are vital, the company had very few initiatives in place to maximize the number of possible
connections.
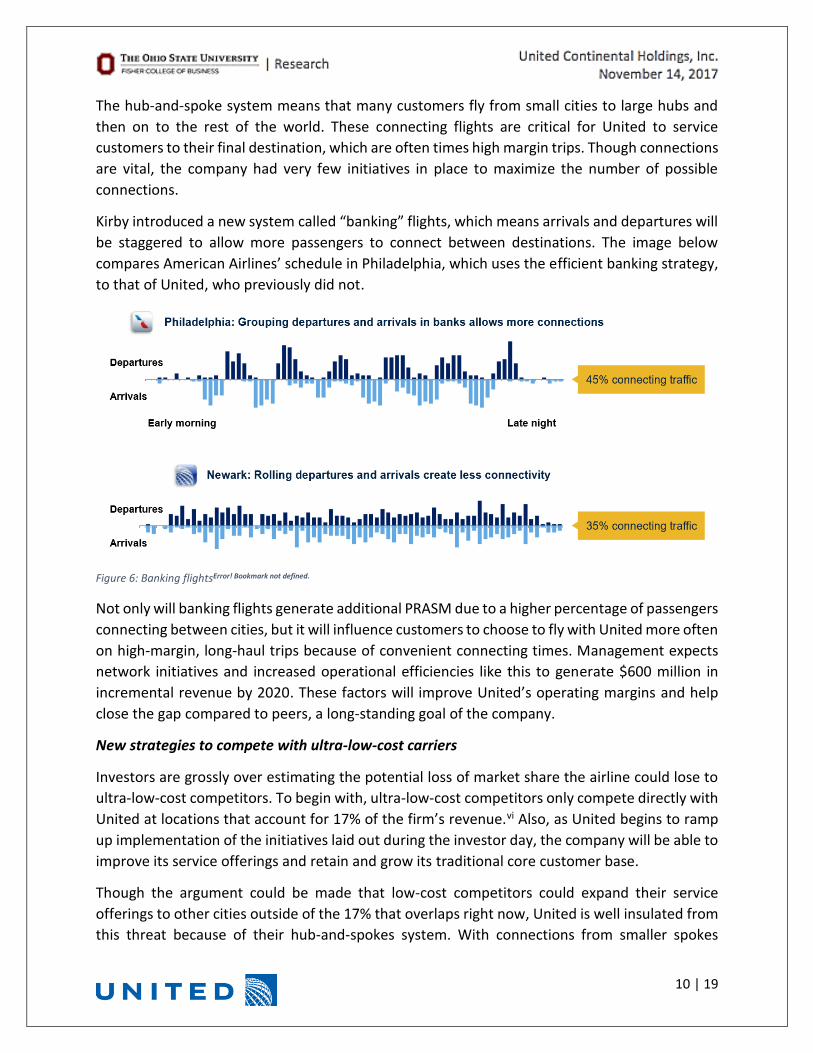
Kirby introduced a new system called “banking” flights, which means arrivals and departures will
be staggered to allow more passengers to connect between destinations. The image below
compares American Airlines’ schedule in Philadelphia, which uses the efficient banking strategy,
to that of United, who previously did not.
Figure 6: Banking flightsError! Bookmark not defined.
Not only will banking flights generate additional PRASM due to a higher percentage of passengers
connecting between cities, but it will influence customers to choose to fly with United more often
on high-margin, long-haul trips because of convenient connecting times. Management expects
network initiatives and increased operational efficiencies like this to generate $600 million in
incremental revenue by 2020. These factors will improve United’s operating margins and help
close the gap compared to peers, a long-standing goal of the company.
New strategies to compete with ultra-low-cost carriers
Investors are grossly over estimating the potential loss of market share the airline could lose to
ultra-low-cost competitors. To begin with, ultra-low-cost competitors only compete directly with
United at locations that account for 17% of the firm’s revenue.vi Also, as United begins to ramp
up implementation of the initiatives laid out during the investor day, the company will be able to
improve its service offerings and retain and grow its traditional core customer base.
Though the argument could be made that low-cost competitors could expand their service
offerings to other cities outside of the 17% that overlaps right now, United is well insulated from
this threat because of their hub-and-spokes system. With connections from smaller spokes

11 | 19
making up a significant portion of the traffic the company deals with in major hubs, it would be
nearly impossible for ultra-low-cost competitors to enter the small markets that feed these
connections. Low-cost-carriers require route density and high traffic to be profitable, so they
would not be able to service the same clients that United does.
As mentioned before, United recently ramped up its head-to-head competition with ultra-low-
cost carriers through increased flight segmentation, which is the strategy behind their new Basic
Economy offering. When Basic Economy offerings began rolling out this year, the company had
little experience forecasting pricing at these levels and initially struggled to gain customer
traction. Though the initial implementation faced headwinds, that does not mean these
headwinds will last forever, but investors are incorrectly pricing the stock as if it will continue to
bleed market share to ultra-low-cost carriers.
In addition to segmentation with the Basic Economy offerings, United is competing through their
efforts of upgauging and re-fleeting their airplanes. Upgauging is the process of adding more seat
on each airplane, which thus reduces the cost per available seat mile, or CASM. These efforts go
hand-in-hand with Basic Economy offerings, as the seats in the new class are smaller and closer
together. PRASM is also slightly reduced as a result because of cheaper ticket prices, but the
decrease in CASM far outweighs the reduction in fair, making it a profitable move.
Re-fleeting is the process of retiring older planes and upgrading to newer, more fuel-efficient
planes. This will allow United to keep costs lower even in times of rising fuel prices, further
increasing its competitive leverage against ultra-low-cost carriers.
Not only will these strategies help United avoid losing customers to low-cost competitors, it could
become a source of taking additional market share. Management expects segmentation, re-
fleeting, and upgauging to generate $2 billion in revenue by 2020, offering further upside for the
case of United’s improving margins. Though United is in a good long-term position to compete
with ultra-low-cost carriers, many investors have overestimated the potential threat these
competitors pose. The market is misevaluating and mispricing United’s positioning as a result.
Below is a complete table of initiatives announced at the November 2016 investor day.
Figure 7: Company initiatives from November 2016 investor dayx
Commercial enhancements 2017E 2018E 2019E 2020E
Network initiatives 100 300 450 600
Re-fleeting and upguage 700 800 900 1,000
Segmentation 200 550 700 1,000
MileagePlus enhancements 100 300 300 300
Revenue management improvements 100 400 700 900
Total 1,200 2,350 3,050 3,800Mil l ions of dol lars
Earnings Initiatives from November 2016 Investor Day

12 | 19
Pricing and supply will rationalize
Pricing on both domestic and international flights has not been consistently rational among the
major airlines as airlines have focuses on winning customers instead of maximizing profits. Firms
like Frontier will eventually need to rationalize their pricing models to focus more on profitability.
Figure 8: Pricing power of airlinesix
The graph above shows historic pricing power that airlines have had in recent years. Since 2016
pricing power has eroded greatly as a glut of supply has entered the market despite relatively
small increases in consumer demand.
Notable supply has entered into the Pacific market as Asian airlines have begun to compete more
heavily with domestic airlines. Recall the previous graph of rising ASM while average load factor
was falling, which compresses margins. Already this year Island Air, a Hawaiian airline, filed for
bankruptcy as the company was struggling to find enough demand to meet the financial
requirements to maintain its fleet among other problems.
The industry should see a necessary wave of consolidation similar to that of the mid-2000s US
consolidation. International carriers, mainly in the Pacific, will likely see an increase in M&A
activity or forced mergers with failing airlines to bring supply back to an equilibrium. With
industry consolidation, supply will be reduced, pricing power will increase, and margins will be
bolstered. Though this will benefit all major airlines, United has particularly high exposure to
international markets and specifically to the Pacific market, so they would benefit the most from
Pacific consolidation.
-6.0%
-4.0%
-2.0%
0.0%
2.0%
4.0%
6.0%
8.0%
10.0%
Decreased Pricing Power of Domestic Airlines(4-quarter rolling average)

13 | 19
Financial analysis & valuation
Economic analysis
Airline stocks are very cyclical and perform poorly during recessions. Since the Great Recession
in 2008 the United States has had one of the longest periods of economic growth in history, and
there are several promising signs that the growth may be able to continue.
Jerome Powell, who is nominated to serve as the next Chair of the Federal Reserve, is likely to
continue the dovish policies that Janet Yellen had in place in recent years. The Fed’s dovish
outlook and pro-growth tone will hopefully extend the recovery period.
Figure 9: WTI spot prices Jan. 2014 - Nov. 2017
Profit margins in the airline industry are heavily dependent on fuel prices, which have been
relatively stable in the past calendar year, as shown in the above graph. Oil has climbed slightly
higher in recent weeks, but it has continued to trade in the mid-$50 range, which provides airlines
with enough room for profit recognition. There are not currently expectations for oil prices to
jump sharply soon. Airlines have been taking actions to combat sharp swings in earnings from
volatile oil prices by hedging costs and re-fleeting with more fuel-efficient airplanes.
Financial forecasts
United’s income statement projections center around revenue growth and margin
improvements. Revenue will continue to grow and margins will improve as United improves its
network’s operational efficiencies, Basic Economy and upgauging improvements take root, and
industry supply and pricing rationalize.
The model reflects management’s stated goal of narrowing the margin gap between United and
carriers like Delta, which is very possible with the new strategies they are implementing. A
comparison of United’s EBIT margins to other major airlines can be found in the appendix. The
board has put in place management with a proven history of success within the airline industry,
and they have the tools necessary to make United much more competitive with industry peers.
$0
$20
$40
$60
$80
$100
$120
WTI Cost Per Barrel

14 | 19
Valuation
Figure 10: Target price ranges based on discounted cash flow analysis and comparable companies analysis
The most attractive part of United’s story from an investment perspective is the company’s
current valuation. After falling sharply on 3Q17 earnings, investors should view the recent
pullback in the stock as a great entry point.
United is mispriced intrinsically based on a discounted cash flow analysis. A long-term growth
rate of 3% and a final-year exit multiple of 5.5x were both used in evaluating the company. The
base-case DCF analysis resulted in an implied share price of $71.
Trading at a forward EV/EBITDA of 4.8x, below comparable companies’ median 5.5x, the stock is
cheap on a relative basis as well. As margins improve, United’s valuation multiples will expand to
be closer in line with peers, which will be reflected by a higher share price. A comparable
companies analysis produced a base-case valuation of $80.
The target price of $75 is based on a 60% weighting given to the DCF valuation and 40% weighting
to a forward EV/EBITDA multiple of 5.5x.
Full intrinsic and relative valuation models are in the appendix on pages 16 and 17, respectively.
Risks
Industry risks
One risks to the investment thesis includes geopolitical risks. Should international tensions flare,
consumers will be much less likely to travel internationally. Traffic to Guam and China have
already seen an impactful decline in the past quarter due to threats from North Korea. Should
these North Korean threats continue or should any type of conflict break out in the Pacific, it will
negatively impact all carriers that operate in the Pacific.
$57.34
$69.17 $69.93
$83.04 $79.89
$84.20
$40
$50
$60
$70
$80
$90
$100
52 Week Trading Range DCF Comps
United Valuation Summary - $75 Price Target
Target Price - $75.00
Current Price - $57.81

15 | 19
Oil prices pose a risk to the airline industry as a whole, as well. If oil prices see a sharp rise, the
entire industry’s margins will suffer. Within the past decade oil prices peaked as high as the mid-
$140s, which crushed airline margins. Many airlines came under financial distress due to high
debt levels and unprofitable operations. Should oil increase to those levels again, margin
expansion will become nearly impossible and the industry will be very adversely affected.
As the industry is very cyclical, a recession would hurt airlines more than it would hurt defensive
stocks. With such a prolonged recovery and period of expansion since the 2008 recession, some
argue that the business cycle is reaching its latest stages before another downtown. Consumer
and business travel would decline as a result of decreased economic activity, and airlines would
lose pricing pressure and load factors would fall as demand declined.
Company-specific risks
The company faces the risk of implementation failure from current initiatives. Should
management fail to integrate initiatives such as flight banking into the operations, margins will
not benefit as forecasted and United will likely continue to trade at a discount to peers.
Should a pricing war ensue for an extended period of time between United and ultra-low-cost
carriers, margins and profitability will be hurt as fare prices erode. With the new Basic Economy
segment designed to compete head-to-head with these carriers, a price war is possible.
Also, there is a threat that Basic Economy will not catch on with United’s core customers.
Upgauging a large selection of planes then being forced to revert the same planes back to
traditional layouts with larger seats and more leg room would be very expensive because it would
force planes to be out of operation for extended periods of time. Also, fewer passengers would
fly on each flight if customers decide it is worth the incremental expense to avoid flying Basic
Economy and choose to book with another airline, which would reduce load factors and PRASM.
Should more supply continue to enter the Pacific market, United would be hurt more than other
airlines. United has more exposure to China than other domestic airlines, so rationalization of
supply in the Pacific is important for their success in the region.
Conclusion
BUY United Continental Holdings, Inc. (NYSE: UAL) with a target price of $75 and implied
upside of 29.7%.
The bottom line of United’s story is based on the idea of margin expansion and cheap valuation.
Investors want to own the stock now before 1) United ramps the implementation of the new
management team’s initiatives in 4Q17 and 1H18, 2) investors realize fears of ULCC
competition are overblown, and 3) industry pricing and demand rationalize. These growth
drivers and the attractive valuation make United a strong BUY for investors.

16 | 19
Appendix
Intrinsic valuation
UAL Discounted Cash Flow Analysis
2017E 2018E 2019E 2020E 2021E 2022E 2023E 2024E 2025E 2026E
Sales 36,556$ 37,360$ 38,407$ 39,488$ 40,594$ 41,730$ 42,899$ 44,143$ 45,423$ 46,785$ 48,189$
% growth 2.2% 2.8% 2.8% 2.8% 2.8% 2.8% 2.9% 2.9% 3.0% 3.0%
EBITDA 6,127 6,760 7,266 7,632 8,471 9,137 9,844 10,220 10,527 10,843
% margin 16.4% 17.6% 18.4% 18.8% 20.3% 21.3% 22.3% 22.5% 22.5% 22.5%
D&A 1,943 2,074 2,290 2,436 3,130 3,646 4,194 4,315 4,445 4,578
% sales .00% 5.2% 5.4% 5.8% 6.0% 7.5% 8.5% 9.5% 9.5% 9.5% 9.5%
EBIT 4,184 4,686 4,975 5,196 5,341 5,491 5,650 5,905 6,082 6,265
% margin 11.2% 12.2% 12.6% 12.8% 12.8% 12.8% 12.8% 13.0% 13.0% 13.0%
Taxes 1,465 1,640 1,741 1,819 1,870 1,922 1,978 2,067 2,129 2,193
After-Tax EBIT 2,720 3,046 3,234 3,377 3,472 3,569 3,673 3,838 3,953 4,072
Plus: D&A 1,943 2,074 2,290 2,436 3,130 3,646 4,194 4,315 4,445 4,578
Less: CapEx 4,707 3,533 3,593 3,856 3,964 4,075 4,194 4,315 4,445 4,578
Less: Inc./(Dec.) in NWC 22 42 83 86 88 90 93 96 99 102
Unlevered Free Cash Flow (67) 1,545 1,848 1,871 2,549 3,050 3,580 3,742 3,855 3,970
WACC 11.0%
Discount Period 1.0 2.0 3.0 4.0 5.0 6.0 7.0 8.0 9.0 10.0
Present Value of Free Cash Flow (60) 1,254 1,351 1,232 1,513 1,630 1,724 1,624 1,507 1,398
Projected Period Value $11,775
Terminal Value - Perpetual Growth
Growth rate in perpetuity 3.0% EV/EBITDA exit multiple 5.5x
Terminal value $19,401 Terminal value $21,002
Terminal value as % of EV 62.2% Terminal value as % of EV 64.1%
Enterprise Value and Share Price Enterprise Value and Share Price
Enterprise value $31,176 Enterprise value $32,777
Less: Net debt $9,615 Less: Net debt $9,615
Equity value $21,561 Equity value $23,162
Shares outstanding 301 Shares outstanding 301
Implied share price $71.73 Implied share price $77.05
Implied upside from current 24.1% Implied upside from current 33.3%
Implied Share Price Sensitivity Analysis - Perpetual Growth Implied Share Price Sensitivity Analysis - Exit Multiple
WACC WACC
$71.73 10.0% 10.5% 11.0% 11.5% 12.0% $77.05 10.0% 10.5% 11.0% 11.5% 12.0%
2.0% $78.62 $70.86 $64.00 $57.88 $52.40 4.5x $71.86 $68.02 $64.35 $60.85 $57.49
2.5% $83.60 $75.11 $67.64 $61.02 $55.13 5.0x $78.81 $74.66 $70.70 $66.92 $63.30
3.0% $89.30 $79.91 $71.73 $64.53 $58.15 5.5x $85.76 $81.31 $77.05 $72.99 $69.11
3.5% $95.87 $85.41 $76.36 $68.48 $61.54 6.0x $92.72 $87.95 $83.41 $79.06 $74.91
4.0% $103.54 $91.75 $81.66 $72.95 $65.35 6.5x $99.67 $94.60 $89.76 $85.14 $80.72
Implied Upside Sensitivity Analysis - Perpetual Growth Implied Upside Sensitivity Analysis - Exit Multiple
WACC WACC
10.0% 10.5% 11.0% 11.5% 12.0% 10.0% 10.5% 11.0% 11.5% 12.0%
2.0% 36.0% 22.6% 10.7% 0.1% (9.4%) 4.5x 24.3% 17.7% 11.3% 5.3% (0.5%)
2.5% 44.6% 29.9% 17.0% 5.6% (4.6%) 5.0x 36.3% 29.2% 22.3% 15.8% 9.5%
3.0% 54.5% 38.2% 24.1% 11.6% 0.6% 5.5x 48.4% 40.6% 33.3% 26.3% 19.5%
3.5% 65.8% 47.7% 32.1% 18.5% 6.5% 6.0x 60.4% 52.1% 44.3% 36.8% 29.6%
4.0% 79.1% 58.7% 41.3% 26.2% 13.0% 6.5x 72.4% 63.6% 55.3% 47.3% 39.6%
Perpetual
growth
EV/EBITDA
multiple
Perpetual
growth
EV/EBITDA
multiple

17 | 19
Relative valuation
Figure 11: Relative valuationix
Figure 12: United's margin gap vs. peersxiii
Comparable companies analysis
Name Ticker
Market
Cap (bn)
Dividend
Yield
Price/
Earnings
EV/
EBITDA
EV/
Revnue
Delta Airlines DAL $34.7 1.9% 10.1x 4.8x 1.0x
American Airlines AAL $21.7 0.9% 9.4x 6.2x 0.9x
Alaska Air Group ALK $7.6 1.9% 8.8x 4.9x 1.0x
Copa Holdings CPA $5.2 1.6% 15.6x 8.4x 2.0x
Average 1.6% 11.0x 6.0x 1.2x
Median 1.8% 9.7x 5.5x 1.0x
United Continental UAL $17.6 - 8.1x 4.8x 0.7x
Enterprise value and share price Implied Share Price Sensitivity Analysis - Comparable Companies
EV/EBTIDA multiple 5.5x EBITDA
Enterprise value $33,699 $80.12 $5,514 $5,821 $6,127 $6,433 $6,740
Less: Net debt $9,615 4.5x $50.56 $55.15 $59.74 $64.32 $68.91
Equity value $24,084 5.0x $59.74 $64.83 $69.93 $75.02 $80.12
Shares outstanding 301 5.5x $68.91 $74.51 $80.12 $85.72 $91.33
Implied share price $80.12 6.0x $78.08 $84.20 $90.31 $96.42 $102.54
Implied upside from current 38.6% 6.5x $87.25 $93.88 $100.50 $107.13 $113.75
Implied Upside Sensitivity Analysis - Comparable Companies
EBITDA
$5,514 $5,821 $6,127 $6,433 $6,740
4.5x (12.5%) (4.6%) 3.3% 11.3% 19.2%
5.0x 3.3% 12.1% 21.0% 29.8% 38.6%
5.5x 19.2% 28.9% 38.6% 48.3% 58.0%
6.0x 35.1% 45.6% 56.2% 66.8% 77.4%
6.5x 50.9% 62.4% 73.8% 85.3% 96.8%
EV/
EBITDA
EV/
EBITDA
0.0%
5.0%
10.0%
15.0%
20.0%
25.0%
30.0%
2014 2015 2016 1Q17 2Q17 3Q17E 4Q17E
United Margin Gap vs. Industry Peers(EBIT Margin excluding hedging)
Southwest Delta American United

18 | 19
UAL - Income Statement
(numbers in millions except per share data) 2019E 2018E 2017E 2016 2015 2014 2013 2012
Operating revenue:
Passenger - mainline 27,636 26,831 26,049 25,414 26,333 26,785 25,997 25,804
Passenger - regional 6,700 6,442 6,194 6,043 6,452 6,977 7,125 6,779
Total passenger revenue 34,335 33,273 32,243 31,457 32,785 33,762 33,122 32,583
Cargo 930 911 894 876 937 938 882 1,018
Other operating revenue 4,223 4,223 4,223 4,223 4,142 4,201 4,275 3,551
Total operating revenue 39,488 38,407 37,360 36,556 37,864 38,901 38,279 37,152
Consensus 39,960 39,382 37,891
Operating expense:
Salaries and related costs 11,215 10,984 10,984 10,275 9,713 8,935 8,625 7,945
Aircraft fuel 7,147 6,952 6,725 5,813 7,522 11,675 12,345 13,138
Regional capacity purchase 2,369 2,304 2,242 2,197 2,290 2,344 2,419 2,470
Landing fees and other rent 2,172 2,112 2,055 2,165 2,203 2,274 2,090 1,929
Depreciation and amortization 1,777 1,728 1,681 1,977 1,819 1,679 1,689 1,522
Aircraft maintenance materials and outside repairs 1,895 1,844 1,793 1,749 1,651 1,779 1,821 1,760
Distribution expenses 1,422 1,383 1,345 1,303 1,342 1,373 1,390 1,352
Aircraft rent 711 691 672 680 754 883 936 993
Special charges 671 653 635 638 326 443 520 1,323
Other operating expenses 5,133 5,070 5,044 5,421 5,078 5,143 5,195 4,681
Total operating expenses 34,512 33,721 33,176 32,218 32,698 36,528 37,030 37,113
Operating income 4,975 4,686 4,184 4,338 5,166 2,373 1,249 39
Non-operating income (expense):
Interest expense (592) (576) (598) (614) (669) (735) (783) (835)
Interest capitalized 79 77 75 72 49 52 49 37
Interest income 39 38 37 42 25 22 21 23
Miscellaneous, net 0 0 0 (19) (352) (584) 3 12
Total non-operating income (expense) (474) (461) (486) (519) (947) (1,245) (710) (763)
Income before income taxes 4,502 4,225 3,699 3,819 4,219 1,128 539 (724)
Income tax expense (benefit) 1,576 1,479 1,295 1,556 (3,121) (4) (32) (1)
Net income 2,926 2,746 2,404 2,263 7,340 1,132 571 (723)
EPS 8.87 8.32 7.29 6.86 19.52 3.05 1.64 (2.18)
EPS, diluted 8.86 8.31 7.28 6.85 19.47 2.93 1.53 (2.18)
Shares outstanding
Basic 329.9 329.9 329.9 329.9 376.1 371.1 348 331
Diluted 330.3 330.3 330.3 330.3 376.9 389.7 391 331
Cash, equivalents, and short-term investments 4,462 4,340 4,296 4,428 5,196 4,384 5,121 6,543
% of sales 11.3% 11.3% 11.5% 12.1% 13.7% 11.3% 13.4% 17.6%
Receivables 1,264 1,229 1,196 1,176 1,128 1,146 1,503 1,338
% of sales 3.2% 3.2% 3.2% 3.2% 3.0% 2.9% 3.9% 3.6%
Inventory 671 730 747 873 738 666 667 695
% of sales 1.7% 1.9% 2.0% 2.4% 1.9% 1.7% 1.7% 1.9%
Payables 2,172 2,112 2,055 2,139 1,869 1,882 2,087 2,312
% of sales 5.5% 5.5% 5.5% 5.9% 4.9% 4.8% 5.5% 6.2%
Change in WC 83 42 22 87 (67) 153 (362) -
D&A 2,290 2,074 1,943 1,977 1,819 1,679 1,689 1,522
% of sales 5.8% 5.4% 5.2% 5.4% 4.8% 4.3% 4.4% 4.1%
CapEx 3,593 3,533 4,707 3,223 2,747 2,005 2,164 2,016
% of sales 9.1% 9.2% 12.6% 8.8% 7.3% 5.2% 5.7% 5.4%
Sales growth:
Passenger - mainline 3.0% 3.0% 2.5% (3.5%) (1.7%) 3.0% 0.7% -
Passenger - regional 4.0% 4.0% 2.5% (6.3%) (7.5%) (2.1%) 5.1% -
Total passenger revenue 3.2% 3.2% 2.5% (4.1%) (2.9%) 1.9% 1.7% -
Cargo 2.0% 2.0% 2.0% (6.5%) (0.1%) 6.3% (13.4%) -
Other operating revenue 0.0% 0.0% 0.0% 2.0% (1.4%) (1.7%) 20.4% -
Total operating revenue 2.8% 2.8% 2.2% (3.5%) (2.7%) 1.6% 3.0% -
Operating expenses as % of sales:
Salaries and related costs 28.4% 28.6% 29.4% 28.1% 25.7% 23.0% 22.5% 21.4%
Aircraft fuel 18.1% 18.1% 18.0% 15.9% 19.9% 30.0% 32.3% 35.4%
Regional capacity purchase 6.0% 6.0% 6.0% 6.0% 6.0% 6.0% 6.3% 6.6%
Landing fees and other rent 5.5% 5.5% 5.5% 5.9% 5.8% 5.8% 5.5% 5.2%
Depreciation and amortization 4.5% 4.5% 4.5% 5.4% 4.8% 4.3% 4.4% 4.1%
Aircraft maintenance materials and outside repairs 4.8% 4.8% 4.8% 4.8% 4.4% 4.6% 4.8% 4.7%
Distribution expenses 3.6% 3.6% 3.6% 3.6% 3.5% 3.5% 3.6% 3.6%
Aircraft rent 1.8% 1.8% 1.8% 1.9% 2.0% 2.3% 2.4% 2.7%
Special charges 1.7% 1.7% 1.7% 1.7% 0.9% 1.1% 1.4% 3.6%
Other operating expenses 13.0% 13.2% 13.5% 14.8% 13.4% 13.2% 13.6% 12.6%
Total operating expenses 87.4% 87.8% 88.8% 88.1% 86.4% 93.9% 96.7% 99.9%
Operating margin 12.6% 12.2% 11.2% 11.9% 13.6% 6.1% 3.3% 0.1%
Non-operating expenses as % of sales:
Interest expense (1.5%) (1.5%) (1.6%) (1.7%) (1.8%) (1.9%) (2.0%) (2.2%)
Interest capitalized 0.2% 0.2% 0.2% 0.2% 0.1% 0.1% 0.1% 0.1%
Interest income 0.1% 0.1% 0.1% 0.1% 0.1% 0.1% 0.1% 0.1%
Miscellaneous, net 0.0% 0.0% 0.0% (0.1%) (0.9%) (1.5%) 0.0% 0.0%
Total non-operating income (expense) (1.2%) (1.2%) (1.3%) (1.4%) (2.5%) (3.2%) (1.9%) (2.1%)
Pretax Margin 11.4% 11.0% 9.9% 10.4% 11.1% 2.9% 1.4% (1.9%)
Tax rate 35.0% 35.0% 35.0% 40.7% (74.0%) (0.4%) (5.9%) 0.1%
Net income margin 7.4% 7.2% 6.4% 6.2% 19.4% 2.9% 1.5% (1.9%)

19 | 19
Figure 13: Airline stock performancexiv
Referneces i https://usatoday30.usatoday.com/travel/flights/2006-02-01-united-timeline_x.htm ii https://www.reuters.com/article/us-ual-continental/ual-and-continental-shareholders-approve-merger-idUSTRE68G3VM20100917 iii Company filings iv http://www.worldatlas.com/articles/which-are-the-largest-airlines-in-north-america.html v Cowen and Company Global Transportation Conference vi 3Q Earnings call vii https://www.bloomberg.com/news/articles/2017-08-29/united-s-fare-cuts-spread-fueling-risk-of-new-airline-price-war viii https://www.rita.dot.gov/bts/press_releases/bts017_17 ix Bloomberg x United Investor Day, November 15, 2016 xi https://www.flightglobal.com/news/articles/united-plans-more-feeder-flights-at-los-angeles-441829/ xii http://www.reuters.com/article/us-ual-shareholders/two-united-airlines-investors-raise-stakes-to-influence-company-idUSKCN0V5005 xiii Barclays research, “It’s All About Trust” xiv Yahoo Finance
-20%
-10%
0%
10%
20%
30%
40%
50%
Airline Competitors' 1-year Share Performance
UAL AAL
DAL LUV
LUV 18.4%
AAL 6.3%
DAL 4.4%
UAL -8.2%