UNIT V MICROWAVE ANTENNAS AND MEASUREMENTS
22
UNIT V MICROWAVE ANTENNAS AND MEASUREMENTS Horn antenna and its types, micro strip and patch antennas. Network Analyzer, Measurement of VSWR, Frequency and Power, Noise, cavity Q, Impedance, Attenuation, Dielectric Constant and antenna gain. ------------------------------------------------------------------------------------------------------------------------------- DEFINITION: A conductor or group of conductors used either for radiating electromagnetic energy into space or for collecting it from space.or Is a structure which may be described as a metallic object, often a wire or a collection of wires through specific design capable of converting high frequency current into em wave and transmit it into free space at light velocity with high power (kW) besides receiving em wave from free space and convert it into high frequency current at much lower power (mW). Also known as transducer because it acts as coupling devices between microwave circuits and free space and vice versa. Electrical energy from the transmitter is converted into electromagnetic energy by the antenna and radiated into space. On the receiving end, electromagnetic energy is converted into electrical energy by the antenna and fed into the receiver. Basic operation of transmit and receive antennas.
Transcript of UNIT V MICROWAVE ANTENNAS AND MEASUREMENTS

UNIT V MICROWAVE ANTENNAS AND MEASUREMENTS Horn antenna and its types, micro strip and patch antennas. Network Analyzer, Measurement of VSWR, Frequency and Power, Noise, cavity Q, Impedance, Attenuation, Dielectric Constant and antenna gain.
-------------------------------------------------------------------------------------------------------------------------------
DEFINITION:
A conductor or group of conductors used either for radiating electromagnetic energy
into space or for collecting it from space.or Is a structure which may be
described as a metallic object, often a wire or a collection of wires through specific
design capable of converting high frequency current into em wave and transmit it into
free space at light velocity with high power (kW) besides receiving em wave from free
space and convert it into high frequency current at much lower power (mW). Also
known as transducer because it acts as coupling devices between microwave circuits
and free space and vice versa. Electrical energy from the transmitter is converted into
electromagnetic energy by the antenna and radiated into space. On the receiving end,
electromagnetic energy is converted into electrical energy by the antenna and fed into
the receiver.
Basic operation of transmit and receive antennas.

Transmission - radiates electromagnetic energy into space
Reception - collects electromagnetic energy from space
In two-way communication, the same antenna can be used for transmission and
reception. Short wavelength produced by high frequency microwave, allows the usage
of highly directive antenna. For long distant signal transmission, the usage of antenna
at microwave frequency is more economical. Usage of waveguide is suitable for short
distant signal transmission.
TYPES OF MICROWAVE ANTENNAS
Horn / aperture antenna
Paraboloid / dish antenna
Dipole antenna
Slotted (leaky-wave) antenna
Dielectric lens antenna
Printed (patch or microstrip) antenna
Phase Array antenna
HORN / APERTURE ANTENNA
Like parabolic reflectors, you can use HORN RADIATORS to obtain directive radiation
at microwave frequencies. Because they do not use resonant elements, horns have the
advantage of being useful over a wide frequency band. The operation of a horn as an rf
radiating device is similar to that of an automobile horn radiating sound waves.
However, the throat of an automobile horn usually is sized much smaller than the sound
wavelengths for which it is used. The throat of the rf radiating horn is sized to be
comparable to the wavelength being used. Horn radiators are used with waveguides
because they serve both as an impedance-matching device and as a directional
radiator. Horn radiators may be fed by coaxial and other types of lines. Horn radiators
are constructed in a variety of shapes, as illustrated in figure 3-9. The shape of the horn
determines the shape of the field pattern. The ratio of the horn length to the size of its
mouth determines the beam angle and directivity. In general, the larger the mouth of the
horn, the more directive is the field pattern.

Horn antenna is used to provide a gradual flare at the end of the waveguide,
thus producing maximum radiation into space with minimum reflection back to
the source
Because of impedance mismatch, the horn is tapered in one dimension to a
rectangular shape as shown in Figure 4 (a) and (b), thus produce an impedance
matching between the waveguide and that of the impedance of free space. Horn
tapered / flared in the E or H planes are called sectoral horn. If flared in E and H
plane (2 dimensions) it is called a pyramidal horn. A circular waveguide can be
matched to free space with conical taper as shown in Figure 4 (d) and is called
conical horn antenna.
Higher gain and directivity – for longer horn dimension.
Enhance performance when use together with parabolic reflector.
Its narrow beam angle caused increase in antenna gain.
WAVEGUIDE AS A TRANSMITTER
RF energy reaching the open end of a
waveguide will be partly radiated into
space and partly reflected back into the
waveguide because the end is not well
matched to free space so VSWR will
result.
Produce a weak and tidak berarah
radiation pattern due to refraction
around the open ends.
BASIC HORN ANTENNA
Used to overcome the problem facing by
an open ended waveguide. (i.e to avoid
mismatch).
Directivity improved and diffraction
reduced.

Difference types of Horn Antenna Structures :
E – PLANE HORN SECTORAL ANTENNA
H – PLANE HORN SECTORAL ANTENNA
PYRAMIDAL HORN ANTENNA (E & H
PLANE)
CONICAL HORN ANTENNA

TYPES OF HORN ANTENNA :-
i) Horn antenna tapered / flared in one dimension only i.e in E-plane or H-plane
(known as sectoral horn).
ii) Horn antenna tapered / flared in two dimensions in E-plane and H-plane (known
as pyramidal horn).
iii) Conical taper / flares uniformly in all direction i.e in circular form.
E–plane, H–plane Horn sectoral antenna and the pyramidal antenna is used to provide
matching between rectangular waveguide and free space. Whereas matching between
circular waveguide and free space can be achieved by using conical horn.
THE DIFFERENCES BETWEEN THE E-, H- PLANE & PYRAMIDAL HORN
SECTORAL ANTENNA
E- PLANE HORN SECTORAL ANTENNA
Radiation pattern exhibits side lobe
H- PLANE HORN SECTORAL ANTENNA
Radiation pattern exhibits no side lobe,
thus more popular.
PYRAMIDAL HORN ANTENNA
Radiation pattern flares in 2 direction i.e in
E-plane and H-plane. Therefore improves
directivity.
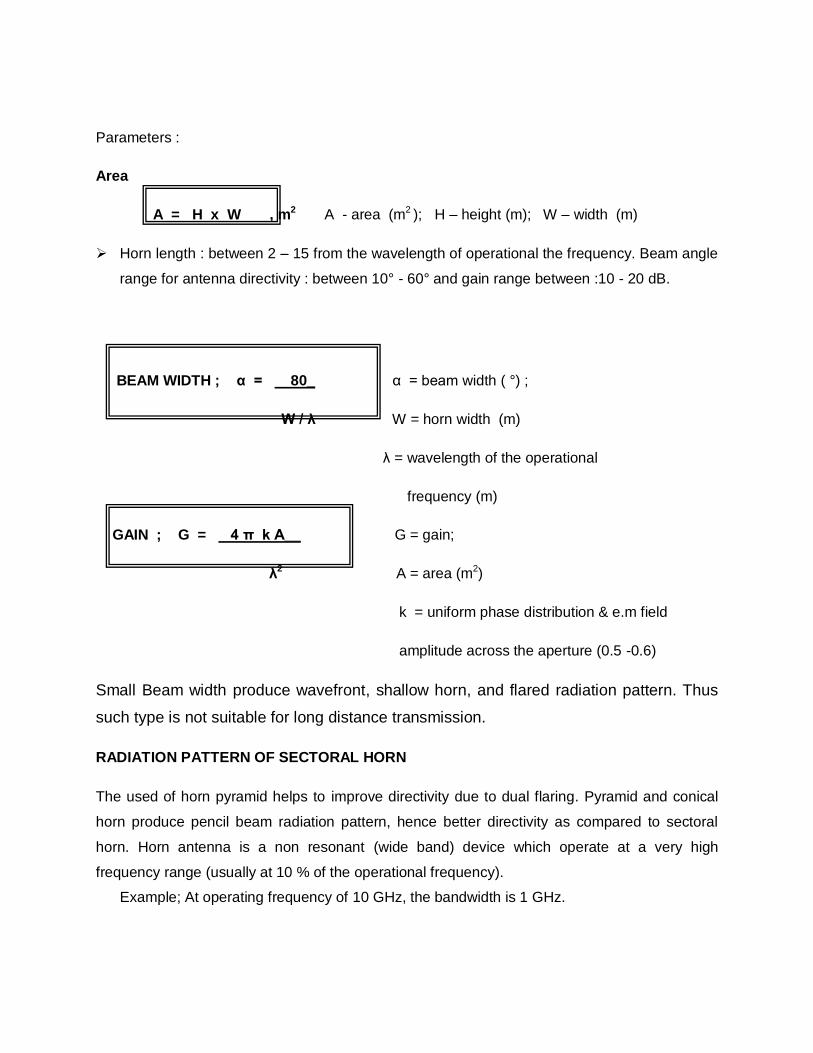
Parameters :
Area
A = H x W , m2 A - area (m2 ); H – height (m); W – width (m)
Horn length : between 2 – 15 from the wavelength of operational the frequency. Beam angle
range for antenna directivity : between 10° - 60° and gain range between :10 - 20 dB.
BEAM WIDTH ; α = 80_ α = beam width ( °) ;
W / λ W = horn width (m)
λ = wavelength of the operational
frequency (m)
GAIN ; G = 4 π k A__ G = gain;
λ2 A = area (m2)
k = uniform phase distribution & e.m field
amplitude across the aperture (0.5 -0.6)
Small Beam width produce wavefront, shallow horn, and flared radiation pattern. Thus
such type is not suitable for long distance transmission.
RADIATION PATTERN OF SECTORAL HORN
The used of horn pyramid helps to improve directivity due to dual flaring. Pyramid and conical
horn produce pencil beam radiation pattern, hence better directivity as compared to sectoral
horn. Horn antenna is a non resonant (wide band) device which operate at a very high
frequency range (usually at 10 % of the operational frequency).
Example; At operating frequency of 10 GHz, the bandwidth is 1 GHz.

Introduction:
In low frequency circuits parameters such as voltage, current, etc can be
measured and from these impedance, power factor and phase angle can be calculated.
At microwave frequencies it is more convenient to measure power instead of V and I.
Properties of devices and circuits at microwave frequencies i.e characterized by S-
parameters, power, frequency and VSWR and noise figure.Direct microwave measuring
devices are vector network analyzers, spectrum analyzers and power meters. Due to
their complications and high cost, microwave measurements in lab are often carried out
using 1 kHz square wave modulating signal which modulates the microwave test signal.
Measurements of microwave power, frequency, VSWR and losses in the network have
certain procedures. The procedures must be followed in order to obtain accurate
results.
Important measurement devices
The tunable detectors are used to demodulate the signal and couple the required
output to high frequency scope analyzer. The low frequency demodulated output
is detected using non reciprocal detector diode mounted in the microwave
transmission line.
Slotted section with line carriage is a microwave sectioned coaxial line
connecting a coaxial E-field probe which penetrates inside a rectangular
waveguide slotted section. The longitudinal slot is cut along the center of the
waveguide broad walls. The probe is made to move along the slotted wall which
samples the electric field proportional to probe voltage.
Main purpose of slotted section with line carriage is
1. For determination of location of voltage standing wave maxima and minima along
the line.
2. Measure the VSWR and standing wave pattern.
3. Wavelength.
4. Impedance.
5. Reflection co-efficient.
6. Return loss measurement.

VSWR meter is a highly sensitive, high gain, low noise voltage amplifier tuned normally at fixed frequency of 1KHZ of which microwave signals modulated. This meter indicates calibrated VSWR reading for any loads.
Power Measurement
Power is defined as the quantity of energy dissipated or stored per unit time.
Microwave power is divided into three categories – low power (less than 10mW),
medium power (from 10mW to 10W) and high power (greater than 10w).
The general measurement technique for average power is to attach a properly
calibrated sensor to the transmission line port at which the unknown power is to
be measured.
The output from the sensor is connected to an appropriate power meter. The RF
power to the sensor is turned off and the power meter zeroed. This operation is
often referred to as “zero setting” or “zeroing.” Power is then turned on.
The sensor, reacting to the new input level, sends a signal to the power meter
and the new meter reading is observed.
There are three popular devices for sensing and measuring average power at RF
and microwave frequencies. Each of the methods uses a different kind of device
to convert the RF power to a measurable DC or low frequency signal. The
devices are the diode detector, the bolometer and the thermocouple.
Diode Detector
The low-barrier Schottky (LBS) diode technology which made it possible to
construct diodes with metal-semiconductor junctions for microwave frequencies
that was very rugged and consistent from diode to diode. These diodes,
introduced as power sensors in 1974, were able to detect and measure power as
low as −70 dBm (100 pW) at frequencies up to 18 GHz.
Bolometer Sensor:
Bolometers are power sensors that operate by changing resistance due to a
change in temperature. The change in temperature results from converting RF or
microwave energy into heat within the bolometric element.
There are two principle types of bolometers, barretters and thermistors. A barretter is a
thin wire that has a positive temperature coefficient of resistance. Thermistors are
semiconductors with a negative temperature coefficient. Thermistor elements are
mounted in either coaxial or waveguide structures so they are compatible with common
transmission line systems used at microwave and RF frequencies.Power meters are
constructed from balanced bridge circuits. The principal parts of the power meter are
two self-balancing bridges, the meter-logic section, and the auto-zero circuit. The RF
Bridge, which contains the detecting thermistor, is kept in balance by automatically
varying the DC voltage Vrf, which drives that bridge. The compensating bridge, which
contains the compensating thermistor, is kept in balance by automatically varying the
DC voltage Vc, which drives that bridge. The power meter is initially zero-set (by
pushing the zero-set button) with no applied RF power by making Vc equal to Vrfo (Vrfo
means Vrf with zero RF power). After zero-setting, if ambient temperature variations
change thermistor resistance, both bridge circuits respond by applying the same new
voltage to maintain balance.
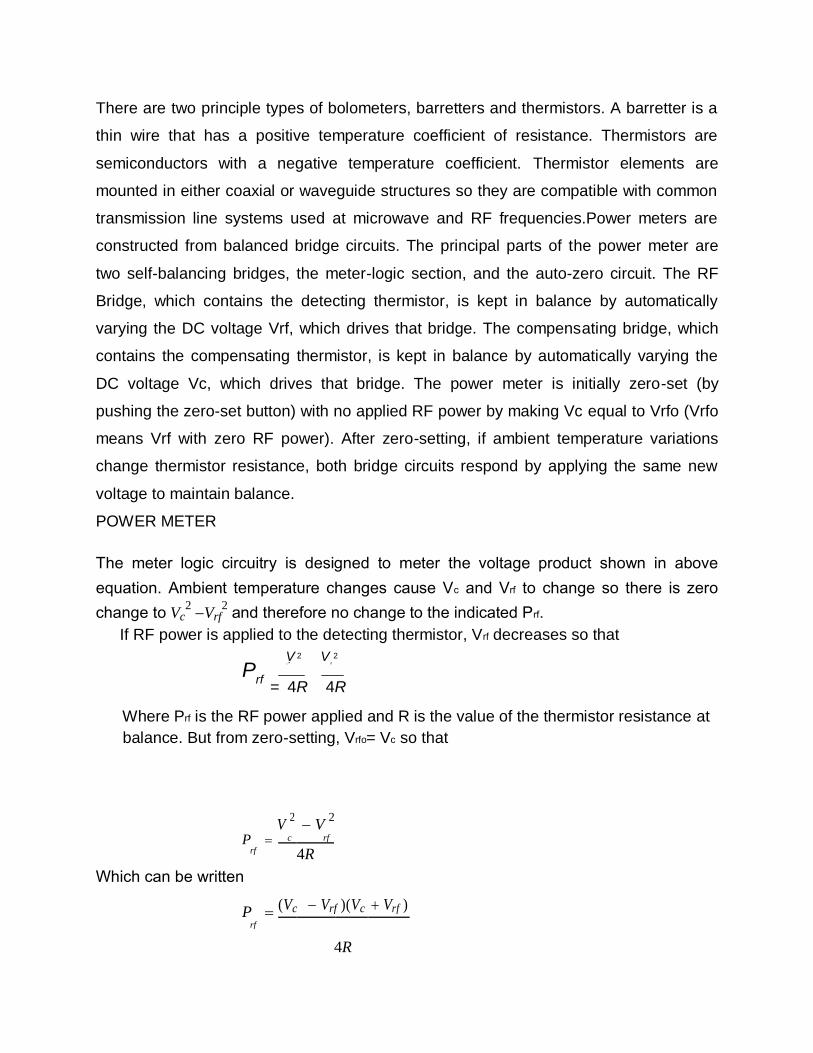
POWER METER
The meter logic circuitry is designed to meter the voltage product shown in above
equation. Ambient temperature changes cause Vc and Vrf to change so there is zero
change to Vc2 Vrf
2 and therefore no change to the indicated Prf.
If RF power is applied to the detecting thermistor, Vrf decreases so that
V 2 V 2 rf 0 rf P
rf = 4R 4R
Where Prf is the RF power applied and R is the value of the thermistor resistance at
balance. But from zero-setting, Vrfo= Vc so that
V
2 V
2
P c rf
rf 4R
Which can be written
P (Vc Vrf )(Vc Vrf )
rf
4R

Thermocouple Sensors
Thermocouple sensors have been the detection technology of choice for sensing RF
and microwave power since their introduction in 1974. The two main reasons for this
evolution are: 1) they exhibit higher sensitivity than previous thermistor technology, and
2) they feature inherent square-law detection characteristic (input RF power is
proportional to DC voltage out). Since thermocouples are heat-based sensors, they are
true “averaging detectors.”Thermocouples are based on the fact that dissimilar metals
generate a voltage due to temperature differences at a hot and a cold junction of the
two metals. The power sensor contains two identical thermocouples on one chip,
electrically connected as in Figure.
Thermocouple power sensor
The thermocouples are connected in series as far as the DC voltmeter is concerned.
For the RF input frequencies, the two thermocouples are in parallel, being driven
through coupling capacitor Cc. Half the RF current flows through each thermocouple.
Each thin-film resistor and the silicon in series with it have a total resistance of 100 Ω.
The two thermocouples in parallel form a 50 Ω termination to the RF transmission line.
The lower node of the left thermocouple is directly connected to ground and the lower
node of the right thermocouple is at RF ground through bypass capacitor Cb. The DC
voltages generated by the separate thermocouples add in series to form a higher DC
output voltage. The principal advantage, however, of the two thermocouple scheme is
that both leads to the voltmeter are at RF ground; there is no need for an RF choke in
the upper lead. If a choke were needed it would limit the frequency range of the sensor.
For a square wave modulated signal the peak power can be calculated from the
average power measured as Ppeak PavY where T is the time period and Շ is the pulse
width.
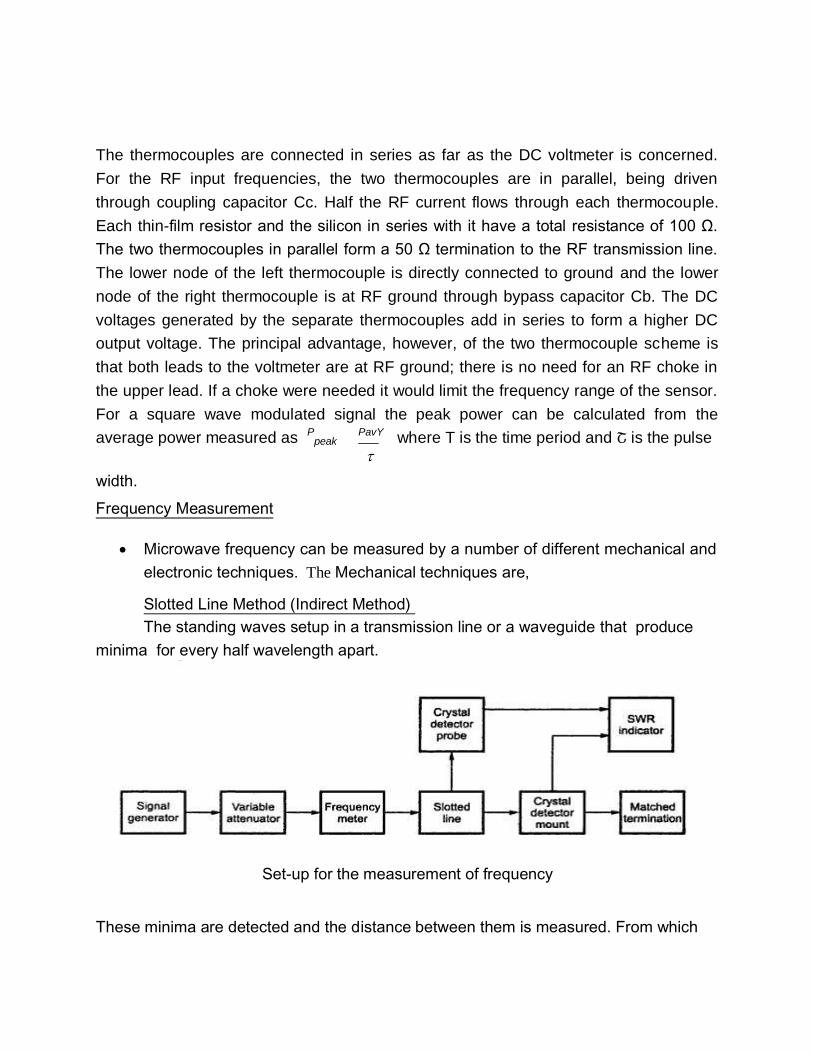
Frequency Measurement
Microwave frequency can be measured by a number of different mechanical and
electronic techniques. The Mechanical techniques are,
Slotted Line Method (Indirect Method)
The standing waves setup in a transmission line or a waveguide that produce
minima for every half wavelength apart.
Set-up for the measurement of frequency
These minima are detected and the distance between them is measured. From which

the wavelength and frequency can be calculated by
g
2d min
f C
0 gc
0
2 2
g c
where λ0 – free space wavelength
λc - cut off wavelength
λg – guide wavelength
dmin can be measured by the slotted line probe carriage.
Resonant Cavity Method (Direct Method)
The most commonly used type of microwave frequency meter is wave meters. It
consists of a cylindrical or coaxial resonant cavity. The size of the cavity can be altered
by adjustable plunger. The cavity is designed in such a way that for a given position of
the plunger, the cavity is resonant only at one frequency in the specified range.
WAVEMETER
The cavity is coupled to the waveguide through an iris in the narrow wall of the
waveguide. If the frequency of the wave passing through the waveguide is different from
the resonance frequency of the cavity, the transmission is not affected. If these two
frequencies coincide then the wave passing through the waveguide is attenuated due to
power loss. It will be indicated as a dip in the meter.
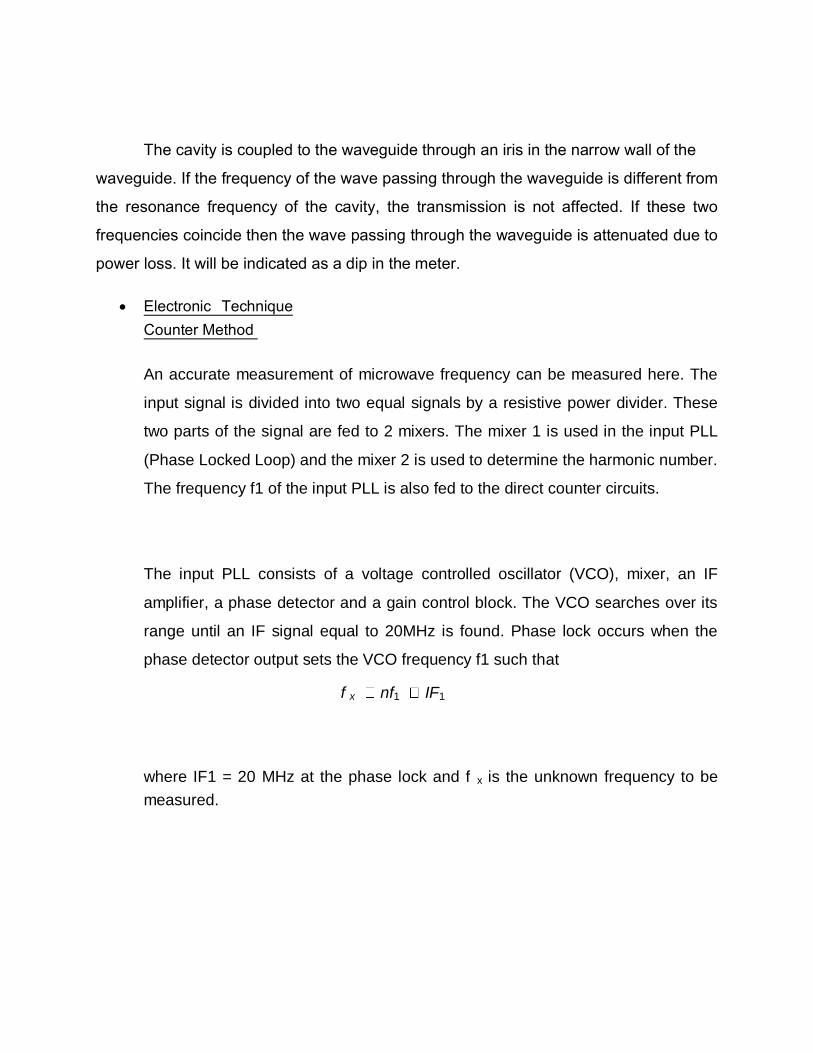
Electronic Technique
Counter Method
An accurate measurement of microwave frequency can be measured here. The
input signal is divided into two equal signals by a resistive power divider. These
two parts of the signal are fed to 2 mixers. The mixer 1 is used in the input PLL
(Phase Locked Loop) and the mixer 2 is used to determine the harmonic number.
The frequency f1 of the input PLL is also fed to the direct counter circuits.
The input PLL consists of a voltage controlled oscillator (VCO), mixer, an IF
amplifier, a phase detector and a gain control block. The VCO searches over its
range until an IF signal equal to 20MHz is found. Phase lock occurs when the
phase detector output sets the VCO frequency f1 such that
f x nf1 IF1
where IF1 = 20 MHz at the phase lock and f x is the unknown frequency to be
measured.

fx
IF1
Mixer 1 IF
Amplifier
f1
PLL
Vco
Phase
detector IFref
20 MHz
input
Power divider
f1 Gain
f1 control system
fx
FTU
to direct
f2 count ckt
IF
Mixer 2
Amplifier
IF2
Mixer nf0

The f1 is translated to a frequency f2 so that
f 2 f1 f 0
where f0 = 20 MHz offset frequency. This is done by a frequency translation unit
(FTU). The frequency f2 drives the second sampler and produces a second
output. IF2 is given as
IF2 nf 2 f x
n( f1 f 0 ) (nf1 20MHz) nf 0 20
By mixing IF2 with IF1 and rejecting 20 MHz and higher frequencies, nf0 is
obtained. Counting the number of zero crossing for the period of f0, determines
the harmonic number n of the phase lock loop. The input frequency is then
calculated by presetting into IFref counter, measuring f1 and extending gate time
according to number n.
VSWR Measurements:
In a microwave network, if load impedance and line impedance are not matched,
signal fed from the source is reflected again towards source causing standing wave
pattern in the network. Voltage Standing Wave Ratio is a measure used for finding the
magnitude of ration of reflected signals maximum and minimum amplitudes.
S
Vmax
__________ (1) V
min
For analyzing standing wave pattern and to find S slotted line carriage is used in
laboratory.

Low VSWR Measurements: (S<20)
Procedure:
1. Microwave Source is energized with 1 KHz square wave signal as carrier.
2. Tunable passive components are so adjusted to get reading across the VSWR
meter in 30 dB scale.
3. Detector (Tunable probe detector) is adjusted to get maximum power across the
VSWR meter.
4. Slotted line carriage is moved from the load towards source to find the standing
wave minimum position.
5. By adjusting the gain control knob of VSWR meter and attenuator the reading
across the VSWR meter is made as 1 or 0 dB known as normalization.
6. Again the slotted carriage is moved towards source to find the next minimum
position. The reading shown at this point in the VSWR meter is the ratio of
magnitude of reflected signals minimum and maximum voltages ( S V
max ).
Vmin
7. VSWR meter has three different scales with different ranges as specified below.
a) NORMAL SWR Scale 1 ----
1 – 4
b) NORMAL SWR Scale 2 ----
3.2 – 10
c) EXPANDED SWR Scale 3 ----
1 – 1.33

8. If the device under test (DUT) is having the range of VSWR 1 – 4, reading is
taken from the first scale from the top (NORMAL SWR Scale 1 – 1 – 4).
9. If the device under test (DUT) is having the range of VSWR 3.2 – 10, reading is
taken from the second scale from the top (NORMAL SWR Scale 2 (3.2 – 10).
10. If the device under test (DUT) is having the range of VSWR 1 – 1.33, reading is
taken from the third scale from the top (EXPANDED SWR Scale 3 (1 – 1.33).
11. If the device under test (DUT) is having the range of VSWR 10 – 40, a 20 dB
range is selected in the VSWR meter and reading is taken from the first scale
from the top (NORMAL SWR Scale 1 – 1 – 4) which is then multiplied by 10 for
getting the actual reading.
Possible Errors in Measurements:
1. Detector may not work square law region for both Vmax. and Vmin.
2. Depth of the probe in the slotted line carriage is made as minimum. If not, it
may cause reflections in addition to the load reflections.
3. For the device having low VSWR, connector used for measurement must
have proper matching with line impedance.
4. If the geometrical shape of the slotted line is not proper, Vmax. (or) Vmin. Value
will not constant across the slotted line.
5. If the microwave signal is not properly modulated by a 1 KHz square wave,
then signal becomes frequency modulated thereby it causes error in the Vmin.
value measured. The value becomes lower than the actual.
6. Residual VSWR of slotted line carriage may cause error in the
measurements.
High VSWR Measurements - Double Minima Method - (S>20)
Measurement of high VSWR needs separate procedure because the detector
may not be tuned to work in square law region. An alternate method known as double
minimum method is used for finding high VSWR with the same experimental set up as
shown above.

Procedure:
1. Microwave Source is energized with 1 KHz square wave signal as carrier.
2. Tunable passive components are so adjusted to get reading across the VSWR
meter in 30 dB scale.
3. Detector (Tunable probe detector) is adjusted to get maximum power across the
VSWR meter.
4. Slotted line carriage is moved from the load towards source to find the standing
wave minimum position. Let it be d1.
5. Slotted line carriage is moved further to find the next immediate minimum
position. Let it be d2. Now g = 2 (d1 - d2)
6. By adjusting the gain control knob of VSWR meter and attenuator the reading
across the VSWR meter is made as 3 dB at this minimum position.
7. By taking this point as reference, slotted line carriage is moved on either side.
The points at which the VSWR meter shows 0 dB reading on both sides are
noted as x1 and x2.
8. High VSWR can be calculated by using the formula S
g
(x1 x2 )
VSWR Measurements by Return Loss (Reflectometer) Method:
To overcome the difficulties faced in slotted line carriage for measuring VSWR,
reflectometer can be used. Reflectometer is a device having two directional couplers
combined together with ideal coupling factor and directivity. It is a four-port device.
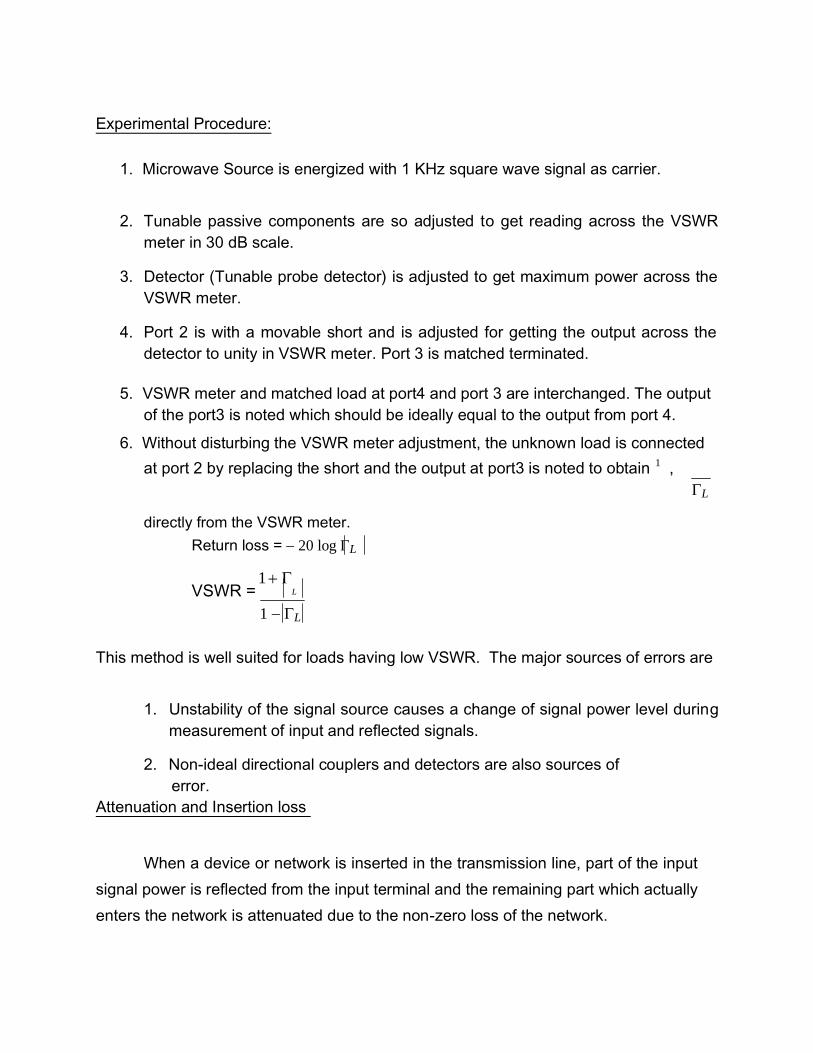
Experimental Procedure:
1. Microwave Source is energized with 1 KHz square wave signal as carrier.
2. Tunable passive components are so adjusted to get reading across the VSWR
meter in 30 dB scale.
3. Detector (Tunable probe detector) is adjusted to get maximum power across the
VSWR meter.
4. Port 2 is with a movable short and is adjusted for getting the output across the
detector to unity in VSWR meter. Port 3 is matched terminated.
5. VSWR meter and matched load at port4 and port 3 are interchanged. The output
of the port3 is noted which should be ideally equal to the output from port 4.
6. Without disturbing the VSWR meter adjustment, the unknown load is connected
at port 2 by replacing the short and the output at port3 is noted to obtain 1 ,
L
directly from the VSWR meter.
Return loss = 20 log L
VSWR =
1
L
1 L
This method is well suited for loads having low VSWR. The major sources of errors are
1. Unstability of the signal source causes a change of signal power level during
measurement of input and reflected signals.
2. Non-ideal directional couplers and detectors are also sources of
error.
Attenuation and Insertion loss
When a device or network is inserted in the transmission line, part of the input
signal power is reflected from the input terminal and the remaining part which actually
enters the network is attenuated due to the non-zero loss of the network.

Insertion loss = Reflection loss + Attenuation loss
Insertion loss is defined as difference in power arriving at the terminating load
.with or without the network in circuit.
Insertion loss (dB) =10 log (P0/Pi)
Attenuation is defined as a power ratio between 2 points along a
transmission path. It is measured under matched conditions.
Commonly 2 methods are used to measure the attenuation.
Power ratio Method
Measure of power delivered to the load
1. First without network as P1.
2. Then with network whose attenuation is to be measured as P2.
The ratio of second to the first power gives attenuation.
Attenuation = Power( without N/W)
Power( with N/W
RF substitution Method
If the input power is low and the device (network) has a high attenuation, then this
method is used. This is a simple method in which the output power from the unknown
device or network is measured. This network is then replaced by a calibrated attenuator
which is adjusted until output power is the same. Under this condition the attenuation of
the two is same and can read off from the attenuator.

NETWORK ANALYZER
A network analyzer is an instrument that measures the network
parameters of electrical networks. Today, network analyzers commonly measure s–
parameters because reflection and transmission of electrical networks are easy to
measure at high frequencies, but there are other network parameter sets such as y-
parameters, z-parameters, and h-parameters. Network analyzers are often used to
characterize two-port networks such as amplifiers and filters, but they can be used on
networks with an arbitrary number of ports.
Network analyzers are used mostly at high frequencies; operating frequencies can
range from 5 Hz to 1.05 THz. Special types of network analyzers can also cover lower
frequency ranges down to 1 Hz. These network analyzers can be used for example for
the stability analysis of open loops or for the measurement of audio
and ultrasonic components.
The two basic types of network analyzers are
scalar network analyzer (SNA)—measures amplitude properties only
vector network analyzer (VNA)—measures both amplitude and phase
properties
A VNA is a form of RF network analyzer widely used for RF design applications. A VNA
may also be called a gain-phase meter or an automatic network analyzer.
An SNA is functionally identical to a spectrum analyzer in combination with a tracking
generator. Another category of network analyzer is the microwave transition
analyzer (MTA) or large signal network analyzer (LSNA), which measure both
amplitude and phase of the fundamental and harmonics. The MTA was commercialized
before the LSNA, but was lacking some of the user-friendly calibration features now
available with the LSNA.
Questions :
1. Explain the various methods of microwave power measurement.
2. Describe how can the power of a microwave generator be measured using (a)
Bolometer (b) Calorimeter techniques.
3. Write short notes about Low and High VSWR.
4. Compare the power ratio and RF substitution method of measuring attenuation.
5. Explain about low frequency measurement techniques.
------------------------------------------------------------------------------------------------------------