Unit Plan Five-Day Outline -...
51
Symmetry And Scatter Plot Graphing A Five-Day Unit Plan by: Charles F. Stiffler for Grade Level Six Five 45min. Lessons Material: CBR ViewScreen (optional) TI-73 or 83+ Standards: NCTM: Geometry, Representation, Reasoning and Proof NYS: Key Ideas 1, 4, 5, and 7
Transcript of Unit Plan Five-Day Outline -...

Symmetry And Scatter Plot Graphing
A Five-Day Unit Plan by:
Charles F. Stiffler
for Grade Level Six
Five 45min. Lessons
Material: CBR
ViewScreen (optional)
TI-73 or 83+
Standards: NCTM: Geometry, Representation, Reasoning and Proof
NYS: Key Ideas 1, 4, 5, and 7

2
Unit Plan Five-Day Outline
Day OneDefining Symmetry: An Introduction
Students will be exposed to the concept of what is symmetry by viewing aseries of images of everyday items that represent these concepts and look forthe visual aspects that they share, and then placing them in groups. By doingthis simple exploration, the students have an opportunity to make this knowledgetheir own. Students will be able to identify Reflective and Rotational Symmetry.
Day TwoDid Galileo Have A CBR?: Some Reflections On ReflectiveSymmetryThrough the use of a pendulum, students will determine that isochronism
exits in the swinging of a pendulum, and will construct a scatter-plot graphcomparing the two dimensions of distance and time. This plot will also serve asan example of reflective symmetry. Students will be able to identify and createexamples of Reflective Symmetry.
Day ThreeGoing For A Spin: Another Look At Rotational SymmetryThe students will return to Rotational Symmetry and refresh their
knowledge of Rotational Symmetry Recognition. Students will physically use aseries of polygons as cogs to create graphs. From these graphs students willdetermine what Rotational Symmetry characteristics each has. A simplemechanism has to be built, but well worth the effort.
Day FourTranslations In The Language of Mathematics: Translations, Tiling,and Tessellation.Students will see examples of Translations as a lead in for Tiling and
Tessellation. The Tessellations will then be explored for their Rotational andReflective Symmetries.
Day FiveKaleidoscopes: Let's Put This All TogetherNow that students have some new background concerning Symmetry,
what better activity than to let them design and build a simple Kaleidoscope fromfoil-covered posterboard. For the handy class, an inexpensive genuine glass oneis not much more challenging.

3
Objectives and Standards
Day One:Defining Symmetry: An Introductionÿ Behavioral Objective:
o Students will be able to identify Reflective and Rotational Symmetry.ÿ NCTM Standards: Geometry, Representationÿ NYS Standards: Key Ideas 1, 4, and 7
Day Two:Did Galileo Have A CBR?: Some Reflections On Reflective Symmetryÿ Behavioral Objectives:
o Students will be able to identify and create examples of ReflectiveSymmetry.
o Students will be able to graph a motion that represents ReflectiveSymmetry.
ÿ NCTM Standards: Geometry, Representation, Reasoning and Proofÿ NYS Standards: Key Ideas 1, 4, and 7
Day Three:Going For A Spin: Another Look At Rotational Symmetryÿ Behavioral Objectives:
o Students will be able to identity and create examples of RotationalSymmetry.
o Students will be able to graph a motion that represents RotationalSymmetry.
ÿ NCTM Standards: Geometry, Representation, Reasoning and Proofÿ NYS Standards: Key Ideas 1, 4, and 7
Day Four:Translations In The Language of Mathematics: Translations, Tiling, and
Tessellation.ÿ Behavioral Objectives:
o Students will be able to identify Translationso Students will investigate Tessellations
ÿ NCTM Standards: Geometry, Representation, Reasoning and Proofÿ NYS Standards: Key Ideas 1, 4, and 7
Day Five:Kaleidoscopes: Let's Put This All Togetherÿ Behavioral Objectives:
o Students will make a Contact (non-optical) Kaleidoscopeo Students will understand how to make an Optical (non-contact)
Kaleidoscope.ÿ NCTM Standards: Geometry, Representation, Reasoning and Proofÿ NYS Standards: Key Ideas 1, 4, and 7

4
Materials and Equipment
Day One:
Basic Shapes overheads, in-class exploration and take-home assessment sheets
(attached), firm cardboard or thin wooden Basic Shapes Cogs (Why cogs? This
makes more sense on Wednesday), overhead projector. You'll be using these
Basic Shape overheads and cogs throughout the unit.
Day Two:
Roll of string, electric drill (with a slow speed), CBR, TI-73 or 83, TI ViewScreen
(optional), scissors, 5ft. of string with a lightweight sphere of about 4in. diameter
attached to the end, timer capable of measuring intervals less than one minute
(kitchen timer, wristwatch or clock with second-hand), in-class exploration and
take-home assessment sheets (attached).
Day Three:
Basic Shape Cogs, scatter plot mechanism (see attached drawing), colored
markers, in-class exploration and take-home assessment sheets (attached).
Day Four:
Tessellation examples and basic shape overheads (see appendix), in-class
exploration and take-home assessment sheets (attached).
Day Five:
Several sheets of foil-surfaced posterboard cut into 4x7in. and 7x7in. pieces (one
each for each student involved), masking tape, kaleidoscope patterns, pre-made
examples of the kaleidoscopes, scissors, gluesticks, in-class exploration and take-home
assessment sheets (attached), straightedges, rubber bands. (optional: glass mirror,
glass cutter, quick-setting epoxy adhesive, 1/8" wooden dowel).

5
Day One:Defining Symmetry: An Introduction
"symmetry
/"s m tr / noun (plural -ies) 1 correct proportion of parts. 2 beauty resulting fromthis. 3 structure allowing object to be divided into parts of equal shape andsize. 4 possession of such structure. 5 repetition of exactly similar parts facingeach other or a centre. symmetric adjective. symmetrical /-"met-/ adjective.symmetrically /-"met-/ adverb.
symmetrical balanced, even, proportional, regular."1
Defining Symmetry: An Introduction
ÿ Behavioral Objective:
o Students will be able to identify Reflective and Rotational
Symmetry is class discussion and on a take home assignment
worksheet.
ÿ NCTM Standards: Geometry, Representation
ÿ NYS Standards: Key Ideas 1, 4, and 7
Synopsis
Students will be exposed to the concept of what is symmetry by viewing a
series of common shapes that represent these concepts and look for the visual
aspects that they share, and then placing them in groups. By doing this simple
exploration, the students have an opportunity to make this knowledge their own.
Students will be able to identify Reflective and Rotational Symmetry.
1 Definition from www.AskOxford.com

6
Materials:
Basic Shapes overheads, in-class exploration sheet, take-home
assessment sheet (attached), firm cardboard or thin wooden Basic Shapes,
overhead projector.
Main Lesson: Introduction
1 Students will be informed that they are about to investigate the intricacies
of Rotational and Reflective Symmetry, starting with some basics.
2 Students will be encouraged during a group discussion to suggest
examples of some basic shapes (square, right triangle, circle, etc.), to assess
their previous knowledge of these shapes.
3 During this same discussion, students will be encouraged to express their
prior knowledge of symmetry to access their prior knowledge of the subject.
4 Students will be informed that they will be discussing Rotational and
Reflective symmetry first.
Main Lesson
1 Students will be divided into groups of four to six students each to discuss
what the symmetries of the Nine Basic Shapes on their in-class exploration sheet
(attached) as they are presented, and share their conclusions with the other
groups every few minutes (educator's discretion on time), in an open classroom
forum.
2 Students will be encouraged during this open forum, to come up to the
projector and demonstrate what they believe to be the symmetry or symmetries
afforded each shape as they come up in this forum.

7
3 Students will note the symmetries on their exploration sheets.
Students will view the drawings on the overhead, as this is a great way to
reflect them by flipping, and rotation is also more obvious. Overheads are made
in pairs so they can be overlaid to show the symmetry or lack thereof.

8
In-Class Exploration Sheet
Name
On the following shapes, note the lines of symmetry.

9
Take-Home Assessment Sheet
Name
On the following shapes, write the name of a object you've seen that uses thisshape.

10
Name: Educator's Copy
On the following shapes, note the lines of symmetry.
infinite

11

12

13

14
15

16

17

18
19

20
Day Two:Did Galileo Have A CBR?: Some Reflections On Reflective Symmetry
Through the use of a pendulum, students will determine that isochronismexits in the swinging of a pendulum, and will construct a scatter-plot graphcomparing the two dimensions of distance and time. This plot will also serve asan example of reflective symmetry. Students will be able to identify and createexamples of Reflective Symmetry.Grade Level: 5-6
Objectives
Students will be able to draw a scatter-plot graph
Students will establish a link between motion and graphing
Materials
Roll of string, electric drill (with a slow speed), CBR, TI-73 or 83, TI
ViewScreen (optional), scissors, 5' of string with a lightweight sphere of about 4"
diameter attached to the end, timer capable of measuring interval less than one
minute (kitchen timer, wristwatch, etc.).
Standards
NCTM: Data Analysis and Probability, Representation
NYS: Key Ideas 1 and 4
Setup
Before the students are invited to participate, arrange the pendulum
demonstration to confirm it is functioning easily. A simple way to do this is to put
a small cup-hook in the top-center of a doorframe to suspend the pendulum from.
You can attach the CBR to the back of a chair, though a telescoping stand like
that used for a light might be more readily corrected for optimum alignment.

21
Main Lesson: Introduction
1 Students will hear a story about studying motion (attached).
2 Students will be challenged to collect data about motion and graph the
results.
3 Students will hear that after developing a conjecture about the motion of a
pendulum, they will repeat using modern technology and compare the results
(CBR).
4 Students will see a demonstration of the isochronistic (constant) motion of
a pendulum, but not informed that it is constant as that is part one of the problem
solving assignment.
5 Students will hear that they need to determine how many times the
pendulum completed a cycle from one side to the next and back, and how long
each cycle lasted, and an estimate of the distance from side to side for the cycles
measured. Students can suggest using anything that is in the room. If time
permits, options using items from outside the room can be gathered.
6 The students will be asked for suggestions as to how they might do this as
a way of assessing their attention and whether they are on task. Students will be
called on at random for a brainstorming session. If time allows, students can
form small groups to discuss this and share their groups results in facilitated
forum.
7 Student's options and ideas will be listed so all can see the ideas
developed (on whiteboard, overhead, etc.) to assess complete participation by
the entire class. Encourage holdouts with pointed questions.

22
8 A method to solve this problem has been prepared in advance, but should
time allow (combining the day's allotments for math and science for example),
students should have the opportunity to form groups and try their ideas.
Main Lesson: data collection
1 Students will again watch the pendulum complete a cycle.
2 Students will hear that each time the pendulum completes a cycle, you will
cut a piece of string unrolling from the electric drill and each piece of string will
represent that cycle.
3 Students will form a line so that as each string is cut, the first person in the
line will grab it and remember where they stood in the line. The order is very
important.
4 One student will be selected to start the pendulum and say "Cut" ever
other time the pendulum reaches the middle (lowest) point in the cycle (this is an
easy constant to measure), another to start the timer. A distance of about 2 feet
from the center should be easy to determine (the default time span on the CBR).
This just makes for a simple transition to the CBR.
5 On the count of three, the pendulum starts swinging and the drill starts
rolling. As the pendulum passes over the midpoint for the second time "Cut" is
said for the first cut to be made and the timer is started. This just makes it easier
to synchronize.
6 After the data collection is complete (ex. 15" later), the students with
lengths of string will arrange themselves 1st to last from left to right.

23
7 The first piece of string will be presented to the students as they are
encouraged in when called at random from a show of hands what the two cut
ends represent (every other time the pendulum reached the mid/low point).
Main Lesson: analyzing data and setting up a graph
1 A student will be selected to draw a "+" on the board where the horizontal
line intersects the vertical line at the vertical line's midpoint. The horizontal (x)
and vertical (y) axis should be several feet long. This should be drawn as large
as possible.
2 Students will attach their string sections to the graph with tape in
sequence from left to right on the board and brainstorm what their lengths'
suggest. (they should all be about the same length, indicating the same "length"
of time per cycle).
3 Students will be shown a length of the string folded in half and should
suggest what the cut ends and the midpoint of the lengths of string suggest
(pendulum at its mid/low point).
4 Students will be shown a length of string folded in half twice (fourths) and
suggest what these points suggest (the points farthest away from each other in a
cycle).
5 A students will fold a length of the strings into fourths so as to know where
the midpoint is between the center and the ends. This midpoint is held to the x
axis and a mark is mad on the graph for the second folds that indicate the
extremes of the cycle (one above and one below the x axis).

24
6 Now that we know how many times the cycle repeated in 15", and that
each of the cycles had the same duration, we can plot our graph.
Main Lesson: graph plotting
1 Students are reminded that the x axis indicates the number of cycles, and
the y axis indicates the length of each one.
2 Each student will receive a blank graph (attached) to use as a place to fill
in the data points that have been collected (a point above and below the x axis
for each cycle.
3 Students will be informed that they should make equally spaced marks
along the x axis to indicate each cycle that was completed. Students should be
encouraged to use as much of the graph as possible.
4 The students will now be directed by educator's example on the board with
the existing graph as to how to complete their own graph.
Main Lesson: conclusion
1 Students will assist in repeating the experiment using the CBR.
2 Students will have a chance to observe those results (here's where the
ViewScreen comes in handy).
3 Students will fill in their second blank graph by copying the CBR
generated graph.
3a. Students will receive a printout of the CBR graph.2
4 Students will complete the questions on the back of their graphs to
complete the classroom exploration.
2 optional for take-home assessment if printer is available

25
In-Class Exploration Sheet
Name ___________________________________________________________
CBRGraph
OurGraph

26
In your own words, please answer the following:
1 What did you learn from the lengths of the strings?
2 What did the cut ends suggest?
3 What did the string midpoints suggest?
4 What did points between the midpoint of the strings and their cut ends
suggest?
5 What did we measure using our horizontal (x) axis?
6 What did we measure using our vertical (y) axis?
7 What did the CBR derived plot measure with the horizontal (x) axis?
8 What did the CBR derived plot measure with the vertical (y) axis?
27
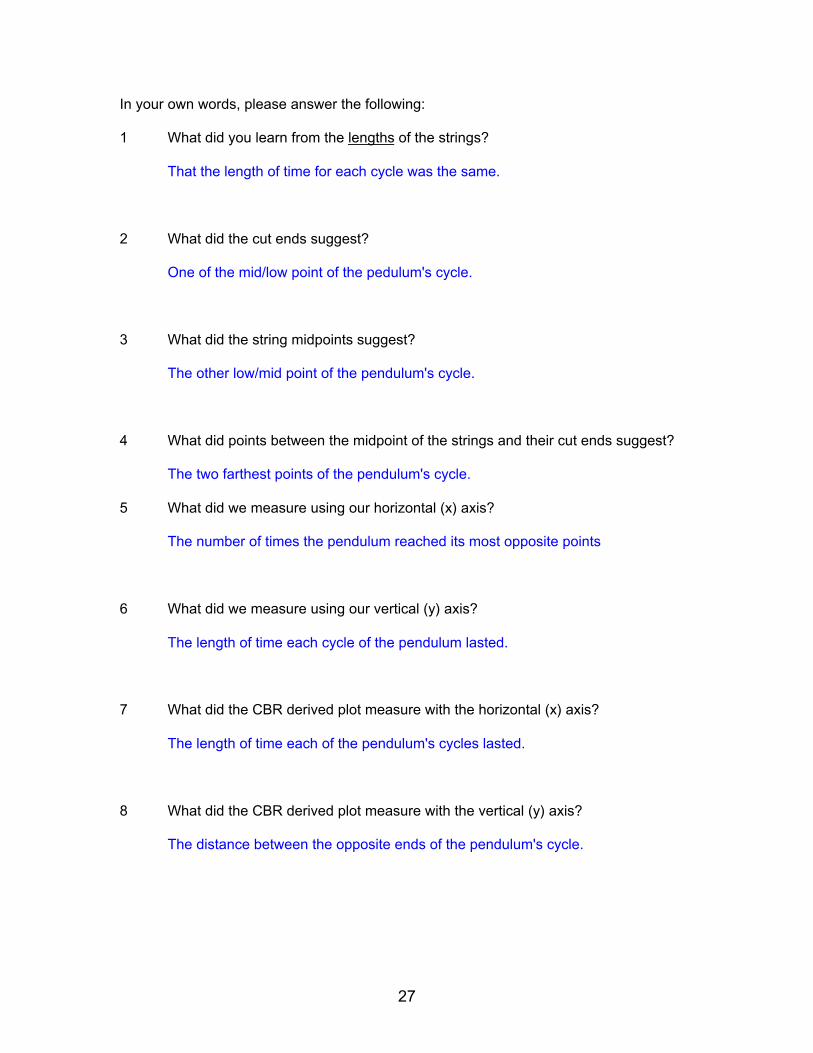
In your own words, please answer the following:
1 What did you learn from the lengths of the strings?
That the length of time for each cycle was the same.
2 What did the cut ends suggest?
One of the mid/low point of the pedulum's cycle.
3 What did the string midpoints suggest?
The other low/mid point of the pendulum's cycle.
4 What did points between the midpoint of the strings and their cut ends suggest?
The two farthest points of the pendulum's cycle.
5 What did we measure using our horizontal (x) axis?
The number of times the pendulum reached its most opposite points
6 What did we measure using our vertical (y) axis?
The length of time each cycle of the pendulum lasted.
7 What did the CBR derived plot measure with the horizontal (x) axis?
The length of time each of the pendulum's cycles lasted.
8 What did the CBR derived plot measure with the vertical (y) axis?
The distance between the opposite ends of the pendulum's cycle.

28
Take-Home Summary Sheet: use CBR graph drawing or printout from class
Name ___________________________________________________________
1 Does the graph from our string experiment represent Reflective Symmetry
with the x axis as our line of symmetry? Explain.
2 Does the CBR graph present the same results? Explain.
3 Visually, how do the two graphs differ? Explain.
4 If we had cut the string at the beginning of the cycle instead of the first
midpoint, would the results have been different? Explain.
5 Can you think of a common shape that the CBR graph reminds you of if
we rotate the graph so the x axis is vertical? Explain.

29
Take-Home Summary Sheet:
Name ___________________________________________________________
1 Does the graph from our string experiment represent Reflective Symmetry
with the x axis as our line of symmetry? Explain.
Yes, as the distance from the x axis is the same for each cycle.
2 Does the CBR graph present the same results? Explain.
Yes, as it also indicates that the cycles are of the same length.
3 Visually, how do the two graphs differ? Explain.
The string-based graph has shows the length of the cycles with the y axis
and only the number of cycles with the x axis, where the CBR graph shows the
length of the cycles with the x axis and the distance the pendulum traveled with
the y axis.
4 If we had cut the string at the beginning of the cycle instead of the first
midpoint, would the results have been different? Explain.
No, as the length of the cycle was the same as long as we measured it
once per cycle.
5 Can you think of a common shape that the CBR graph reminds you of if
we rotate the graph so the x axis is vertical? Explain.
Yes, a very narrow triangle.

30
The Swinging Chandeliers
One day a person enters a building and notices that the chandeliers
(hanging lights) are swinging, probably from a breeze that just blew through the
windows. Eventually they stop swinging, but the next breeze sets them to
swinging again.
Now, this person starts to thinking that everyone says that as the
chandelier swings back and forth, the length of time for each swing changes as
the chandelier approaches and comes to a stop, at least that is what someone
else said, and everyone believes them. This person doesn't have a wristwatch,
so all they can do is to feel for their pulse (how fast their heart is beating) to help
keep track of the time it takes the chandelier to swing. What do you think they
decided about the time of each swing as it approaches a stop? Did they agree
with what everyone said?
(After some discussion…)
By the way, the person was a man who went by the name of Galileo, and
this event took place sometime between 1592 and 1610 CE. And the person
everyone had been agreeing with? His name was Aristotle, and he'd been dead
since 322 BCE, that's about 1900 years!

31
Day Three:Going For A Spin: Another Look At Rotational Symmetry
The students will return to Rotational Symmetry and refresh theirknowledge of Rotational Symmetry Recognition. Students will physically use aseries of polygons as cogs to create graphs. From these graphs students willdetermine what Rotational Symmetry characteristics each has. A simplemechanism has to be built, but well worth the effort as it will allow the students touse the polygons directly to create the scatter-plot graphs.
Behavioral Objectives:
1 Students will use a basic shape as a cog to draw a scatter plot using a
working model of the described machine (see appendix).
2 Students will be able to construct a scatter-plot graph of a shape by
observing its dimensions, edges, and vertices.
Standards:
NCTM: Key Ideas 1, 4, and 7
NYS: Geometry, Representation, Reasoning and Proof
Materials:
Basic Shape Cogs, scatter plot mechanism (see attached drawing),
colored markers.

32
Main Lesson: Introduction
1 Students will be informed that the previous day's experience in Reflective
Symmetry and scatter-plot graphing will be utilized to explore Rotational
Symmetry and graphing scatter plots of these shapes.
2 Students will once again be shown the shapes to be analyzed and assess
what has been retained by the students over the previous two days.
(see appendix for Basic Shapes).
Main Lesson:
1 A student will be selected at random to insert a square basic shape onto
the spindle of the scatter-plot mechanism.
2 Students will be instructed in the use of the scatter-plot mechanism (see
attached).
3 The students will first create a scatter-plot of a square to begin to
understand the relationship between its symmetry as a basic shape, and how
that is represented on a scatter-plot comparing the dimensions, vertices, and
edges.
4 Students will receive a handout where they will draw a copy of the plot of
the square, and eventually the other basic shapes.
5 Students will be formed into groups of four to six each and take turns
using the scatter-plot mechanism to create plots of all of the available basic
shapes to immediately display for the rest of the groups to observe, make
conclusions, and share in an open forum at the end of the class session. This

33
will be a powerful chance to assess the student's comprehension throughout the
lesson.
Main Lesson: Conclusion
1 Groups will compare their results and share what the graphs represent.
2 Groups will discuss how the scatter-plot could be made to look like the
Basic Shape, and share the results in a facilitated classroom forum.

34
Scatter-Plot Mechanism: Description of construction and use
The following drawing is the basic design for the mechanism that will allow
the scatter-plotting of polygons directly from the polygon.
First, you will need to cut a set of Basic Shapes as a starting point for the
polygons to plot. These can be fashioned from something as simple as
corrugated cardboard, or as durable as plywood. Find and mark the centers.
A nice piece of 1/2" or better plywood 16 x 20in. is the base for the entire
mechanism.
At one 16" end I mounted a roll-paper holder (mine was 12in. wide) so the
paper could be unrolled the length of the board. In line with the roll I screwed 2
(qty) 12in. rulers to the board with a 1/8" space between them. The washers
underneath allow for the roll of paper to be pulled under them without binding.
Next, I used a 3/8" bolt with two large washers (one for the top and the
bottom) with a locking nut so as to put through the center of the roll of string. At
the bottom we place the Basic Shape Cog (with a hole in the center) over the bolt
before tightening it all together with the nut. This way the roll of string and the
cog will turn together.
Finally, pull the paper underneath the rulers and drill a 3/8" hole in the
board in line with the space between the rulers and at the edge of the paper.
This is for the end of the bolt to drop in like a spindle.
Unwind enough string to reach the end of the paper and slowly pull them
together while another person holds a pencil or marker vertically with its tip on
the paper between the rulers and its length against the cog. As the paper is

35
pulled out and the pencil or marker is guided against the cog, an graph will be
draw where each vertices is a peak and the lines connecting them are the edges.
This long graph will have the distance from the center of the cog (minus
the distance to the edge of the paper) as the y axis, and the distance between
the vertices will be the length of the line between these peaks along the x axis. A
good look at the drawing of the mechanism should make this seem much less
confusing.

36
string and paperpulled / unrolledtogether

37
Take-Home Assessment Sheet
Square
Parallelogram
Trapezoid
Circle
Hexagon
Pentagon
Octagon
RightTriangle
Name ___________________________________________________________
EquilateralTriangle

38
Day Four:Translations In The Language of Mathematics: Translations, Tiling, and
Tessellation.
Main Entry: tes·sel·la·tionPronunciation: "te-s&-'lA-sh&nFunction: nounDate: 16601 a: MOSAIC b: a covering of an infinite geometric plane withoutgaps or overlaps by congruent plane figures of one type or a fewtypes2: an act of tessellating : the state of being tessellated3
Students will see examples of Translations as a lead in for Tiling and
Tessellation. The Tessellations will then be explored for their Rotational and
Reflective Symmetries.
Behavioral Objectives:
1 Students will be able to identify and define a tessellation in a
facilitated classroom forum.
2 Students will be able to create a tessellation utilizing at least two of
the basic shapes (see appendix), on a take-home summary sheet.
Standards:
NCTM: Geometry, Representation, Reasoning and Proof
NYS: Key Ideas 1, 4, and 7
Materials:
Tessellation examples and basic shape overheads (see attached), take-
home summary sheet.
3 From: http://www.m-w.com/home.htm Merriam-Webster's Collegiate Dictionary On-Line
39
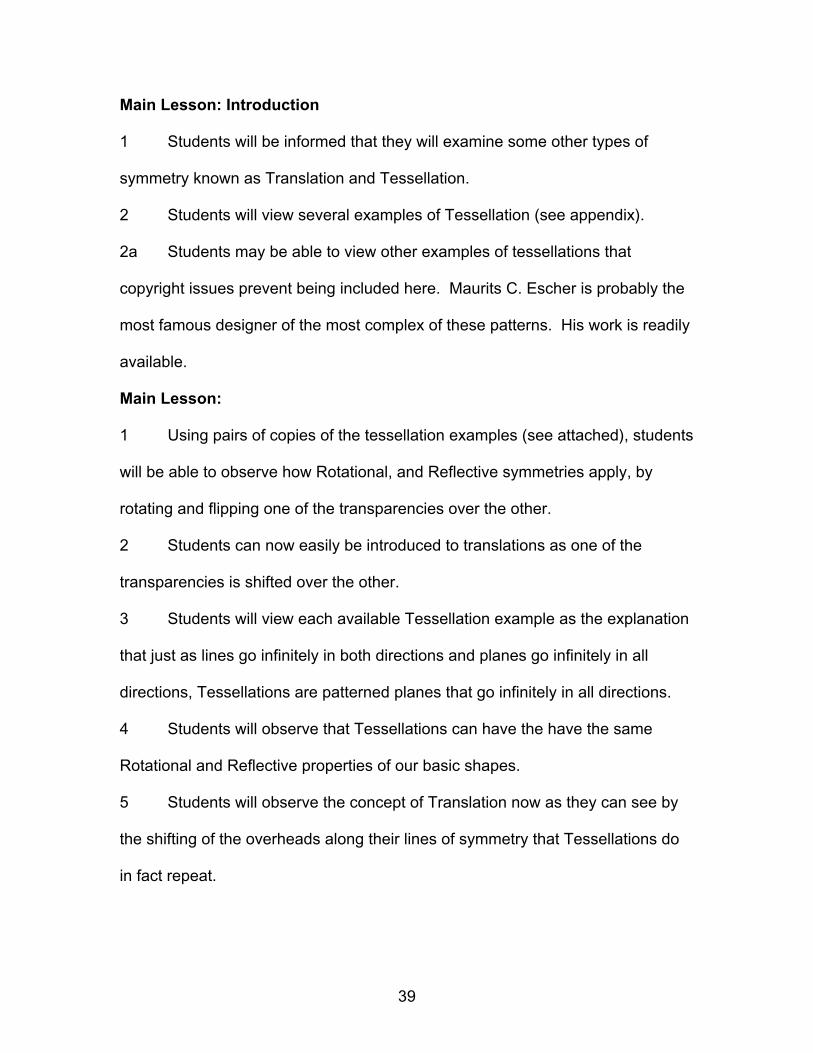
Main Lesson: Introduction
1 Students will be informed that they will examine some other types of
symmetry known as Translation and Tessellation.
2 Students will view several examples of Tessellation (see appendix).
2a Students may be able to view other examples of tessellations that
copyright issues prevent being included here. Maurits C. Escher is probably the
most famous designer of the most complex of these patterns. His work is readily
available.
Main Lesson:
1 Using pairs of copies of the tessellation examples (see attached), students
will be able to observe how Rotational, and Reflective symmetries apply, by
rotating and flipping one of the transparencies over the other.
2 Students can now easily be introduced to translations as one of the
transparencies is shifted over the other.
3 Students will view each available Tessellation example as the explanation
that just as lines go infinitely in both directions and planes go infinitely in all
directions, Tessellations are patterned planes that go infinitely in all directions.
4 Students will observe that Tessellations can have the have the same
Rotational and Reflective properties of our basic shapes.
5 Students will observe the concept of Translation now as they can see by
the shifting of the overheads along their lines of symmetry that Tessellations do
in fact repeat.
40
Main Lesson: Conclusion
1 Students will review the criteria of a Tessellation (patterned infinite plane)
and Translation (ability of a pattern to be shifted onto itself and align exactly).
2 Students will be instructed to draw a Tessellation pattern (tiling) at home
to share with the class the class the following day and for assessment. Pattern
should include at least two different shapes.

41

42

43

44

45

46
Day Five:
Kaleidoscopes: Let's Put This All Together
Now that the students have some new background concerning Symmetry,what better activity than to let them design and build a simple Kaleidoscope fromfoil-surfaced posterboard.
Behavioral Objectives:
1 Students will be able to construct a simple kaleidoscope from foil-surfaced
posterboard.
2 Students will be able to create illustrations of the images formed in the
kaleidoscopes and explain the symmetries of the illustrations.
Standards:
NCTM: Geometry, Representation, Reasoning and Proof
NYS: Key Ideas 1, 4, and 7
Materials:
Several sheets of foil-surfaced posterboard cut into a 4x7in. and a 7x7in.
piece for each student involved, masking tape, kaleidoscope patterns,
glasscutter, glass mirror, epoxy adhesive, 1/8" wooden dowel, pre-made
examples of the kaleidoscopes, scissors, gluesticks, in-class exploration sheets,
take-home summary sheets, straightedges, rubber bands.
Main Lesson: Introduction
1 Students will be introduced to the mirror kaleidoscope by passing several
examples around for them to examine. Students will be instructed that those with
both ends open are best used with the smaller opening in contact with the
47
surface or object to be viewed. Those that came to a point were for placing an
object inside them.
2 Students will be informed that they will make one of these kaleidoscopes
during the class period.
3 Students will be informed that there are essentially three very specific and
one very general design of this type of kaleidoscope. They are:
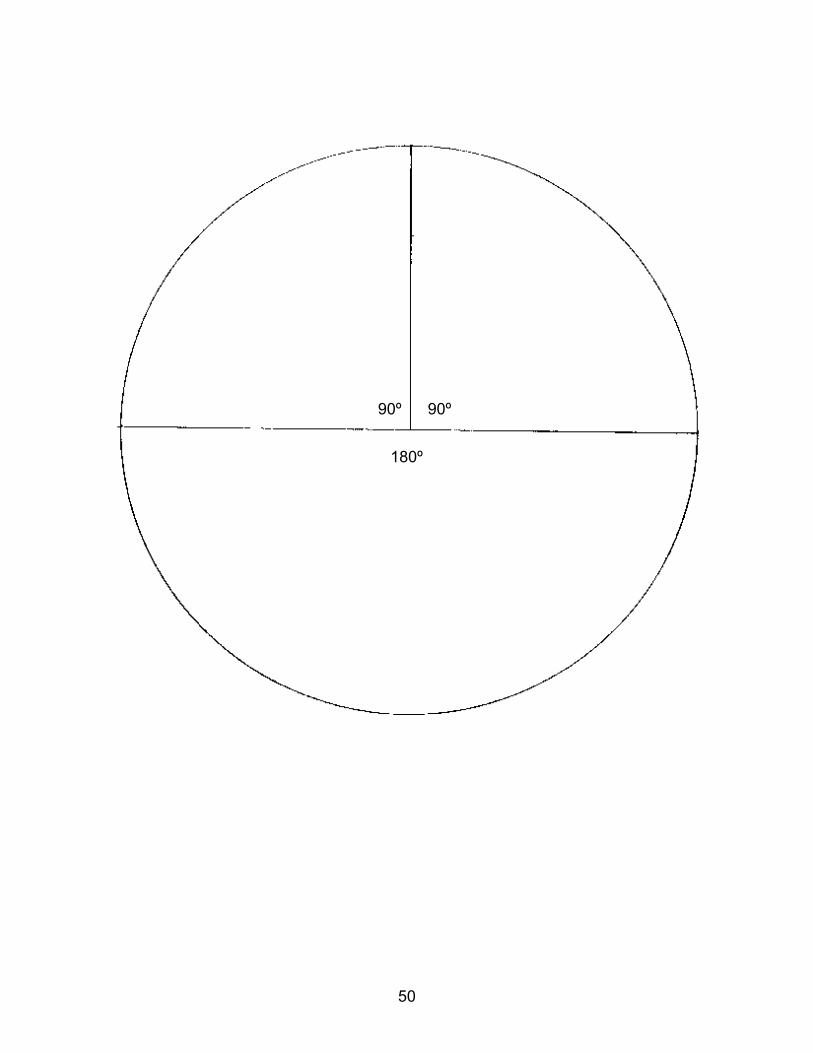
ÿ two triangular wedges of 90º each joined to a third triangle of <180º
and >0º
ÿ two triangular wedges of 55º each joined to a third triangle of 70º
ÿ one each of triangular wedges that are 55º, 45º, and a 35º
ÿ one each of triangular wedges that are 37º, 32º, and a 21º
Main Lesson:
1 Students will be engaged in a facilitated class discussion as to what the
kaleidoscopes that they are examining are doing when placed on an object, or an
object is placed in them.
2 Have the students place the open-ended scopes over a letter "P" (this
letter is easy to through the reflections), and then come up and reproduce on the
board or overhead what they are seeing.
3 Due to the time constraints of a 45min. lesson, it would be well advised if
the students ask why only these combinations that previous trial and error have
concluded that others produce blurred images.

48
4 Students will be divided into groups of three to six each, hopefully (with
the options available) representing students interested in constructing each of the
three available designs.
5 Students each receive one 4x6in. piece of posterboard, in-class
exploration sheet, scissors, and gluesticks.
6 Students will glue the pattern of their choice to the back (white) side of the
posterboard and cut out the pattern.
7 Students will place the straightedge along the rays emitting from their
vertex and carefully fold upward and then downward over the same ray.
8 Students will then tape the two outside edges together to form the trihedral
funnel kaleidoscopes.
9 Students will place coins or other small objects into the funnels and note
their resulting reflections on the exploration sheets.
Main Lesson: Conclusion
1 After the students have had time to complete this task, have the groups
share their results in a facilitated classroom forum.
2 Students will keep their exploration sheets to assist in the take-home
summary assignment.
3 Students will be given one more piece of the 4x6in posterboard, and the
take-home summary sheet.
4 Students will be asked to experiment with the final pattern of as their take-
home assignment, noting on the sheet what various results they get by sliding

49
the edge of the outside 90º wedge against the 180º wedge to form an infinite
number of trihedral funnels, and at about which angle these affect occurred.
5 Students will keep the kaleidoscopes but will bring them with them to the
next class to compare results and hand-in the summary sheets and exploration
sheets for assessment.
50
90º 90º
180º

51
37º
32º
21º
55º
45º 35º
55º
55º
70º