Unit-level analyses of the power sector
38
Unit-level analyses of the power sector November 17, 2020 Payne Institute Colorado School of Mines Steve Davis Dept. of Earth System Science Dept. of Civil and Environmental Engineering University of California, Irvine [email protected] @SteveDavisUCI
Transcript of Unit-level analyses of the power sector

Unit-level analyses of the power sector
November 17, 2020Payne Institute
Colorado School of Mines
Steve DavisDept. of Earth System ScienceDept. of Civil and Environmental EngineeringUniversity of California, [email protected]@SteveDavisUCI

Outline
“Committed” CO2 emissions
Water use (Flexibility, intensity, and vulnerability)
Tong et al., Nature, 2019
Y. Qin et al., Nature Sustainability, 2019
Shearer et al., AGU Advances, 2020
Fofrich et al., Environmental Research Letters, 2020
Retirement schedules

Jackson et al., ERL, 2018
Ambitious emissions trajectories
2.6 W/m2
(avoids 2 °C)
1.9 W/m2
(avoids 1.5 °C)
Past

Steering mitigation by looking at annual emissions?

35-60 Years
Infrastructural inertia

Infrastructural inertia
15-20 Years

Future CO2 emissions if existing (in 2009) fossil fuel-burning infrastructure were retired on schedule.
Annu
al e
mis
sion
s (G
t CO
2)
Committed emissions, 2009 cumulative: ~500 Gt CO2
Davis et al., Science, 2010An
nual
em
issi
ons
(Gt C
O2)
Power Plants

Davis et al., Science, 2010
Committed warming, 2009
<1.5 °C

Committed emissions, 2018 cumulative: ~650 Gt CO2Including proposed: ~830 Gt CO2
Power Plants
Tong et al., Nature, 2019

Age distribution of global power plants(as of 2018)
Tong et al., Nature, 2019

Comparing with carbon budgets, sensitivity to assumptions
Tong et al., Nature, 2019
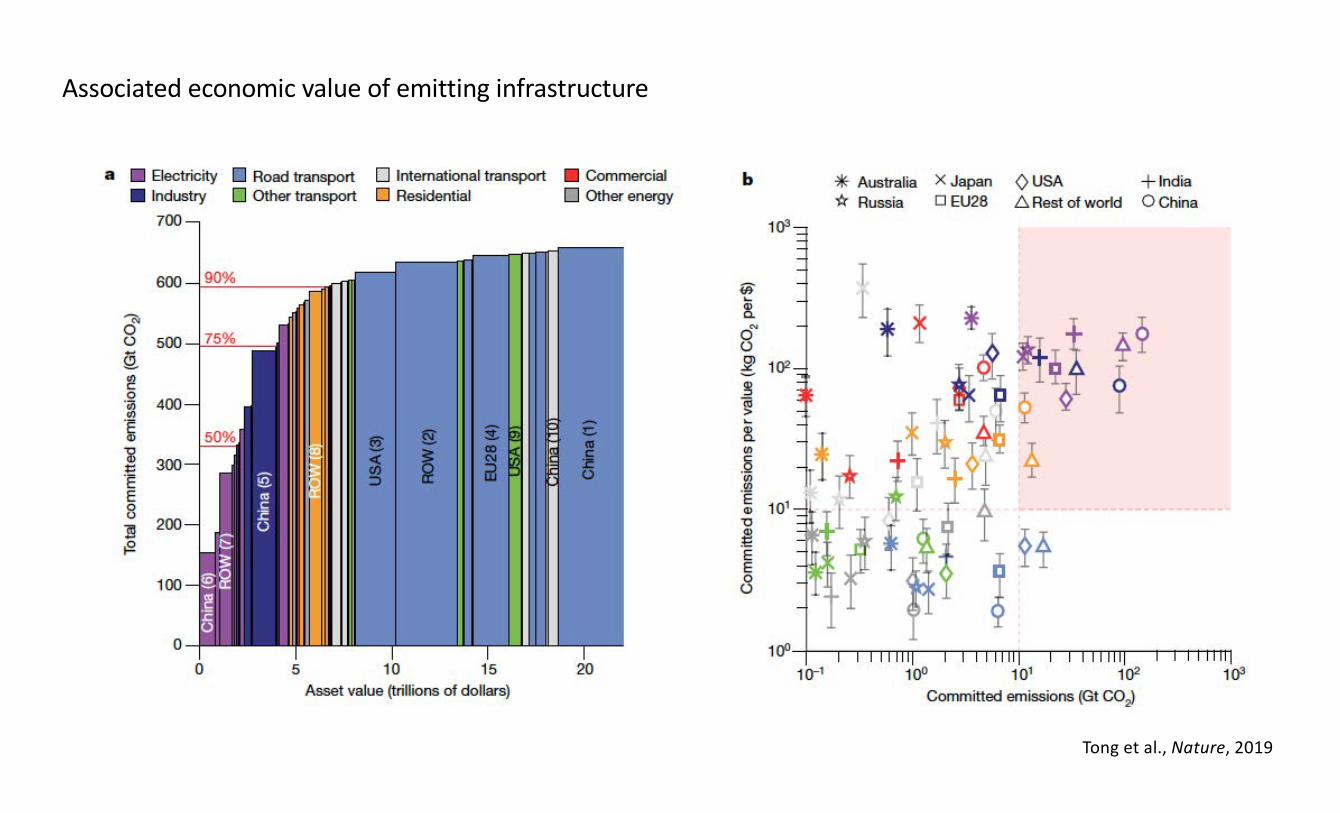
Associated economic value of emitting infrastructure
Tong et al., Nature, 2019

Tong et al., Nature, 2019
Looking on the bright side

Take-aways
• If operated as historically, future emissions from existing (and proposed) energy infrastructure will be ~650 (~830) Gt CO2
• This represents:• more than the entire carbon budget in scenarios that limit mean
warming to 1.5 °C (420-580 Gt CO2), and
• four-fifths of the budget required by scenarios that limit warming to 2 °C (870-1120 Gt CO2)
• Although there are many aspirations for a ”green” COVID recovery, stimulus may go the wrong way: China has permitted 17 GW of coal capacity since January, and construction has already begun on 11 GW.

U.S. power sector emissions
Between 2010 and 2018, U.S. power plant emissions declined by 24%
(from 2.39 to 1.76 Gt CO2).
The decline reflects a large-scale transition from coal to less carbon-intensive natural gas.

Shearer et al., AGU Advances, 2020
Age distribution of U.S. power plants(as of 2000)

Age distribution of U.S. power plants(as of 2018)
Shearer et al., AGU Advances, 2020

Age distribution of retired U.S. power plants(2000-2018)
Shearer et al., AGU Advances, 2020

Committed emissions perspective is thus different…
Whereas annual emissions declined by 24% 2000-2018, committed CO2 emissions decreased by only 12% (6 Gt).
The latter decrease is even less if methane leakage is considered (~4% decrease at 2% leakage).
Sensitive to assumed lifetime and CF. But note that CFs of gas have been increasing.
Shearer et al., AGU Advances, 2020

Take-aways
• If plants operate at average capacity factors, mid-century climate targets factors will require 300-400 GW of existing combined cycle gas capacity to retire (or retrofit with CCS) before reaching 40 years old.
• And of course that number increases with every plant we commission (according to EIA, 9.3 GW of new gas capacity was planned for 2020).
Shearer et al., AGU Advances, 2020
inconsistent
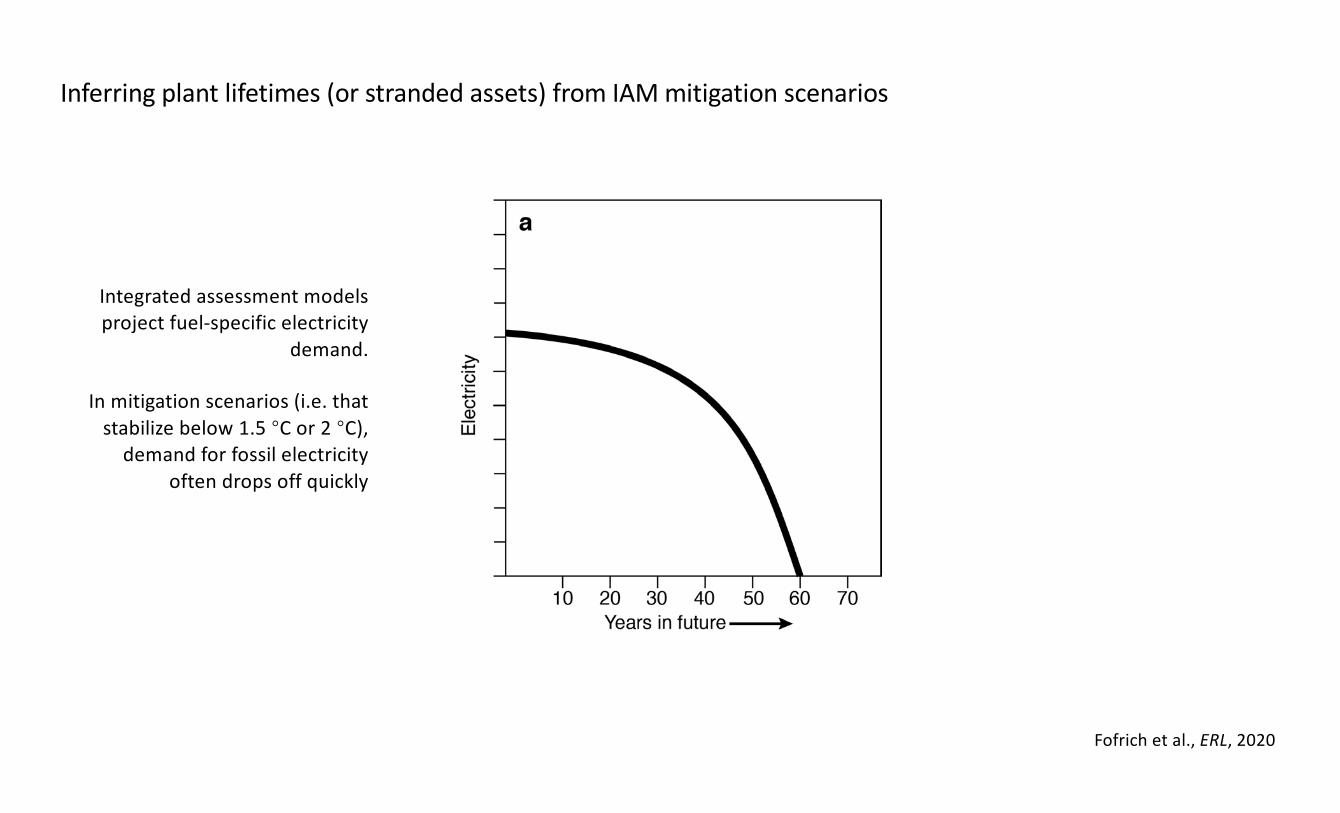
Inferring plant lifetimes (or stranded assets) from IAM mitigation scenarios
Fofrich et al., ERL, 2020
Integrated assessment models project fuel-specific electricity
demand.
In mitigation scenarios (i.e. that stabilize below 1.5 °C or 2 °C),
demand for fossil electricity often drops off quickly

Fofrich et al., ERL, 2020
But existing capacity may not be sufficient to meet the projected demand if it retires on schedule.
Inferring plant lifetimes (or stranded assets) from IAM mitigation scenarios

Fofrich et al., ERL, 2020
Thus, the scenarios imply new capacity.
Inferring plant lifetimes (or stranded assets) from IAM mitigation scenarios
Fofrich et al., ERL, 2020
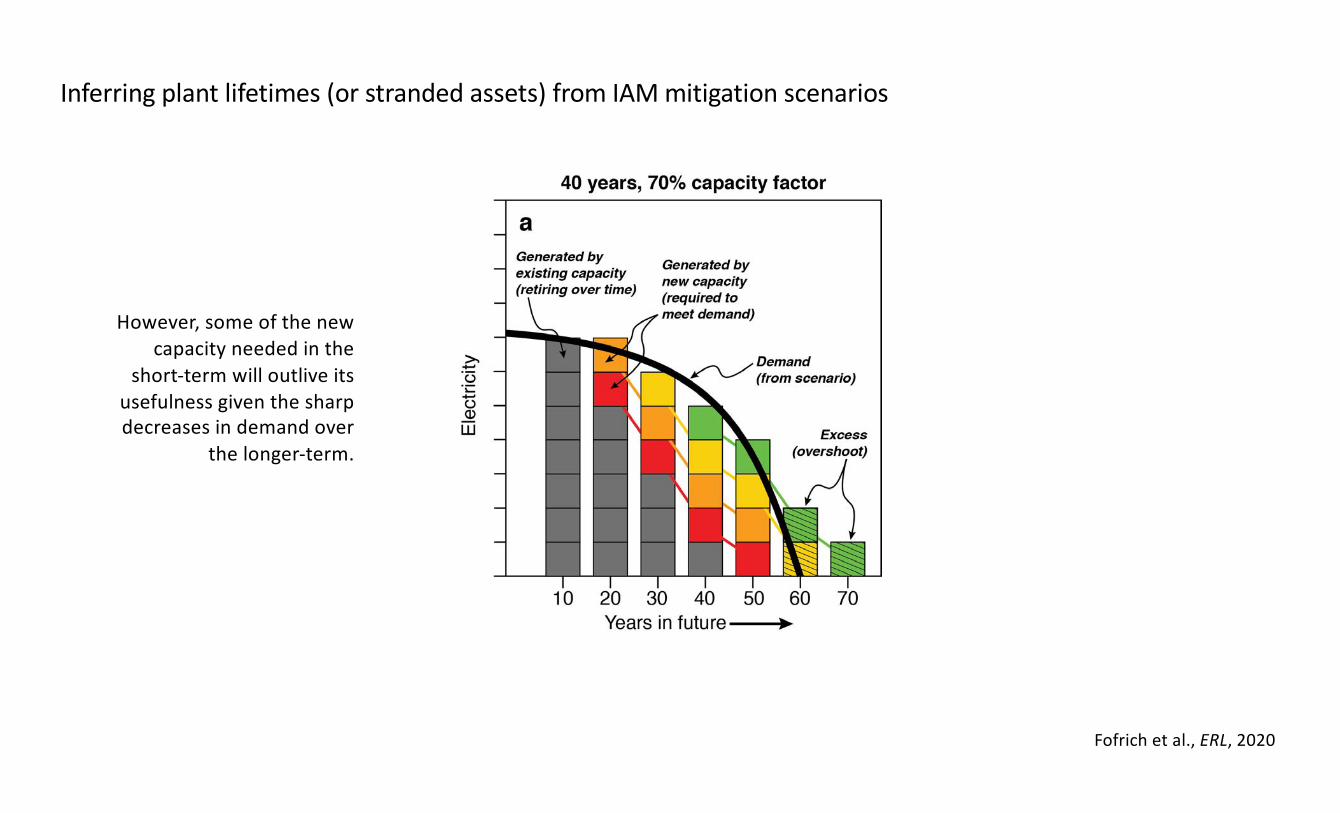
However, some of the new capacity needed in the
short-term will outlive its usefulness given the sharp decreases in demand over
the longer-term.
Inferring plant lifetimes (or stranded assets) from IAM mitigation scenarios

Fofrich et al., ERL, 2020
As with estimates of committed emissions, the magnitude of excess capacity depends on expected retirement ages and capacity factors.
Inferring plant lifetimes (or stranded assets) from IAM mitigation scenarios

The most ambitious SSP scenarios imply very short plant lifetimes, especially for coal
Fofrich et al., ERL, 2020
(likely to stabilize at <1.5 °C) (likely to stabilize at <1.5 °C)

Fofrich et al., ERL, 2020
Less problems for gas in 2 °C scenarios, but still a big coal hangover
(likely to stabilize at <2 °C) (likely to stabilize at <2 °C)

Take-aways
• Climate mitigation scenarios rely on the early retirement of power plants.
• Quantifying lifetimes and operating limits of power plants consistent with climate goals may inform energy investments, permitting, and policies.
Fofrich et al., ERL, 2020
40% CF

Studies of water stress have tended to focus on water resources

But the major uses of water around the world are highly varied
Agriculture(annual crops)
Agriculture(perennial crops)
Cooling of thermal power plants
Evaporative losses from reservoirs
Direct human consumption
Livestock
Inflexible uses

Methods: Cooling of thermal power plants
(1) Geolocated all thermal generating units(2) Determined cooling technology of each(3) Analyzed water use for heat dissipation as a function of cooling technology,
thermal efficiency, estimated electricity generation, and meteorological conditions (MERRA-2 Reanalysis data of temperature, humidity, and wind speed).
Qin et al., Nature Sustainability, 2019

Methods: Evaporative losses from reservoirs
Based on reservoir location and surface area from the Global Reservoir and Dam (GRanD) database, we estimated yearly evaporation using same MERRA-2 Reanalysis data (e.g., temperature, humidity, and wind speed).
Qin et al., Nature Sustainability, 2019

Inflexible and flexible water consumption have been increasing
Qin et al., Nature Sustainability, 2019
Relative to other uses, cooling of thermal power plants is small, though water
evaporated from reservoirs is substantial.

Water stress index
Qin et al., Nature Sustainability, 2019

There is a large range in water consumption intensities of power
In some cases, most water stressed basins
(yellows and reds) have both large generation (y-axis) and high water use
intensities (x-axis).
Qin et al., Nature Sustainability, 2019

Take-aways
• Globally, some water basins are characterized by less flexible water uses
• A vulnerability index that includes such inflexibility shows that vulnerable (and sometimes highly exposed) basins are concentrated in the Western U.S., the Middle East, and Central and East Asia.
• Some of these vulnerable basins also have high consumption intensities, suggesting opportunities to reduce vulnerability by switching technologies/crops or relocating production.

Overarching take-aways
• Unit-level analyses of emissions and resource use in the power sector complement retrospective analyses and energy-emissions models:
1. Expected lifetimes and current asset values suggest future emissions (or stranded assets)
2. Specificity may support planning and policy interventions that high-level scenarios do not
3. Emissions or water use intensities can identify targeted mitigation opportunities
• Ongoing work in this theme:
1. Analyses of recent retirements and most ‘at-risk’ capacity.
2. A ‘capacity expansion’ model that adds unit-level granularity to integrated assessment model scenarios in order to project future criteria emissions-–and health impacts
Thank you.Acknowledgements
(My Group) Dan Tong (postdoc), Robert Fofrich (PhD student), Yue Qin (faculty at Ohio State), Chaopeng Hong (postdoc), Xinying Qin (PhD student), Christine Shearer (Global Energy Monitor)
(Collaborators)Amir AghaKouchak Jen Burney Ken CaldeiraKate Calvin Dabo Guan Rob JacksonNathan Mueller Joeri Rogelj Christine ShearerStefan Siebert Qiang Zhang Julie Zimmerman
Unit-level database of power plant emissions available here:http://www.meicmodel.org/dataset-gped.html