Unit C- 1: List of Subjectsmercury.pr.erau.edu/~hayasd87/ES312/ES312_I_Notes_… · ·...
8
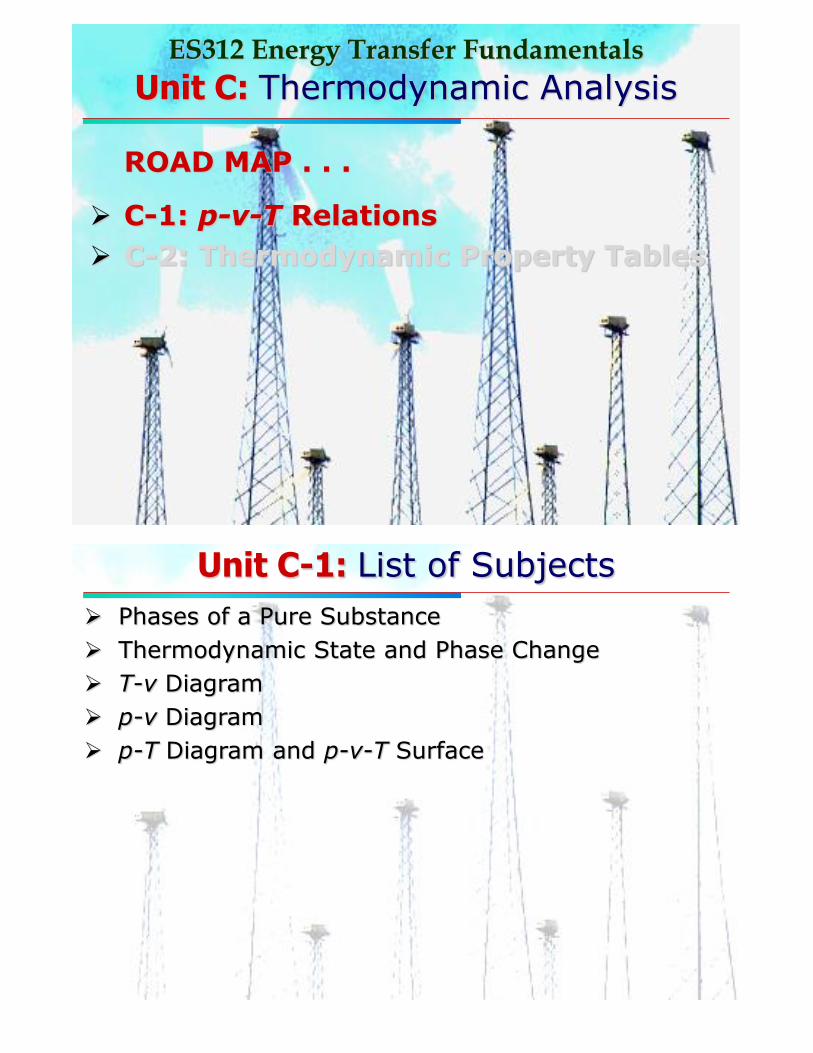
ES312 Energy Transfer Fundamentals Unit C: Thermodynamic Analysis ROAD MAP . . . C - 1: p - v - T Relations C - 2: Thermodynamic Property Tables Unit C - 1: List of Subjects Phases of a Pure Substance Thermodynamic State and Phase Change T - v Diagram p - v Diagram p - T Diagram and p - v - T Surface
Transcript of Unit C- 1: List of Subjectsmercury.pr.erau.edu/~hayasd87/ES312/ES312_I_Notes_… · ·...
ES312 Energy Transfer Fundamentals
Unit C: Thermodynamic Analysis
ROAD MAP . . .
C-1: p-v-T Relations
C-2: Thermodynamic Property Tables
ES312 Energy Transfer Fundamentals
Unit C-1: List of Subjects
Phases of a Pure Substance
Thermodynamic State and Phase Change
T-v Diagram
p-v Diagram
p-T Diagram and p-v-T Surface
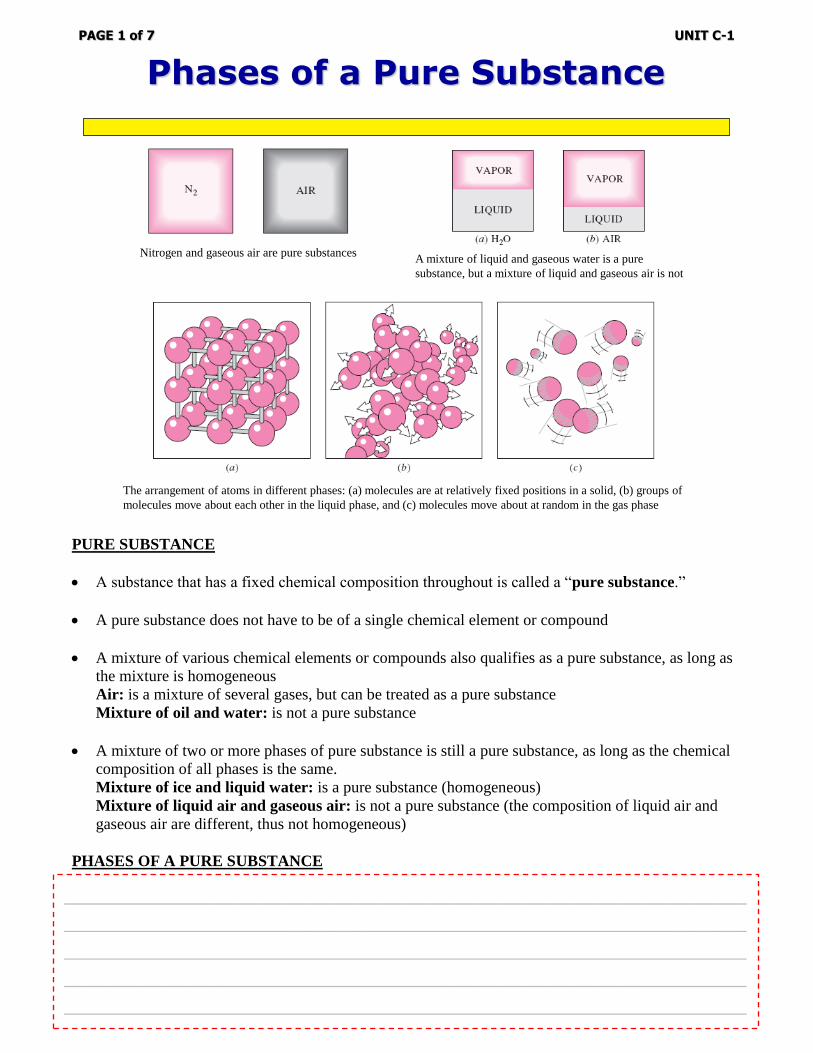
PURE SUBSTANCE
A substance that has a fixed chemical composition throughout is called a “pure substance.”
A pure substance does not have to be of a single chemical element or compound
A mixture of various chemical elements or compounds also qualifies as a pure substance, as long as
the mixture is homogeneous
Air: is a mixture of several gases, but can be treated as a pure substance
Mixture of oil and water: is not a pure substance
A mixture of two or more phases of pure substance is still a pure substance, as long as the chemical
composition of all phases is the same.
Mixture of ice and liquid water: is a pure substance (homogeneous)
Mixture of liquid air and gaseous air: is not a pure substance (the composition of liquid air and
gaseous air are different, thus not homogeneous)
PHASES OF A PURE SUBSTANCE
A pure substance may have several “phases.”
Solid: the molecules are arranged in a 3-D pattern (called, “lattice”) that is repeated throughout.
Liquid: the molecules are no longer at fixed positions
Gas: the molecules are far apart from each other
UNIT C-1PAGE 1 of 7
Phases of a Pure Substance
Nitrogen and gaseous air are pure substancesA mixture of liquid and gaseous water is a pure
substance, but a mixture of liquid and gaseous air is not
The arrangement of atoms in different phases: (a) molecules are at relatively fixed positions in a solid, (b) groups of
molecules move about each other in the liquid phase, and (c) molecules move about at random in the gas phase
_________________________________________________________
_________________________________________________________
_________________________________________________________
_________________________________________________________
_________________________________________________________
_________________________________________________________
_________________________________________________________

PHASE-CHANGE PROCESS OF PURE SUBSTANCES
As a familiar substance, water is used to demonstrate the basic principles of phase-change process (a
pure substances exhibit the similar general behavior). Main focus is the liquid and vapor phases and
their mixture, demonstrated by a piston-cylinder device.
STATE 1 (Compressed or subcooled Liquid)
Under the given condition of water (1 atm and 20 C), water exists in the liquid phase, called the
“compressed” or “subcooled” liquid; meaning that it is NOT about to vaporize.
STATE 2 (Saturated Liquid)
As more heat is transferred, the temperature keeps rising until it reaches 100 C. At this point, water
is still a liquid, but any heat addition will cause some of the liquid to vaporize: this is called the
“saturated” liquid; meaning that it is about to vaporize.
STATE 3 (Saturated Liquid-Vapor Mixture)
Once boiling starts, the temperature stops rising until the liquid is completely vaporized. Until all
liquid water is completely vaporized, liquid and gaseous water (vapor) can co-exist: this is called the
“saturated liquid-vapor mixture.”
STATE 4 (Saturated Vapor)
As more heat is transferred, the entire cylinder is filled with vapor that is on the borderline of the
liquid phase: this is called the “saturated” vapor; meaning that any loss of heat from this vapor will
cause some of the vapor to condense
STATE 5 (Superheated Vapor)
As more heat is transferred, the vapor in the cylinder begins to increase: this is called the
“superheated” vapor; meaning that it is NOT about to condense.
UNIT C-1PAGE 2 of 7
Thermodynamic State and Phase Change
At 1 atm and 20 C, water exists in
the liquid phase (compressed liquid)
At 1 atm and 100 C, water exists as a liquid
that is ready to vaporize (saturated liquid)
At 1 atm, the temperature remains
constant at 100 C until the last drop of
liquid is vaporized (saturated vapor)
As more heat is transferred, part of
the saturated liquid vaporizes
(saturated liquid-vapor mixture)
As more heat is transferred, the
temperature of the vapor starts to rise
(superheated vapor)
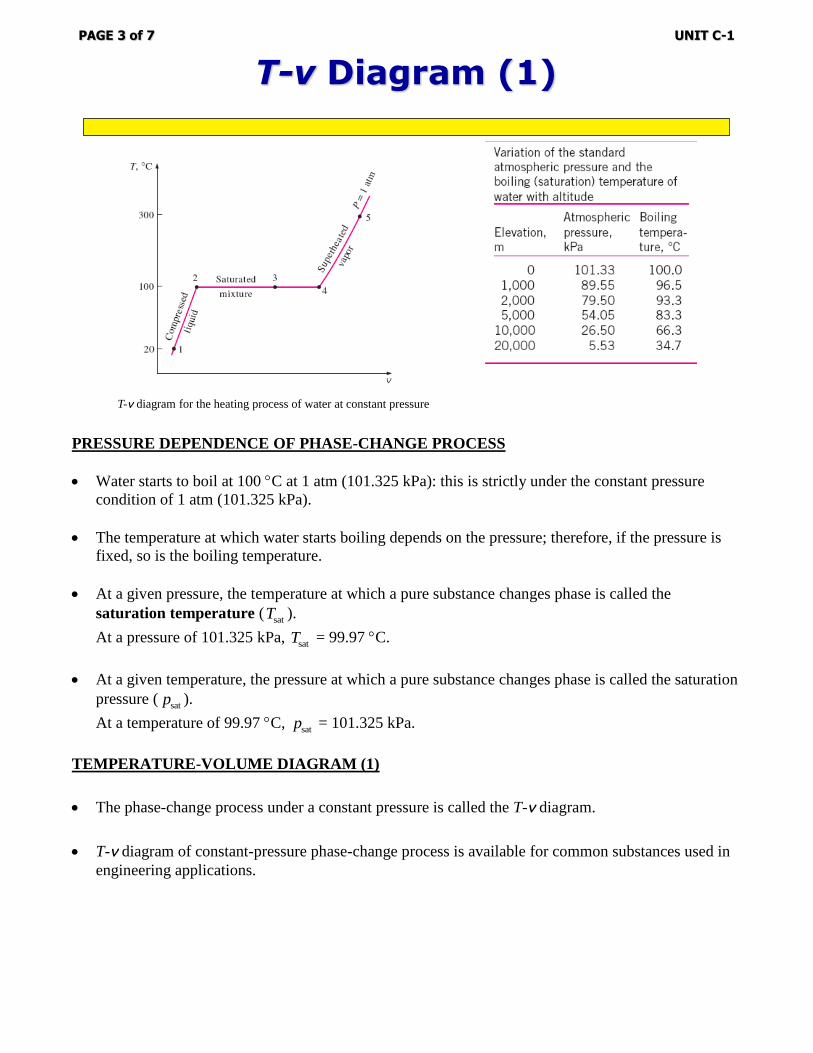
PRESSURE DEPENDENCE OF PHASE-CHANGE PROCESS
Water starts to boil at 100 C at 1 atm (101.325 kPa): this is strictly under the constant pressure
condition of 1 atm (101.325 kPa).
The temperature at which water starts boiling depends on the pressure; therefore, if the pressure is
fixed, so is the boiling temperature.
At a given pressure, the temperature at which a pure substance changes phase is called the
saturation temperature (satT ).
At a pressure of 101.325 kPa, satT = 99.97 C.
At a given temperature, the pressure at which a pure substance changes phase is called the saturation
pressure (satp ).
At a temperature of 99.97 C, satp = 101.325 kPa.
TEMPERATURE-VOLUME DIAGRAM (1)
The phase-change process under a constant pressure is called the T-v diagram.
T-v diagram of constant-pressure phase-change process is available for common substances used in
engineering applications.
UNIT C-1PAGE 3 of 7
T-v Diagram (1)
T-v diagram for the heating process of water at constant pressure

TEMPERATURE-VOLUME DIAGRAM (2)
T-v diagram of constant-pressure phase-change process can further be plotted on different pressure
values. As the pressure changes, one can observe the different values for saturation temperatures.
The horizontal line that connects the saturated liquid and saturated vapor states is called the
“saturation line”: meaning that the saturated two-phase mixture (liquid-vapor) exist along this line.
As the pressure increases, this saturation line continues to “shrink,” and it becomes a point when the
pressure reaches 22.06 MPa for the cases of water: this point is called the “critical point,” and it is
defined as the point at which the saturated liquid and saturated vapor states are identical.
CRITICAL POINT
One can define a boundary between compressed liquid and saturated two-phase mixture by
connecting the locations of STATE 2: this is called the “saturated liquid line”).
Also, similarly, one can define a boundary between saturated two-phase mixture and superheated
vapor by connecting the locations of STATE 4: this is called the “saturated vapor line”).
VAPOR DOME
Saturated liquid and vapor lines will meet at the critical point, completing the map of three different
regions in the diagram: this is called the “vapor dome.”
Above critical point (supercritical pressures), there is no distinct phase-change process.
UNIT C-1PAGE 4 of 7
T-v Diagram (2)
T-v diagram of constant-pressure phase-change
processes of a pure substance (water) at various
pressures
T-v diagram of a pure substance
At supercritical pressures (P > Pcr),
there is no distinct phase-change
(boiling) process)
_________________________________________________________
_________________________________________________________
_________________________________________________________
_________________________________________________________
_________________________________________________________
_________________________________________________________
For water: Table A-1 (A-1E) p
cr = 22.06 MPa
Tcr
= 373.95 °C
vcr
= 0.003106 m3/kg

PRESSURE -VOLUME DIAGRAM
The general shape of the p-v diagram of a pure substance is very much like the T-v diagram.
For a given temperature, the phase change process (compressed liquid => saturated liquid-vapor =>
superheated vapor) is plotted, similar to the T-v diagram.
EXTENDED PRESSURE-VOLUME DIAGRAM (INCLUDING THE SOILD PHASE)
Most substances “contract” during a solidification (i.e., freezing) process. However, a few
substances (actually including water) “expand” as they freeze.
Water “expands” upon freezing: means that water ice is lighter than liquid water.
The p-v diagrams for both groups of substances are available.
TRIPLE LINE
Under certain conditions, all three phases (for water: solid-ice, liquid-water, and gas-vapor) can
coexist in equilibrium. These triple-phase states form a line, called the “triple line.”
At low pressures, solids evaporate without melting first: this is called “sublimation.”
UNIT C-1PAGE 5 of 7
p-v Diagram (1)
Triple Line:
Three-phases coexist
(solid, liquid, and vapor)
P-v diagram of a substance that contracts on freezing
At low pressures (below the triple-point
value), solids evaporate without melting
first (sublimation)
_________________________________________________________
_________________________________________________________
_________________________________________________________
_________________________________________________________
_________________________________________________________
_________________________________________________________
_________________________________________________________
_________________________________________________________
_________________________________________________________
_________________________________________________________
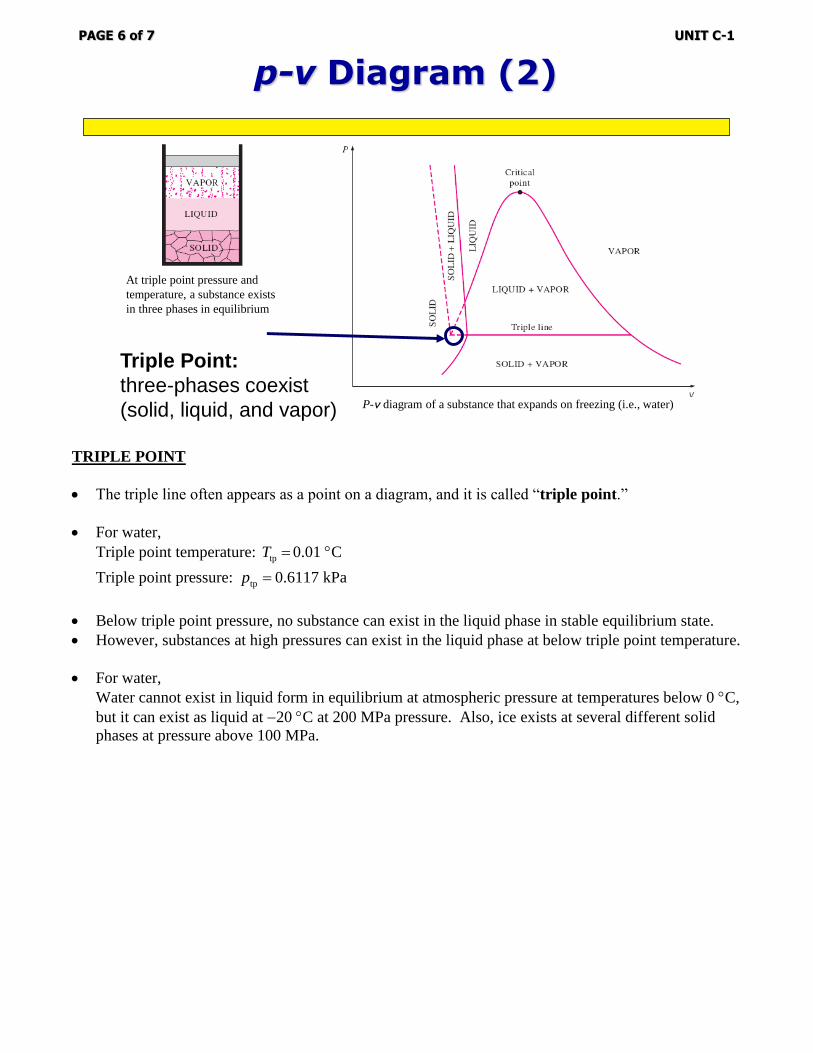
TRIPLE POINT
The triple line often appears as a point on a diagram, and it is called “triple point.”
For water,
Triple point temperature: tpT 0.01 C
Triple point pressure: tpp 0.6117 kPa
Below triple point pressure, no substance can exist in the liquid phase in stable equilibrium state.
However, substances at high pressures can exist in the liquid phase at below triple point temperature.
For water,
Water cannot exist in liquid form in equilibrium at atmospheric pressure at temperatures below 0 C,
but it can exist as liquid at 20 C at 200 MPa pressure. Also, ice exists at several different solid
phases at pressure above 100 MPa.
UNIT C-1PAGE 6 of 7
p-v Diagram (2)
Triple Point:
three-phases coexist
(solid, liquid, and vapor) P-v diagram of a substance that expands on freezing (i.e., water)
At triple point pressure and
temperature, a substance exists
in three phases in equilibrium

PRESSURE-TEMPERATURE DIAGRAM
The p-T diagram of a pure substance is often called the “phase” diagram, since all three phases are
separated from each other by three lines.
Sublimation line: separates the solid and vapor regions
Vaporization line: separates the liquid and vapor regions
Melting (or “fusion”) line: separates the solid and liquid regions
These three lines meet at the triple point, where all three phases coexist in equilibrium.
The vaporization line ends at the critical point, because no distinction can be made between liquid
and vapor phases above the critical point.
Substances that expand and contract on freezing differ only in the melting line on the diagram.
THE PRESSURE-VOLUME-TEMPERATURE SURFACE
The state of a simple compressible substance is fixed by any two independent, intensive properties.
Once the two appropriate properties are fixed, all the other properties become dependent properties. We
can represent the p-v-T behavior of a substance as a surface in space.
UNIT C-1PAGE 7 of 7
p-T Diagram and p-v-T Surface
P-T diagram of a pure substance
P-v-T surface of a pure substance
that contracts on freezing
P-v-T surface of a pure substance
that expands on freezing (i.e., water)