Unit B1 *GDW12* *G5802* Higher Tier
20
12271 Centre Number Candidate Number TIME 1 hour. INSTRUCTIONS TO CANDIDATES Write your Centre Number and Candidate Number in the spaces provided at the top of this page. You must answer the questions in the spaces provided. Do not write outside the boxed area on each page or on blank pages. Complete in black ink only. Do not write with a gel pen. Answer all eight questions. INFORMATION FOR CANDIDATES The total mark for this paper is 70. Figures in brackets printed down the right-hand side of pages indicate the marks awarded to each question or part question. Quality of written communication will be assessed in Question 3. *GDW12* *GDW12* *20GDW1201* *20GDW1201* Double Award Science: Biology Unit B1 Higher Tier [GDW12] WEDNESDAY 27 FEBRUARY 2019, MORNING General Certificate of Secondary Education 2018–2019 New Specification
Transcript of Unit B1 *GDW12* *G5802* Higher Tier

12271
*G5802*
Centre Number
Candidate Number
TIME1 hour.
INSTRUCTIONS TO CANDIDATES
Write your Centre Number and Candidate Number in the spaces provided at the top of this page.You must answer the questions in the spaces provided.Do not write outside the boxed area on each page or on blank pages.Complete in black ink only. Do not write with a gel pen.Answer all eight questions.
INFORMATION FOR CANDIDATES
The total mark for this paper is 70.Figures in brackets printed down the right-hand side of pages indicate the marks awarded to each question or part question.Quality of written communication will be assessed in Question 3.
*GDW12*
*GDW12*
*20GDW1201*
*20GDW1201*
Double Award Science: BiologyUnit B1Higher Tier
[GDW12]WEDNESDAY 27 FEBRUARY 2019, MORNING
General Certificate of Secondary Education2018–2019
New
Specification
12271
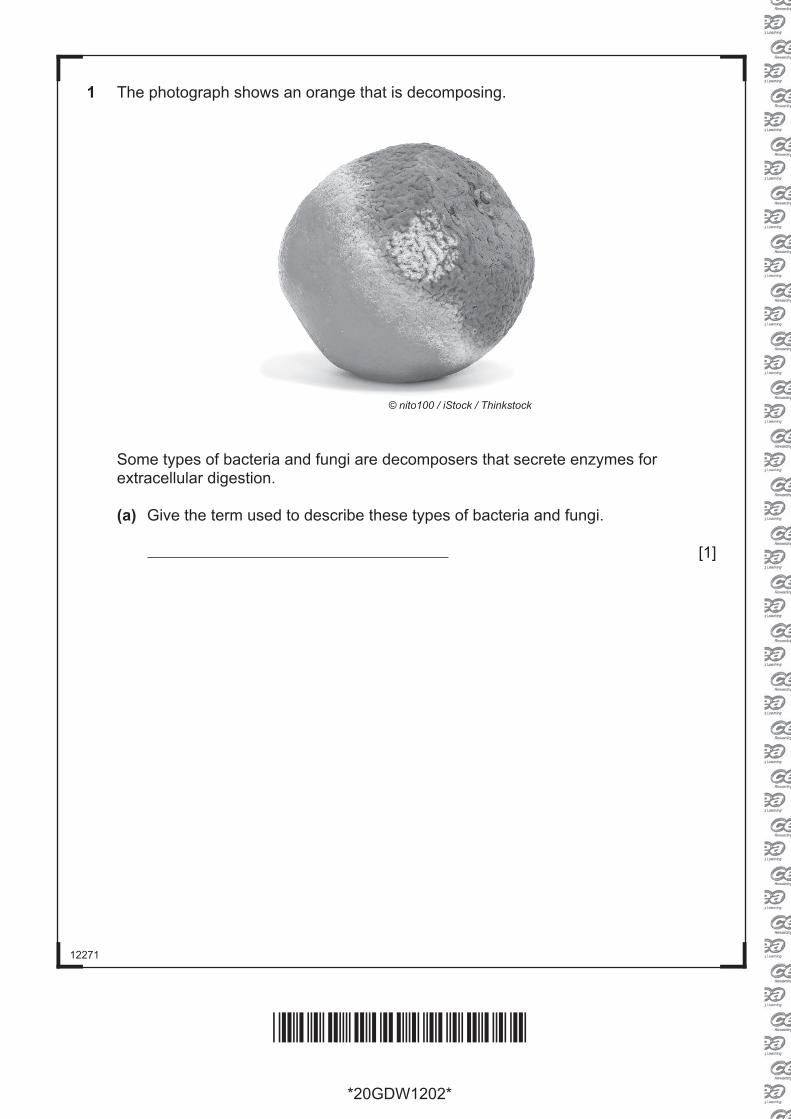
1 The photograph shows an orange that is decomposing.
© nito100 / iStock / Thinkstock
Some types of bacteria and fungi are decomposers that secrete enzymes for extracellular digestion.
(a) Give the term used to describe these types of bacteria and fungi.
[1]
*20GDW1202*
*20GDW1202*

12271[Turn over
*20GDW1203*
*20GDW1203*
(b) The rate of decomposition of the orange by decomposers is affected by the levelof oxygen and the temperature.
Increasing the level of oxygen increases the rate of decomposition of theorange.
(i) Explain why.
[2]
Increasing the temperature from 10 °C to 20 °C increases the rate of decomposition of the orange.
(ii) Use your knowledge of enzymes to explain why.
[2]
(c) Give one other environmental factor that would affect the rate of decomposition.
[1]
12271
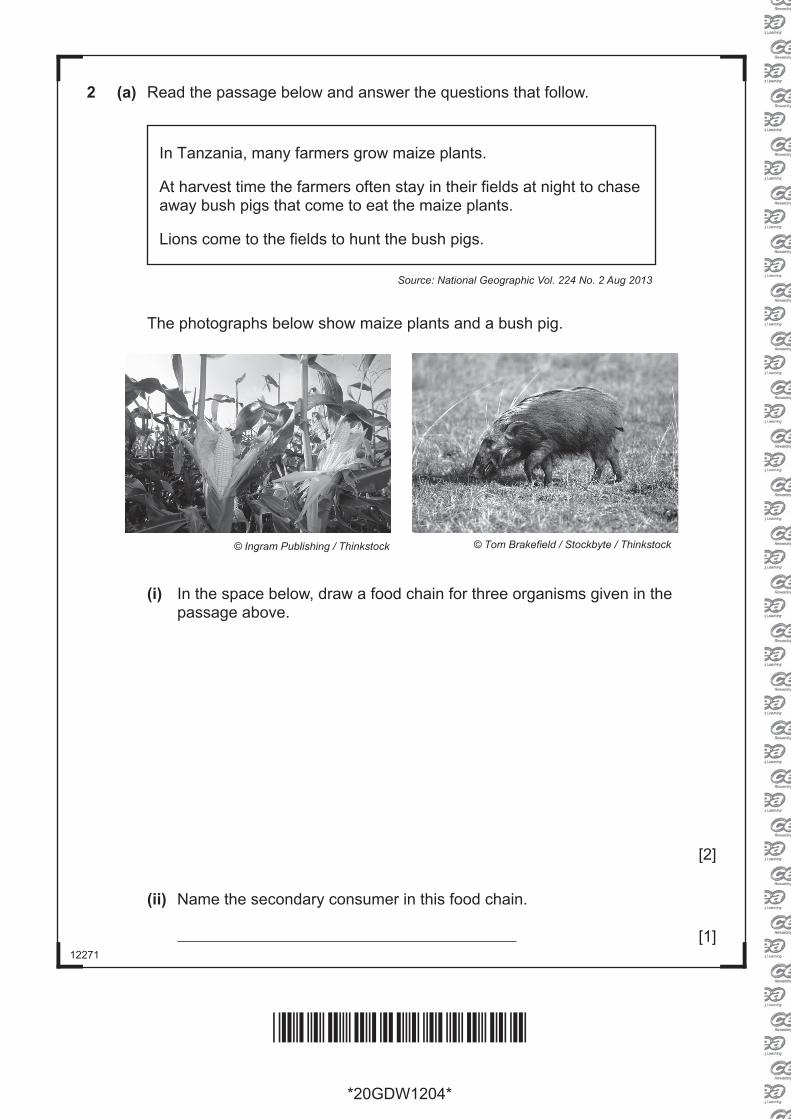
2 (a) Read the passage below and answer the questions that follow.
In Tanzania, many farmers grow maize plants.
At harvest time the farmers often stay in their fields at night to chase away bush pigs that come to eat the maize plants.
Lions come to the fields to hunt the bush pigs.
Source: National Geographic Vol. 224 No. 2 Aug 2013
The photographs below show maize plants and a bush pig.
© Ingram Publishing / Thinkstock
(i) In the space below, draw a food chain for three organisms given in thepassage above.
[2]
(ii) Name the secondary consumer in this food chain.
[1]
*20GDW1204*
*20GDW1204*
© Tom Brakefield / Stockbyte / Thinkstock

12271[Turn over
A study recorded 421 attacks by lions on farmers in Tanzania.The lions killed 282 farmers.The rest of the attacked farmers escaped with injuries and survived.
(b) Use the information given above to calculate the percentage (%) of lion attackswhere the attacked farmers escaped with injuries and survived.Give your answer to two decimal places.
Show your working.
% [3]
*20GDW1205*
*20GDW1205*
12271
3 Describe two similarities and four differences between the structure of an animal cell and a bacterial cell.
In this question you will be assessed on your written communication skills, including the use of specialist scientific terms.
Similarities
Differences
[6]
*20GDW1206*
*20GDW1206*
12271
BLANK PAGE
DO NOT WRITE ON THIS PAGE
(Questions continue overleaf)
[Turn over
*20GDW1207*
*20GDW1207*

12271
4 (a) A student investigated the effect of temperature on the enzyme amylase.
She set up six test tubes containing the same volumes of amylase and starch.She incubated each test tube at a different temperature.
Every five minutes she took a sample of the contents of each test tube and tested it for the presence of starch using iodine solution.
The reaction between amylase and starch was complete when no starch was detected in the sample.She recorded the time taken for no starch to be detected at each temperature.
The graph shows her results.
Temperature/°C
0 5 10 15 20 25 30 35 40 45 500
10
20
30
35
40
45
50
Tim
e ta
ken
for
no s
tarc
h to
be
dete
cted
/min
utes
5
15
25
55
55
Use the graph to help answer the following questions.
(i) Give the optimum temperature for this enzyme.
°C [1]
(ii) Explain why you chose this temperature using information from the graph.
[1]
*20GDW1208*
*20GDW1208*

12271[Turn over
(iii) Describe and explain the student’s result at 5 °C.
[3]
(b) Use the results shown in the graph opposite at 20 °C to complete the tablebelow by writing in the empty boxes.For each time, 10 and 20 minutes, write a tick (3) if starch was present or across (7) if starch was absent if samples were tested at these times.Give the colour of iodine solution at each of these times.
Time/minsStarch
present (3) or absent (7)Colour of iodine solution
10
20 [3]
At high temperatures amylase is denatured.(c) What does the term denatured mean?
[2]
In another investigation, the student left a sample of starch and denatured amylase for one hour at 30 °C.(d) Give the colour of iodine solution in this sample and explain the result.
Colour
Explanation
[2]
*20GDW1209*
*20GDW1209*
12271
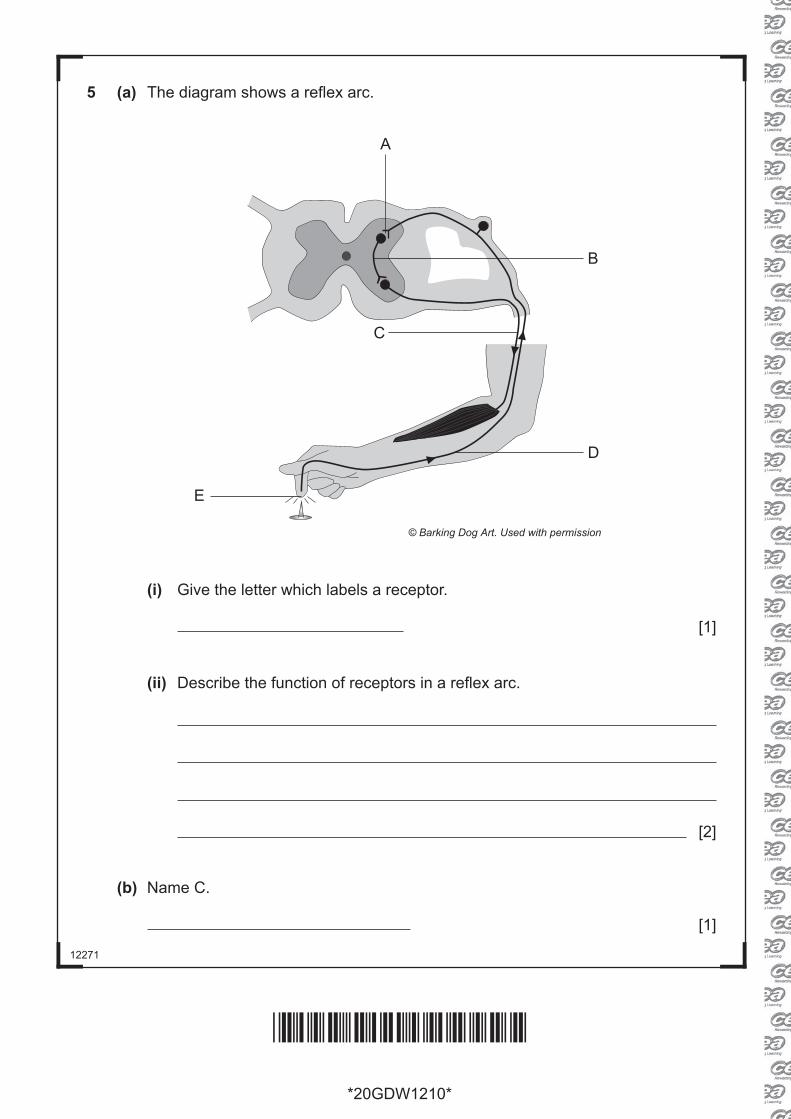
5 (a) The diagram shows a reflex arc.
E
D
C
A
B
© Barking Dog Art. Used with permission
(i) Give the letter which labels a receptor.
[1]
(ii) Describe the function of receptors in a reflex arc.
[2]
(b) Name C.
[1]
*20GDW1210*
*20GDW1210*
12271[Turn over
(c) (i) Give the letter which labels a synapse.
[1]
(ii) What is a synapse?
[1]
(d) Name the type of effector shown in this reflex arc.
[1]
*20GDW1211*
*20GDW1211*
12271
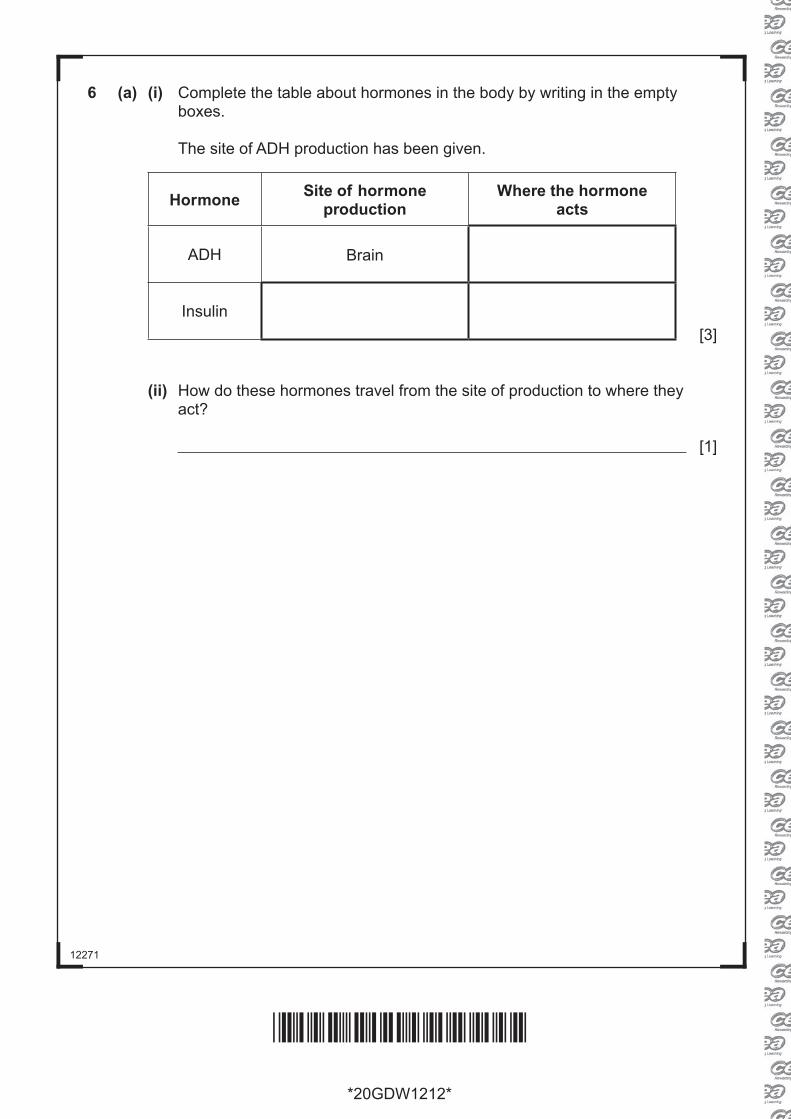
6 (a) (i) Complete the table about hormones in the body by writing in the empty boxes.
The site of ADH production has been given.
HormoneSite of hormone
productionWhere the hormone
acts
ADH Brain
Insulin [3]
(ii) How do these hormones travel from the site of production to where theyact?
[1]
*20GDW1212*
*20GDW1212*
12271[Turn over
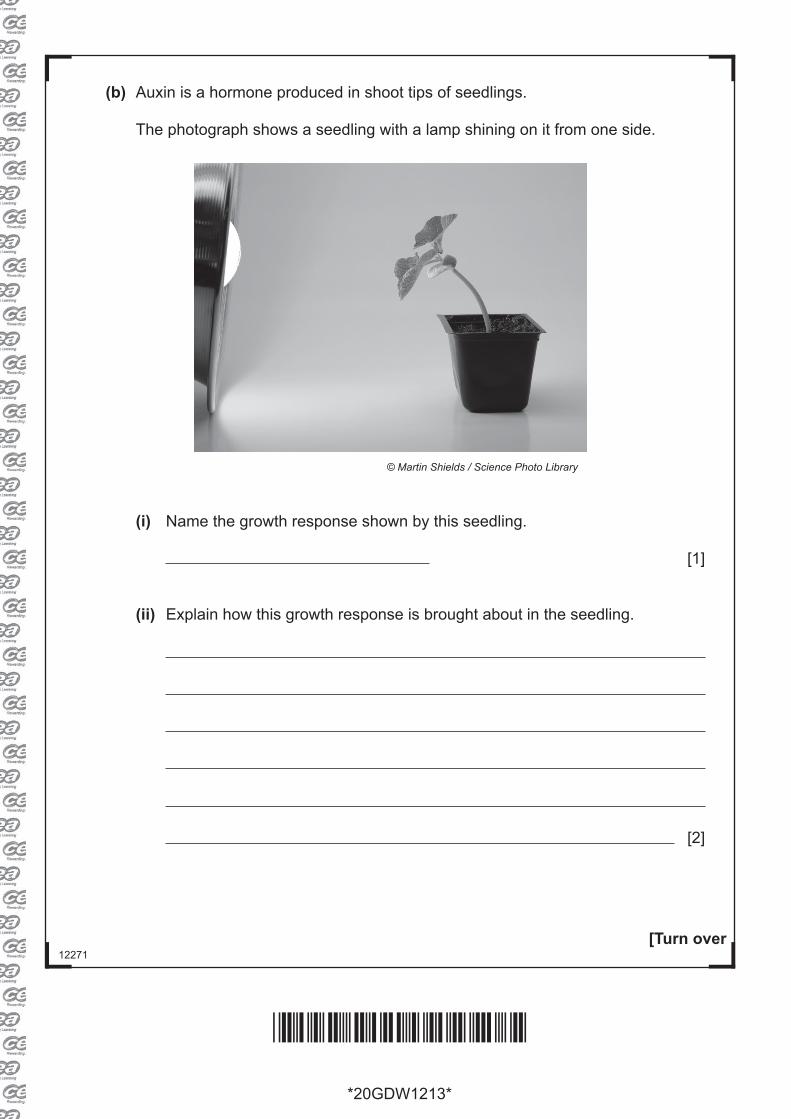
(b) Auxin is a hormone produced in shoot tips of seedlings.
The photograph shows a seedling with a lamp shining on it from one side.
© Martin Shields / Science Photo Library
(i) Name the growth response shown by this seedling.
[1]
(ii) Explain how this growth response is brought about in the seedling.
[2]
*20GDW1213*
*20GDW1213*
12271
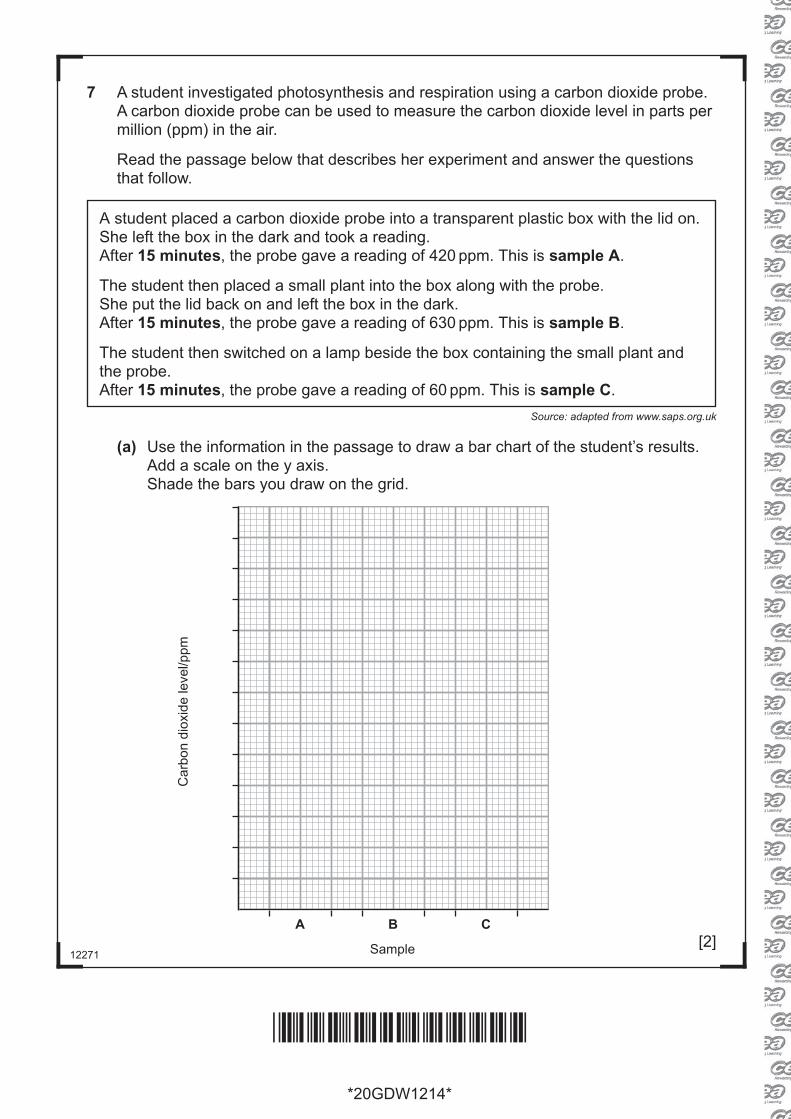
7 A student investigated photosynthesis and respiration using a carbon dioxide probe. A carbon dioxide probe can be used to measure the carbon dioxide level in parts per
million (ppm) in the air.
Read the passage below that describes her experiment and answer the questions that follow.
A student placed a carbon dioxide probe into a transparent plastic box with the lid on. She left the box in the dark and took a reading. After 15 minutes, the probe gave a reading of 420 ppm. This is sample A.
The student then placed a small plant into the box along with the probe.She put the lid back on and left the box in the dark.After 15 minutes, the probe gave a reading of 630 ppm. This is sample B.
The student then switched on a lamp beside the box containing the small plant and the probe.After 15 minutes, the probe gave a reading of 60 ppm. This is sample C.
Source: adapted from www.saps.org.uk
(a) Use the information in the passage to draw a bar chart of the student’s results. Add a scale on the y axis. Shade the bars you draw on the grid.
Sample
A
Car
bon
diox
ide
leve
l/ppm
B C
[2]
*20GDW1214*
*20GDW1214*

12271[Turn over
(b) Explain the increase in the carbon dioxide level between samples A and B.
[3]
(c) (i) Calculate the rate of change in the carbon dioxide level (ppm/min) between samples B and C.
Show your working.
ppm/min [3]
(ii) Explain the decrease in the carbon dioxide level between samples B and C.
[2]
*20GDW1215*
*20GDW1215*
12271
*20GDW1216*
*20GDW1216*
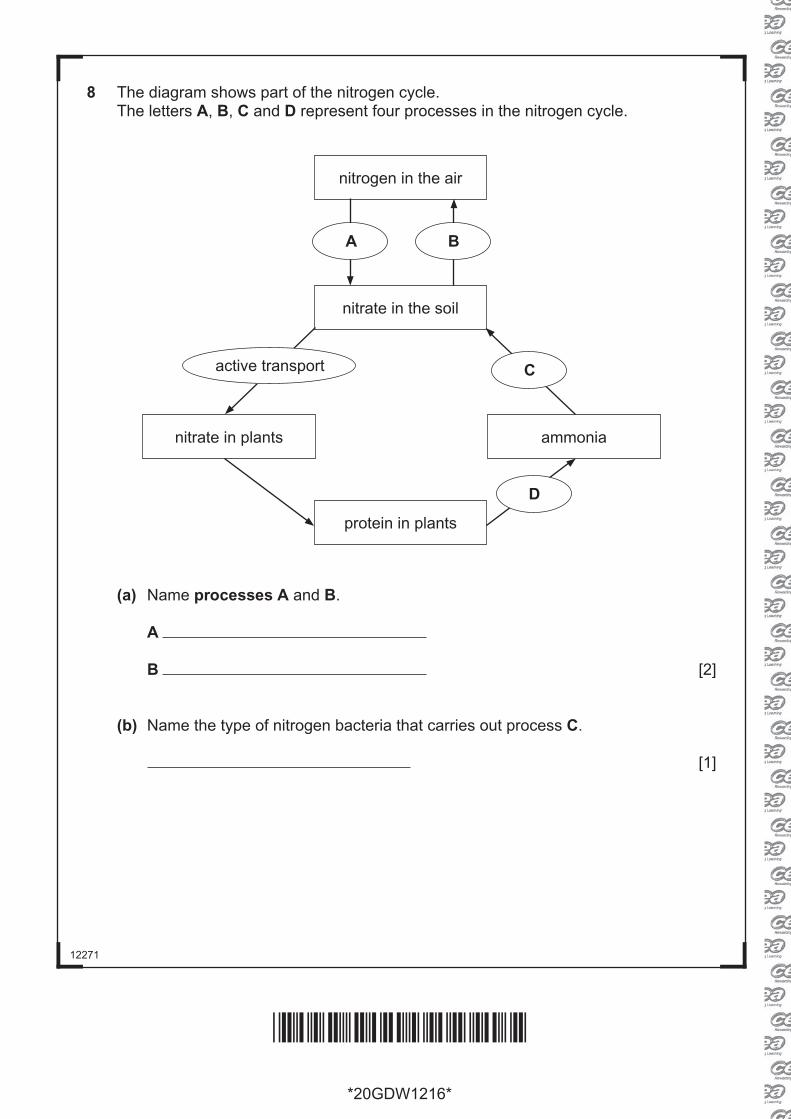
8 The diagram shows part of the nitrogen cycle. The letters A, B, C and D represent four processes in the nitrogen cycle.
nitrate in the soil
nitrogen in the air
A B
nitrate in plants
C
protein in plants
ammonia
active transport
D
(a) Name processes A and B. A
B [2]
(b) Name the type of nitrogen bacteria that carries out process C.
[1]

12271[Turn over
*20GDW1217*
*20GDW1217*
(c) (i) Give the letter of one process in the nitrogen cycle opposite that works best in waterlogged soil.
[1]
(ii) Explain your answer.
[1]
Plants absorb nitrate from the soil by the process of active transport.
(d) Describe this process.
[4]

12271
*20GDW1218*
*20GDW1218*
(e) In an investigation, scientists measured the nitrate level in the soil at the start and the end of the growing season in 10 000 wheat fields in one region of North America.
The scientists repeated their investigation in two other regions of North America. All the fields in each of the three regions had high nitrate levels in the soil at the
start of the growing season.
The table below shows the number of fields with low or high nitrate level in the soil at the end of the growing season, in Region 1 and Region 2.
Nitrate level in the soil at the end of
the growing season
Number of fields in each region
Region 1 Region 2 Region 3
low 5400 8100
high 4600 1900
Source: adapted from www.agvise.com/educational-articles/soil-nitrates-early-trends-2016
In Region 3, the ratio of fields with low nitrate levels to fields with high nitrate levels was 3:1.
(i) Use this information to calculate the number of fields with low and high levels of nitrate in Region 3.
Write your answers in the blank boxes in the table above.
Show your working out.
[3]

12271[Turn over
By the end of the growing season, the fields in Region 2 had produced the most wheat.
(ii) Explain how the results for the fields in Region 2 in the table opposite support this statement.
[2]
Storms destroyed the wheat in a number of fields at the start of the growing season.
(f) Describe and explain how the nitrate level in the soil of these fields would have been affected by the destruction of the wheat.
[2]
THIS IS THE END OF THE QUESTION PAPER
*20GDW1219*
*20GDW1219*
12271
Permission to reproduce all copyright material has been applied for.In some cases, efforts to contact copyright holders may have been unsuccessful and CCEAwill be happy to rectify any omissions of acknowledgement in future if notified.
Examiner Number
For Examiner’suse only
QuestionNumber Marks
1 2 3 4 5 6 7 8
TotalMarks
DO NOT WRITE ON THIS PAGE
*20GDW1220*
*20GDW1220*