UNIT 9 Analytic Geometry - Kitabook12.kitaboo.com/k12/ebookpdf/maths01/chapter9.pdf · 308 UNIT 9...
44
300 UNIT 9 ANALYTIC GEOMETRY UNIT 9 Analytic Geometry An air traffic controller uses algebra and geometry to help airplanes get from one point to another. Copyright © 2008, K12 Inc. All rights reserved. This material may not be reproduced in whole or in part, including illustrations, without the express prior written consent of K12 Inc.
Transcript of UNIT 9 Analytic Geometry - Kitabook12.kitaboo.com/k12/ebookpdf/maths01/chapter9.pdf · 308 UNIT 9...

300 UNIT 9 ANALYTIC GEOMETRY
UNIT 9 Analytic Geometry
An air traffi c controller uses algebra and geometry to help airplanes get from one point to another.
VHS_PA_S1_09_p300-343.indd 300VHS_PA_S1_09_p300-343.indd 300 5/27/08 11:10:41 AM5/27/08 11:10:41 AM
Copyright © 2008, K12 Inc. All rights reserved. This material may not be reproduced in whole or in part, including illustrations, without the express prior written consent of K12 Inc.

A pilot uses numbers to locate the airport she is flying to. An air traf-fic controller uses numbers on a radar screen to locate each airplane approaching the airport. Without a system of locating points, airplanes would have a hard time getting anywhere safely.
Big Idea► Analytic geometry combines the tools of algebra with geometry to solve many real-
world problems.
Unit Topics► Points on the Plane
► Two-Variable Equations
► Linear Equations and Intercepts
► Slope
► Applications: Linear Graphs
► Relations and Functions
► Systems of Linear Equations
ANALYTIC GEOMETRY 301
VHS_PA_S1_09_p300-343.indd 301VHS_PA_S1_09_p300-343.indd 301 5/20/08 8:58:01 AM5/20/08 8:58:01 AM
Copyright © 2008, K12 Inc. All rights reserved. This material may not be reproduced in whole or in part, including illustrations, without the express prior written consent of K12 Inc.

VHS_PA_S1_09_p300-343.indd 302VHS_PA_S1_09_p300-343.indd 302 5/20/08 8:58:09 AM5/20/08 8:58:09 AM
Copyright © 2008, K12 Inc. All rights reserved. This material may not be reproduced in whole or in part, including illustrations, without the express prior written consent of K12 Inc.

POINTS ON THE PLANE 303
You can use a single number to describe the location of a point on a line, but on a coordinate plane it takes two numbers to describe the location of any point.
Identifying Axes and QuadrantsA coordinate plane is formed by two perpendicular number lines called axes. The x-axis is a horizontal line. The y-axis is a vertical line. The axes intersect at the point at which they both have coordinate zero. This point is called the origin. The axes separate the plane into four quadrants. On the axes, positive x goes right and positive y goes up. Negative x goes left and negative y goes down.
the origin
Quadrant II Quadrant I
Quadrant III Quadrant IV
O
54321
–1–2–3–4–5
x-axis
y-axis
4 521 3–2 –1–4–5 –3
Example 1 For each point, name the axis it is on or the quadrant it lies in.
4 521 3–2 –1–4–5 –3
54321
–1–2–3–4–5
x
y
C
B
GD
F
AE
The quadrants are numbered counterclockwise. To identify Quadrant I, think of where the numeral “1” is on a clock.
TIPThe quadrants are numbered counterclockwise. To identify Quadrant I, think of where the numeral “1” is on a clock.
TIP
Every point in a coordinate plane lies either on an axis or in a quadrant, but not both.
TIPEvery point in a coordinate plane lies either on an axis or in a quadrant, but not both.
TIP
Points on the Plane
Solution
Points A and E lie on the x-axis.
Points F and G lie on the y-axis.
Point C lies in Quadrant II.
Point D lies in Quadrant III.
Point B lies in Quadrant IV. ■
VHS_PA_S1_09_p300-343.indd 303VHS_PA_S1_09_p300-343.indd 303 5/20/08 11:47:30 AM5/20/08 11:47:30 AM
Copyright © 2008, K12 Inc. All rights reserved. This material may not be reproduced in whole or in part, including illustrations, without the express prior written consent of K12 Inc.

Using an Ordered Pair to Describe a LocationTo describe the location of a point, use an ordered pair. An ordered pair has the form (x, y). The number x (the x-coordinate) describes the point’s hori-zontal (left-right) distance from the origin. The number y (the y-coordinate) describes the point’s vertical (up-down) distance from the origin. The num-bers in an ordered pair are called coordinates.
To name the coordinates of a point, determine how you can get to the point from the origin by first counting right or left and then counting up or down.
Example 2 Name the ordered pair for each point.
4 521 3–2 –1–4–5 –3
54321
–1–2–3–4–5
x
y
M
Q
N
P
Solution A Point M
4 521 3–2 –1–4–5 –3
54321
–1–2–3–4–5
x
y
M
3 units
2 units
Q
N
P
The ordered pair for point M is (2, 3). ■B Point N
4 521 3–2 –1–4–5 –3
54321
–1–2–3–4–5
x
y
M
3 units
Q
N
P
The ordered pair for point N is (−3, 0). ■
Point M is directly above 2 on the x-axis and directly to the right of 3 on the y-axis. Therefore, its coordinates are (2, 3).
THINK ABOUT ITPoint M is directly above 2 on the x-axis and directly to the right of 3 on the y-axis. Therefore, its coordinates are (2, 3).
THINK ABOUT ITStart at the origin.
Go 2 units to the right.
Go 3 units up.
Start at the origin.
Go 2 units to the right.
Go 3 units up.
Start at the origin.
Go 3 units to the left.
Go 0 units vertically (up or down).
Start at the origin.
Go 3 units to the left.
Go 0 units vertically (up or down).
304 UNIT 9 ANALYTIC GEOMETRY
VHS_PA_S1_09_p300-343.indd 304VHS_PA_S1_09_p300-343.indd 304 5/20/08 8:58:18 AM5/20/08 8:58:18 AM
Copyright © 2008, K12 Inc. All rights reserved. This material may not be reproduced in whole or in part, including illustrations, without the express prior written consent of K12 Inc.

POINTS ON THE PLANE 305
C Point P
4 521 3–2 –1–4–5 –3
54321
–1–2–3–4–5
x
y
M
3 units
2 units
Q
N
P
The ordered pair for point P is (−2, −3). ■D Point Q
4 521 3–2 –1–4–5 –3
54321
–1–2–3–4–5
x
y
M
4 units
3 units
Q
N
P
The ordered pair for point Q is (3, −4). ■
Graphing an Ordered PairExample 3 Graph each ordered pair on the coordinate plane. Name the quadrant in which the point lies or the axis on which the point lies.A (−1, 4)
Solution
(–1, 4)54321
–1–2–3–4–5
x
y
4 units
1 unit 4 521 3–4–5 –3
The point (−1, 4) lies in Quadrant II. ■
The signs for the directions are + for right and up and − for left and down.
REMEMBERThe signs for the directions are + for right and up and − for left and down.
REMEMBERStart at the origin.
Go 2 units to the left.
Go 3 units down.
Start at the origin.
Go 2 units to the left.
Go 3 units down.
Start at the origin.
Go 3 units to the right.
Go 4 units down.
Start at the origin.
Go 3 units to the right.
Go 4 units down.
A point is the graph of an ordered pair. An ordered pair contains the coordinates of a point.
REMEMBERA point is the graph of an ordered pair. An ordered pair contains the coordinates of a point.
REMEMBER
Start at the origin.
The x-coordinate is −1. Go 1 unit left.
The y-coordinate is 4. Go 4 units up.
Draw and label a dot.
Start at the origin.
The x-coordinate is −1. Go 1 unit left.
The y-coordinate is 4. Go 4 units up.
Draw and label a dot.
(continued)
VHS_PA_S1_09_p300-343.indd 305VHS_PA_S1_09_p300-343.indd 305 5/27/08 11:11:03 AM5/27/08 11:11:03 AM
Copyright © 2008, K12 Inc. All rights reserved. This material may not be reproduced in whole or in part, including illustrations, without the express prior written consent of K12 Inc.

306 UNIT 9 ANALYTIC GEOMETRY
B (0, −3)
Solution
(0, –3)
54321
–1–2–3–4–5
x
y
3 units
4 521 3–2–4–5 –3
The point (0, −3) lies on the y-axis. ■C (4, −4)
Solution
4
(4, –4)
54321
–1–2–3–4–5
x
y
4 units
4 units521 3–2–4–5 –3
The point (4, −4) lies in Quadrant IV. ■
Start at the origin.
The x-coordinate is 0, so do not move left or right.
The y-coordinate is −3. Go 3 units down.
Draw and label a dot.
Start at the origin.
The x-coordinate is 0, so do not move left or right.
The y-coordinate is −3. Go 3 units down.
Draw and label a dot.
Every point on the x-axis has y-coordinate 0. Every point on the y-axis has x-coordinate 0.
THINK ABOUT ITEvery point on the x-axis has y-coordinate 0. Every point on the y-axis has x-coordinate 0.
THINK ABOUT IT
Start at the origin.
The x-coordinate is 4. Go 4 units right.
The y-coordinate is −4. Go 4 units down.
Draw and label a dot.
Start at the origin.
The x-coordinate is 4. Go 4 units right.
The y-coordinate is −4. Go 4 units down.
Draw and label a dot.
VHS_PA_S1_09_p300-343.indd 306VHS_PA_S1_09_p300-343.indd 306 5/27/08 11:11:15 AM5/27/08 11:11:15 AM
Copyright © 2008, K12 Inc. All rights reserved. This material may not be reproduced in whole or in part, including illustrations, without the express prior written consent of K12 Inc.

POINTS ON THE PLANE 307
For each point, A. Name the axis it is on or the quadrant it lies in.B. Name the ordered pair.
Problem Set
Use the coordinate plane below for problems 1−10.
4
A
54321
–1–2–3–4–5
x
y
B G
J
C
D
FK
H
E
521 3–2–4–5 –3
1. A
2. B
3. C
4. D
5. E
6. F
7. G
8. H
9. J
10. K
Graph each ordered pair on a coordinate plane.
11. (1, −4)
12. (−3, −1)
13. (0, 4)
14. (5, 0)
15. (2, −2)
16. (3, 5)
17. (−4, 2)
18. (2, −3)
19. (4, −5)
20. (−3, 4)
Solve.
* 21. Challenge Start at the origin. Go 3 units right, 4 units down, 6 units left, 8 units right, and 5 units up. Which quadrant are you in?
VHS_PA_S1_09_p300-343.indd 307VHS_PA_S1_09_p300-343.indd 307 5/27/08 11:11:16 AM5/27/08 11:11:16 AM
Copyright © 2008, K12 Inc. All rights reserved. This material may not be reproduced in whole or in part, including illustrations, without the express prior written consent of K12 Inc.

308 UNIT 9 ANALYTIC GEOMETRY
A solution of a one-variable equation is a single number. For example, the solution of 3x = 12 is 4. But a solution of a two-variable equation is an ordered pair of numbers.
Determining Whether an Ordered Pair Is a SolutionAn ordered pair is a solution to a two-variable equation in x and y ifsubstituting the first coordinate for x and the second coordinate for y results in a true equation.
Example 1 Determine if the ordered pair is a solution of the equation.A Is (2, 4) a solution of 3x + 8y = 38?
Solution
3x + 8y = 38 Write the two-variable equation.
3 · 2 + 8 · 4 � 38 Substitute 2 for x and 4 for y.
6 + 32 � 38 Multiply.
38 = 38 � Add.
Yes, (2, 4) is a solution of 3x + 8y = 38. ■B Is (8, −13) a solution of s = −3r − 2?
Solution
s = −3r − 2 Write the two-variable equation.
−13 � −3 · 8 − 2 Substitute 8 for r and −13 for s.
−13 � −24 − 2 Multiply.
−13 ≠ −26 Subtract.
No, (8, −13) is not a solution of s = −3r − 2. ■C Is (0.5, −3) a solution of −2x − 4y = 11?
Solution
−2x − 4y = 11 Write the two-variable equation.
−2 · 0.5 − 4 · (−3) � 11 Substitute 0.5 for x and −3 for y.
−1 + 12 � 11 Simplify.
11 = 11 � Add.
Yes, (0.5, −3) is a solution of −2x − 4y = 11. ■
Most equations with two variables have countless ordered-pair solutions.
TIPMost equations with two variables have countless ordered-pair solutions.
TIP
In the equation s = −3r − 2, the ordered pairs are traditionally written in the form (r, s) because r comes before s in the alphabet.
TIPIn the equation s = −3r − 2, the ordered pairs are traditionally written in the form (r, s) because r comes before s in the alphabet.
TIP
Two-Variable Equations
VHS_PA_S1_09_p300-343.indd 308VHS_PA_S1_09_p300-343.indd 308 5/27/08 11:11:16 AM5/27/08 11:11:16 AM
Copyright © 2008, K12 Inc. All rights reserved. This material may not be reproduced in whole or in part, including illustrations, without the express prior written consent of K12 Inc.

Finding Solutions of an EquationIn the equation y = x + 3, you can choose any value for the variable x. Once you substitute a value for x, you can solve to find the corresponding value of y. You could also start with a value of y. Example 2 Find three solutions of each equation.A y = 2x − 4
Solution Choose any values for x. Find the corresponding values of y.
Let x = −1. Let x = 0. Let x = 1. y = 2x −4 y = 2x − 4 y = 2x − 4 y = 2 · (−1) − 4 y = 2 · 0 − 4 y = 2 · 1 − 4 y = −2 − 4 y = 0 − 4 y = 2 − 4 y = −6 y = −4 y = −2(−1, −6) is a solution. (0, −4) is a solution. (1, −2) is a solution.Three solutions of y = 2x − 4 are (−1, −6), (0, −4), and (1, −2). ■B 9 − 6x = 3y
Solution Step 1 Solve for y. 9 − 6x = 3y Write the equation.
9 __ 3 − 6x ___ 3 = 3y
___ 3 Divide both sides by 3.
3 − 2x = y Simplify.Step 2 Choose values for x and find the corresponding values for y.Let x = −2. Let x = 3. Let x = 5. 3 − 2x = y 3 − 2x = y 3 − 2x = y 3 − 2 · (−2) = y 3 − 2 · 3 = y 3 − 2 · 5 = y 3 + 4 = y 3 − 6 = y 3 − 10 = y 7 = y −3 = y −7 = y(−2, 7) is a solution. (3, −3) is a solution. (5, −7) is a solution.
Three solutions of 9 − 6x = 3y are (−2, 7), (3, −3), and (5, −7). ■
Graphing an Equation The graphs of all the ordered-pair solutions of an equation form the graph of the equation. You can record several solutions in a table of values and then graph those ordered pairs. After graphing several ordered pairs, you can use the pattern you have formed to draw the graph of the equation.
Example 3 Graph y − 4 = −2x.
Solution First, solve the equation for y.
y − 4 = −2x Write the equation.
y − 4 + 4 = −2x + 4 Add 4 to both sides.
y = −2x + 4 Simplify.
The number of possible choices for x is unlimited, so the number of ordered-pair solutions is unlimited.
THINK ABOUT ITThe number of possible choices for x is unlimited, so the number of ordered-pair solutions is unlimited.
THINK ABOUT IT
TWO-VARIABLE EQUATIONS 309(continued)
VHS_PA_S1_09_p300-343.indd 309VHS_PA_S1_09_p300-343.indd 309 5/29/08 3:29:07 PM5/29/08 3:29:07 PM
Copyright © 2008, K12 Inc. All rights reserved. This material may not be reproduced in whole or in part, including illustrations, without the express prior written consent of K12 Inc.

310 UNIT 9 ANALYTIC GEOMETRY
Next, record several ordered pair solutions in a table of values.
x −2x + 4 y (x, y)
−3 −2 · (−3) + 4 = 6 + 4 = 10 10 (−3, 10)
−1 −2 · (−1) + 4 = 2 + 4 = 6 6 (−1, 6)
0 −2 · 0 + 4 = 0 + 4 = 4 4 (0, 4)
2 −2 · 2 + 4 = −4 + 4 = 0 0 (2, 0)
4 −2 · 4 + 4 = −8 + 4 = −4 −4 (4, −4)
(0, 4)
(–3, 10)
(–1, 6)
(4, –4)
(2, 0)
8 10 1242 6–4 –2–10–12 –6–8
12108
42
–2–4–6–8
–10–12
x
y
Determining Dependent Variables and Independent VariablesIn a two-variable equation, the independent variable is the input variable and the dependent variable is the output variable.
Sometimes you need to determine which variable is dependent and which variable is independent. Consider these two variables: price p and sales tax t. It is not reasonable to say that the price of an item depends on the amount of sales tax charged on that item. Instead, it is reasonable to say that the amount of sales tax t depends on the price p. So in this case, the dependent variable is t and the independent variable is p.
Example 4 Identify the dependent variable and the independent variable in each situation. Explain your answer.A Mai is a sales associate. She earns a salary of $650 per week and a 5%
commission on sales. If s is the amount of Mai’s sales in dollars and pis Mai’s total pay, then the variables s and p are related by the equation −0.05s + p = 650.
Solution Because Mai’s total pay p depends on the amount of her sales s, the dependent variable is p and the independent variable is s. ■
Choose values for x that are easy to work with. Zero is usually an easy value to work with.
TIPChoose values for x that are easy to work with. Zero is usually an easy value to work with.
TIP
Any linear equation has an infi nite number of solutions.Their corresponding points form a line, which has infi nitely many points.
THINK ABOUT ITAny linear equation has an infi nite number of solutions.Their corresponding points form a line, which has infi nitely many points.
THINK ABOUT ITGraph the ordered pairs.
The points lie in a line. Draw a line through the points. The line is the graph of y − 4 = −2x. ■
Graph the ordered pairs.
The points lie in a line. Draw a line through the points. The line is the graph of y − 4 = −2x. ■
In an ordered pair, the independent variable is fi rst and the dependent variable is second.
TIPIn an ordered pair, the independent variable is fi rst and the dependent variable is second.
TIP
VHS_PA_S1_09_p300-343.indd 310VHS_PA_S1_09_p300-343.indd 310 5/29/08 2:19:57 PM5/29/08 2:19:57 PM
Copyright © 2008, K12 Inc. All rights reserved. This material may not be reproduced in whole or in part, including illustrations, without the express prior written consent of K12 Inc.

B Rico has 12 gallons of gasoline in his car’s tank when he begins a road trip. During the trip, g is the number of gallons remaining in the tank and m is the number of miles he has driven. The variables are related by the equation 0.04m + g = 12.
Solution Because the number of remaining gallons g depends on the num-ber of miles driven m, the dependent variable is g and the independent vari-able is m. ■C Tickets to a school play cost $5.50 for adults and $3 for students. On
opening night, $960 is collected in ticket sales. If a is the number of adult tickets sold and s is the number of student tickets sold, then the variables are related by the equation 5.50a + 3s = 960.
Solution There is no way to determine whether sales of one type of ticket affect sales of the other type of ticket. So in this case, it is not reasonable to say that either variable depends on the other. If you need to decide that one variable is dependent and the other is independent, then you can decide either way. ■
TWO-VARIABLE EQUATIONS 311
Problem Set
Determine if the ordered pair is a solution of the equation.
1. Is (0, 0) a solution of y = x?
2. Is (1, 3) a solution of y = 3x?
3. Is (4, 2) a solution of y = 3x − 4?
4. Is (3, −1) a solution of y + 3x = 4?
5. Is (5, 3) a solution of 2x + 3y = 19?
6. Is (8, −2) a solution of 12x + 2y = 92?
7. Is (6, −3) a solution of 4x − 2y = 30?
8. Is (0, −7) a solution of 9x + 2y = 14?
9. Is (2, 7) a solution of 2y = 3x + 8?
10. Is (−5, 1 __ 2 ) a solution of 8y = 2x + 14?
11. Is (3, −1) a solution of −2x − 5y = −1?
12. Is (1.5, 2.5) a solution of 8x + 4y = 20?
Find three solutions of each equation. 13. y = 4x
14. q = 2p + 6
15. f = 1 __ 2 e − 5
16. 2h = 8g − 12
17. 20 − 4x = 4y
18. y − 4x = 9
19. Challenge 3y − 9x = 12
20. Challenge 8y − 10 = 3y + 15x
**
**
VHS_PA_S1_09_p300-343.indd 311VHS_PA_S1_09_p300-343.indd 311 5/20/08 8:58:41 AM5/20/08 8:58:41 AM
Copyright © 2008, K12 Inc. All rights reserved. This material may not be reproduced in whole or in part, including illustrations, without the express prior written consent of K12 Inc.
312 UNIT 9 ANALYTIC GEOMETRY
Make a table of values, and then graph each equation.
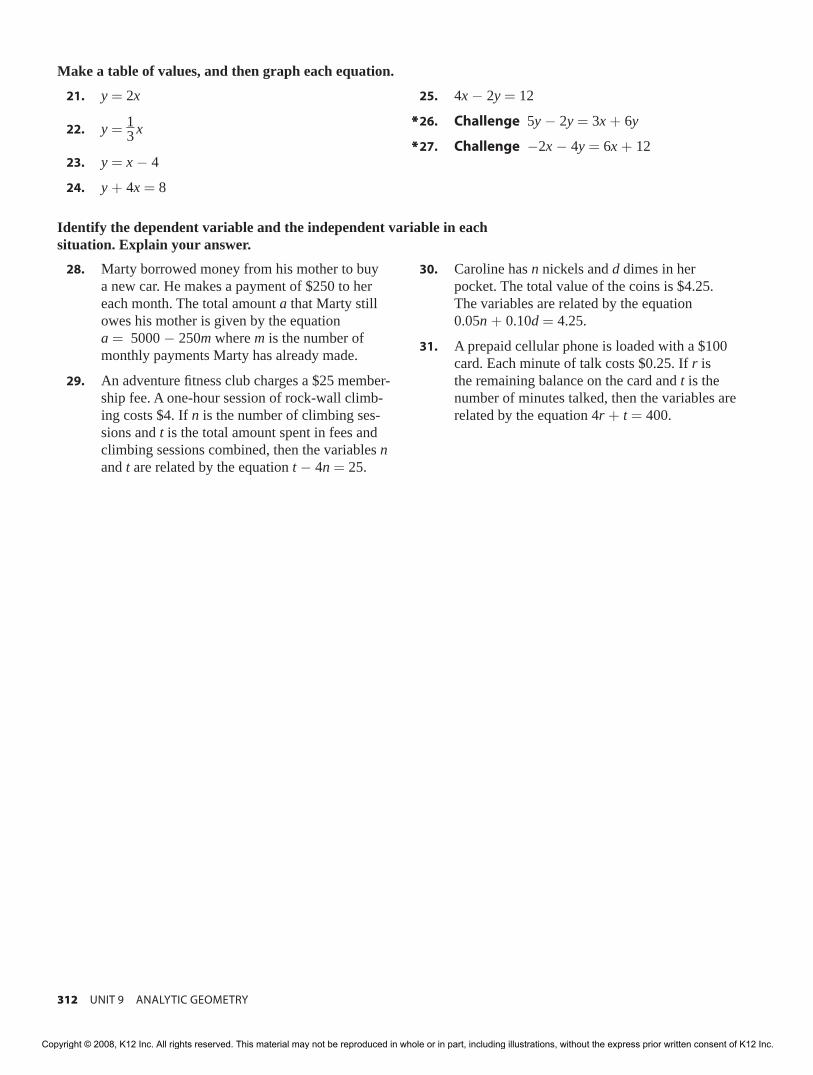
21. y = 2x
22. y = 1 __ 3 x
23. y = x − 4
24. y + 4x = 8
25. 4x − 2y = 12
26. Challenge 5y − 2y = 3x + 6y
27. Challenge −2x − 4y = 6x + 12
**
**
Identify the dependent variable and the independent variable in each situation. Explain your answer. 28. Marty borrowed money from his mother to buy
a new car. He makes a payment of $250 to her each month. The total amount a that Marty still owes his mother is given by the equationa = 5000 − 250m where m is the number of monthly payments Marty has already made.
29. An adventure fi tness club charges a $25 member-ship fee. A one-hour session of rock-wall climb-ing costs $4. If n is the number of climbing ses-sions and t is the total amount spent in fees and climbing sessions combined, then the variables n and t are related by the equation t − 4n = 25.
30. Caroline has n nickels and d dimes in her pocket. The total value of the coins is $4.25. The variables are related by the equation 0.05n + 0.10d = 4.25.
31. A prepaid cellular phone is loaded with a $100 card. Each minute of talk costs $0.25. If r is the remaining balance on the card and t is the number of minutes talked, then the variables are related by the equation 4r + t = 400.
VHS_PA_S1_09_p300-343.indd 312VHS_PA_S1_09_p300-343.indd 312 5/20/08 8:58:43 AM5/20/08 8:58:43 AM
Copyright © 2008, K12 Inc. All rights reserved. This material may not be reproduced in whole or in part, including illustrations, without the express prior written consent of K12 Inc.

A line is made up of an infinite number of points and extends without end in two opposite directions.
Identifying the Intercepts of a LineWhen you graph a line on a coordinate plane, it crosses at least one axis.
The x-intercept of a line is the x-coordinate of the point where the line intersects the x-axis. The y-intercept of a line is the y-coordinate of the point where the line intersects the y-axis.
DEFINITIONS
Example 1 Name the intercepts of each line. A
8 1042 6–4 –2–8–10 –6
108642
–2–4–6–8
–10
x
y
Solution The line intersects the x-axis at (2, 0). The x-intercept is 2.The line intersects the y-axis at (0, −6). The y-intercept is −6. ■B
8 1042 6–4 –2–8–10 –6
108642
–2–4–6–8
–10
x
y
Solution The line is horizontal. It does not intersect the x-axis, so it has no x-intercept. The line intersects the y-axis at (0, 5). The y-intercept is 5. ■
Linear Equations and Intercepts
LINEAR EQUATIONS AND INTERCEPTS 313
VHS_PA_S1_09_p300-343.indd 313VHS_PA_S1_09_p300-343.indd 313 5/27/08 11:11:26 AM5/27/08 11:11:26 AM
Copyright © 2008, K12 Inc. All rights reserved. This material may not be reproduced in whole or in part, including illustrations, without the express prior written consent of K12 Inc.

314 UNIT 9 ANALYTIC GEOMETRY
Using Intercepts to Graph Ax + By = C If the graph of an equation is a line, the equation is a linear equation. The graph of an equation in the form Ax + By = C (where A, B, and C are integers and A and B are not both zero) is a line. An equation in this form is called the standard form of a linear equation. If A and B are both nonzero, the line is neither horizontal nor vertical, and it will intersect both axes.
Step 1 Find the x-intercept by letting y = 0 and solving for x.Step 2 Find the y-intercept by letting x = 0 and solving for y.Step 3 Graph the intercepts. Draw the line through both points.
GRAPHING A LINEAR EQUATION BY FINDING ITS INTERCEPTS
Example 2 Graph each equation.A 4x + 3y = 12
Solution First, find the intercepts.
4x + 3y = 12 Write the equation.
4x + 3 · 0 = 12 To find the x-intercept, let y = 0.
4x = 12 Simplify.
x = 3 Solve for x.
The x-intercept is 3. The line intersects the x-axis at (3, 0).
Next, find the y-intercept.
4x + 3y = 12 Write the equation.
4 · 0 + 3y = 12 To find the y-intercept, let x = 0.
3y = 12 Simplify.
y = 4 Solve for y.
The y-intercept is 4. The line intersects the y-axis at (0, 4).
8 104
(0, 4)
(3, 0)
2 6–4 –2–8–10 –6
108642
–2–4–6–8
–10
x
y
Graph the intercepts.
Draw the line that contains both points.
The line is the graph of 4x + 3y = 12. ■
Graph the intercepts.
Draw the line that contains both points.
The line is the graph of 4x + 3y = 12. ■
VHS_PA_S1_09_p300-343.indd 314VHS_PA_S1_09_p300-343.indd 314 5/20/08 11:47:57 AM5/20/08 11:47:57 AM
Copyright © 2008, K12 Inc. All rights reserved. This material may not be reproduced in whole or in part, including illustrations, without the express prior written consent of K12 Inc.

B −2x − 6 = 3y
Solution First, write the equation in standard form.
−2x − 6 = 3y Write the equation.
−2x − 6 + 6 = 3y + 6 Add 6 to both sides.
−2x = 3y + 6 Simplify.
−2x − 3y = 3y + 6 − 3y Subtract 3y from both sides.
−2x − 3y = 6 The equation is in standard form.
Next, find the intercepts.
−2x −3y = 6 −2x − 3y = 6
−2x − 3 · 0 = 6 −2 · 0 − 3y = 6
−2x = 6 −3y = 6
x = −3 y = −2
The x-intercept is −3. The y-intercept is −2.
8 104(0, –2)
(–3, 0)
2 6–4 –2–8–10 –6
108642
–2–4–6–8
–10
x
y
Graphing y = bThe graph of an equation in the form y = b, where b is a constant, is a hori-zontal line with y-intercept b.
Example 3 Graph y = −5.
Solution The graph is the horizontal line with y-intercept −5.
8 104
(0, –5)
2 6–4 –2–8–10 –6
108642
–2–4–6–8
–10
x
y
Equations that have all the same solutions are equivalent. In Example 2B, the equations −2x − 6 = 3y and −2x − 3y = 6 are equivalent.
REMEMBEREquations that have all the same solutions are equivalent. In Example 2B, the equations −2x − 6 = 3y and −2x − 3y = 6 are equivalent.
REMEMBER
Graph the intercepts.
Draw the line through both points.
The line is the graph of −2x − 6 = 3y. ■
Graph the intercepts.
Draw the line through both points.
The line is the graph of −2x − 6 = 3y. ■
Some solutions to the equation y = −5 are (0, −5), (2, −5), and (−23, −5). The y-coordinate of every point on the line is −5.
THINK ABOUT ITSome solutions to the equation y = −5 are (0, −5), (2, −5), and (−23, −5). The y-coordinate of every point on the line is −5.
THINK ABOUT IT
Graph the y-intercept.
Draw a horizontal line through the point.
The line is the graph of y = −5. ■
Graph the y-intercept.
Draw a horizontal line through the point.
The line is the graph of y = −5. ■
LINEAR EQUATIONS AND INTERCEPTS 315
VHS_PA_S1_09_p300-343.indd 315VHS_PA_S1_09_p300-343.indd 315 5/20/08 11:48:06 AM5/20/08 11:48:06 AM
Copyright © 2008, K12 Inc. All rights reserved. This material may not be reproduced in whole or in part, including illustrations, without the express prior written consent of K12 Inc.

316 UNIT 9 ANALYTIC GEOMETRY
Graphing x = aThe graph of an equation in the form x = a, where a is a constant, is a vertical line with x-intercept a.Example 4 Graph x = 3.Solution The graph is the vertical line with x-intercept 3.
8 104
(3, 0)
2 6–4 –2–8–10 –6
108642
–2–4–6–8
–10
x
y
Using Intercepts to Write an Equation of a Line
Step 1 Let C equal the product of the intercepts.Step 2 Substitute the ordered pairs that contain the intercepts into
Ax + By = C to fi nd the values of A and B.Step 3 Substitute the values of A, B, and C into Ax + By = C.
USING INTERCEPTS TO WRITE AN EQUATION OF A LINE
Example 5 Write a linear equation for the graph that is shown.
8 104
(–3, 0)
(0, 6)
2 6–4 –2–8–10 –6
108642
–2–4–6–8
–10
x
y
Solution The intercepts are −3 and 6. The product is −3 · 6 = −18. Use (0, 6) and (−3, 0) to find the values of A and B.
Substitute (0, 6) Substitute (−3, 0)Ax + By = −18 Ax + By = −18
A · 0 + B · 6 = −18 A · (−3) + B · 0 = −18B · 6 = −18 −3A = −18
B = −3 A = 6Since A = 6, B = −3, and C = −18, the equation is 6x − 3y = −18. ■
The graph of x = a is a vertical line.
The graph of y = b is a horizontal line.
REMEMBERThe graph of x = a is a vertical line.
The graph of y = b is a horizontal line.
REMEMBER
Graph the x-intercept.
Draw a vertical line through the point.
The line is the graph of x = 3. ■
Graph the x-intercept.
Draw a vertical line through the point.
The line is the graph of x = 3. ■
You could use any nonzero value for C, but using the product of the intercepts makes for neater numbers.
THINK ABOUT ITYou could use any nonzero value for C, but using the product of the intercepts makes for neater numbers.
THINK ABOUT IT
Check your equation by fi nding the intercepts.
TIPCheck your equation by fi nding the intercepts.
TIP
VHS_PA_S1_09_p300-343.indd 316VHS_PA_S1_09_p300-343.indd 316 5/20/08 8:58:52 AM5/20/08 8:58:52 AM
Copyright © 2008, K12 Inc. All rights reserved. This material may not be reproduced in whole or in part, including illustrations, without the express prior written consent of K12 Inc.

1.
8 1042 6–4 –2–8–10 –6
108642
–2–4–6–8
–10
x
y
2.
8 1042 6–4 –2–8–10 –6
108642
–2–4–6–8
–10
x
y
3.
8 1042 6–4 –2–8–10 –6
108642
–2–4–6–8
–10
x
y
4.
8 1042 6–4 –2–8–10 –6
108642
–2–4–6–8
–10
x
y
5.
8 1042 6–4 –2–8–10 –6
108642
–2–4–6–8
–10
x
y
6.
8 1042 6–4 –2–8–10 –6
108642
–2–4–6–8
–10
x
y
Problem Set
Name the intercepts of each line.
Find the intercepts of the graph of the line.
7. 2x + 4y = 8
8. x − y = 5
9. x + 3y = 9
10. 5x − y = 10
11. 9x + 4y = 18
12. −4x −2y = 16
LINEAR EQUATIONS AND INTERCEPTS 317
VHS_PA_S1_09_p300-343.indd 317VHS_PA_S1_09_p300-343.indd 317 5/20/08 8:58:55 AM5/20/08 8:58:55 AM
Copyright © 2008, K12 Inc. All rights reserved. This material may not be reproduced in whole or in part, including illustrations, without the express prior written consent of K12 Inc.

318 UNIT 9 ANALYTIC GEOMETRY
Graph each equation.
13. x − y = 4
14. x + 2y = 8
15. y = −7
16. x = 2
17. 4x − 2y = 12
18. x = 5
19. x = −4
20. y = 1
21. −x + 4 = 2y
22. y = −2
23. −5x = 2y − 10
24. x + 3y = 9
25. Challenge 4x + 2y = 12 + x
26. Challenge 1 __ 2 x + 2 __ 3 y = 4
**
**
Write a linear equation for the graph that is shown.
27.
8 104
(2, 0)
2 6–4 –2–8–10 –6
108642
–2–4–6–8
–10
x
y
28.
8 104(–4, 0)
(0, –5)
2 6–4 –2–8–10 –6
108642
–2–4–6–8
–10
x
y
29.
8 104(5, 0)
(0, 5)
2 6–4 –2–8–10 –6
108642
–2–4–6–8
–10
x
y
30.
8 104
(7, 0)
(0, –3)
2 6–4 –2–8–10 –6
108642
–2–4–6–8
–10
x
y
31.
8 1042(0, –2)
6–4 –2–8–10 –6
108642
–2–4–6–8
–10
x
y
32.
8 104
(3, 0)
(0, –6)
2 6–4 –2–8–10 –6
108642
–2–4–6–8
–10
x
y
VHS_PA_S1_09_p300-343.indd 318VHS_PA_S1_09_p300-343.indd 318 5/20/08 8:58:56 AM5/20/08 8:58:56 AM
Copyright © 2008, K12 Inc. All rights reserved. This material may not be reproduced in whole or in part, including illustrations, without the express prior written consent of K12 Inc.

Lines can vary in steepness. They can also vary in whether they slant up to the left, up to the right, or not at all. Slope describes all those variations.
Calculating Slope Let (x1, y1) and (x2, y2) be two points on a line. When moving from (x1, y1) to (x2, y2) on the line, the vertical change, or rise, equals y2 − y1 and the horizon-tal change, or run, equals x2 − x1.
The slope of a line is the ratio of the rise to the run.
slope = rise ____ run = vertical change
________________ horizontal change = y2 − y1 ______ x2 − x1
SLOPE
Example 1 Find the slope of the line.
4
(4, 5)
(–2, –3)
654321
–1–2–3–4–5–6
x
y
6521 3–2–1–4–6–5 –3
Solution You can count the rise and the run from one point to another. Or, you can use the slope formula. Let (−2, −3) be (x1, y1) and let (4, 5) be (x2, y2). Substitute the values of x1, y1, x2, and y2 into the formula.
x1 is read “x sub 1,” and means “the x-coordinate of the fi rst point.”
TIPx1 is read “x sub 1,” and means “the x-coordinate of the fi rst point.”
TIP
Slope
SLOPE 319
(continued)
VHS_PA_S1_09_p300-343.indd 319VHS_PA_S1_09_p300-343.indd 319 5/29/08 2:20:07 PM5/29/08 2:20:07 PM
Copyright © 2008, K12 Inc. All rights reserved. This material may not be reproduced in whole or in part, including illustrations, without the express prior written consent of K12 Inc.

320 UNIT 9 ANALYTIC GEOMETRY
4
(4, 5)(x2, y2)
(–2, –3)(x1, y1)
654321
–1–2–3–4–5–6
x
y
6521 3–2–1–4–6–5 –3
rise: 8 units
run: 6 units
slope = rise ____ run = y2 − y1 ______ x2 − x1
= 5 − (−3)
________ 4 − (−2)
= 5 + 3 _____ 4 + 2
= 8 __ 6
= 4 __ 3
The slope is 4 __ 3 . ■
Calculating Slope More Than One WayTo find the slope of a line, use any pair of points on the line. And for any pair of points, you can use either order.
Example 2 Find the slope of the line. Use two different pairs of points and change the order for one pair of points.
4
(2, 3)
(6, 1)(8, 0)
10987654321
–1–2
x
y
6521 3 8 1097–2–1
Solution
(x1, y1) (x2, y2) slope = y2 − y1 ______ x2 − x1
(2, 3) (6, 1) slope = 1 − 3 _____ 6 − 2 = −2 ___ 4 = − 1 __ 2
(8, 0) (6, 1) slope = 1 − 0 _____ 6 − 8 = 1 ___ −2 = − 1 __ 2
(6, 1) (8, 0) slope = 0 − 1 _____ 8 − 6 = −1 ___ 2 = − 1 __ 2
The slope is − 1 __ 2 . ■
This is the same pair of points in a different order.
This is the same pair of points in a different order.
VHS_PA_S1_09_p300-343.indd 320VHS_PA_S1_09_p300-343.indd 320 5/20/08 8:59:02 AM5/20/08 8:59:02 AM
Copyright © 2008, K12 Inc. All rights reserved. This material may not be reproduced in whole or in part, including illustrations, without the express prior written consent of K12 Inc.

Calculating the Slope of a Horizontal LineExample 3 Find the slope of the horizontal line.
(x1, y1)(1, 2)
(x2, y2)(4, 2)
5
4
3
2
1
–1
–2
–3
x
y
654321–1–2
Solution slope = y2 − y1 ______ x2 − x1
= 2 − 2 _____ 4 − 1 = 0 __ 3 = 0 The slope is 0. ■
Describing the Slope of a Vertical LineExample 4 Find the slope of the vertical line.
(3, 2) (x2, y2)
(3, 1) (x1, y1)
5
4
3
2
1
–1
–2
–3
x
y
654321–1–2
Solution slope = y2 − y1 ______ x2 − x1
= 2 − 1 _____ 3 − 3 = 1 __ 0 The slope is undefined. ■
Any fraction with a numerator of zero and a nonzero denominator equals zero.0 __ a = 0 if a ≠ 0
REMEMBERAny fraction with a numerator of zero and a nonzero denominator equals zero.0 __ a = 0 if a ≠ 0
REMEMBER
Any fraction with denominator zero is undefi ned.a __ 0 is undefi ned for all values of a.
REMEMBERAny fraction with denominator zero is undefi ned.a __ 0 is undefi ned for all values of a.
REMEMBER
SLOPE 321
VHS_PA_S1_09_p300-343.indd 321VHS_PA_S1_09_p300-343.indd 321 5/27/08 11:11:43 AM5/27/08 11:11:43 AM
Copyright © 2008, K12 Inc. All rights reserved. This material may not be reproduced in whole or in part, including illustrations, without the express prior written consent of K12 Inc.

322 UNIT 9 ANALYTIC GEOMETRY
Using Slope to Classify and Describe Lines
x
y
x
y
x
y
x
y
Positive Slope Negative Slope Zero Slope Undefi ned Slope The line rises The line falls The line is The line is left to right. left to right. horizontal. vertical.
CLASSIFYING LINES BY SLOPE
Example 5 Find the slope of the line that passes through the points (2, 0) and (−1, 3). Describe the line.
Solution Let (2, 0) be (x1, y1) and let (−1, 3) be (x2, y2).
slope = y2 − y1 ______ x2 − x1
= 3 − 0 _______ −1 − 2 = 3 ___
−3 = −1
The line falls from left to right because it has a negative slope. ■
Using Slope to Compare the Steepness of Lines The slope is a measure of the steepness of a line, that is, the angle the line makes with the horizontal. The steeper of two lines has the greater absolute value of slope.
Example 6 Which is the slope of the steeper line, − 10 ___ 3 or 2?
Solution Compare the absolute values of the slopes.
| − 10 ___ 3 | = 10 ___ 3 = 3 1 __ 3 and |2| = 2.
Since 3 1 __ 3 > 2, − 10 ___ 3 is the slope of the steeper line. ■
You can let either point be (x1, y1). Then let the other point be (x2, y2).
TIPYou can let either point be (x1, y1). Then let the other point be (x2, y2).
TIP
When you think about the steepness of a line, think about riding a bike or skateboard downhill on a street with that slope. The steeper the slope (greater absolute value), the faster you will go.
THINK ABOUT ITWhen you think about the steepness of a line, think about riding a bike or skateboard downhill on a street with that slope. The steeper the slope (greater absolute value), the faster you will go.
THINK ABOUT IT
VHS_PA_S1_09_p300-343.indd 322VHS_PA_S1_09_p300-343.indd 322 5/27/08 11:11:53 AM5/27/08 11:11:53 AM
Copyright © 2008, K12 Inc. All rights reserved. This material may not be reproduced in whole or in part, including illustrations, without the express prior written consent of K12 Inc.

SLOPE 323
Finding the Slope of a Line, Given the Equation in Standard FormYou can use the intercepts as two points to find the slope of a line.
Example 7 Find the slope of the graph of 2x − 4y = 12.
Solution
Find the x-intercept. Find the y-intercept.
2x − 4y = 12 2x − 4y = 12
2x − 4 · 0 = 12 2 · 0 − 4y = 12
2x = 12 −4y = 12
x = 6 y = −3
x-intercept: (6, 0) y-intercept: (0, −3)
Graph the line. Find the rise and run.
4(6, 0)
(0, –3)
654321
–1–2–3–4–5–6
x
y
65 8721 3–2–1–4–3rise: 3 units
run: 6 units4
(6, 0)
(0, –3)
654321
–1–2–3–4–5–6
x
y
65 8721 3–2–1–4–3rise: 3 units
run: 6 units
Finally, calculate the slope.
slope = rise ____ run = 3 __ 6 = 1 __ 2 ■
The slope of the graph of a linear equation in standard form
Ax + By = C is − A __ B .
SLOPE OF THE GRAPH OF Ax + By = C
Example 8 Find the slope of the graph of 2x − 4y = 12.
Solution Identify the values of A and B, and then find the slope.
Ax + By = C
A = 2 and B = −4. 2x − 4y = 12
slope = − A __ B = − 2 ___ −4 = 1 __ 2 ■
Examples 7 and 8 have the same answer because they have the same equation.
Example 8 illustrates the slope property for a linear equation in standard form.
THINK ABOUT ITExamples 7 and 8 have the same answer because they have the same equation.
Example 8 illustrates the slope property for a linear equation in standard form.
THINK ABOUT IT
VHS_PA_S1_09_p300-343.indd 323VHS_PA_S1_09_p300-343.indd 323 5/27/08 11:11:55 AM5/27/08 11:11:55 AM
Copyright © 2008, K12 Inc. All rights reserved. This material may not be reproduced in whole or in part, including illustrations, without the express prior written consent of K12 Inc.

324 UNIT 9 ANALYTIC GEOMETRY
7. (2, 3) and (4, 5)
8. (0, 2) and (6, 7)
9. (0, 0) and (−5, 2)
10. (3, 2) and (−7, 2)
11. (2, −9) and (3, −1)
12. (−4, 8) and (−4, 5)
13. (6, 10) and (3, −7)
14. Challenge ( 2 __ 3 , 1 __ 2 ) and ( 1 __ 3 , 1 __ 4 ) **
Find the slope of the line that passes through the points.
1.
4
(2, 5)
(4, 1)
654321
–1–2–3–4–5–6
x
y
6521 3–2–1–4–6–5 –3
2.
4(–3, –2)
(4, 3)
654321
–1–2–3–4–5–6
x
y
6521 3–2–1–4–6–5 –3
3.
4
(4, –4)
(–4, 2)
654321
–1–2–3–4–5–6
x
y
6521 3–2–1–4–6–5 –3
4.
4
(2, –3)
(–2, 3)
654321
–1–2–3–4–5–6
x
y
6521 3–2–1–4–6–5 –3
5.
4
(3, –3)
(–4, 4)
654321
–1–2–3–4–5–6
x
y
6521 3–2–1–4–6–5 –3
6.
4
(–1, –3)
(2, 4)
654321
–1–2
–4–5–6
x
y
6521 3–2–1–4–6–5 –3
Problem Set
Use the graph to find the slope of each line.
VHS_PA_S1_09_p300-343.indd 324VHS_PA_S1_09_p300-343.indd 324 5/20/08 8:59:11 AM5/20/08 8:59:11 AM
Copyright © 2008, K12 Inc. All rights reserved. This material may not be reproduced in whole or in part, including illustrations, without the express prior written consent of K12 Inc.

Find the slope of the line with the given equation.
15. 2x + 4y = 12
16. 3x + 2y = 6
17. y = 3
18. 9x − y = 18
19. x = −5
20. 6x − 2y = 18
21. Challenge y = 4x − 7
22. Challenge 1 __ 2 x + 4y = 3y − 7
**
**
State whether the slope of the line is positive, negative, zero, or undefined.
23.
4
654321
–1–2–3–4–5–6
x
y
6521 3–2–1–4–6–5 –3
24.
4
654321
–1–2–3–4–5–6
x
y
6521 3–2–1–4–6–5 –3
25.
4
654321
–1–2–3–4–5–6
x
y
6521 3–2–1–4–6–5 –3
26.
4
654321
–1–2–3–4–5–6
x
y
6521 3–2–1–4–6–5 –3
27.
4
654321
–1–2–3–4–5–6
x
y
6521 3–2–1–4–6–5 –3
28.
4
654321
–1–2–3–4–5–6
x
y
6521 3–2–1–4–6–5 –3
Which is the slope of the steepest line?
29. 8 or −2 30. 5 __ 2 , − 3 __ 2 , or 3 31. − 2 __ 3 or 1 __ 2
SLOPE 325
VHS_PA_S1_09_p300-343.indd 325VHS_PA_S1_09_p300-343.indd 325 5/20/08 8:59:13 AM5/20/08 8:59:13 AM
Copyright © 2008, K12 Inc. All rights reserved. This material may not be reproduced in whole or in part, including illustrations, without the express prior written consent of K12 Inc.

Many applications can be modeled with linear equations.
When data form a linear pattern, you can use a linear graph to make infer-ences and predictions.
Application: Health
Interpolation is a process of inferring, or estimating, an unknown value that is between known values.
DEFINITION
Example 1 Mr. Nelson has been losing weight steadily for 10 months. The graph shows data about his weight over time. What is a reasonable guess for Mr. Nelson’s weight in month 7?
121110987
Wei
ght (
lb)
6Month
Mr. Nelson’s Weight
543210
240220200180160140
Solution The data points form a linear pattern. Draw the line through the points. Then interpolate to infer the weight for month 7.
12111097
Wei
ght (
lb)
6Month
Mr. Nelson’s Weight
543210
240220200180160140
8
It is reasonable to infer that Mr. Nelson’s weight in month 7 was 180 pounds. ■
When you infer, you make an educated guess.
TIPWhen you infer, you make an educated guess.
TIP
Interpolate comes from the Latin inter meaning “between” and polus meaning “point.”
THINK ABOUT ITInterpolate comes from the Latin inter meaning “between” and polus meaning “point.”
THINK ABOUT IT
Applications: Linear Graphs
326 UNIT 9 ANALYTIC GEOMETRY
VHS_PA_S1_09_p300-343.indd 326VHS_PA_S1_09_p300-343.indd 326 5/29/08 3:29:30 PM5/29/08 3:29:30 PM
Copyright © 2008, K12 Inc. All rights reserved. This material may not be reproduced in whole or in part, including illustrations, without the express prior written consent of K12 Inc.

Application: Personal Finance
Extrapolation is a process of inferring, estimating, or predicting a value that is outside of known values.
DEFINITION
Example 2 Sheila has been saving money at a steady rate. She is saving for a new television that costs $2400. A graph of her savings is shown below. What is a reasonable prediction of when Sheila will have enough money saved to buy the television set?
Month Total Saved ($)
1 300
2 600
3 900
4 1200
5 1500
121110987
Tota
l sav
ed ($
)
6Month
Sheila’s Savings
543210
3000270024002100180015001200900600300
0
Solution The data points form a linear pattern. Draw the line through the points. Then extrapolate to predict the first month in which Sheila’s total sav-ings will be at least $2400.
Month Total Saved ($)
1 300
2 600
3 900
4 1200
5 1500
121110987
Tota
l sav
ed ($
)
6Month
Sheila’s Savings
543210
3000270024002100180015001200900600300
0
Sheila should reach her savings goal in Month 8. The prediction is reasonable because Sheila is saving $300 per month. If she continues saving at the same rate, she will have $2400 saved in month 8. ■
Extrapolate comes from the Latin extra meaning “outside” and polus meaning “point.”
When you extrapolate, you make an inference about values that are outside the known points.
THINK ABOUT ITExtrapolate comes from the Latin extra meaning “outside” and polus meaning “point.”
When you extrapolate, you make an inference about values that are outside the known points.
THINK ABOUT IT
APPLICATIONS: LINEAR GRAPHS 327
VHS_PA_S1_09_p300-343.indd 327VHS_PA_S1_09_p300-343.indd 327 5/29/08 3:29:43 PM5/29/08 3:29:43 PM
Copyright © 2008, K12 Inc. All rights reserved. This material may not be reproduced in whole or in part, including illustrations, without the express prior written consent of K12 Inc.

328 UNIT 9 ANALYTIC GEOMETRY
Application: SportsIn some cases, using extrapolation will not yield a reasonable prediction.
Example 3 The number of runs scored by a baseball team in each of its first four games of a season are shown in the graph below. Use extrapolation to predict the number of runs the team will score in the 20th game of the season. Is the prediction reasonable? Explain.
Game Score
1 2
2 3
3 4
4 5
242220181614
Sco
re
12Game
Score
1086420
25
20
15
10
5
0
Solution The data points form a linear pattern. Draw the line through the points. Then extrapolate to predict the number of runs the team will score in the 20th game.
Game Score
1 2
2 3
3 4
4 5
242220181614
Sco
re
12Game
Score
1086420
25
20
15
10
5
0
If the pattern continues, the team will score 21 runs in the 20th game. This prediction is not reasonable because it is not reasonable to expect the pattern to continue. A constant increase of one run per game is not likely over more than a few games. ■
VHS_PA_S1_09_p300-343.indd 328VHS_PA_S1_09_p300-343.indd 328 5/29/08 3:29:44 PM5/29/08 3:29:44 PM
Copyright © 2008, K12 Inc. All rights reserved. This material may not be reproduced in whole or in part, including illustrations, without the express prior written consent of K12 Inc.
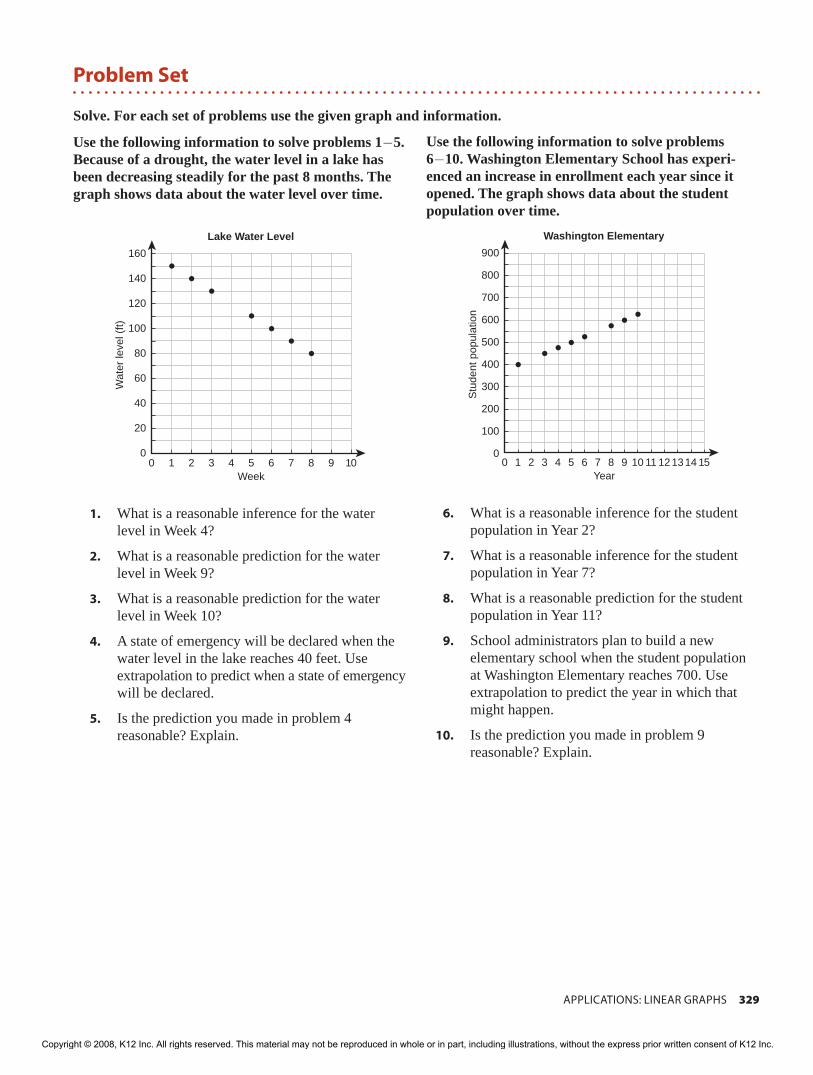
Use the following information to solve problems 1−5. Because of a drought, the water level in a lake has been decreasing steadily for the past 8 months. The graph shows data about the water level over time.
10987
Wat
er le
vel (
ft)
6Week
Lake Water Level
543210
160
140
120
100
80
60
40
20
0
1. What is a reasonable inference for the water level in Week 4?
2. What is a reasonable prediction for the water level in Week 9?
3. What is a reasonable prediction for the water level in Week 10?
4. A state of emergency will be declared when the water level in the lake reaches 40 feet. Useextrapolation to predict when a state of emergency will be declared.
5. Is the prediction you made in problem 4 reasonable? Explain.
Use the following information to solve problems 6−10. Washington Elementary School has experi-enced an increase in enrollment each year since it opened. The graph shows data about the student population over time.
159 10 11 12131487S
tude
nt p
opul
atio
n6
Year
Washington Elementary
543210
900
800
700
600
500
400
300
200
100
0
6. What is a reasonable inference for the student population in Year 2?
7. What is a reasonable inference for the student population in Year 7?
8. What is a reasonable prediction for the student population in Year 11?
9. School administrators plan to build a new elementary school when the student population at Washington Elementary reaches 700. Use extrapolation to predict the year in which that might happen.
10. Is the prediction you made in problem 9 reasonable? Explain.
Problem Set
Solve. For each set of problems use the given graph and information.
APPLICATIONS: LINEAR GRAPHS 329
VHS_PA_S1_09_p300-343.indd 329VHS_PA_S1_09_p300-343.indd 329 5/20/08 8:59:23 AM5/20/08 8:59:23 AM
Copyright © 2008, K12 Inc. All rights reserved. This material may not be reproduced in whole or in part, including illustrations, without the express prior written consent of K12 Inc.

330 UNIT 9 ANALYTIC GEOMETRY
Use the following information for problems 11−15. A new car loses value as it ages. The value of a certain car during its first five years is shown in the graph.
159 10 11 12131487
Car
val
ue ($
)
6Year
Car Value
543210
25000
20000
15000
10000
5000
0
11. What is a reasonable inference for the value of the car in Year 3?
12. What is a reasonable prediction for the value of the car in Year 6?
13. If you extrapolate from the data in the graph, what will be the value of the car in Year 9?
14. Use extrapolation to predict the year in which the car will be worth nothing.
15. Is the prediction you made in problem 14reasonable? Explain.
Use the following information for problems 16−20. Marvin is lifting weights to build muscle. During his first four weeks of weight training, he tracks the greatest weight he can bench press each week in a graph.
10987
Gre
ates
t wei
ght p
ress
ed
6Week
Bench Press
543210
340320300280260240220200180160140120100
16. During the fi rst four weeks, how much does Marvin’s heaviest press increase each week?
17. What is a reasonable prediction for Marvin’s heaviest press in Week 5?
18. What is a reasonable prediction for Marvin’s heaviest press in Week 6?
19. Use extrapolation to predict Marvin’s heaviest press in Week 20.
20. Is the prediction you made in problem 19 reasonable? Explain.
VHS_PA_S1_09_p300-343.indd 330VHS_PA_S1_09_p300-343.indd 330 5/27/08 11:15:42 AM5/27/08 11:15:42 AM
Copyright © 2008, K12 Inc. All rights reserved. This material may not be reproduced in whole or in part, including illustrations, without the express prior written consent of K12 Inc.

Relations and Functions
A relation describes how two sets are related to each other.
Identifying Domain and Range
A relation is a correspondence between two sets. A relation can be shown with a table or a set of ordered pairs or a graph. The domain of the relation is the set of all fi rst elements of the ordered pairs, called inputs. The range is the set of all second elements of the ordered pairs, called outputs.
DEFINITIONS
Example 1 Identify the domain and range.A {(−3, 4), (−2, 1), (−1, 0), (1, 7), (3, 7)}
Solution Identify the first elements. Identify the second elements.
Domain: {−3, −2, −1, 1, 3} Range: {4, 1, 0, 7} ■B x y
−5 2
−5 8
0 3
6 5
Solution The domain is the set of x-values. The range is the set of y-values.
Domain: {−5, 0, 6} Range: {2, 8, 3, 5} ■
Determining Whether a Relation Is a Function
A function is a relation that assigns exactly one output to every input. That means that for every ordered pair (x, y) in a function, each value of x is assigned exactly one value of y.
DEFINITION
Braces { } are used to indicate a set.
A relation is a set that contains ordered pairs.
The domain and range of a relation are sets that contain single numbers.
TIPBraces { } are used to indicate a set.
A relation is a set that contains ordered pairs.
The domain and range of a relation are sets that contain single numbers.
TIP
A function is like a machine. When you put in an allowable number, you get a specifi c answer.
TIPA function is like a machine. When you put in an allowable number, you get a specifi c answer.
TIP
RELATIONS AND FUNCTIONS 331
(continued)
VHS_PA_S1_09_p300-343.indd 331VHS_PA_S1_09_p300-343.indd 331 5/29/08 2:20:48 PM5/29/08 2:20:48 PM
Copyright © 2008, K12 Inc. All rights reserved. This material may not be reproduced in whole or in part, including illustrations, without the express prior written consent of K12 Inc.

332 UNIT 9 ANALYTIC GEOMETRY
Example 2 Determine whether each relation is a function.A {(−3, 4), (−2, 0), (−2, 1), (1, 3), (3, 7)}
Solution Look at the ordered pairs (−2, 0) and (−2, 1). The input −2 is assigned two different outputs: 0 and 1. This relation is not a function. ■
B x y
−6 3
−4 −4
1 0
1 3
2 8
C x y
1 2
0 4
−1 6
−2 8
Solution The input 1 is assigned Solution Each input is assignedtwo different outputs: 0 and 3. This exactly one output. This relation isrelation is not a function. ■ a function. ■
Applying the Vertical Line TestAll relations can be graphed. When a relation is graphed, use the vertical line test to determine whether it is a function.
If any vertical line can be drawn to intersect the graph of a relation in more than one point, the relation is not a function. If no vertical line exists that intersects the graph in more than one point, the relation is a function.
VERTICAL LINE TEST
Example 3 Apply the vertical line test to determine whether each graph represents a function.
If an x-value is repeated, appearing in diff erent ordered pairs, then the relation is not a function.
TIPIf an x-value is repeated, appearing in diff erent ordered pairs, then the relation is not a function.
TIP
If a vertical line hits more than one location on a graph, it means there are two points with the same x-coordinate.
THINK ABOUT ITIf a vertical line hits more than one location on a graph, it means there are two points with the same x-coordinate.
THINK ABOUT IT
A
8 1042 6–4 –2–8–10 –6
108642
–2–4–6–8
–10
x
ySolution
8 1042 6–4 –2–8–10 –6
108642
–2–4–6–8
–10
x
y
A vertical line intersects the graph in more than one point. The graph fails the vertical line test. The graph does not represent a function. ■
VHS_PA_S1_09_p300-343.indd 332VHS_PA_S1_09_p300-343.indd 332 5/27/08 11:15:58 AM5/27/08 11:15:58 AM
Copyright © 2008, K12 Inc. All rights reserved. This material may not be reproduced in whole or in part, including illustrations, without the express prior written consent of K12 Inc.

B
8 1042 6–4 –2–8–10 –6
108642
–2–4–6–8
–10
x
ySolution
8 1042 6–4 –2–8–10 –6
108642
–2–4–6–8
–10
x
y
There is no vertical line that intersects the graph in more than one point. The graph passes the vertical line test. The graph does represent a function. ■
C
8 1042 6–4 –2–8–10 –6
108642
–2–4–6–8
–10
x
ySolution
8 1042 6–4 –2–8–10 –6
108642
–2–4–6–8
–10
x
y
A vertical line intersects the graph in more than one point. The graph fails the vertical line test. The graph does not represent a function. ■
RELATIONS AND FUNCTIONS 333
The vertical line test is really just a way of applying the definition of a function. Note that in the preceding Example 3A, the points on the vertical line are (2, 3) and (2, 6). Therefore, the input 2 is assigned two different outputs: 3 and 6. By definition, the relation is not a function.
Evaluating Functions Many functions can be represented by equations. For instance, the equation y = x + 3 represents a function. Two solutions of the equation are (1, 4) and (2, 5). All the solutions of the equation form the set of ordered pairs that make up the function.
If a function equation has variables x and y, then x is the input (indepen-dent) variable, and y is the output (dependent) variable. We sometimes use the notation f (x) in place of the variable y. In function notation, x is the input variable. Using function notation, the equation y = x + 3 can be writ-ten f (x) = x + 3. If x = 1, then y = f (x) = f (1) = 1 +3 = 4. This is called evaluating the function f for the input x = 1. Note that the values x = 1 and y = 4 are in the ordered pair (1, 4).
The arrowheads on the graph in Example 3B indicate that the graph continues without end.
TIPThe arrowheads on the graph in Example 3B indicate that the graph continues without end.
TIP
Read f(x) as “f of x”.
THINK ABOUT ITRead f(x) as “f of x”.
THINK ABOUT IT
Variables other than x, y, and f can be used for functions. For example, the function d = 50t gives distance d as a function of time t. It can be written d(t) = 50t.
TIPVariables other than x, y, and f can be used for functions. For example, the function d = 50t gives distance d as a function of time t. It can be written d(t) = 50t.
TIP
(continued)
VHS_PA_S1_09_p300-343.indd 333VHS_PA_S1_09_p300-343.indd 333 5/27/08 11:16:08 AM5/27/08 11:16:08 AM
Copyright © 2008, K12 Inc. All rights reserved. This material may not be reproduced in whole or in part, including illustrations, without the express prior written consent of K12 Inc.
334 UNIT 9 ANALYTIC GEOMETRY
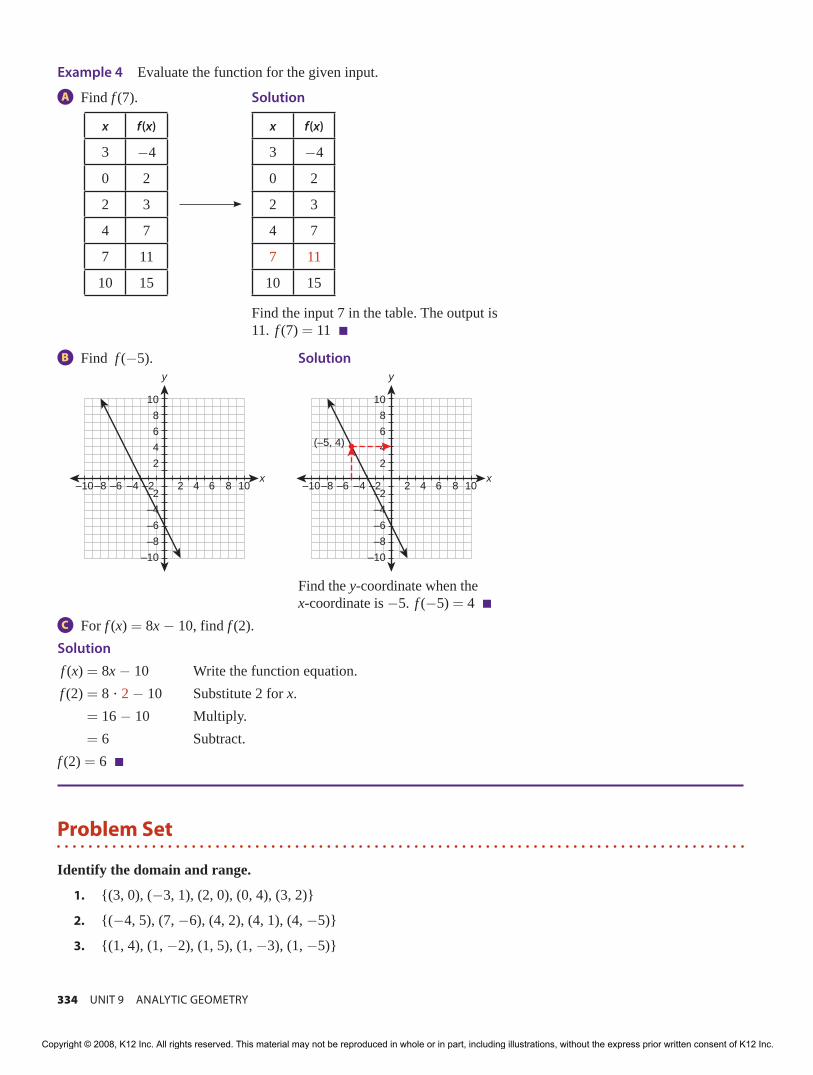
Example 4 Evaluate the function for the given input. A Find f (7). Solution
x f(x)
3 −4
0 2
2 3
4 7
7 11
10 15
x f(x)
3 −4
0 2
2 3
4 7
7 11
10 15
Find the input 7 in the table. The output is 11. f (7) = 11 ■
B Find f (−5). Solution
8 1042 6–4 –2–8–10 –6
108642
–2–4–6–8
–10
x
y
8 1042 6–4
(–5, 4)
–2–8–10 –6
108642
–2–4–6–8
–10
x
y
Find the y-coordinate when the x-coordinate is −5. f (−5) = 4 ■
C For f (x) = 8x − 10, find f (2).Solution f (x) = 8x − 10 Write the function equation. f (2) = 8 · 2 − 10 Substitute 2 for x. = 16 − 10 Multiply. = 6 Subtract.f (2) = 6 ■
1. {(3, 0), (−3, 1), (2, 0), (0, 4), (3, 2)}
2. {(−4, 5), (7, −6), (4, 2), (4, 1), (4, −5)}
3. {(1, 4), (1, −2), (1, 5), (1, −3), (1, −5)}
Problem Set
Identify the domain and range.
VHS_PA_S1_09_p300-343.indd 334VHS_PA_S1_09_p300-343.indd 334 5/27/08 11:16:11 AM5/27/08 11:16:11 AM
Copyright © 2008, K12 Inc. All rights reserved. This material may not be reproduced in whole or in part, including illustrations, without the express prior written consent of K12 Inc.

4. x y
−2 4
−1 2
0 3
1 2
5. x y
−1 1
3 −2
3 5
5 6
6. x y
0 0
0 −3
1 1
2 0
Determine whether each relation is a function.
7. {(2, 0), (2, 7), (3, −1), (4, 2), (9, 3)}
8. {(0, 2), (4, 2), (3, 2), (5, 1), (6, 2)}
9. {(1, 2), (2, 4), (3, 6), (4, 8), (5, 10)}
10. x y
1 3
1 2
2 2
3 −2
11. x y
−2 3
1 2
2 1
4 2
12. x y
0 0
2 3
5 0
6 1
Apply the vertical line test to determine whether each graph represents a function.
13.
8 1042 6–4 –2–8–10 –6
108642
–2–4–6–8
–10
x
y
14.
8 1042 6–4 –2–8–10 –6
108642
–2–4–6–8
–10
x
y
15.
8 1042 6–4 –2–8–10 –6
108642
–2–4–6–8
–10
x
y
16.
8 1042 6–4 –2–8–10 –6
108642
–2–4–6–8
–10
x
y
RELATIONS AND FUNCTIONS 335
VHS_PA_S1_09_p300-343.indd 335VHS_PA_S1_09_p300-343.indd 335 5/20/08 8:59:36 AM5/20/08 8:59:36 AM
Copyright © 2008, K12 Inc. All rights reserved. This material may not be reproduced in whole or in part, including illustrations, without the express prior written consent of K12 Inc.

336 UNIT 9 ANALYTIC GEOMETRY
Evaluate the function for the given input.
17. f (3)
x f(x)
0 4
1 5
2 6
3 7
4 8
5 9
18. g(9)
x g(x)
−2 3
2 6
4 8
9 −2
−5 6
0 1
19. h(−3)
x h(x)
2 3
1 2
3 2
−1 −2
−3 6
−8 2
20. f (−2)
8 1042 6–4 –2–8–10 –6
108642
–2–4–6–8
–10
x
f (x)
21. f (5)
8 1042 6–4 –2–8–10 –6
108642
–2–4–6–8
–10
x
f (x)
22. s(3)
8 1042 6–4 –2–8–10 –6
108642
–2–4–6–8
–10
x
s(x)
23. g(9)
8 1042 6–4 –2–8–10 –6
108642
–2–4–6–8
–10
x
g (x)
24. f (x) = 3x
Find f (4).
25. g(x) = 2x − 3
Find g(−2).
26. f (x) = x2 + 3x
Find f (4).
27. h(x) = √_______
2x + 25
Find h(0).
VHS_PA_S1_09_p300-343.indd 336VHS_PA_S1_09_p300-343.indd 336 5/27/08 11:18:38 AM5/27/08 11:18:38 AM
Copyright © 2008, K12 Inc. All rights reserved. This material may not be reproduced in whole or in part, including illustrations, without the express prior written consent of K12 Inc.

A system of linear equations is made up of two or more linear equations.
A solution of a system of linear equations in two variables is an ordered pair that is a solution of each equation in the system.
Solving a System of Linear Equations by GraphingExample 1 Solve the system by graphing. y = 3x − 2 y = −x + 6
Solution Graph each equation. The ordered-pair coordinates of the point of intersection is the solution.
x y = 3x − 2
−2 −8
0 −2
3 7
x y = −x + 6
−3 9
0 6
6 0
Make a table ofvalues for eachequation.
8 10
y = –x + 6y = 3x – 2
42 6
(2, 4)
–4 –2–8–10 –6
108642
–2–4–6–8
–10
x
y
Graph each equation.
Identify the point of intersection.
The point of intersection appears to be at (2, 4).
Find at least 3 ordered pairs for each line. Choose x-values that are spaced apart. This helps ensure that you draw an accurate line.
TIPFind at least 3 ordered pairs for each line. Choose x-values that are spaced apart. This helps ensure that you draw an accurate line.
TIP
Each equation in the system has an infi nite number of ordered-pair solutions, corresponding to the infi nite number of points on each line.
But only the point (2, 4) is on both lines. So, (2, 4) is the only solution of the system.
THINK ABOUT ITEach equation in the system has an infi nite number of ordered-pair solutions, corresponding to the infi nite number of points on each line.
But only the point (2, 4) is on both lines. So, (2, 4) is the only solution of the system.
THINK ABOUT IT
Systems of Linear Equations
SYSTEMS OF LINEAR EQUATIONS 337
(continued)
VHS_PA_S1_09_p300-343.indd 337VHS_PA_S1_09_p300-343.indd 337 5/20/08 8:59:38 AM5/20/08 8:59:38 AM
Copyright © 2008, K12 Inc. All rights reserved. This material may not be reproduced in whole or in part, including illustrations, without the express prior written consent of K12 Inc.

338 UNIT 9 ANALYTIC GEOMETRY
Check Substitute (2, 4) into each equation. The solution is correct if each equation is true.
y = 3x − 2 y = −x + 6
4 � 3 · 2 − 2 4 � −2 + 6
4 � 6 − 2 4 = 4 �
4 = 4 �
Both equations are true for (2, 4).
The solution of the system is (2, 4). ■
Determining the Number of Solutions of a System of Linear Equations A system of linear equations in two variables can have exactly one solution, no solutions, or an infinite number of solutions.
Example 2 Use the graph to determine the number of solutions of the sys-tem of equations.A y = x + 3
8 10
y = x + 3
y + 5 = x
42 6–4 –2–8–10 –6
108642
–2–4–6–8
–10
x
y
y + 5 = x
Solution The lines are parallel. There is no point of intersection. The sys-tem has no solution. ■
VHS_PA_S1_09_p300-343.indd 338VHS_PA_S1_09_p300-343.indd 338 5/20/08 8:59:45 AM5/20/08 8:59:45 AM
Copyright © 2008, K12 Inc. All rights reserved. This material may not be reproduced in whole or in part, including illustrations, without the express prior written consent of K12 Inc.

B 2y = 3x − 6
8 10
2y = 3x – 6
y = 1.5x – 3
42 6–4 –2–8–10 –6
108642
–2–4–6–8
–10
x
y
y = 1.5x − 3
Solution The two equations in the system describe the same line. Every point on the line is a solution to each equation. The system has an infinite number of solutions. ■C x = −6
8 10
3x + 2y = –4x = –6
42 6–4 –2–8–10 –6
108642
–2–4–6–8
–10
x
y
3x + 2y = −4
Solution The lines intersect in one point. There is exactly one ordered pair that is a solution of both equations in the system. The system has exactly one solution. ■
Solving a System of Linear Equations by SubstitutionYou can solve a system of linear equations by algebraic methods. One alge-braic method is substitution.
Step 1 Solve one of the equations for one of the variables.Step 2 Substitute the expression from Step 1 into the other equation and
solve for the other variable.Step 3 Substitute the value you found in Step 2 into either equation and
solve for the remaining variable.
SOLVING A SYSTEM OF LINEAR EQUATIONS BY SUBSTITUTION
The lines in the graph of a linear system can be slanted, vertical, or horizontal.
THINK ABOUT ITThe lines in the graph of a linear system can be slanted, vertical, or horizontal.
THINK ABOUT IT
SYSTEMS OF LINEAR EQUATIONS 339
(continued)
VHS_PA_S1_09_p300-343.indd 339VHS_PA_S1_09_p300-343.indd 339 5/27/08 11:18:56 AM5/27/08 11:18:56 AM
Copyright © 2008, K12 Inc. All rights reserved. This material may not be reproduced in whole or in part, including illustrations, without the express prior written consent of K12 Inc.

340 UNIT 9 ANALYTIC GEOMETRY
Example 3
A Solve the system by substitution.
5x + y = 20
y = x + 2
Solution
Step 1 The equation y = x + 2 is already solved for y.
Step 2 Substitute x + 2 for y into the other equation and solve for x.
5x + y = 20 Write the first equation.
5x + x + 2 = 20 Substitute x + 2 for y.
6x + 2 = 20 Simplify the left side of the equation.
6x = 18 Subtract 2 from both sides.
x = 3 Divide both sides by 6.
Step 3 Substitute 3 for x into either equation.
y = x + 2 Write the second equation.
y = 3 + 2 Substitute 3 for x.
y = 5 Simplify to solve the equation.
The result in Step 2 is x = 3. The result in Step 3 is y = 5. The solution of the system is (3, 5). ■B Solve the system by substitution.
x + 2y = 9
x + 3y = 13
Solution
Step 1 Solve the first equation for x.
x + 2y = 9
x = 9 − 2y
Step 2 Substitute 9 − 2y for x into the second equation and solve for y.
x + 3y = 13 Write the second equation.
9 − 2y + 3y = 13 Substitute 9 − 2y for x.
9 + y = 13 Simplify the left side of the equation.
y = 4 Subtract 9 from both sides.
Step 3 Substitute 4 for y into either equation.
x + 2y = 9 Write the first equation.
x + 2 · 4 = 9 Substitute 4 for y.
x + 8 = 9 Simplify the left side of the equation.
x = 1 Subtract 8 from both sides.
The solution of the system is (1, 4). ■
For Step 1, you could solve 5x + y = 20 for y. Then for Step 2, you would substitute that expression into y = x + 2.
THINK ABOUT ITFor Step 1, you could solve 5x + y = 20 for y. Then for Step 2, you would substitute that expression into y = x + 2.
THINK ABOUT IT
Check the solution by substituting (3, 5) into both equations in the system.
TIPCheck the solution by substituting (3, 5) into both equations in the system.
TIP
VHS_PA_S1_09_p300-343.indd 340VHS_PA_S1_09_p300-343.indd 340 5/20/08 8:59:48 AM5/20/08 8:59:48 AM
Copyright © 2008, K12 Inc. All rights reserved. This material may not be reproduced in whole or in part, including illustrations, without the express prior written consent of K12 Inc.

Problem Set
Use the graph to determine the number of solutions of the system of equations.
1.
8 10
y = –2x + 8y = 2x
42 6–4 –2–8–10 –6
108642
–2–4–6–8
–10
x
y 2.
8 10
y = 3
y = –242 6–4 –2–8–10 –6
108642
–2–4–6–8
–10
x
y
SYSTEMS OF LINEAR EQUATIONS 341
Application: Ticket SalesExample 4 Tickets to a school play cost $3 for adults and $2 for students. On opening night, 140 tickets were sold and $370 were collected in ticket sales. How many of each type of ticket were sold?
Solution Let a be the number of adult tickets sold and s be the number of student tickets sold. Write and solve a system of equations.
a + s = 140 A total of 140 tickets were sold.
3a + 2s = 370 3a + 2s dollars were collected from ticket sales.
Solve the first equation for s.
s = 140 − a Subtract a from both sides.
Substitute this expression for s in the second equation and solve for a.
3a + 2 · (140 − a) = 370 Substitute 140 − a for s into the second equation.
3a + 280 − 2a = 370 Distribute.
a + 280 = 370 Simplify the left side of the equation.
a = 90 Subtract 280 from both sides.
s = 140 − a = 140 − 90 = 50 Substitute 90 for a to find the value of s.
a = 90 and s = 50.
There were 90 adult tickets and 50 student tickets sold. ■
Example 4 is a case in which it is not reasonable to say that either variable depends on the other. You can choose either variable to be the independent variable. If you choose a to be the independent variable, then ordered pairs are in the form (a, s), and the solution of the system is (90, 50).
THINK ABOUT ITExample 4 is a case in which it is not reasonable to say that either variable depends on the other. You can choose either variable to be the independent variable. If you choose a to be the independent variable, then ordered pairs are in the form (a, s), and the solution of the system is (90, 50).
THINK ABOUT IT
VHS_PA_S1_09_p300-343.indd 341VHS_PA_S1_09_p300-343.indd 341 5/20/08 11:49:07 AM5/20/08 11:49:07 AM
Copyright © 2008, K12 Inc. All rights reserved. This material may not be reproduced in whole or in part, including illustrations, without the express prior written consent of K12 Inc.

342 UNIT 9 ANALYTIC GEOMETRY
7. x = 2 y = 5
8. x = 3 y = x
9. y = 2x y = x − 1
10. y = x − 2 y = 2x − 5
11. y = 2x − 2 y = 3x − 2
12. x + y = 4 y = x − 2
13. x + y = 3 2x + y = 8
14. 3x + y = 9 x − 2y = 10
Solve each system by graphing.
3.
8 10
x – 2y = 10y = 0.5x – 5
42 6–4 –2–8–10 –6
108642
–2–4–6–8
–10
x
y
4.
8 10
x = 2 x = 6
42 6–4 –2–8–10 –6
108642
–2–4–6–8
–10
x
y
5.
8 10
y = 2x – 1
y = –5
42 6–4 –2–8–10 –6
108642
–2–4–6–8
–10
x
y
6.
8 10
y = x
y = –4x
42 6–4 –2–8–10 –6
108642
–2–4–6–8
–10
x
y
VHS_PA_S1_09_p300-343.indd 342VHS_PA_S1_09_p300-343.indd 342 5/20/08 8:59:51 AM5/20/08 8:59:51 AM
Copyright © 2008, K12 Inc. All rights reserved. This material may not be reproduced in whole or in part, including illustrations, without the express prior written consent of K12 Inc.

15. y = x + 1 x + y = 5
16. y = −1 x − y = 5
17. x = 2 x = y + 6
18. x − y = −2 x + y = 4
19. y = 2x x = y − 2
20. x − 2y = 4 x + y = 4
21. 2x + 3y = 3 x + 2y = 1
22. 4x + y = −6 3x − y = − 1
23. y = −6 6x + 2y = −12
24. 3x − y = −4 x + 3y = 22
25. Challenge 3x + 4y = −19 2x = 4y − 6
26. Challenge 4x + 2y = 30 −2x − 5y = −51
*
*
Solve each system by substitution.
Write and solve a system of equations to answer each question.
27. Mrs. Young teaches fl ute and piano lessons. She has 9 fl ute students. The total number of stu-dents is 21. How many piano students does Mrs. Young have?
28. The sum of two numbers is 31. The difference of the numbers is 7. What are the two numbers?
29. By weight, a trail mix contains 3 times as much raisins as peanuts. The total weight of the pea-nuts and raisins in the mixture is 24 ounces. How many ounces of peanuts are in the mixture? How many ounces of raisins?
30. Challenge Charlie bought 2 large pizzas and 4 drinks and paid $38. At the same restaurant, Allen bought 4 large pizzas and 6 drinks and paid $73. What is the cost of a large pizza? What is the cost of a drink?
*
SYSTEMS OF LINEAR EQUATIONS 343
VHS_PA_S1_09_p300-343.indd 343VHS_PA_S1_09_p300-343.indd 343 5/20/08 8:59:52 AM5/20/08 8:59:52 AM
Copyright © 2008, K12 Inc. All rights reserved. This material may not be reproduced in whole or in part, including illustrations, without the express prior written consent of K12 Inc.