![Analysis, Probability, ' }u Çv o] }v NONLOCAL OPERATORSNonlocalOperators Analysis, Probability, Geometry and Applications CenterforInterdisciplinaryResearch(ZiF),Bielefeld July9–14,2012](https://static.fdocuments.in/doc/165x107/5ee058ebad6a402d666b8c35/analysis-probability-u-v-o-v-nonlocal-operators-nonlocaloperators-analysis.jpg)
Unit 6 Data Analysis and Probability - Georgia Standards · PDF fileUnit 6 Data Analysis and...
25
Mathematics III Unit 6 2 nd Edition Georgia Department of Education Kathy Cox, State Superintendent of Schools June, 2010 Copyright 2010 © All Rights Reserved Unit 1: Page 1 of 25 Mathematics III Frameworks Student Edition Unit 6 Data Analysis and Probability 2 nd Edition June, 2010 Georgia Department of Education
Transcript of Unit 6 Data Analysis and Probability - Georgia Standards · PDF fileUnit 6 Data Analysis and...

Mathematics III Unit 6 2nd Edition
Georgia Department of Education Kathy Cox, State Superintendent of Schools
June, 2010 Copyright 2010 © All Rights Reserved
Unit 1: Page 1 of 25
Mathematics III
Frameworks
Student Edition
Unit 6
Data Analysis and
Probability
2nd
Edition
June, 2010
Georgia Department of Education

Mathematics III Unit 6 2nd Edition
Georgia Department of Education Kathy Cox, State Superintendent of Schools
June, 2010 Copyright 2010 © All Rights Reserved
Unit 1: Page 2 of 25
Table of Contents
Introduction . . . . . . . . . . . . . . . . . . . . . . . . . . . . . . . . . . . . . . . . . . . . . . . . . . . . . . . . . . . . 3
And You Believed That?! Learning Task… . . . . . . . . . . . . . . . . . . . . . . . . . . . . . . . . . . . 5
We’re Watching You Learning Task………………………….. . . . . . . . . . . . . . . . . . . . 10
Please be Discrete Learning Task……………………. . . . . . . . . . . . . . . . . . . . . . . . . . . 13
One Way or the Other Learning Task………… . . . . . . . . . . . . . . . . . . . . . . . . . . . . . . . .17
Let’s Be Normal Learning Task………. . . . . . . . . . . . . . . . . . . . . . . . . . . . . . . . . . . . . .20

Mathematics III Unit 6 2nd Edition
Georgia Department of Education Kathy Cox, State Superintendent of Schools
June, 2010 Copyright 2010 © All Rights Reserved
Unit 1: Page 3 of 25
INTRODUCTION:
Students have spent the entire year of Mathematics III learning different functions and
how they are used. In the final unit of the year, students will look again at probability. Students will use a normal distribution to calculate probabilities. They will organize,
represent, investigate, interpret, and make inferences using data from both observational
studies and experiments.
ENDURING UNDERSTANDINGS:
Understand the difference between discrete random variables and continuous
random variables
Use normal distribution to interpret problems involving probabilities
Understand the difference between experimental and observational studies
KEY STANDARDS ADDRESSED:
MM3D1. Students will create probability histograms of discrete random variables,
using both experimental and theoretical probabilities.
MM3D2. Students will solve problems involving probabilities by interpreting a normal
distribution as a probability histogram for a continuous random variable (z-scores are
used for a general normal distribution).
a. Determine intervals about the mean that include a given percent of data. (Empirical Rule)
b. Determine the probability that a given value falls within a specified interval.
c. Estimate how many items in a population fall within a specified interval.
MM3D3. Students will understand the differences between experimental and
observational studies by posing questions and collecting, analyzing, and interpreting
data.

Mathematics III Unit 6 2nd Edition
Georgia Department of Education Kathy Cox, State Superintendent of Schools
June, 2010 Copyright 2010 © All Rights Reserved
Unit 1: Page 4 of 25
RELATED STANDARDS ADDRESSED:
MM1P1. Students will solve problems (using appropriate technology).
a. Build new mathematical knowledge through problem solving. b. Solve problems that arise in mathematics and in other contexts. c. Apply and adapt a variety of appropriate strategies to solve problems. d. Monitor and reflect on the process of mathematical problem solving.
MM1P2. Students will reason and evaluate mathematical arguments.
a. Recognize reasoning and proof as fundamental aspects of mathematics. b. Make and investigate mathematical conjectures. c. Develop and evaluate mathematical arguments and proofs. d. Select and use various types of reasoning and methods of proof.
MM1P3. Students will communicate mathematically.
a. Organize and consolidate their mathematical thinking through communication.
b. Communicate their mathematical thinking coherently and clearly to peers, teachers, and others.
c. Analyze and evaluate the mathematical thinking and strategies of others. d. Use the language of mathematics to express mathematical ideas precisely.
MM1P4. Students will make connections among mathematical ideas and to other disciplines.
a. Recognize and use connections among mathematical ideas. b. Understand how mathematical ideas interconnect and build on one another
to produce a coherent whole. c. Recognize and apply mathematics in contexts outside of mathematics.
MM1P5. Students will represent mathematics in multiple ways.
a. Create and use representations to organize, record, and communicate mathematical ideas.
b. Select, apply, and translate among mathematical representations to solve problems.
c. Use representations to model and interpret physical, social, and mathematical phenomena.

Mathematics III Unit 6 2nd Edition
Georgia Department of Education Kathy Cox, State Superintendent of Schools
June, 2010 Copyright 2010 © All Rights Reserved
Unit 1: Page 5 of 25
And You Believed That?! Learning Task:
A solid knowledge of statistical procedures will help you be an educated consumer of
information. Every day, we are confronted by a news report citing a new relationship
researchers have discovered or a claim being made in advertising. Beginning with this
task, we will examine the questions you should keep in mind when analyzing such
claims.
1. Read the article below. What claim is being made? What is special about the claim?
Facebook use linked to less textbook time
By Mary Beth Marklein, USA TODAY (April 13, 2009)
Does Facebook lead to lower grades? Or do college students with lower grades use Facebook more than their
higher-achieving peers?
A study of 219 students at Ohio State University being presented at a conference this week doesn't answer those
questions definitively. But it suggests a link between the social networking site and academic performance.
Students who said they used Facebook reported grade-point averages between 3.0 and 3.5; those who don't use it
said they average 3.5 to 4.0. Also, Facebook users said they studied one to five hours a week, vs. non-users' 11
hours or more.
Ohio State doctoral student Aryn Karpinski, who conducted the research with graduate student Adam Duberstein,
says the study is too narrow to conclude that Facebook and academics don't mix.
"It cannot be stated (that) Facebook use causes a student to study less" or get lower grades, she says. "I'm just
saying that they're related somehow, and we need to look into it further." Of the 68% of students who said they
used Facebook, 65% accessed the site daily or multiple times daily.
Karpinski says 79% of Facebook users believe it has no impact on their academics; some say it helps them form
study groups.
She says faculty ought to consider harnessing it as a learning tool. Yet a preliminary peek at a second survey
suggests "a lot of faculty … didn't even know what Facebook is," she says.

Mathematics III Unit 6 2nd Edition
Georgia Department of Education Kathy Cox, State Superintendent of Schools
June, 2010 Copyright 2010 © All Rights Reserved
Unit 1: Page 6 of 25
Bias in Research and Studies
The first question raised when evaluating the believability of a claim is whether or not the
questions and procedures when designed in such a way as to eliminate bias. It is critical
for statisticians and researchers to avoid leading questions and questions that are vague or
contain confusing wording. For example, asking someone each of the following
questions may illicit different responses even though all three questions address the same
topic.
1. “Is it really possible for a person to still believe that wearing a seat belt is not
completely necessary?”
2. “Is wearing a seat belt necessary for the complete safety of all passengers?”
3. “Wearing a seat belt is currently required by state law. Do you agree with
this law?”
2. How would you answer each of these questions? Did the wording of the questions
influence your responses?
3. Refer to the article at the beginning of the task. What questions could the researchers
have asked? Can you write two unbiased questions related to the article that researchers
might have asked the subjects of the study?
Another possible source of bias in studies is in the sampling technique. Remember that a
sample is a subgroup of the population. It is important that researchers use unbiased
samples. In order to have an unbiased sample, the sample must be selected at random.
There are many types of random samples. The most common are:
- A simple random sample, in which every possible sample of the same size has
the same chance of being selected. This can be accomplished by assigning every member

Mathematics III Unit 6 2nd Edition
Georgia Department of Education Kathy Cox, State Superintendent of Schools
June, 2010 Copyright 2010 © All Rights Reserved
Unit 1: Page 7 of 25
of the population a distinct number and then using a random number generator or table to
select members of the sample.
- A systematic sample, in which every member of population is assigned a number
or put in order and then members of the sample are selected at set intervals, for example
every tenth member is selected for the sample.
- A stratified random sample, in which members of the population are grouped by
a specific characteristic and then members from each group, or strata, are selected using a
simple random sample procedure.
- A cluster sample, in which the researcher identifies pre-existing groups, or
clusters, within the population and then randomly selects a set numbers of these clusters
as the sample. In this case, every member of the selected cluster is a part of the sample.
There are also sampling methods that create bias in the study. Examples of these
methods are convenience sampling (asking the first ten people who walk by) and
voluntary response (asking radio listeners to call in to share responses or vote on a
particular issue or asking subjects to return a survey by mail or email). Both convenience
sampling and voluntary response lack the critical element of randomization.
4. Referring to the article, what type of sampling technique do you believe the researchers
may have used? Why?
5. Consider the student body of your high school to be the population for a study being
conducted by the school newspaper. One of the newspaper students, Emma, is writing an
article on study habits. She has carefully designed a survey of five questions, but knows
that she cannot distribute the survey to all students. Why is she correct in this belief?
6. Emma has decided to survey 50 students. She is trying to decide which type of
random sample will be the most appropriate and easiest for her to complete successfully.
Explain how she could select each type of sample from the students at your school:

Mathematics III Unit 6 2nd Edition
Georgia Department of Education Kathy Cox, State Superintendent of Schools
June, 2010 Copyright 2010 © All Rights Reserved
Unit 1: Page 8 of 25
Simple:
Systematic:
Stratified:
Cluster:
If you were gathering information for this article, which of these samples would you use?
Explain.
7. Another student on the staff thinks that Emma is making the assignment too difficult
and suggested that she simply survey the students in her first period class. Would this be
an appropriate sampling method? Explain.
8. Emma’s friend, Marcus, is on the yearbook staff and is currently involved in the
staff’s effort to design this year’s cover. The group wants to create a cover design that
depicts the “typical” student from the school. In order to determine the typical student,
they have decided to design a fifteen question survey focusing on physical characteristics,
classes and extracurricular activities. The problem is that the students are having
difficulty writing unbiased questions to gather the data they need. They have agreed that
seven questions should address physical characteristics, four should address classes
taken, and four should address extracurricular activities. Pretend you are a member of
this yearbook staff and write fifteen questions for this survey.
Mathematics III Unit 6 2nd Edition
Georgia Department of Education Kathy Cox, State Superintendent of Schools
June, 2010 Copyright 2010 © All Rights Reserved
Unit 1: Page 9 of 25
9. Trade surveys with at least one other group in your class. Look for any bias within the
questions. If you identify any bias in a question, rewrite the question in a way that
eliminates the bias.

Mathematics III Unit 6 2nd Edition
Georgia Department of Education Kathy Cox, State Superintendent of Schools
June, 2010 Copyright 2010 © All Rights Reserved
Unit 1: Page 10 of 25
We’re Watching You Learning Task:
There are two approaches to collecting data in statistics – observational studies and
experiments. In observational studies, researchers observe characteristics from samples
of an existing population and use the information collected to make inferences about the
population. In an observational study, the researcher gathers data without trying to
influence responses or imposing any controls on the situation. In an experiment,
researchers gather data by imposing a treatment and observing responses.
There are several key steps involved in designing an observational study.
1. Determine the focus of the study. What is the variable of interest? What
information is needed to answer the main question of interest?
2. Develop a plan to collect data. How will subjects be observed?
3. Determine the most appropriate sampling method and select the sample.
4. Collect the data.
5. Describe and interpret the data using appropriate statistical procedures and
graphs.
6. Report the findings of the study.
The basic principles of experimental design are:
1. Randomization – Experimental units/subjects should be randomly
assigned to treatment groups.
2. Control - Experimenters need to control any lurking variables, generally by
comparing multiple treatment groups.
3. Replication – The experiment should involve many experimental
units/subjects.
Use the information above as well as what you have learned in class to explore the
following situations.
1. A local community has just installed red light cameras at its busiest intersection. The
police department hopes that the cameras will encourage drivers to be more careful and
that incidents of drivers running red lights at this intersection will decrease. Design an
observational study that the police department could use to determine if the installation of
the traffic light has had the deserved effect.
a. What is the focus of the study?
What is the variable of interest?

Mathematics III Unit 6 2nd Edition
Georgia Department of Education Kathy Cox, State Superintendent of Schools
June, 2010 Copyright 2010 © All Rights Reserved
Unit 1: Page 11 of 25
b. Determine the data collection plan.
c. Funds are limited and there are only a few days to conduct the study. What is the
most appropriate sampling method?
d. The police chief also wonders if there is a difference in driver behavior at different
times of day. Can you incorporate this concern into your sampling method?
2. A few years ago, a study was conducted at John Hopkins hospital in Boston to see if
exposure to ultrasound could affect the birth weight of a baby. Investigators followed
unborn babies and their mothers until their birth and notes their birth weight. A
comparison was made between the birth weight of those babies exposed to ultrasound
and those babies not exposed to ultrasound. Whether an ultrasound was used on the baby
was a decision made by the mother’s doctor, based on medical justification. Was this
study an experiment or an observational study? Explain. List any possible confounding
variables in this study. (source: Chris Franklin, University of Georgia)
3. Suppose the faculty of a Statistics department at a large university wanted to look at
how students in the introductory Statistics courses might perform on exams under
different environmental conditions. They decided to consider the effect of the size of the
classroom (a smaller classroom where there are just enough seats for the students versus a
large classroom where the students can spread out with an empty seat between each
student). When the next exam is given in one section of the introductory Statistics
course, 60 students will be randomly assigned to one of the treatments. The scores on the
exam will then be compared. (source: Chris Franklin, University of Georgia)
a. Is this study an experiment or observational study. Explain.
b. Name the explanatory factor.
c. Name the response variable.
d. How many treatments will this study compare? Name the treatments.
e. Diagram a completely randomized design for this study.

Mathematics III Unit 6 2nd Edition
Georgia Department of Education Kathy Cox, State Superintendent of Schools
June, 2010 Copyright 2010 © All Rights Reserved
Unit 1: Page 12 of 25
4. You want to determine the best color for attracting cereal leaf beetles to boards on
which they will be trapped. You will compare four colors: blue, green, white and yellow.
You plan to count the number of beetles trapped. You will mount one board on each of
16 poles evenly spaced in a square field.
a. What are the experimental units?
b. What is the explanatory variable?
c. What are the treatments?
d. What is the response variable?
e. Outline the design of the above experiment.
Mathematics III Unit 6 2nd Edition
Georgia Department of Education Kathy Cox, State Superintendent of Schools
June, 2010 Copyright 2010 © All Rights Reserved
Unit 1: Page 13 of 25
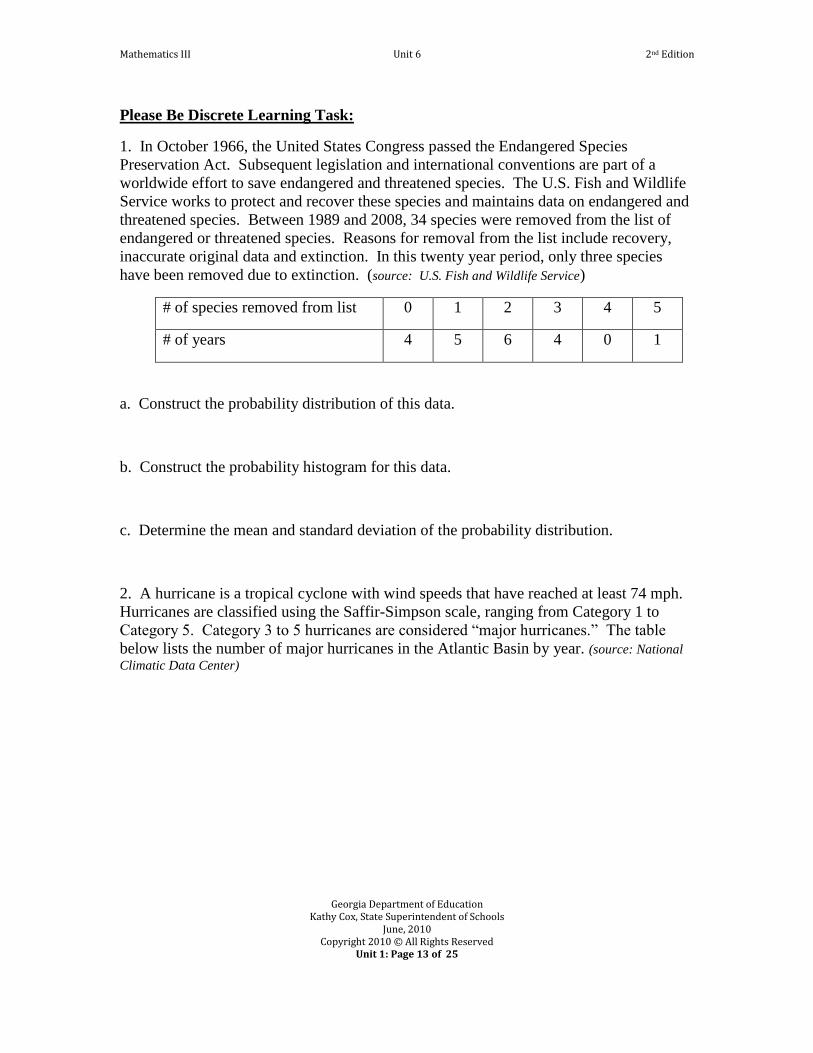
Please Be Discrete Learning Task:
1. In October 1966, the United States Congress passed the Endangered Species
Preservation Act. Subsequent legislation and international conventions are part of a
worldwide effort to save endangered and threatened species. The U.S. Fish and Wildlife
Service works to protect and recover these species and maintains data on endangered and
threatened species. Between 1989 and 2008, 34 species were removed from the list of
endangered or threatened species. Reasons for removal from the list include recovery,
inaccurate original data and extinction. In this twenty year period, only three species
have been removed due to extinction. (source: U.S. Fish and Wildlife Service)
# of species removed from list 0 1 2 3 4 5
# of years 4 5 6 4 0 1
a. Construct the probability distribution of this data.
b. Construct the probability histogram for this data.
c. Determine the mean and standard deviation of the probability distribution.
2. A hurricane is a tropical cyclone with wind speeds that have reached at least 74 mph.
Hurricanes are classified using the Saffir-Simpson scale, ranging from Category 1 to
Category 5. Category 3 to 5 hurricanes are considered “major hurricanes.” The table
below lists the number of major hurricanes in the Atlantic Basin by year. (source: National
Climatic Data Center)

Mathematics III Unit 6 2nd Edition
Georgia Department of Education Kathy Cox, State Superintendent of Schools
June, 2010 Copyright 2010 © All Rights Reserved
Unit 1: Page 14 of 25
a. Construct a frequency table for this data.
b. Construct the probability distribution for this data.
c. Construct a probability histogram for this data.
Year # of major
hurricanes
Year # of major
hurricanes
Year # of major
hurricanes
1984 1 1993 1 2001 4
1985 3 1994 0 2002 2
1986 0 1995 5 2003 3
1987 1 1996 6 2004 6
1988 3 1997 1 2005 7
1989 2 1998 3 2006 2
1990 1 1999 5 2007 2
1991 2 2000 3 2008 5
1992 1
Mathematics III Unit 6 2nd Edition
Georgia Department of Education Kathy Cox, State Superintendent of Schools
June, 2010 Copyright 2010 © All Rights Reserved
Unit 1: Page 15 of 25
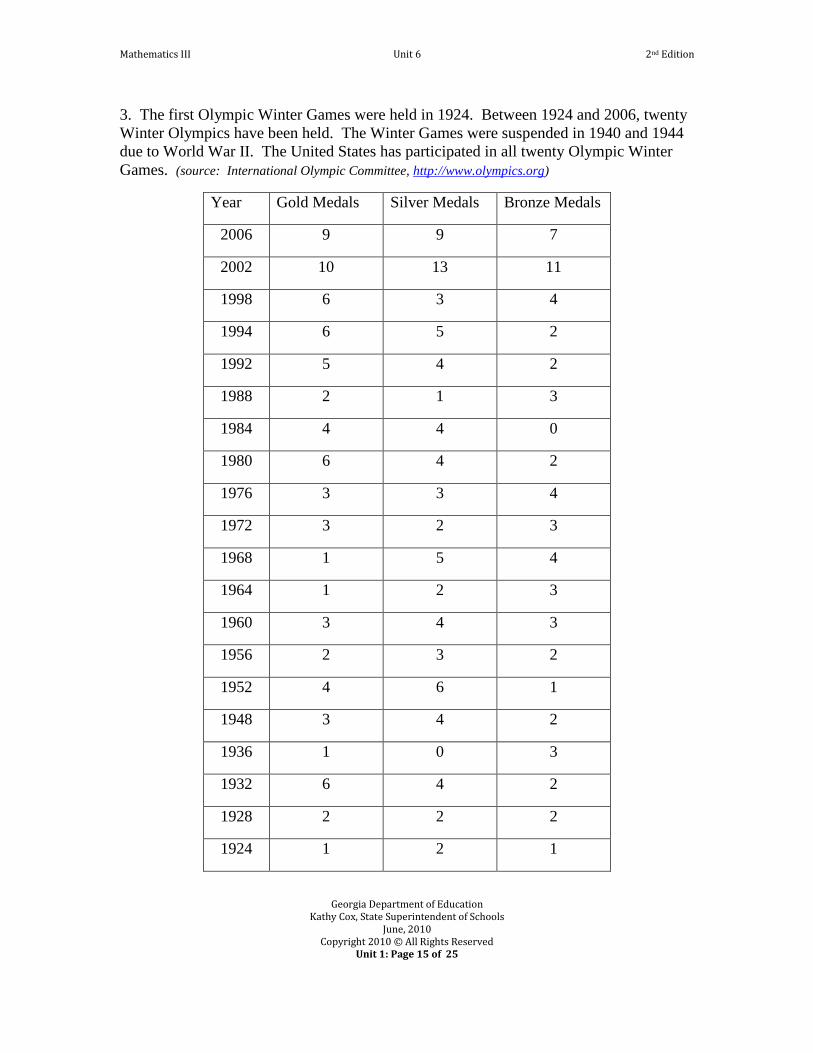
3. The first Olympic Winter Games were held in 1924. Between 1924 and 2006, twenty
Winter Olympics have been held. The Winter Games were suspended in 1940 and 1944
due to World War II. The United States has participated in all twenty Olympic Winter
Games. (source: International Olympic Committee, http://www.olympics.org)
Year Gold Medals Silver Medals Bronze Medals
2006 9 9 7
2002 10 13 11
1998 6 3 4
1994 6 5 2
1992 5 4 2
1988 2 1 3
1984 4 4 0
1980 6 4 2
1976 3 3 4
1972 3 2 3
1968 1 5 4
1964 1 2 3
1960 3 4 3
1956 2 3 2
1952 4 6 1
1948 3 4 2
1936 1 0 3
1932 6 4 2
1928 2 2 2
1924 1 2 1

Mathematics III Unit 6 2nd Edition
Georgia Department of Education Kathy Cox, State Superintendent of Schools
June, 2010 Copyright 2010 © All Rights Reserved
Unit 1: Page 16 of 25
a. Construct the discrete probability distribution for the number of gold medals.
b. Construct the probability histogram of this distribution.
c. Construct the probability distribution for the number of silver medals won.
d. Construct the probability histogram for this distribution.
e. Compare the distributions of gold medals and silver medals won by the United States.
Be sure to discuss the mean and standard deviation of each distribution in your
comparison.
4. Let’s explore the probabilities associated with tossing a coin, focusing on the number
of heads in four tosses of one coin. The theoretical probability distribution for this
situation is below.
Number of heads, X 0 1 2 3 4
P(X) 1
16
1
4
3
8
1
4
1
16
a. Will experimental results match this theoretical distribution? Collect your own data
by completing 32 trials. Compare the distribution of your data to the theoretical
distribution.
b. Combine the data from your entire class into one probability distribution. How does
this distribution compare to your group’s distribution? To the theoretical distribution?
5. Determine a discrete variable on interest in your class and construct the associated
probability distribution for this variable. Discuss the distribution, including the shape of
the histogram, the mean and the standard deviation.

Mathematics III Unit 6 2nd Edition
Georgia Department of Education Kathy Cox, State Superintendent of Schools
June, 2010 Copyright 2010 © All Rights Reserved
Unit 1: Page 17 of 25
One Way or the Other Learning Task:
For a situation to be considered binomial, the following conditions must be satisfied.
1. Each observation/trial has one of two outcomes. These two outcomes are
referred to as “success” or “failure”.
2. There are a fixed number of observations/trials. The number of
observations/trials is referred to as n.
3. The observations/trials must be independent.
4. The probability of success, referred to as p, is the same for each
observation/trial.
Binomial Probability
When X has the binomial distribution with n observations and probability p of success on
each observation, the possible values of X are 0, 1, 2, . . ., n. The probability of X
successes in this setting is computed with the formula:
( ) 1X n Xn
P X p pr
or !
( ) 1( )! !
X n XnP X p p
n X X
1. Each of the following situations may be viewed as binomial. For each situation,
identify the event that is a success and the probability of that event.
a. Devon and Rebecca are flipping a coin to see how many times the coin lands on tails.
They have flipped the coin 60 times.
b. The quarterback for a local high school has a pass completion percentage of 59%. If
he throws 26 passes during his next game, what is the probability that he completes 20
passes?

Mathematics III Unit 6 2nd Edition
Georgia Department of Education Kathy Cox, State Superintendent of Schools
June, 2010 Copyright 2010 © All Rights Reserved
Unit 1: Page 18 of 25
c. When Mrs. James gives multiple choice questions on her tests, they always have five
answers. One of her students was absent for the entire unit, but wants to try the test since
it is all multiple choice. He decides to answer by closing his eyes and dropping his pencil
on each question. He selects the answer to which his pencil is closest. There are 15
questions on the test.
2. Based on data published by Mars, Inc. 15% of peanut M&M’s produced are green.
Suppose that 7 candies are randomly selected from a party size bag.
a. Construct the binomial distribution of green candies in this situation. After you
compute each individual probability, calculate the cumulative probabilities. The
cumulative probability for X = 1 is ( 1) ( 0) ( 1)P X P X P X .
b. Find ( 4)P X . Explain what this means.
c. Find ( 5)P X . Explain the relationship between ( 4)P X and ( 5)P X .
d. Construct the probability histogram.
e. Calculate the mean and standard deviation of green candies in this situation.
3. In the 2008-2009 regular season, LeBron James of the Cleveland Cavaliers had a
0.780 free throw success rate. Assume that his free throw percentage is still 0.780 at the
beginning of the 2009-2010 season.
a. What is the probability that he will make all of this first 30 free throw attempts?
b. What is the probability that he will make at least half of his first 28 free throw
attempts?
c. Construct the probability histogram for his first 8 free throw attempts of the season.

Mathematics III Unit 6 2nd Edition
Georgia Department of Education Kathy Cox, State Superintendent of Schools
June, 2010 Copyright 2010 © All Rights Reserved
Unit 1: Page 19 of 25
4. Five counties were selected at random from data available for the Georgia Student
Finance Commission. The percentages of graduating seniors from each county who were
eligible to receive HOPE scholarships are listed in the following table.
County Percent of Graduating Seniors
Eligible for HOPE
Meriwether 31.9%
Tattnall 21.4%
Heard 40.6%
Oconee 66.7%
Columbia 45.9%
Suppose five graduating seniors are randomly selected from each of these counties and
construct the associated binomial distribution histogram for each county. In this case,
success is HOPE eligibility and failure is HOPE ineligibility. Compare the means of
these distributions as well as the shapes of the histograms.

Mathematics III Unit 6 2nd Edition
Georgia Department of Education Kathy Cox, State Superintendent of Schools
June, 2010 Copyright 2010 © All Rights Reserved
Unit 1: Page 20 of 25
Let’s Be Normal Learning Task:
Until this task, we have focused on distributions of discrete data. We will now direct our
attention to continuous data. Where a discrete variable has a finite number of possible
values, a continuous variable can assume all values in a given interval of values.
Therefore, a continuous random variable can assume an infinite number of values.
We will focus our attention specifically on continuous random variables with
distributions that are approximately normal. Remember from Mathematics II, that
normal distributions are symmetric, bell-shaped curves that follow the Empirical Rule.
The Empirical Rule for Normal Distributions states that
68% of the data values will fall within one standard
deviation of the mean,
95% of the data values will fall within two standard
deviations of the mean, and
99.7% of the data values will fall within three standard deviations of the mean.
In Mathematics II, dotplots were used to explore this type of distribution and you spent
time determining whether or not a given distribution was approximately normal. In this
task, we will use probability histograms and approximate these histograms to a smooth
curve that displays the shape of the distribution without the lumpiness of the histogram.
We will also assume that all of the data we use is approximately normally distributed.
1. This is an example of a probability histogram of a continuous random variable with an
approximate mean of 5 and standard deviation of 1. A normal curve with the same mean
and standard deviation has been overlaid on the histogram.

Mathematics III Unit 6 2nd Edition
Georgia Department of Education Kathy Cox, State Superintendent of Schools
June, 2010 Copyright 2010 © All Rights Reserved
Unit 1: Page 21 of 25
a. What do you notice about this two graphs?
2. First, you must realize that normally distributed data may have any value for its mean
and standard deviation. Below are two graphs with three sets of normal curves.
a. In the first set, all three curves have the same mean, 10, but different standard
deviations. Approximate the standard deviation of each of the three curves.

Mathematics III Unit 6 2nd Edition
Georgia Department of Education Kathy Cox, State Superintendent of Schools
June, 2010 Copyright 2010 © All Rights Reserved
Unit 1: Page 22 of 25
b. In this set, each curve has the same standard deviation. Determine the standard
deviation and then each mean.
c. Based on these two examples, make a conjecture regarding the effect changing the
mean has on a normal distribution. Make a conjecture regarding the effect changing the
standard deviation has on a normal distribution.
The Standard Normal Distribution is a normal distribution with a mean of 0 and a
standard deviation of 1. To more easily compute the probability of a particular
observation given a normally distributed variable, we can transform any normal
distribution to this standard normal distribution using the following formula:
Xz
When you find this value for a given value, it is referred to as the z-score. The z-score is
a standard score for a data value that indicates the number of standard deviations that the
data value is away from its respective mean.
3. Use the formula and definition for z-score to calculate the z-score for the mean of a
variable.

Mathematics III Unit 6 2nd Edition
Georgia Department of Education Kathy Cox, State Superintendent of Schools
June, 2010 Copyright 2010 © All Rights Reserved
Unit 1: Page 23 of 25
4. Looking at the standard normal curve below, you see that half of the area of the curve
lies below the mean of the distribution, therefore ( ) 0.5P X . Another way to
express this probability is ( 0) 0.5P z .
Now let’s say that you want to know the probability of an observation falling below 15
for a variable that is normally distributed with a mean of 15 and standard deviation of 3.
5. We can use the z-score to find the probability of many other events. Let’s explore
those now.
a. Suppose that the mean time a typical American teenager spends doing homework each
week is 4.2 hours. Assume the standard deviation is 0.9 hour. Assuming the variable is
normally distributed, find the percentage of American teenagers who spend less than 3.5
hours doing homework each week.
First, find the z-score for X = 3.5. Now, use the method you teacher has shown you to
determine the probability of P(X < 3.5). Sketch a normal curve for this situation and
shade the probability you have just found on the curve.
Mathematics III Unit 6 2nd Edition
Georgia Department of Education Kathy Cox, State Superintendent of Schools
June, 2010 Copyright 2010 © All Rights Reserved
Unit 1: Page 24 of 25
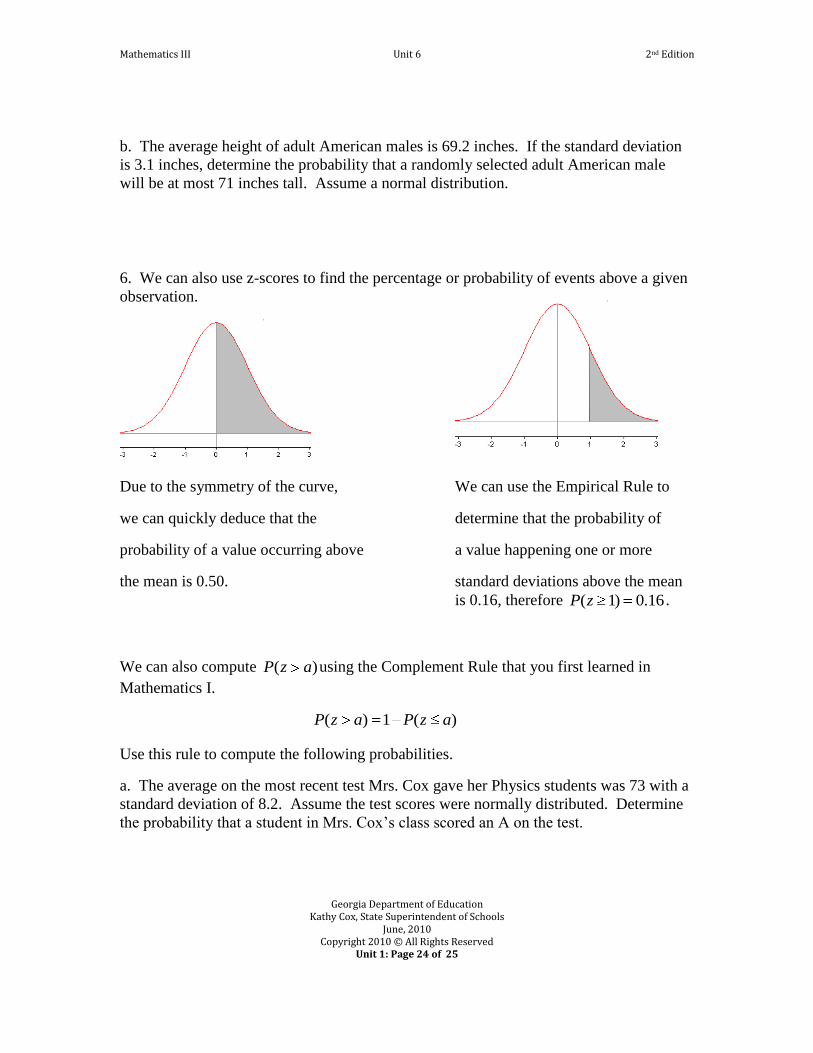
b. The average height of adult American males is 69.2 inches. If the standard deviation
is 3.1 inches, determine the probability that a randomly selected adult American male
will be at most 71 inches tall. Assume a normal distribution.
6. We can also use z-scores to find the percentage or probability of events above a given
observation.
Due to the symmetry of the curve, We can use the Empirical Rule to
we can quickly deduce that the determine that the probability of
probability of a value occurring above a value happening one or more
the mean is 0.50. standard deviations above the mean
is 0.16, therefore ( 1) 0.16P z .
We can also compute ( )P z a using the Complement Rule that you first learned in
Mathematics I.
( ) 1 ( )P z a P z a
Use this rule to compute the following probabilities.
a. The average on the most recent test Mrs. Cox gave her Physics students was 73 with a
standard deviation of 8.2. Assume the test scores were normally distributed. Determine
the probability that a student in Mrs. Cox’s class scored an A on the test.

Mathematics III Unit 6 2nd Edition
Georgia Department of Education Kathy Cox, State Superintendent of Schools
June, 2010 Copyright 2010 © All Rights Reserved
Unit 1: Page 25 of 25
b. Women’s heights are approximately normally distributed with = 65.5 inches and
= 2.5 inches. Determine the probability of a randomly selected woman having a height of
at least 64 inches.
7. We can also determine the probability between two values of a random variable.
( 2 1) ( 1) ( 2)P z P z P z ( 1.5 0.75) ___________P z
a. According to the College Board, Georgia seniors graduating in 2008 had a mean Math
SAT score of 493 with a standard deviation of 108. Assuming the distribution of these
scores is normal, find the probability of a member of the 2008 graduating class in
Georgia scoring between 500 and 800 on the Math portion of the SAT Reasoning Test.
b. According the same College Board report, the population of American 2008 high
school graduates had a mean Math SAT score of 515 with = 116. What is the
probability that of a randomly selected senior from this population scoring between 500
and 800 on the Math portion of the SAT Reasoning Test.
c. Compare the probabilities from parts a and b. Explain the differences in the two
probabilities.


