Unit 4: Interactions Among Living Things (Populations)...
16
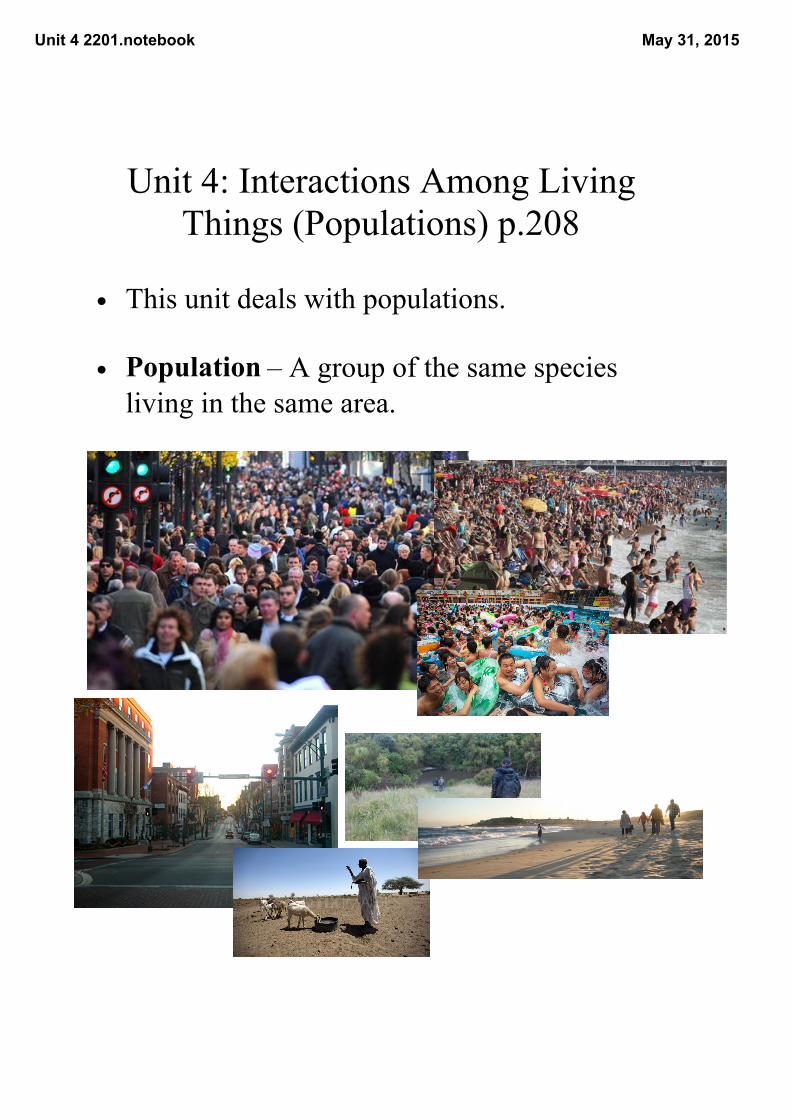
Unit 4 2201.notebook May 31, 2015 Unit 4: Interactions Among Living Things (Populations) p.208 • This unit deals with populations. • Population – A group of the same species living in the same area.
Transcript of Unit 4: Interactions Among Living Things (Populations)...
Unit 4 2201.notebook May 31, 2015
Unit 4: Interactions Among Living Things (Populations) p.208
• This unit deals with populations.
• Population – A group of the same species living in the same area.
Unit 4 2201.notebook May 31, 2015
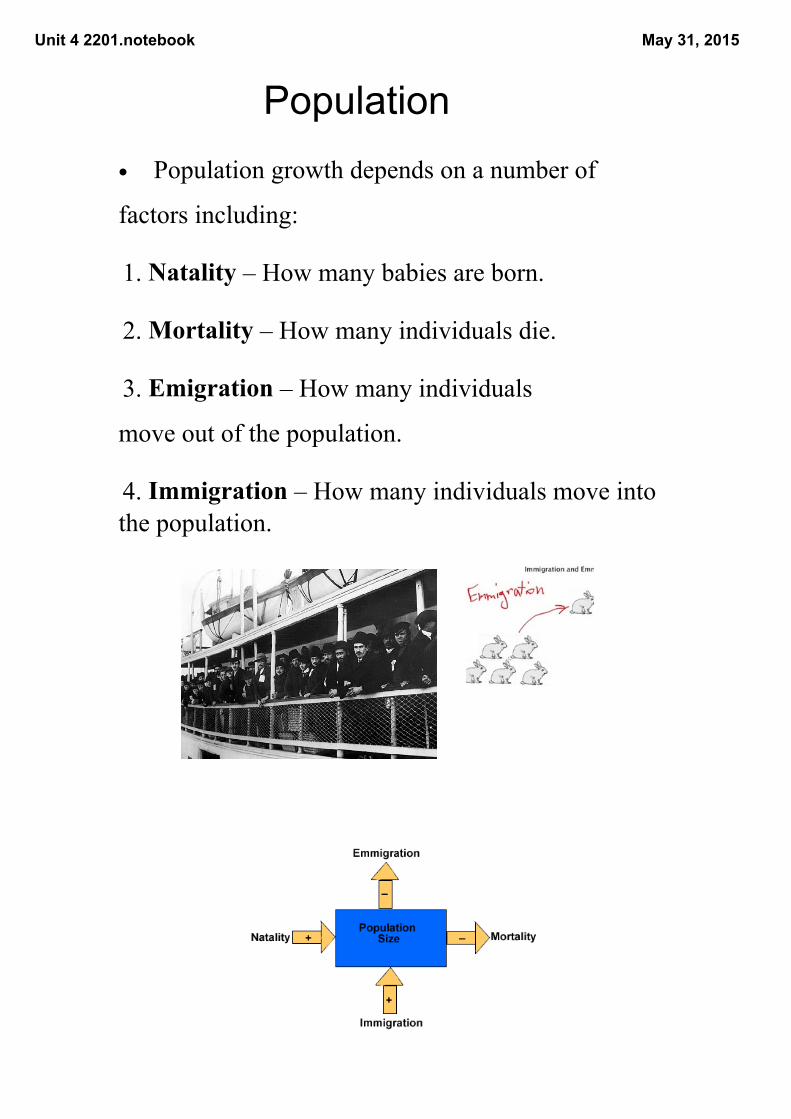
• Population growth depends on a number of
factors including:
1. Natality – How many babies are born.
2. Mortality – How many individuals die.
3. Emigration – How many individuals
move out of the population.
4. Immigration – How many individuals move into the population.
Population
Unit 4 2201.notebook May 31, 2015
Populations
• Different populations of the same species can be different sizes.
• Limiting factors The things that determine how big a population can possibly get.
List some limiting factors for a population of mice in Nain.
What different limiting factors are there for humans?
Unit 4 2201.notebook May 31, 2015
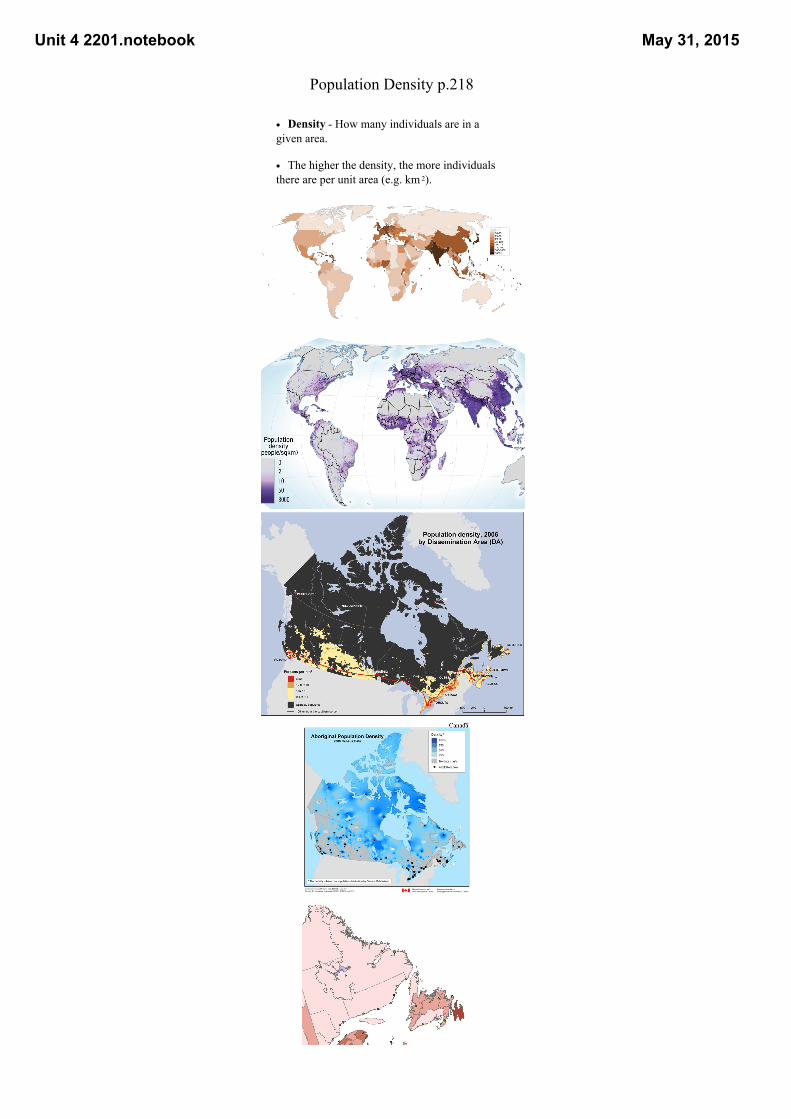
Population Density p.218
• Density How many individuals are in a given area.
• The higher the density, the more individuals there are per unit area (e.g. km 2).
Unit 4 2201.notebook May 31, 2015
• Density dependent factors – These limiting
factors that have a greater impact when the
population density increases (e.g. disease).
competition, predator/prey cycles, symbiotic relationships
• Density independent factors – These
limiting factors have about the same impact
regardless how dense the population is (e.g.
weather).
Population Density p.218
List some density dependent and density independent factors for mice in Nain.
Unit 4 2201.notebook May 31, 2015
The Predator – Prey Cycle
• Prey – Something an animal eats.
• Predator – An animal that eats something. Generally it refers to animals that eat animals.
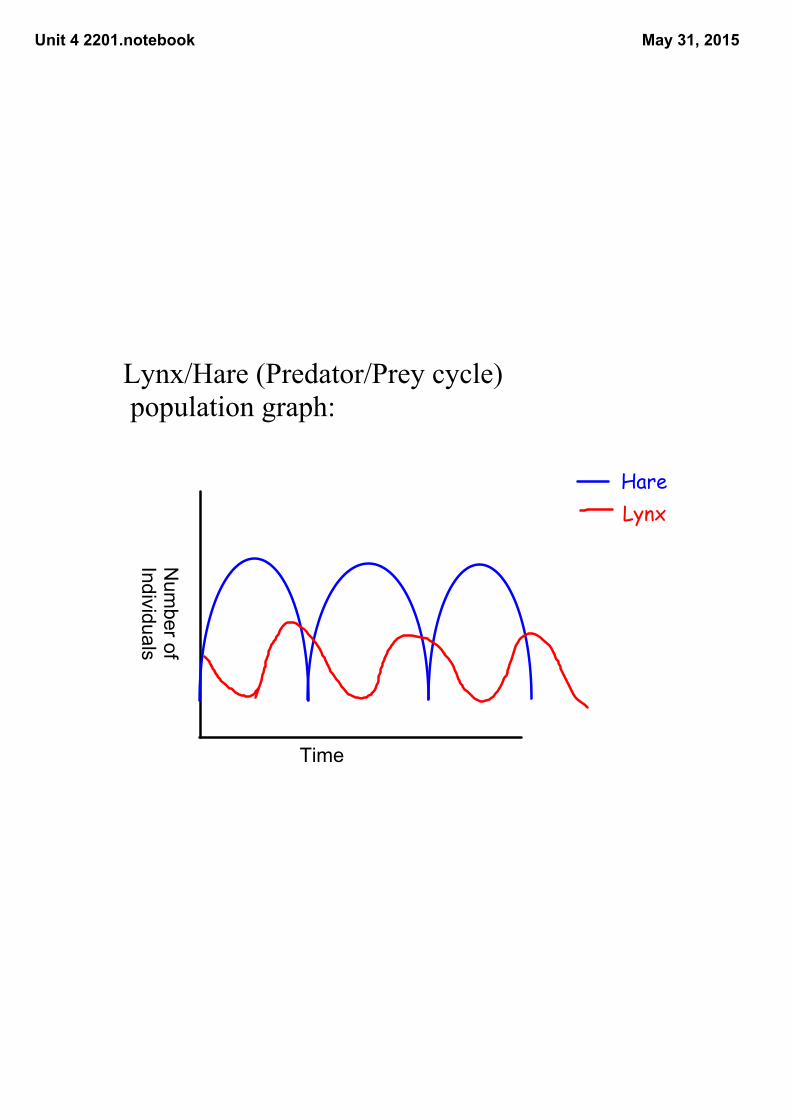
• The population size of a prey species is closely linked with the size of the predator population and vise versa.
• What happens to the population of a prey species if the predator population increases?
• What happens to the population of a prey species if the predator population decreases?
Unit 4 2201.notebook May 31, 2015
Lynx/Hare (Predator/Prey cycle) population graph:
Time
Num
ber of Individuals
HareLynx
Unit 4 2201.notebook May 31, 2015
• Carrying Capacity – The maximum number of a particular organism that can live in an area.E.g. The carrying capacity of squirrels in Nain is
25.
• Limiting factors – Things which help determine the size of a carrying capacity.E.g. the number of squirrels would be higher if
there were more trees, fewer foxes, etc.
Carrying Capacity
Unit 4 2201.notebook May 31, 2015
Carrying Capacity
• In addition to density dependent and density independent, limiting factors can be divided into two other groups:
• Physical – Nonliving things. E.g. size of habitat; amount of water; temperature.
• Biological – Living things. E.g. amount of food; number of predators; number of competitors.
Unit 4 2201.notebook May 31, 2015
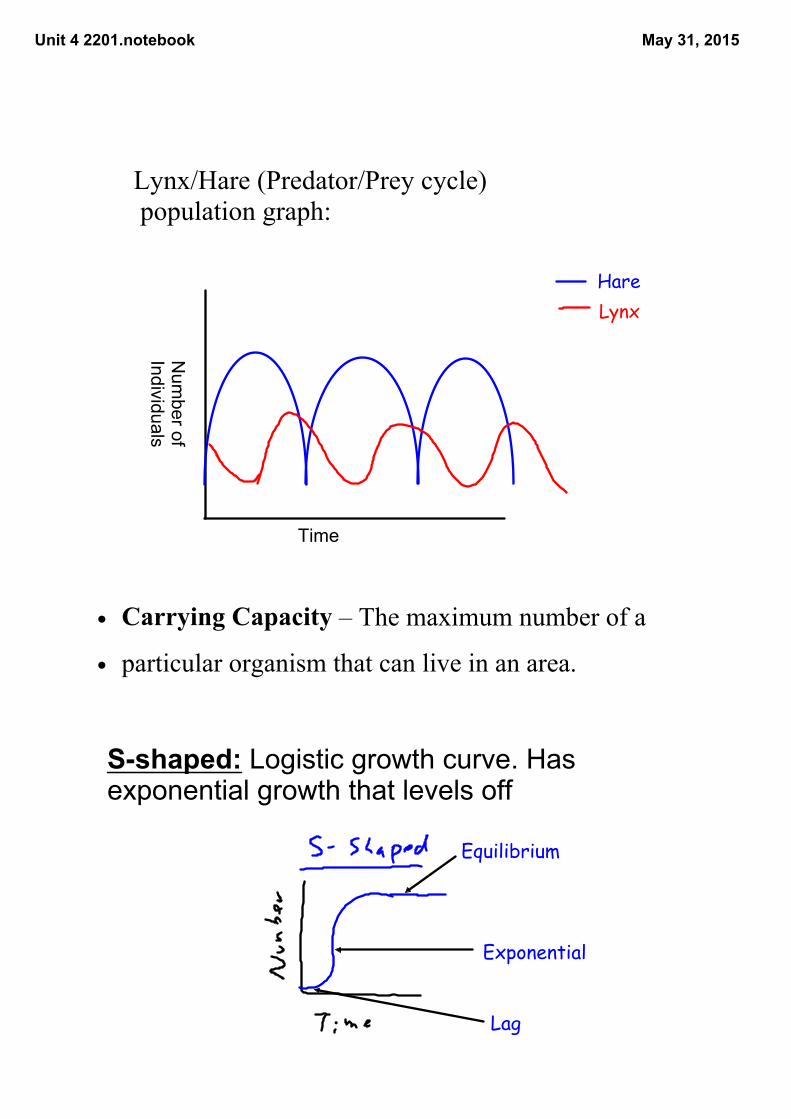
Lynx/Hare (Predator/Prey cycle) population graph:
Time
Num
ber of Individuals
HareLynx
• Carrying Capacity – The maximum number of a
• particular organism that can live in an area.
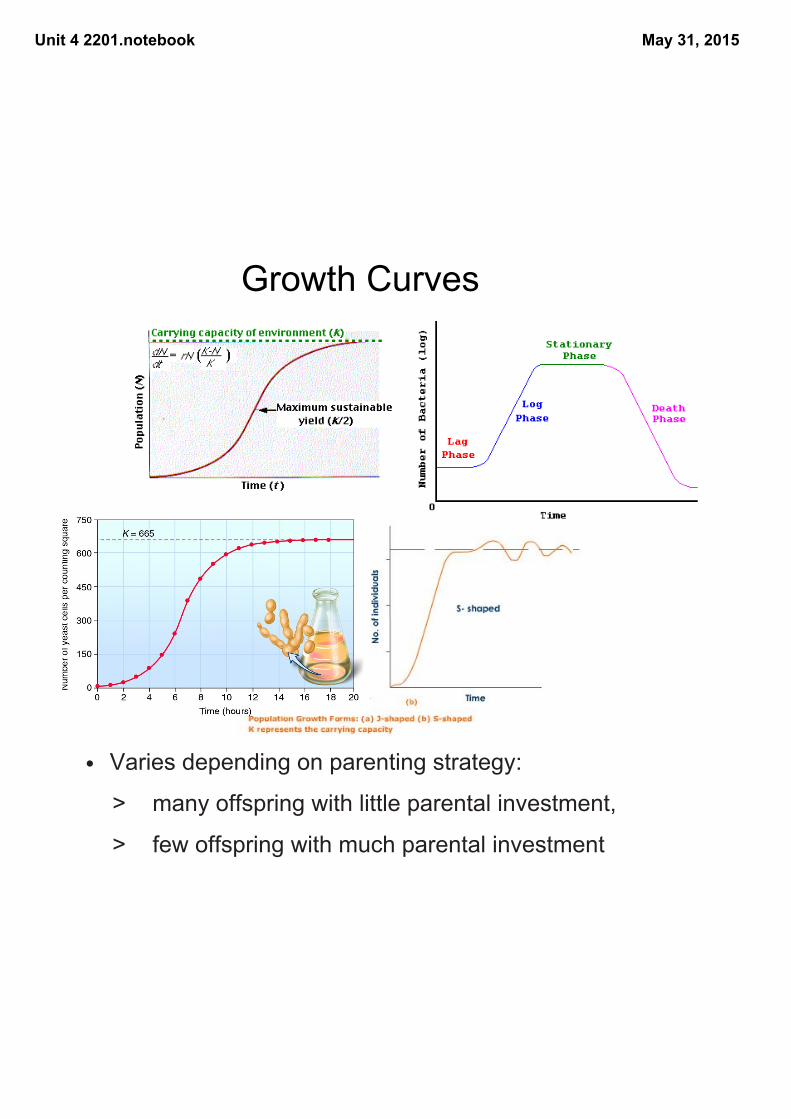
Sshaped: Logistic growth curve. Has exponential growth that levels off
Lag
Exponential
Equilibrium
Unit 4 2201.notebook May 31, 2015
Growth Curves
• Varies depending on parenting strategy:
> many offspring with little parental investment,
> few offspring with much parental investment

Unit 4 2201.notebook May 31, 2015
Growth Curves
Lag: Slow growth
Exponential: quick rapid growth
Equilibrium: Population remains stable

Unit 4 2201.notebook May 31, 2015
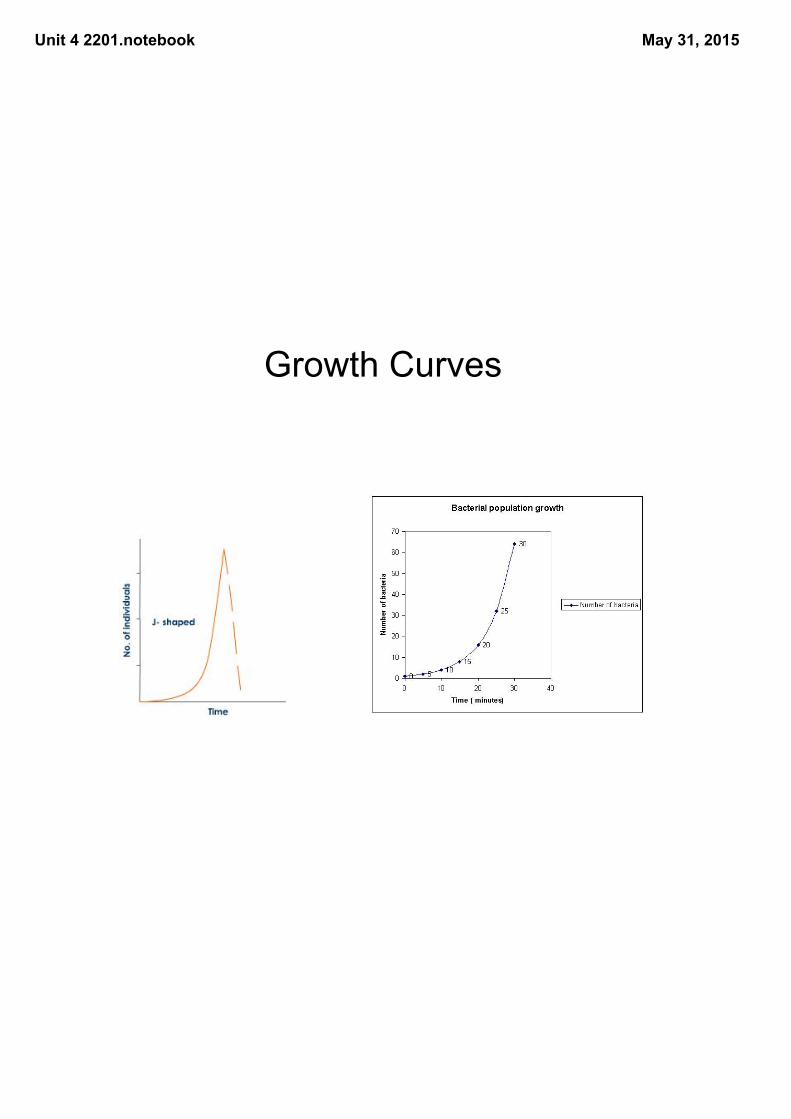
Jshaped: Exponential growth curve. Lagging start that increases exponentially
Growth Curves
Lag
Exponential growth
* does not ever reach equilibrium*does not usually exist in reallife (in a lab)
Unit 4 2201.notebook May 31, 2015
Growth Curves
Unit 4 2201.notebook May 31, 2015
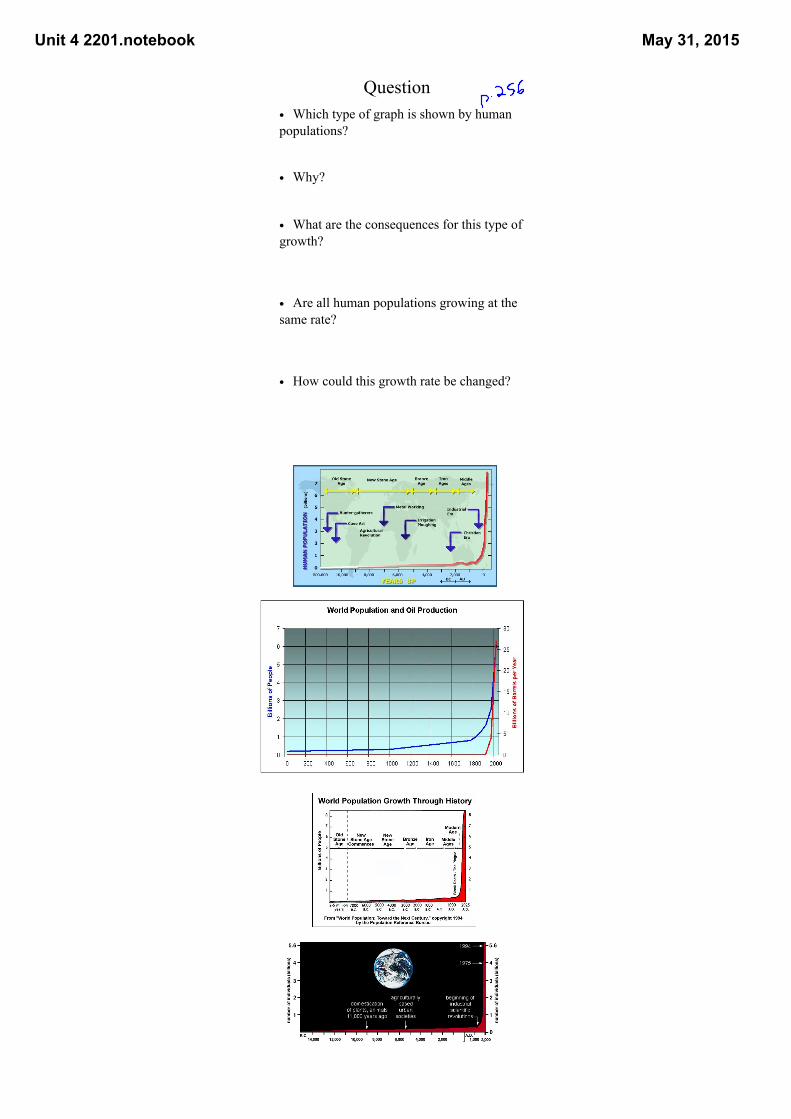
Question• Which type of graph is shown by human populations?
• Why?
• What are the consequences for this type of growth?
• Are all human populations growing at the same rate?
• How could this growth rate be changed?
Unit 4 2201.notebook May 31, 2015
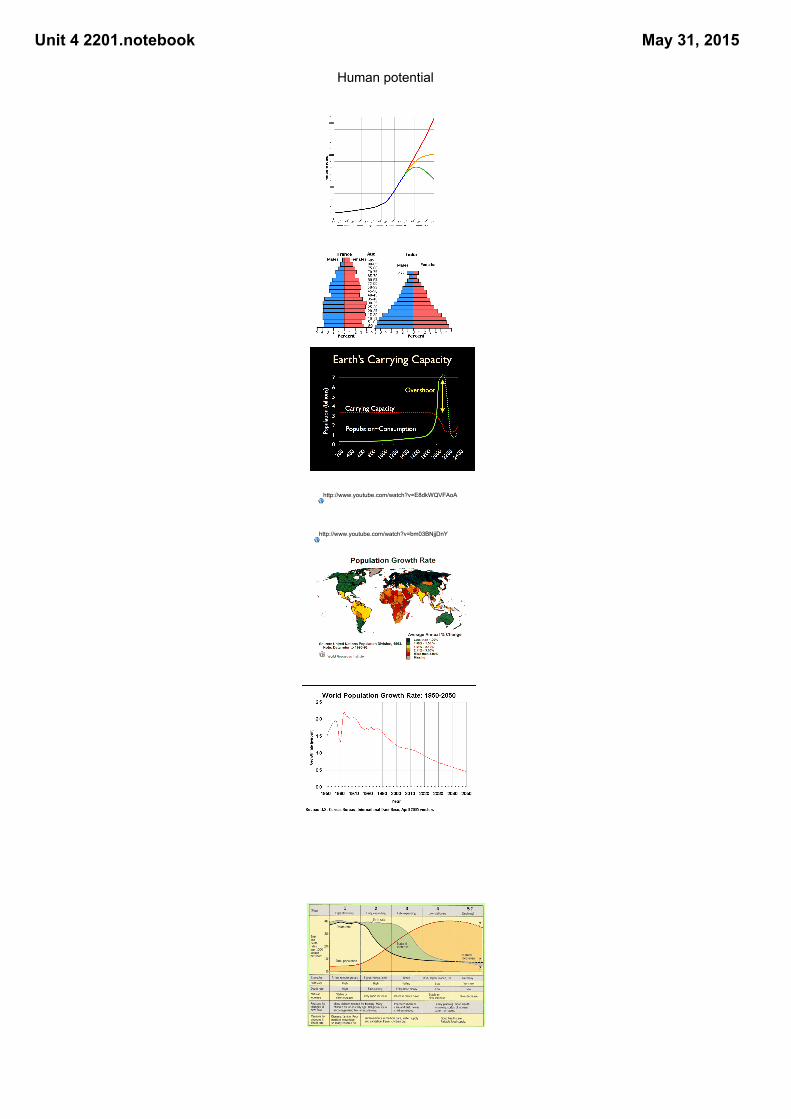
Human potential
http://www.youtube.com/watch?v=E8dkWQVFAoA
http://www.youtube.com/watch?v=bm03BNjjDnY