Myers’ Psychology for AP*. Unit 2: Research Methods: Thinking Critically with Psychological Science.

UNIT 3 RESEARCH UNIT 3 RESEARCH METHODSMETHODS

Research MethodsResearch Methods Are the tools or techniques psychologists Are the tools or techniques psychologists
use to obtain accurate and reliable use to obtain accurate and reliable information about thoughts, feelings and information about thoughts, feelings and behaviour.behaviour.
Our focus is on experimental methods Our focus is on experimental methods and correlational studiesand correlational studies

PsychologyPsychology
Psychology is a study that uses scientific Psychology is a study that uses scientific method to observe, describe predict and method to observe, describe predict and explain behaviour.explain behaviour.

OPERATIONAL HYPOTHESISOPERATIONAL HYPOTHESIS Researcher poses a question based on previous findings and theoriesResearcher poses a question based on previous findings and theories
↓↓RESEARCH IS DESIGNEDRESEARCH IS DESIGNED
The experiment is designed: participants are selected, the dependent and The experiment is designed: participants are selected, the dependent and independent variables are defined and the experimental and control groups are independent variables are defined and the experimental and control groups are
establishedestablished↓↓
ETHICAL CONSIDERATIONSETHICAL CONSIDERATIONS An ethics committee approves the experimentAn ethics committee approves the experiment
↓↓COLLECTION OF DATACOLLECTION OF DATA
The experiment is conducted and data is collected, organised and summarised in a The experiment is conducted and data is collected, organised and summarised in a meaningful waymeaningful way
↓↓INTERPRETATION OF DATA BY STATISTICAL ANALYSISINTERPRETATION OF DATA BY STATISTICAL ANALYSIS
The data is analysed to make inferences about what it means. This can be done in The data is analysed to make inferences about what it means. This can be done in two stagestwo stages
Descriptive StatisticsDescriptive Statistics – describe and summarise the data, does not allow for – describe and summarise the data, does not allow for conclusions to be drawnconclusions to be drawn
Inferential StatisticsInferential Statistics – mathematical procedures used to determine if the difference – mathematical procedures used to determine if the difference between the experimental and control groups represent a ‘true’ different – if the IVs between the experimental and control groups represent a ‘true’ different – if the IVs is having an effect on the DV. This also allows researchers to use the results from is having an effect on the DV. This also allows researchers to use the results from
their sample to be their sample to be generalisedgeneralised to the population as a whole. to the population as a whole.↓↓
REPORTING THE FINDINGS AND CONCLUSIONSREPORTING THE FINDINGS AND CONCLUSIONS Researchers punish their work so that it can be replicated by others. In VCE Researchers punish their work so that it can be replicated by others. In VCE
psychology, you will write your research as an psychology, you will write your research as an ERAERA. .

Key TermsKey Terms
ParticipantsParticipants – people taking part in – people taking part in experiment or correlational studyexperiment or correlational study
Sampling Sampling – process of selecting participants – process of selecting participants for researchfor research
Sample Sample – group which is a subset or portion of – group which is a subset or portion of larger group chosen to be studied for research larger group chosen to be studied for research purposes (It should mirror or be representative purposes (It should mirror or be representative of the entire population of interest)of the entire population of interest)
Population Population – the larger group from which a – the larger group from which a sample is drawnsample is drawn

Two methods psychologists use Two methods psychologists use to select a sampleto select a sample::
Random SamplingRandom Sampling – sampling procedure which ensures – sampling procedure which ensures that every member of the population of research that every member of the population of research interest has an equal chance of being selected as a interest has an equal chance of being selected as a participant for the study.participant for the study.
HowHow? – putting everyone’s name on a slip of paper, ? – putting everyone’s name on a slip of paper, putting them into a container, mixing them thoroughly putting them into a container, mixing them thoroughly and choosing slips blindly, assigning each member of and choosing slips blindly, assigning each member of the population a number and randomly choosing the population a number and randomly choosing numbersnumbers
WhyWhy? – Increases the likelihood that the sample is ? – Increases the likelihood that the sample is representative of the target population, therefore representative of the target population, therefore increases ability to make valid inferences about the increases ability to make valid inferences about the population.population.

Two methods psychologists Two methods psychologists use to select a sample:use to select a sample:
Stratified Sampling – Stratified Sampling – sampling procedure involving sampling procedure involving dividing the population to be sampled into distinct dividing the population to be sampled into distinct groups, or strata, then selecting a separate sample groups, or strata, then selecting a separate sample from each stratum, usually in the same proportions as from each stratum, usually in the same proportions as they occur in the target populationthey occur in the target population
Income, age, sex, religion, ethnic background, Income, age, sex, religion, ethnic background, residential area, IQ score are examples of residential area, IQ score are examples of characteristics which may be used as the bases of characteristics which may be used as the bases of dividing a population into strata.dividing a population into strata.
How? – How? – Obtain accurate lists of all people within each Obtain accurate lists of all people within each stratum, random samples of each proportionate size stratum, random samples of each proportionate size are drawn from within each stratum.are drawn from within each stratum.
Why?Why? – Eliminates bias and ensures that groups in a – Eliminates bias and ensures that groups in a population of interest are represented in the sample in population of interest are represented in the sample in thethe same proportion that they are represented in the populationsame proportion that they are represented in the population

Forms of Non Random Forms of Non Random SamplingSampling
Although random sampling offers the best Although random sampling offers the best assurance that samples drawn from a assurance that samples drawn from a population will be representative, in reality, a population will be representative, in reality, a considerable amount of research is undertaken considerable amount of research is undertaken using non-random sampling procedures.using non-random sampling procedures.
Non-random sampling techniques may be used Non-random sampling techniques may be used when a research requires a sample group that when a research requires a sample group that possess a particular characteristic who would possess a particular characteristic who would be difficult to locate with random sampling. be difficult to locate with random sampling. Another reason could be because of the Another reason could be because of the complexity or opportunity sampling and complexity or opportunity sampling and snowball sampling.snowball sampling.

Forms of Non Random Forms of Non Random SamplingSampling
Convenience SamplingConvenience Sampling In convenience sampling, participants are obtained at In convenience sampling, participants are obtained at
the researcher’s convenience (meaning the researcher the researcher’s convenience (meaning the researcher uses anyone they can get hold of who is willing to uses anyone they can get hold of who is willing to participate in the study).participate in the study).
For example, a good deal of research conducted in For example, a good deal of research conducted in universities has used convenience samples of universities has used convenience samples of university students as their participants.university students as their participants.
Although this type of sample is relatively easy to Although this type of sample is relatively easy to obtain, there are obvious disadvantages to its design. obtain, there are obvious disadvantages to its design. These include how realistic that particular sample These include how realistic that particular sample group is of the broader population and therefore group is of the broader population and therefore whether the results can be accurately generalised whether the results can be accurately generalised beyond the sample itself.beyond the sample itself.

Forms of Non Random Forms of Non Random SamplingSampling
Snowball SamplingSnowball Sampling Snowball sampling is often employed in research with special groups of Snowball sampling is often employed in research with special groups of
participants who have specific characteristics of interest to the researcher.participants who have specific characteristics of interest to the researcher. For example, a sports psychologist may be interested in studying the For example, a sports psychologist may be interested in studying the
athletic attitudes and performance of children who have a parent who is a athletic attitudes and performance of children who have a parent who is a champion athlete. It would be very difficult to obtain a sizeable sample of champion athlete. It would be very difficult to obtain a sizeable sample of children in this category by a process of random sampling of a population. children in this category by a process of random sampling of a population. Using snowball sampling, the researcher would first identify one or two Using snowball sampling, the researcher would first identify one or two children (or perhaps their parents) who are members of athletic families to children (or perhaps their parents) who are members of athletic families to participate. These participants would then be asked to bring along people participate. These participants would then be asked to bring along people they know, who are similar to themselves, into the study. These new they know, who are similar to themselves, into the study. These new people are then asked to contact others they know and so on.people are then asked to contact others they know and so on.
‘‘Snowballing’ can often be a very efficient way to develop a special Snowballing’ can often be a very efficient way to develop a special sample of people with similar characteristics.sample of people with similar characteristics.
However, just as in Convenience sampling, it is always difficult to estimate However, just as in Convenience sampling, it is always difficult to estimate how accurately these findings would apply to the broader population (but how accurately these findings would apply to the broader population (but often, the researcher’s interest is mainly in the results obtained for the often, the researcher’s interest is mainly in the results obtained for the sample itself.sample itself.

Subject and Subject and Experimenter Experimenter ExpectationsExpectations Placebo effect: a response is influenced by a person’s Placebo effect: a response is influenced by a person’s
expectations of what to do or how to think or feel, rather than the expectations of what to do or how to think or feel, rather than the specific procedure which is used to produce that response.specific procedure which is used to produce that response.
Single-blind study: subjects are not aware of which condition of Single-blind study: subjects are not aware of which condition of the experiment they have been assigned to.the experiment they have been assigned to.
Double-blind study: neither the subjects nor experimenter are Double-blind study: neither the subjects nor experimenter are aware of the conditions to which the subjects have been assigned.aware of the conditions to which the subjects have been assigned.
Experimenter effect: experimenter’s personal characteristics, Experimenter effect: experimenter’s personal characteristics, actions or treatment of the data affect the DV and therefore the actions or treatment of the data affect the DV and therefore the results of the experiment.results of the experiment.
Self-fulfilling prophecy: tendency of subjects to behave in Self-fulfilling prophecy: tendency of subjects to behave in accordance with how they believe an experimenter expects them accordance with how they believe an experimenter expects them to behave/to behave/
Hawthorne effect: subjects are aware that they are members of Hawthorne effect: subjects are aware that they are members of an experimental group and their performance may improve simply an experimental group and their performance may improve simply because of that fact, rather than because of the IV to which they because of that fact, rather than because of the IV to which they are exposed.are exposed.
Experimenter bias: unintentional biases in the collection and Experimenter bias: unintentional biases in the collection and treatment of data by the experimenter.treatment of data by the experimenter.

Formulating an Formulating an Operational HypothesisOperational Hypothesis
An operational hypothesis: is a tentative and testable An operational hypothesis: is a tentative and testable prediction or explanation of the relationship between two or prediction or explanation of the relationship between two or more events or characteristics.more events or characteristics.
An operational hypothesis states how the variables (IV and An operational hypothesis states how the variables (IV and DV) will be observed, manipulated and measured and the DV) will be observed, manipulated and measured and the population from which the sample will be drawn.population from which the sample will be drawn.
An operational hypothesis must:An operational hypothesis must: Begin with ‘That…’Begin with ‘That…’ Mention the sample being studiedMention the sample being studied Mention the IV and DV involvedMention the IV and DV involved Mention how the variables will be measuredMention how the variables will be measured

Example OneExample One
General hypothesis:General hypothesis: That drinking coffee negatively affects sleepThat drinking coffee negatively affects sleep Operationally defining each variable:Operationally defining each variable: IV: drinking coffee = IV: drinking coffee = having two cups of coffee one hour prior to having two cups of coffee one hour prior to
going to bedgoing to bed DV: sleep = DV: sleep = length of undisturbed sleep (hours)length of undisturbed sleep (hours) Formulated Operational Hypothesis:Formulated Operational Hypothesis: That drinking two cups of coffee prior to going to bed will reduce That drinking two cups of coffee prior to going to bed will reduce
the length (hours) of undisturbed sleepthe length (hours) of undisturbed sleep Now just need to add sample:Now just need to add sample: That drinking two cups of coffee prior to going to bed will reduce That drinking two cups of coffee prior to going to bed will reduce
the length (hours) of undisturbed sleep in 15 females aged 20 – the length (hours) of undisturbed sleep in 15 females aged 20 – 22.22.

Example TwoExample Two General hypothesis:General hypothesis: That the number of classes you attend will That the number of classes you attend will
affect your gradeaffect your grade Operationally defining each variable:Operationally defining each variable: IV: number of classes attended = IV: number of classes attended = attendance at 90% of attendance at 90% of
classesclasses DV: grades = performance on end of course examDV: grades = performance on end of course exam Formulated Operational Hypothesis:Formulated Operational Hypothesis: That students attending more that 90% of classes will attain That students attending more that 90% of classes will attain
a higher score on the end of year exam than students a higher score on the end of year exam than students attending less than 90% of classesattending less than 90% of classes
Now just need to add sample:Now just need to add sample: That 20 male students aged 14 – 15 attending more than That 20 male students aged 14 – 15 attending more than
90% of classes will attain a higher score on the end of year 90% of classes will attain a higher score on the end of year exam than students attending less than 90% of classes.exam than students attending less than 90% of classes.

Example ThreeExample Three General hypothesis:General hypothesis: That alcohol intake will impair driving That alcohol intake will impair driving
performanceperformance Operationally defining each variable:Operationally defining each variable: IV: alcohol intake = IV: alcohol intake = 0.05 blood alcohol level0.05 blood alcohol level DV: driving performance = performance number of cones hit DV: driving performance = performance number of cones hit
on obstacle course.on obstacle course. Formulated Operational Hypothesis:Formulated Operational Hypothesis: That drivers with a blood alcohol intake of 0.05 will hit more That drivers with a blood alcohol intake of 0.05 will hit more
cones in the driving obstacle course than drivers with a cones in the driving obstacle course than drivers with a blood alcohol intake of 0.blood alcohol intake of 0.
Now just need to add sample:Now just need to add sample: That 20 male and 20 female drivers aged 30 - 32 with a That 20 male and 20 female drivers aged 30 - 32 with a
blood alcohol intake of 0.05 will hit more cones in the driving blood alcohol intake of 0.05 will hit more cones in the driving obstacle course than drivers with a blood alcohol intake of 0.obstacle course than drivers with a blood alcohol intake of 0.
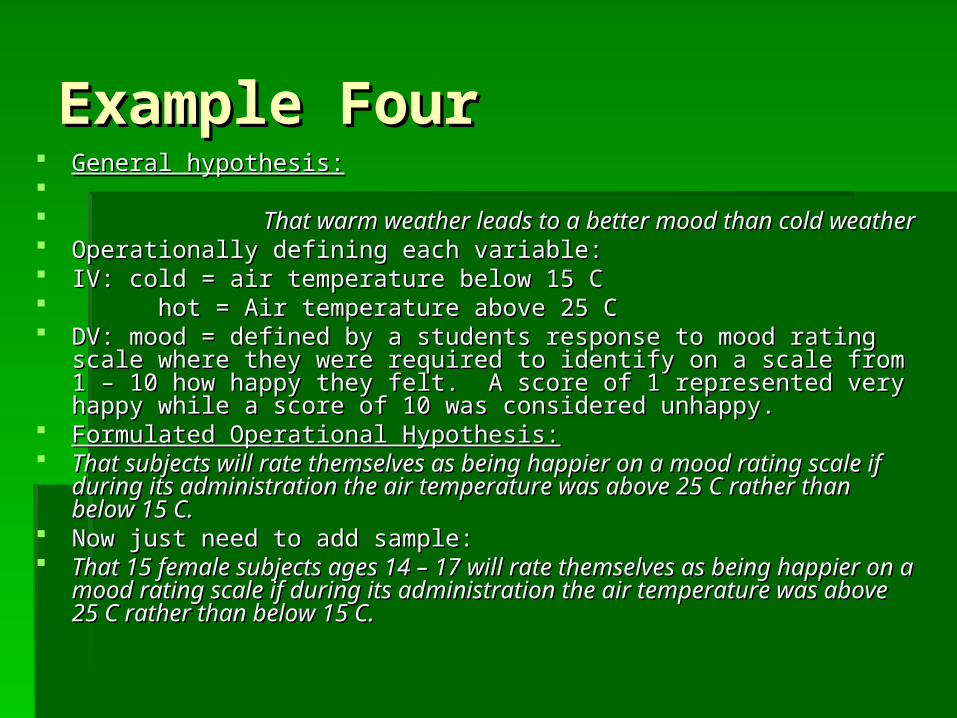
Example FourExample Four General hypothesis:General hypothesis: That warm weather leads to a better mood than cold weatherThat warm weather leads to a better mood than cold weather Operationally defining each variable:Operationally defining each variable: IV: cold = air temperature below 15 CIV: cold = air temperature below 15 C hot = Air temperature above 25 Chot = Air temperature above 25 C DV: mood = defined by a students response to mood rating scale where they DV: mood = defined by a students response to mood rating scale where they
were required to identify on a scale from 1 – 10 how happy they felt. A score of were required to identify on a scale from 1 – 10 how happy they felt. A score of 1 represented very happy while a score of 10 was considered unhappy.1 represented very happy while a score of 10 was considered unhappy.
Formulated Operational Hypothesis:Formulated Operational Hypothesis: That subjects will rate themselves as being happier on a mood rating scale if That subjects will rate themselves as being happier on a mood rating scale if
during its administration the air temperature was above 25 C rather than below during its administration the air temperature was above 25 C rather than below 15 C.15 C.
Now just need to add sample:Now just need to add sample: That 15 female subjects ages 14 – 17 will rate themselves as being happier on That 15 female subjects ages 14 – 17 will rate themselves as being happier on
a mood rating scale if during its administration the air temperature was above a mood rating scale if during its administration the air temperature was above 25 C rather than below 15 C.25 C rather than below 15 C.

Operational HypothesisOperational Hypothesis
REMEMBER: An operational hypothesis REMEMBER: An operational hypothesis must:must:
Begin with ‘that’Begin with ‘that’ Mention the sample being studiedMention the sample being studied The IV and DV involvedThe IV and DV involved How the variables will be measuresHow the variables will be measures

VariableVariable
A variable is the name of a ‘factor’ being A variable is the name of a ‘factor’ being studied that will change (vary) over time. studied that will change (vary) over time.

INDEPENDENT VARIABLEINDEPENDENT VARIABLE
Is the variable that is manipulated by the Is the variable that is manipulated by the researcher to assess the effect(s) of the researcher to assess the effect(s) of the DV; the treatment.DV; the treatment.

DEPENDENT VARIABLEDEPENDENT VARIABLE
Is used to assess the effect(s) of the IV; the Is used to assess the effect(s) of the IV; the participants responses – what we are participants responses – what we are watching.watching.

ExampleExample
EG: The EG: The increased number of alcoholic increased number of alcoholic drinksdrinks (IV) will impact upon (IV) will impact upon driver driver performanceperformance (DV) (DV)

EXTRANEOUS VARIABLE EXTRANEOUS VARIABLE
Is any variable other than tha IV that Is any variable other than tha IV that cancan cause a change in the DV and therefore cause a change in the DV and therefore affect the results of an experiment in an affect the results of an experiment in an unwanted way; it may become a unwanted way; it may become a confounding variable.confounding variable.
EG: The weather may have an impact on EG: The weather may have an impact on the drivers ability – the experimenter the drivers ability – the experimenter cannot control the weather. cannot control the weather.

CONFOUNDING VARIABLECONFOUNDING VARIABLE
Is any variable other than the IV that is uncontrolled Is any variable other than the IV that is uncontrolled and allowed to change together with the IV, having an and allowed to change together with the IV, having an unwanted effect on the DV. When present the unwanted effect on the DV. When present the experimenter cannot determine whether changes in the experimenter cannot determine whether changes in the DV are due to solely the IV.DV are due to solely the IV.
EG: The gender of the driver may have an impact on EG: The gender of the driver may have an impact on the driver’s ability – the experimenter can control the driver’s ability – the experimenter can control gender my separating males and females into gender my separating males and females into subgroups.subgroups.

WAYS TO MINIMISE THE EFFECTS OF WAYS TO MINIMISE THE EFFECTS OF EXTRANEOUS VARIABLESEXTRANEOUS VARIABLES(Experimental Designs)(Experimental Designs)
REPEATED MEASURES DESIGNREPEATED MEASURES DESIGN Each participant is involved in both the experimental and Each participant is involved in both the experimental and
control conditions of an experiment so the effects of control conditions of an experiment so the effects of individual differences between participants’ characteristics individual differences between participants’ characteristics balance in both designs.balance in both designs.
EG. Investigating effects of loud music on performance in EG. Investigating effects of loud music on performance in problem solving task. Using the repeated measures design, problem solving task. Using the repeated measures design, the same group of participants would be given a problem the same group of participants would be given a problem solving task when loud music is playing and then without solving task when loud music is playing and then without loud music playing. Also, how well participants perform in loud music playing. Also, how well participants perform in the problem solving task is assessed twice (hence the the problem solving task is assessed twice (hence the ‘repeated measures). This design would give the ‘repeated measures). This design would give the experimenter control over participant-related extraneous experimenter control over participant-related extraneous variables that may have influenced the results, such as variables that may have influenced the results, such as differences in participants’ problem solving abilities and differences in participants’ problem solving abilities and motivation, because they are identical in both groups.motivation, because they are identical in both groups.

WAYS TO MINIMISE THE EFFECTS OF WAYS TO MINIMISE THE EFFECTS OF EXTRANEOUS VARIABLESEXTRANEOUS VARIABLES(Experimental Designs)(Experimental Designs)
Another extraneous variable that can arise using a Another extraneous variable that can arise using a repeated measures design is called the ‘Order Effect’, repeated measures design is called the ‘Order Effect’, whether a task is performed first or second. (Consider whether a task is performed first or second. (Consider benefiting from experience-enhanced performance, benefiting from experience-enhanced performance, boredom, fatigue-impaired performance etc). One way boredom, fatigue-impaired performance etc). One way to deal with this is to increase the time period between to deal with this is to increase the time period between the measurement of the dependent variable. When the measurement of the dependent variable. When this is not possible, ‘Counterbalancing’ occurs.this is not possible, ‘Counterbalancing’ occurs.
‘‘Counterbalancing’ involves arranging the order in Counterbalancing’ involves arranging the order in which the conditions of a repeated measures design which the conditions of a repeated measures design are experienced, so that each condition occurs equally are experienced, so that each condition occurs equally often in each position. For example, half the often in each position. For example, half the participants do experimental condition first, then control participants do experimental condition first, then control and the other half do the reverse order.and the other half do the reverse order.

WAYS TO MINIMISE THE EFFECTS OF WAYS TO MINIMISE THE EFFECTS OF EXTRANEOUS VARIABLESEXTRANEOUS VARIABLES(Experimental Designs)(Experimental Designs)
MATCHED PARTIICPANTS DESIGNMATCHED PARTIICPANTS DESIGNThis design involves selection of pairs of participants who This design involves selection of pairs of participants who
are very similar in characteristic(s) that can influence are very similar in characteristic(s) that can influence the dependent variable (eg. Sex, age, intelligence), the dependent variable (eg. Sex, age, intelligence), then allocating each member of the pair to different then allocating each member of the pair to different groups. Randomly allocating one member of each groups. Randomly allocating one member of each matched pair to different groups helps ensure that matched pair to different groups helps ensure that each group is fairly equivalent in terms of the spread each group is fairly equivalent in terms of the spread of participant characteristics that can cause a change of participant characteristics that can cause a change in the DV.in the DV.

WAYS TO MINIMISE THE EFFECTS OF WAYS TO MINIMISE THE EFFECTS OF EXTRANEOUS VARIABLESEXTRANEOUS VARIABLES(Experimental Designs)(Experimental Designs)
INDEPENDENT GROUPS DESIGNINDEPENDENT GROUPS DESIGN In this design, each participant is In this design, each participant is
randomly allocated to one of two randomly allocated to one of two entirely separate (‘independent’) entirely separate (‘independent’) groups. The random allocation groups. The random allocation procedure is used after the participants procedure is used after the participants have been selected for the experiment, have been selected for the experiment, but before the experiment beginsbut before the experiment begins
STATISTICAL STATISTICAL SIGNIFICANCESIGNIFICANCE
Tests of statistical significance enable researchers to Tests of statistical significance enable researchers to consider the extent to which change operated in the consider the extent to which change operated in the experiment.experiment.
The difference is statistically significant if the likelihood The difference is statistically significant if the likelihood of the difference occurring by chance is extremely low.of the difference occurring by chance is extremely low.
A true difference can be said to be due to the IV when A true difference can be said to be due to the IV when the probability that it might be due to chance is 5 or the probability that it might be due to chance is 5 or fewerfewer times in 100 repetitions of the study. times in 100 repetitions of the study.
EG – the result is significant at the 0.05 level.EG – the result is significant at the 0.05 level. Significance Level is know as the ‘p value’ (probability Significance Level is know as the ‘p value’ (probability
value)value) P≤ 0.05P≤ 0.05

CORRELATIONAL METHODCORRELATIONAL METHOD
Correlation method enables us to identify and describe Correlation method enables us to identify and describe the relationship between two variables. the relationship between two variables.
It does not indicate cause-effect relationship.It does not indicate cause-effect relationship. Correlation is often described by a number known as Correlation is often described by a number known as
the correlation coefficient. This is expressed as a the correlation coefficient. This is expressed as a decimal number which can range from +1.00 to -1.00decimal number which can range from +1.00 to -1.00
+ positive correlation+ positive correlation - negative correlation- negative correlation +1.00 high positive correlation (very strong +1.00 high positive correlation (very strong
relationship)relationship) - 1.00 high negative correlation (very strong - 1.00 high negative correlation (very strong
relationshiprelationship .00 no relationship.00 no relationship

Correlational MethodCorrelational Method
What conclusions could be drawn from What conclusions could be drawn from the following correlation coefficients?the following correlation coefficients?
Length of time spent studying for exams Length of time spent studying for exams and exam grades (+0.72)and exam grades (+0.72)
Distance from goal and goal shooting Distance from goal and goal shooting accuracy (-0.92)accuracy (-0.92)
Colour of socks worn in an exam and Colour of socks worn in an exam and grade achieved (+0.06)grade achieved (+0.06)