Chapter Consumer Choice and Demand 10traynham/ch10lecture.pdf · 10.2 MARGINAL UTILITY THEORY
Upload
hasad-mckeeCategory
view
33download
0description

Unit 2: Supply, Demand, and Consumer Choice
Do you see the cow?
1

Review1. Explain the Law of Demand2. Explain the Law of Supply3. Identify the 5 shifters of demand4. Identify the 6 shifters of supply 5. Define Subsidy6. Explain why price DOESN’T shift the
curve7. Define Equilibrium 8. Define Shortage9. Define Surplus10.Identify 10 stores in the mall
2

Putting Supply and Demand Together!!!
3

Qo
$5
4
3
2
1
PDemand Schedule
10 20 30 40 50 60 70 80
4
P Qd
$5 10
$4 20
$3 30
$2 50
$1 80
D
SSupply
Schedule
P Qs
$5 50
$4 40
$3 30
$2 20
$1 10
Supply and Demand are put together to determine equilibrium price and equilibrium quantity

Qo
$5
4
3
2
1
PDemand Schedule
10 20 30 40 50 60 70 80
5
P Qd
$5 10
$4 20
$3 30
$2 50
$1 80
Supply Schedule
P Qs
$5 50
$4 40
$3 30
$2 20
$1 10
Supply and Demand are put together to determine equilibrium price and equilibrium quantity
Equilibrium Price = $3 (Qd=Qs)
Equilibrium Quantity is 30
D
S

Qo
$5
4
3
2
1
PDemand Schedule
10 20 30 40 50 60 70 80
6
P Qd
$5 10
$4 20
$3 30
$2 50
$1 80
Supply Schedule
P Qs
$5 50
$4 40
$3 30
$2 20
$1 10
Supply and Demand are put together to determine equilibrium price and equilibrium quantity
D
S
What if the price
increases to $4?

Qo
$5
4
3
2
1
PDemand Schedule
10 20 30 40 50 60 70 80
7
P Qd
$5 10
$4 20
$3 30
$2 50
$1 80
Supply Schedule
P Qs
$5 50
$4 40
$3 30
$2 20
$1 10
D
S
At $4, there is disequilibrium. The quantity demanded is less than quantity supplied.
Surplus (Qd<Qs)
How much is the surplus at $4?
Answer: 20

Qo
$5
4
3
2
1
PDemand Schedule
10 20 30 40 50 60 70 80
8
P Qd
$5 10
$4 20
$3 30
$2 50
$1 80
Supply Schedule
P Qs
$5 50
$4 40
$3 30
$2 20
$1 10
D
S
How much is the surplus if the price is $5?
Answer: 40What if the price
decreases to $2?

Qo
$5
4
3
2
1
PDemand Schedule
10 20 30 40 50 60 70 80
9
P Qd
$5 10
$4 20
$3 30
$2 50
$1 80
Supply Schedule
P Qs
$5 50
$4 40
$3 30
$2 20
$1 10
D
S
At $2, there is disequilibrium. The quantity demanded is greater than quantity supplied.
Shortage(Qd>Qs)
How much is the shortage at $2?
Answer: 30

Qo
$5
4
3
2
1
PDemand Schedule
10 20 30 40 50 60 70 80
10
P Qd
$5 10
$4 20
$3 30
$2 50
$1 80
Supply Schedule
P Qs
$5 50
$4 40
$3 30
$2 20
$1 10
D
S
Answer: 70
How much is the shortage if the price is $1?
Qo
$5
4
3
2
1
PDemand Schedule
10 20 30 40 50 60 70 80
11
P Qd
$5 10
$4 20
$3 30
$2 50
$1 80
Supply Schedule
P Qs
$5 50
$4 40
$3 30
$2 20
$1 10
D
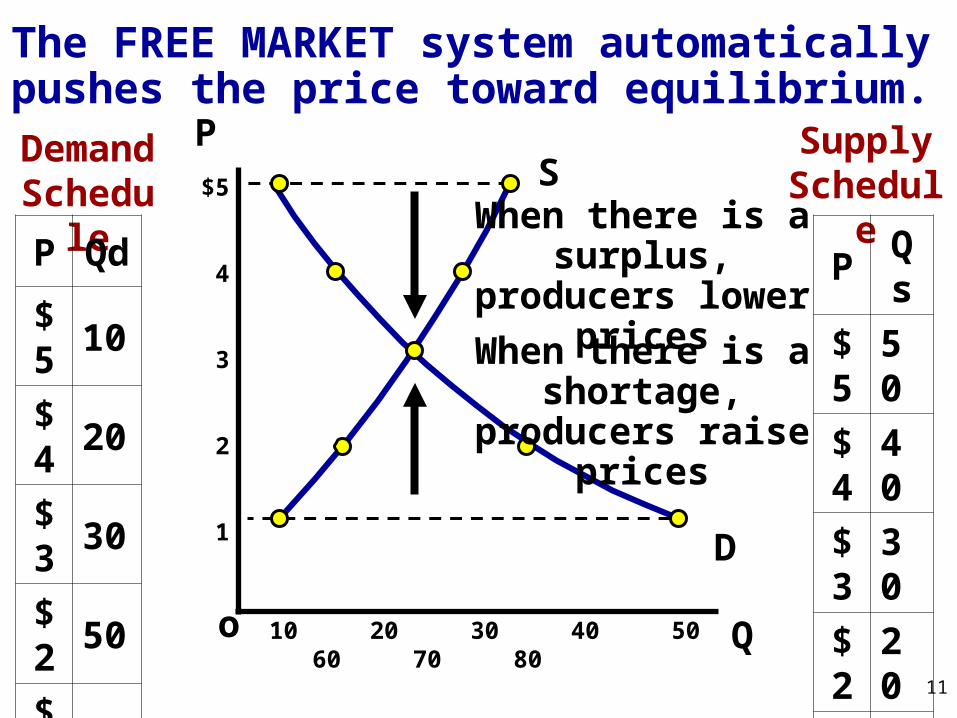
SWhen there is a
surplus, producers lower prices
The FREE MARKET system automatically pushes the price toward equilibrium.
When there is a shortage, producers
raise prices

Shifting Supply and Demand
12

Assume shifts in supply or demand change equilibrium P and Q instantaneously
13

Supply and Demand AnalysisEasy as 1, 2, 3
1. Before the change:• Draw supply and demand • Label original equilibrium price and quantity
2. The change: • Did it affect supply or demand first?• Which determinant caused the shift? • Draw increase or decrease
3. After change: • Label new equilibrium?• What happens to Price? (increase or decrease)• What happens to Quantity? (increase or decrease)
Let’s Practice! 14
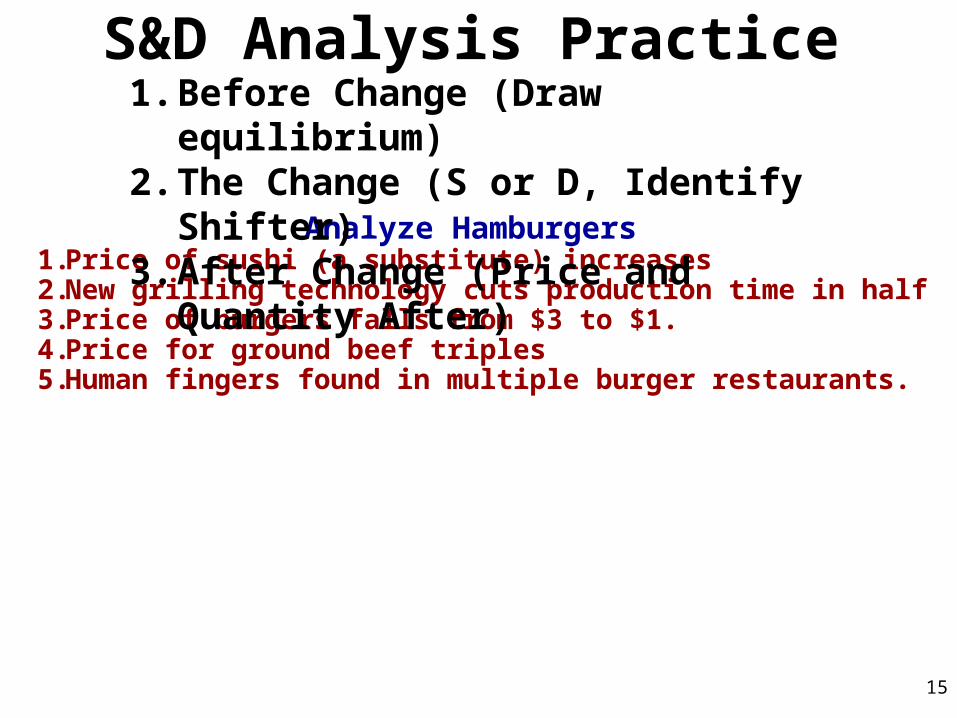
S&D Analysis Practice
Analyze Hamburgers1. Price of sushi (a substitute) increases2. New grilling technology cuts production time in half3. Price of burgers falls from $3 to $1. 4. Price for ground beef triples5. Human fingers found in multiple burger restaurants.
1. Before Change (Draw equilibrium) 2. The Change (S or D, Identify Shifter)3. After Change (Price and Quantity After)
15
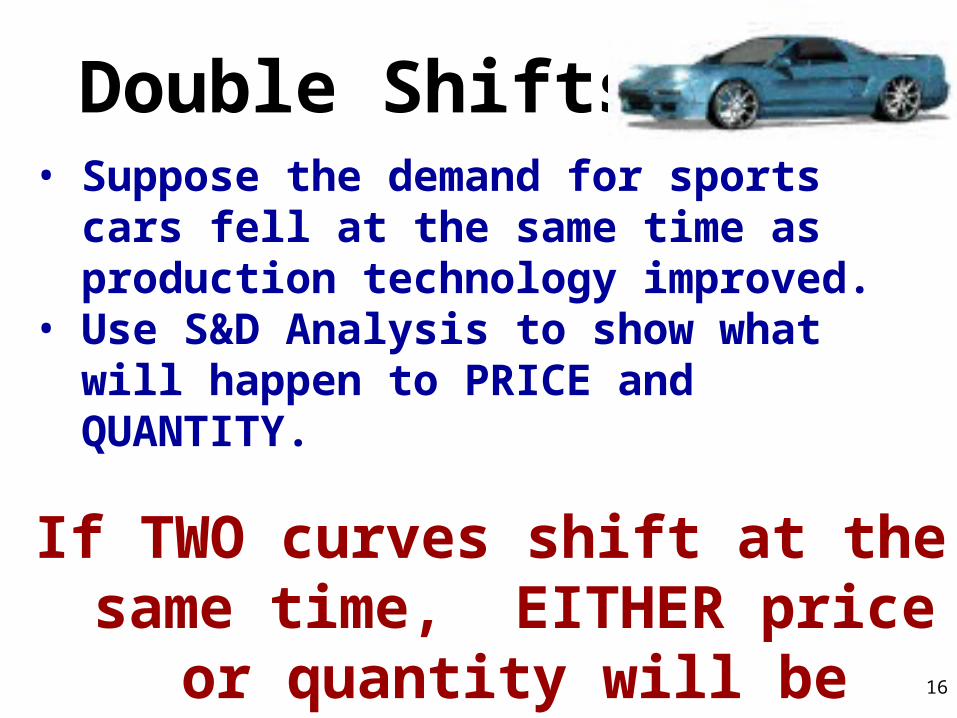
Double Shifts• Suppose the demand for sports cars fell at the
same time as production technology improved. • Use S&D Analysis to show what will happen to
PRICE and QUANTITY.
If TWO curves shift at the same time, EITHER price or quantity
will be indeterminate.
16

Use a S&D to explain this double shift
17

Voluntary ExchangeIn the free-market, buyers and sellers voluntarily come
together to seek mutual benefits.
18

Voluntary ExchangeIn the free-market, buyers and sellers voluntarily come
together to seek mutual benefits.
19

Voluntary ExchangeIn the free-market, buyers and sellers voluntarily come
together to seek mutual benefits.
20

Voluntary ExchangeIn the free-market, buyers and sellers voluntarily come
together to seek mutual benefits.
21

Example of Voluntary ExchangeEx: You want to buy a truck so you go to the local dealership. You are willing to spend up to $20,000 for a new 4x4. The seller is willing to sell this truck for no less than $15,000. After some negotiation you buy the truck for $18,000.
Analysis:
Buyer’ Maximum-
Sellers Minimum-
Price-
Consumer’s Surplus-
Producer’s Surplus-
$20,000
$15,000
$18,000
$2,000
$3,00022

Consumer Surplus is the difference between what you are willing to pay and what you actually pay.
CS = Buyer’s Maximum – Price
Producer’s Surplus is the difference between the price the seller received and how much they were willing to sell it for.
PS = Price – Seller’s Minimum
Voluntary Exchange Terms
23
Pearl Exchange Activity
24

S
P
Q
D
Consumer and Producer’s Surplus
$10
8
6$5
4
2
1
10 2 4 6 8
CS
PS
25
Calculate the area of:1. Consumer Surplus2. Producer Surplus3. Total Surplus
1. CS= $252. PS= $203. Total= $45