Chapter 1 Linear Functions Section 1.2 Linear Functions and Applications.

Unit 2
Linear
Functions
Foundations of Math 1
Fall 2016
2
2
Contents Daily Calendar ...................................................................................................................... 3
Standard Descriptions ........................................................................................................... 3
Standard 21 – Slope between Points .................................................................................... 4
Notes: Slope between two points using the formula or a graph ......................................... 5
Finding Slope from a Graph ........................................................................................... 5
Finding Slope Given Two Points: ................................................................................... 8
Classwork and Homework – Finding Slope ..................................................................... 10
Standard 22 – Graphing Lines ............................................................................................ 11
Graphing from Slope Intercept Form ............................................................................... 11
Graphing Lines given a Slope and a Point: .................................................................. 13
Graphing Lines in Standard Form .................................................................................... 14
Graphing Lines Using Intercepts .................................................................................. 14
Graphing by Solving for Slope Intercept ....................................................................... 16
Classwork and Homework - Graphing Lines .................................................................... 19
Standard 23: Writing Equations in Slope Intercept Form ..................................................... 21
Writing Equations from a Graph....................................................................................... 22
Classwork and Homework: Write the equation of the line. ............................................... 23
Writing Equations from a Given Slope and a Given Point ................................................ 24
Classwork and Homework: Write a linear equation. ........................................................ 26
Writing Equations Given 2 Points: ................................................................................... 27
Classwork and Homework: Writing Equations Given 2 Points ......................................... 29
Standard 24: Interpret Features of a Linear Functions in Context........................................ 30
Pledge Plan ..................................................................................................................... 30
Skate World ..................................................................................................................... 32
Amazing Profit ................................................................................................................. 33
Classwork and Homework: Interpreting Linear Functions in Context ............................... 36
Standard 25: Comparing Linear Functions .......................................................................... 38
Printing Books Project ..................................................................................................... 38
Classwork and Homework: Comparing Linear Functions ................................................. 41
Standard 26: Model Function in Various Representations (Graphs, Equations, & Tables) .. 42
Linear vs Non-Linear Relationships ................................................................................. 42
Modeling Linear Relationships ......................................................................................... 45
Standard 27: Scatterplots and Line of Best Fit .................................................................... 53
Linear Regression with Technology ................................................................................. 56
Finding Lines of Fit .......................................................................................................... 57
Standard 28: Apply linear regression models to analyze data and make predictions ........... 59
Classwork Homework: Best fit Lines and Making Predictions .......................................... 63

3
3
Daily Calendar
Standard Descriptions 21 Find the Slope between two points using the formula or a graph
22 Graphing in Slope-Intercept Form and Standard Form
23 Writing Equations in Slope-Intercept form
24 Interpret features of a Linear Function in Context
25 Comparing Linear Functions
26 Model Linear Functions in different representations (i.e. tables, graphs, equations, verbal)
27 Construct a scatter plot and draw a line of best fit (by hand and by use of appropriate
technology); Identify correlation coefficient to help determine fit of line
28 Apply linear regression models to analyze data and make predictions
Day Standard Homework and Reminders
1 Standard 21
2 Standard 22
3 Standard 23
4 Standard 23
5 Standard 24
6 Standard 25
7 Standard 25
8 Standard 26
9 Standard 26
10 Standard 27
11 Standard 28
12 Review
13 Test

4
4
Standard 21 – Slope between Points
Find the Slope between two points using the formula or a graph
Warm-Up

5
5
Notes: Slope between two points using the formula or a
graph
Rate of change can also describe the physical slant of the line on the graph.
This is called the slope of the line.
Slope = _________________ = __________________
Finding Slope from a Graph
When given a graph, ___________ over ___________ may be easier to use
Start at the lower point, move up and
over
𝑅𝑖𝑠𝑒
𝑅𝑢𝑛=
Start at the upper point, move down
and over
𝑅𝑖𝑠𝑒
𝑅𝑢𝑛=
Explain in your own words how you find the slope
of a line given the graph.
Also, explain in your own words what the slope
means?

6
6
Ex: Ex:
Horizontal Lines have no rise Vertical Lines have no run
Horizontal lines have a slope of: Vertical lines have a slope that is:
____________ ________________________
Find the slope of the line.
a. b.
m 0
number 0 m
number
0 undefined
(-4, 3)
(-2, -
1)
(-3, -
3)
(-2, 1)

7
7
Practice: Find the slope of the lines

8
8
Finding Slope Given Two Points:
When given points, it is easier to use the ________________.
y2 is the y coordinate of the ____ ordered pair
y1 is the y coordinate of the ____ ordered pair
Example 1:
Find the slope of the line that passes through the points (-2, -2) and (4, 1).
Example 2:
Find the slope given the points {(-5,3), (2,1)}.
2 1
2 1
( )
( )
y ym
x x

9
9
You try the following:
1. Find the slope of the line that passes through (3, 5) and (1, 4).
2. Find the slope of the line that passes through (5, -3) and (2, 1).
3. Find the slope of the line that passes through (1, 2) and (3, 6).
4. Find the slope of the line that passes through (2, 6) and (4, 0).
5. Find the slope of the line that passes through (3, 2) and (1, 4).
6. Find the slope of the line that passes through (2, 5) and (1, 2).
7. Find the slope of the line that passes through (7, 4) and (3, 2).
8. Find the slope of the line that passes through (8, 8) and (-4, -4).

10
10
Classwork and Homework – Finding Slope
Find the slope of the line through the given points.
1. (-1, 2) and (-5,10)
2. (100, 10) and (-3, 50)
3. (0, 1) and (4, 0)
4.
1
2,2
3
and
3
2,14
3
5. (5x, y) and (2x, 2y)
Find the slope of the following:
6. 7.
8.

11
11
Standard 22 – Graphing Lines
Graphing from Slope Intercept Form
Slope Intercept Form 𝑦 = 𝑚𝑥 + 𝑏
Where:
m =
b =
Tell if the following slopes go up or down (left to right).
1. m = -3 2. m =
1
2 3. m =
5
2 4. m = 9
Which slopes go uphill? How do you know?
Which slopes go downhill? How do you know?

12
12
Example: Graph y = 2x – 4
Identify the slope and y-intercept: Slope ________ y-intercept: ________
Graph the y-intercept on the coordinate plane.
Next, count the slope (change in y over the change in x) from the y-intercept and place a second point.
Use the slope again to plot at least one other point.
Draw a line through the points.
You Try:
1. Graph y = −1
2𝑥 + 2 2. Graph y = 3x – 1

13
13
Graphing Lines given a Slope and a Point:
Ex 1: Draw a line through the point (2, 0) that has a
slope of 3.
You Try
1. Point = (-2, 4) and Slope = 5/4
2. Point (0,-4) and Slope = -2/3
3. Point (-4,2) and slope = 3/5
4. Point (2,4) and slope = -1/2

14
14
Graphing Lines in Standard Form
The Standard Form for a linear equation in two variables, x and y, is usually given as
𝐴𝑥 + 𝐵𝑦 = 𝐶
where A, B, and C are integers, and A is positive, and, A, B, and C have no common
factors other than 1.
Graphing Lines Using Intercepts Standard forms give you another option for graphing equations. Instead of
transforming the equation to slope-intercept form (y=mx+b), you can use Standard
Form to solve for the x- and y-intercepts, then graph.
Example 1:
Find the x-intercept and y-intercept of the line 2x + 3y = 6. Use the intercepts to
graph the equation.
Find the x-intercept:
Find the y-intercept:
15
15
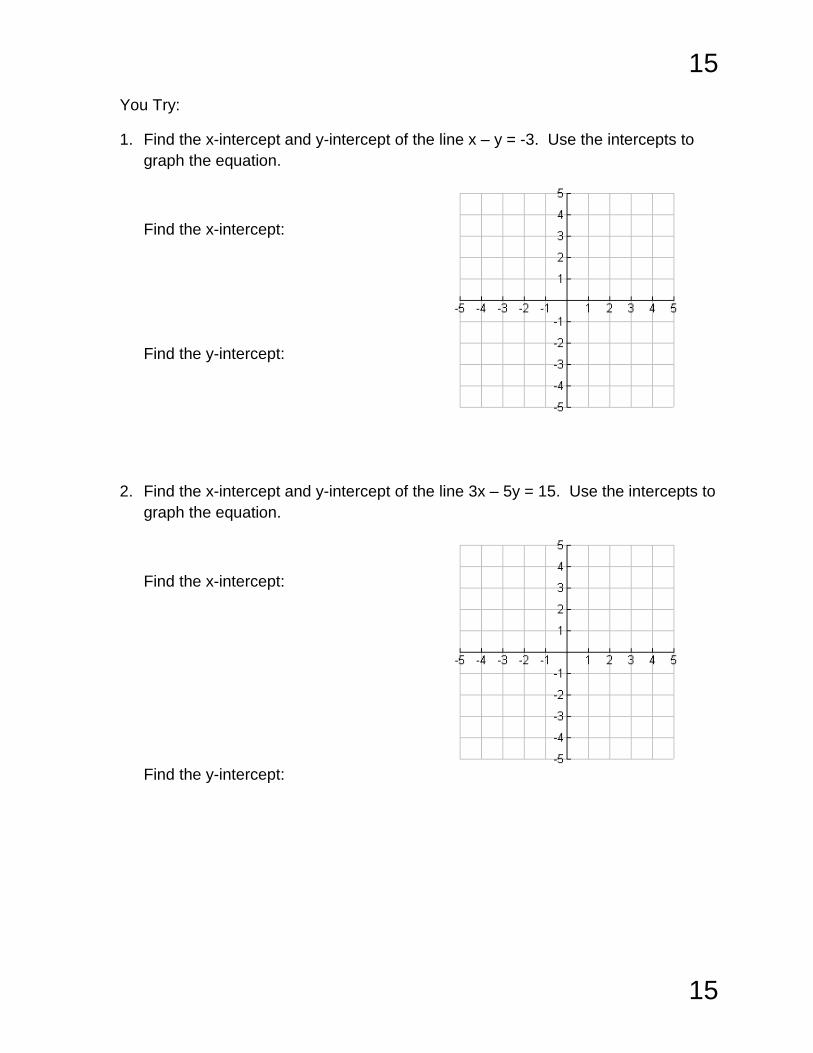
You Try:
1. Find the x-intercept and y-intercept of the line x – y = -3. Use the intercepts to
graph the equation.
Find the x-intercept:
Find the y-intercept:
2. Find the x-intercept and y-intercept of the line 3x – 5y = 15. Use the intercepts to
graph the equation.
Find the x-intercept:
Find the y-intercept:

16
16
Graphing by Solving for Slope Intercept
Transforming equations to slope-intercept form (y = mx + b)
Slope each equation for y, then graph.
Example 1: 6y – 12x = 24
Example 2: 20 – 2y = 4x

17
17
Example 3: y + 2x - 3= 5x
Example 4: -15y + 2x = 30
Example 5: 2y – 5x = 16

18
18
Practice: Solve for y and graph the equations on the graph.
1. y - x = 6
2. 3x + y = 5
3. y – 2x + 4 = 8
4. 20x + 4y = 8
5. 3y + x = -9
6. 6y – 5x = -36

19
19
Classwork and Homework - Graphing Lines Using the graph answer the following questions.
1. Is the slope of the line positive, negative or zero?
2. Is the y-intercept of the line positive, negative or zero?
3. Use your graph to find the y-intercept of the line.
4. Calculate the slope of the line.
5. Write the equation of the line in slope-intercept (y = mx + b) form.
Use the graph below to answer questions 6-9
6. Is the slope of the line positive, negative or zero?
7. Is the y-intercept of the line positive, negative or zero?
8. Use your graph to find the y-intercept of the line.
9. Calculate the slope of the line.
10. Write the equation of the line in slope-intercept (y = mx + b) form.
-5 -4 -3 -2 -1 1 2 3 4 5
-5
-4
-3
-2
-1
1
2
3
4
5
-5 -4 -3 -2 -1 1 2 3 4 5
-5
-4
-3
-2
-1
1
2
3
4
5

20
20
On your own:
11. Is the slope of the line positive, negative or zero?
12. Is the y-intercept of the line positive, negative or zero?
13. Calculate the slope of the line.
14. Use your graph to find the y-intercept of the line.
15. Write the equation of the line in slope-intercept (y = mx + b) form.
Try: Given the following equations in slope intercept form identify the slope and
y-intercept.
1) y = 3x + 3 2) y = x – 4
3) y = ½x – 5 4) y = -x
5) Given the equation y = 3x – 4, identify a point that lies on the line.
-5 -4 -3 -2 -1 1 2 3 4 5
-5
-4
-3
-2
-1
1
2
3
4
5

21
21
Standard 23: Writing Equations in Slope
Intercept Form
There are three situations in which you will need to be able to write an equation in
slope intercept form. We will discuss examples of each situations and give details
on what steps to take. The situation we will include are:
Writing equations given a point and a slope
Writing equations given two points
Writing equations given a graph
Remember, the form of slope intercept is 𝑦 = 𝑚𝑥 + 𝑏, where m is the slope and b is
the y-intercept.
Connection to Explicit Equations
Use the table to determine the linear equation in slope-intercept form. Plot the points
and use the graph to determine the linear equation in slope-intercept form. Make a
comparison between the equation from the table and the equation from the graph.
x y
- 2 - 7
-1 - 3
0 1
1 5 1 2 3 4 5 6 7 8–1–2–3–4–5–6–7–8 x
1
2
3
4
5
6
7
8
–1
–2
–3
–4
–5
–6
–7
–8
y
22
22
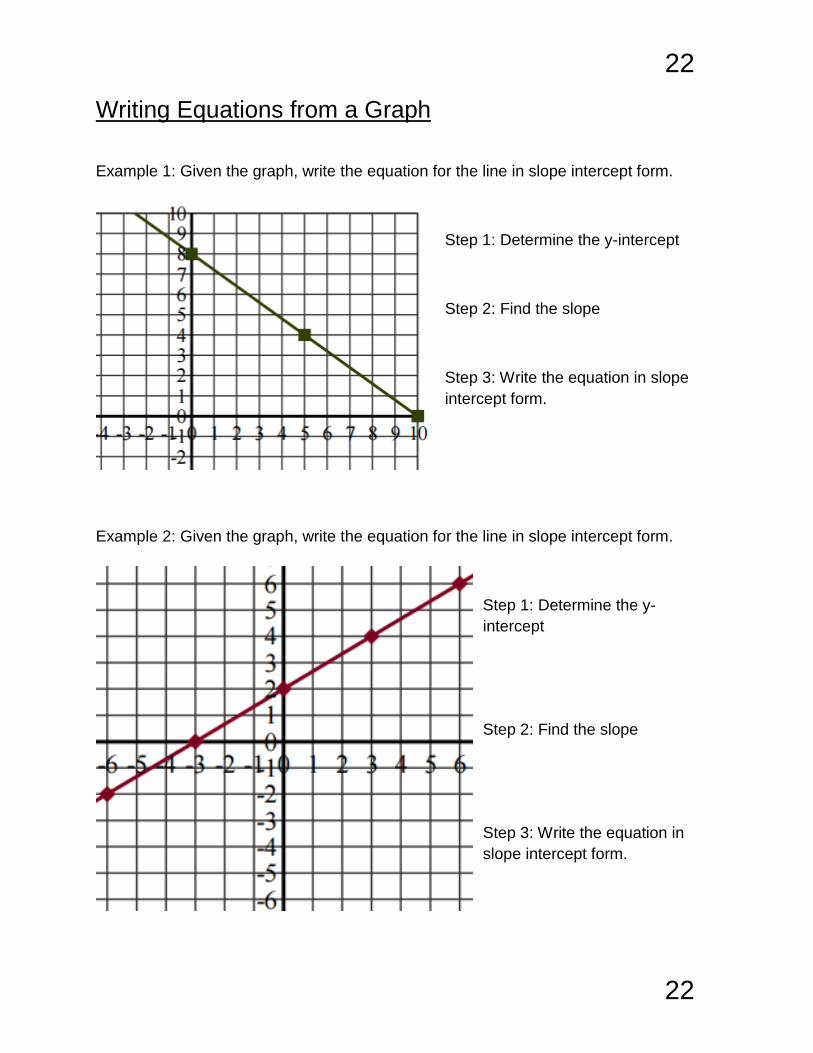
Writing Equations from a Graph
Example 1: Given the graph, write the equation for the line in slope intercept form.
Step 1: Determine the y-intercept
Step 2: Find the slope
Step 3: Write the equation in slope
intercept form.
Example 2: Given the graph, write the equation for the line in slope intercept form.
Step 1: Determine the y-
intercept
Step 2: Find the slope
Step 3: Write the equation in
slope intercept form.

23
23
Classwork and Homework: Write the equation of the
line.

24
24
1 2 3 4 5–1–2–3–4–5 x
1
2
3
4
5
–1
–2
–3
–4
–5
y
Writing Equations from a Given Slope and a Given Point
Use the information provided to determine the linear equation in slope-intercept form.
Example 1: Given 4
1m and the point (-4, 2).
Example 2: Find the equation of the line with a slope of -3 that passes through the point (4, 7).

25
25
1 2 3 4 5–1–2–3–4–5 x
1
2
3
4
5
–1
–2
–3
–4
–5
y
1 2 3 4 5–1–2–3–4–5 x
1
2
3
4
5
–1
–2
–3
–4
–5
y
You Try
Given 2
3m and the point (-2, 0).
Given 2m and the point (-4, -5).
Find the equation of the line with a slope of 5 that passes through the point (-1, 6).

26
26
Classwork and Homework: Write a linear equation.
1. Slope is 2 and the line passes through the point (4, 6)
2. Slope is - 4 and the line passes through the point (1, 3)
3. Slope is ½ and the line passes through the point (4, -3)
4. Slope is -3/2 and the line passes through the point (4, 5)
5. Slope is ¾ and the line passes through the point (8, -6)
6. Slope is 1/6 and the line passes through the point (12, 3)

27
27
Writing Equations Given 2 Points:
Graph a line that goes through the following 2 points, 2,3,2,3 and write the equation.
Step 1: Find the slope
Step 2: Use the slope and a point to write an
equation in slope intercept form
Step 3: Solve for b. Rewrite the equation
Graph a line that goes through the following 2 points, 3,3,5,4 and write the equation.
1 2 3 4 5 6 7 8–1–2–3–4–5–6–7–8 x
1
2
3
4
5
6
7
8
–1
–2
–3
–4
–5
–6
–7
–8
y
1 2 3 4 5 6 7 8–1–2–3–4–5–6–7–8 x
1
2
3
4
5
6
7
8
–1
–2
–3
–4
–5
–6
–7
–8
y

28
28
You Try:
Use the information below to write a linear equation.
1. Write an equation in slope intercept form that goes through the points (5, 3) & (4, 5).
2. Write an equation in slope intercept form that goes through the points (6, -4) & (-3, 5).
3. Write an equation in slope intercept form that goes through the points (2, 7) & (1, -4).
4. Write an equation in slope intercept form that goes through the points (6, -3) & (-2, -3)

29
29
Classwork and Homework: Writing Equations Given 2 Points
Write the slope-intercept form of the equation of the line through the given points.
1. through: (0, 3) and (−4, −1)
2. through: (0, 2) and (1, −3)
3. through: (−4, 0) and (1, 5)
4. through: (−4, −2) and (−3, 5)
5. through: (5, 4) and (−4, 3)
6. through: (−4, 2) and (0, −5)
7. through: (5, −2) and (−4, −3)
8. through: (−4, 5) and (5, −5)

30
30
Standard 24: Interpret Features of a Linear
Functions in Context
Pledge Plan Several students who are participating in a 10k walk-a-thon to raise money for charity need to
decide on a plan for sponsors to pledge money. Jeff thinks $1.50 per kilometer would be an
appropriate pledge. Rachel suggests $2.50 per kilometer because it would bring in more money.
Annie says that if they ask for too much money, people won’t agree to be sponsors; she suggests
they ask for a donation of $4 and then $0.75 per kilometer.
Jeff’s Plan Rachel’s Plan Annie’s Plan
Distance Money Raised
0 km $ 0
1 km
2 km
3 km
4 km
5 km
6 km
7 km
8 km
9 km
10 km
Distance Money Raised
0 km $ 0
1 km
2 km
3 km
4 km
5 km
6 km
7 km
8 km
9 km
10 km
Distance Money Raised
0 km $ 4
1 km
2 km
3 km
4 km
5 km
6 km
7 km
8 km
9 km
10 km

31
31
On the graph, graph all three pledge plans on the same coordinate grid. Use different colored lines to connect the points. Be sure to include a title, label the axes with intervals marked, and a key to indicate each plan.
For each of the three pledge plans, write an
equation to show the amount of money each
student will raise.
Jeff’s Plan- Rachel’s Plan- Annie’s Plan- Study the rate of change (slope) and the y-intercept for each person.
Who is making the most money for each mile they walk. How do you know? Who has the most money before the walking starts? How do you know?
Who has raised the most money at the end of 2 km? How do you know?
Who has raised the most money at the end of 5 km? How do you know?
Distance (km) 1 2 3 4 5 6 7 8 9 10
Mon
ey
Rai
sed
2
4
6
8
10
12
14
16
18
20
22
24
26
28
30

32
32
Skate World The graph below shows the relationship between weekly profit and the number of customers per week for Skate World Roller Rink. 1. Determine the slope and y-
intercept of the line that fits this data pattern.
2. Explain what the slope and y-intercept of the line tell you about the relationship between Skate World profit and number of customers per week.
3. If Skate World reached maximum capacity during each skating session for a week,
admissions for that week would total 2,400 customers. Estimate the rink’s profit in this situation. Explain your reasoning.
4. What is the meaning of the ordered pair (400, 0) in terms of the number of customers and weekly profit?

33
33
Amazing Profit
EBay is a popular website where people sell or auction off just about anything. The final purchase price at the end of an auction is called a “closing bid.” In the fall of 2006, the Sony Playstation 3 (PS3) sold out in stores across America in less than five minutes after each store opened. Many people sold these PS3’s on eBay.
1. The original sales price for the PS3 was approximately $600. One lucky seller on eBay sold a PS3 for over $10,000 the day it was released. However, the mean closing bid for a PS3 on eBay that first day (Day 0) was approximately $5,500. The table below shows the approximate mean closing bids for the first several days after the release of PS3. Ignoring costs such as tax and shipping, find the profit for each day.
2. Graph the closing bid and profit data on this graph using different colors to represent each data set. Then, draw lines through each set of data, and label each line.
DAY CLOSING BID ON EBAY
PS3 SELLER’S PROFIT
0 $5,500
2 $5,000
5 $4,250
8 $3,500
12 $2,500
15 $1,750

34
34
3. Find the linear equation for the approximate closing bid.
4. Find the linear equation for the approximate profit.
5. What do the x values on the graph represent? Are negative x values important? Why?
6. What do the y values on the graph represent? Are negative y values important? Why?
7. What relationship do you notice between the closing bid line and the profit line? How is this relationship reflected in the table? Explain the cause of the relationship.
8. Do the lines have positive or negative slope? What does this mean to the seller? to the buyer?
9. When do you predict the values for the profit to reach $0?
10. Sellers on eBay can start the bidding for their items at any price. a) What is the lowest price (in whole dollars) a seller could start the bidding at and still
make a profit?
b) According to your graph, after how many days should the seller start at this price?
c) Where is the closing bid line after that number of days?
11. Why do you think the price on eBay decreased in this way? What other products might show a similar trend?

35
35
You Try The table below show data from an investigation entitled “Taking Chances”.
Number of Trials 20 40 60 80 100 120
Cumulative Profit (in $)
3 7 11 15 19 23
a. Explain why a linear model is reasonable for these data.
b. Is cumulative profit an exact linear function of the number of trials? Explain why or why not.
c. Write a NOW-NEXT rule to represent the relationship between number of trials and cumulative profit.
d. Write a function rule in the form y = mx + b.
e. What is the coefficient of the independent variable in your model in Part d? What does it tell you about the relationship between the cumulative profit and number of trials?
f. How many trials will need to be taken in order to have a cumulative profit of $74? Explain your reasoning.

36
36
Classwork and Homework: Interpreting Linear Functions in
Context
1. Viper Video charges a membership fee per year in addition to the rental cost per tape.
The graph represents the annual cost as it varies
with the number of tapes rented.
a) Calculate the slope. Explain what the slope
represents in terms of number of tapes rented
and cost.
b) What does the y-intercept represent in this application?
2. The data below represent the value of a delivery truck as it depreciates over a period of 5
years
Years 0 1 2 3 4 5
Truck Value 15000 12400 9800 7200 4600 2000
a) Calculate the slope. What is the meaning of the slope in terms of years and current value?
b) What is the meaning of the y-intercept?
c) Write an equation to describe the data.

37
37
3. A skydiver, during a jump, falls at a constant rate after the first ten seconds. The graph below
shows the altitude of the skydiver after x seconds.
a) Calculate the slope of the line after the first 10 seconds after point B). Explain the meaning
of the slope in terms of meters and seconds.
b) What is the meaning of the y-intercept in this application?
c) What is the meaning of the x-intercept?
d) Why might there be a steeper slope from point A to point B?
4. Write an application for the equation: y = 3.5x + 4
a) Interpret the meaning of the slope.
b) Interpret the y-intercept.

38
38
Standard 25: Comparing Linear Functions
Printing Books Project
Purchasing decisions for a Common Core Math 1 textbook for the school system must be made. The Board of Education needs to know the costs of providing a 325-page Common Core Math 1 textbook to three different schools. The schools have agreed to pilot a new textbook this year; the publisher is making page proofs of the book available, but the schools must make the copies needed for the students. An assistant has done some research and has discovered three possibilities. You will be using the information that follows to determine which printing process would be the most economical for the school district. In the past, the math textbook orders have never exceeded 2250 books and the cost has never exceeded $35,000. Using tables and graphs, as well as identifying general rules, slopes, y-intercepts, and points of intersection, do a mathematical analysis of these different options and write a recommendation for the Board of Education to consider.
PRINTING BOOKS PROJECT PART 1
An assistant for the Board of Education has done some research and discovered the following three possibilities for printing the textbooks. The information is as follows:
1. A local printing company: The Common Core Math 1 textbook can be printed by a local
printer for a cost of $9.50 per book with an initial cost of $5000 for typesetting.
2. A local copy center: The Common Core Math 1 textbook can be duplicated at a local copying center for $0.05 per page plus $2.00 per book for binding.
3. The school district: The school district’s own copying center can reproduce the textbook at a cost of $0.035 per page plus an up-front cost of $3000.

39
39
The first step in this process is to complete a table for each of the different possibilities using the information gathered by the assistant. It is suggested that you complete the table using intervals of 200 for the number of books. 1. Local Printing Company
Number of Books 0
Printing Co.
2. Local Copy Center
Number of Books 0
Copy Center
3. School District
Number of Books 0
School District

40
40
PRINTING BOOKS PROJECT PART 2
In this part of the process, you will be taking the information you displayed in the tables and graphing the data on the coordinate plane provided and answered the following questions. 1. On the coordinate plane provided do the following:
i. Graph each of the three printing possibilities.
ii. Use a different color and symbol to represent the printing options.
iii. Title the graph
iv. Label the axes and intervals
v. Provide a key for the graph 2. For each of the printing options:
A. Write a NOW-NEXT rule for each of the different printing options. Be sure to state a starting value.
B. Write an explicit equation for each of the different printing options. Identify the rate of
change and the y-intercept for each.
C. In complete sentences, interpret the real world meaning for the slope and y-intercept for each equation.
PRINTING BOOKS PROJECT PART 3
It is decided that each school in the district can choose a different printing company based on their individual needs, and the following conditions apply: 1. Sanderson High School will need 400 textbooks next year. 2. Leesville High School will need 550 textbooks next year. 3. Knightdale High School will need 1400 textbooks next year.

41
41
Classwork and Homework: Comparing Linear Functions Using each of the equations you discovered in Part 2, determine the most economical printing company for the three schools. Be sure to show all steps in calculating the cost. The final part of the project will now require you to take all the information you have gathered and write a concise detailed recommendation to the Board of Education detailing which company would be the most economical for printing the needed Common Core Math 1 textbooks. Remember this recommendation will be used in choosing the printing company, so you should be very specific and include all pertinent information.

42
42
Standard 26: Model Linear Function in Various
Representations (Graphs, Equations, and Tables)
Linear vs Non-Linear Relationships One of the tables of values below represents a linear function and the other does not. Identify the
tables as linear or non-linear and explain how you can tell.
Circle one: Linear Nonlinear Circle one: Linear Nonlinear
Explanation: Explanation:
You Try: Identify each table of values as linear or nonlinear and explain.
x F(x)
1 12
2 7
3 4
4 3
x y
1 0
2 2
3 4
4 6
x F(x)
1 1
4 7
5 10
8 15

43
43
Example 1: y – intercept is given
Write an equation in slope intercept form for the following table of values.
x y
-1 -1
0 2
3 11
5 17
Step 1: Find the slope.
Step 2: Find the y-intercept.
Step 3: Use the slope and y-intercept to write your equation in slope-intercept form.
Example 2: y-intercept is not given
x y
-4 -5
-1 1
1 5
3 9
Step 1: Find the slope.
Step 2: Find the y-intercept.
Step 3: Use the slope and y-intercept to write your equation in slope-intercept form.
44
44
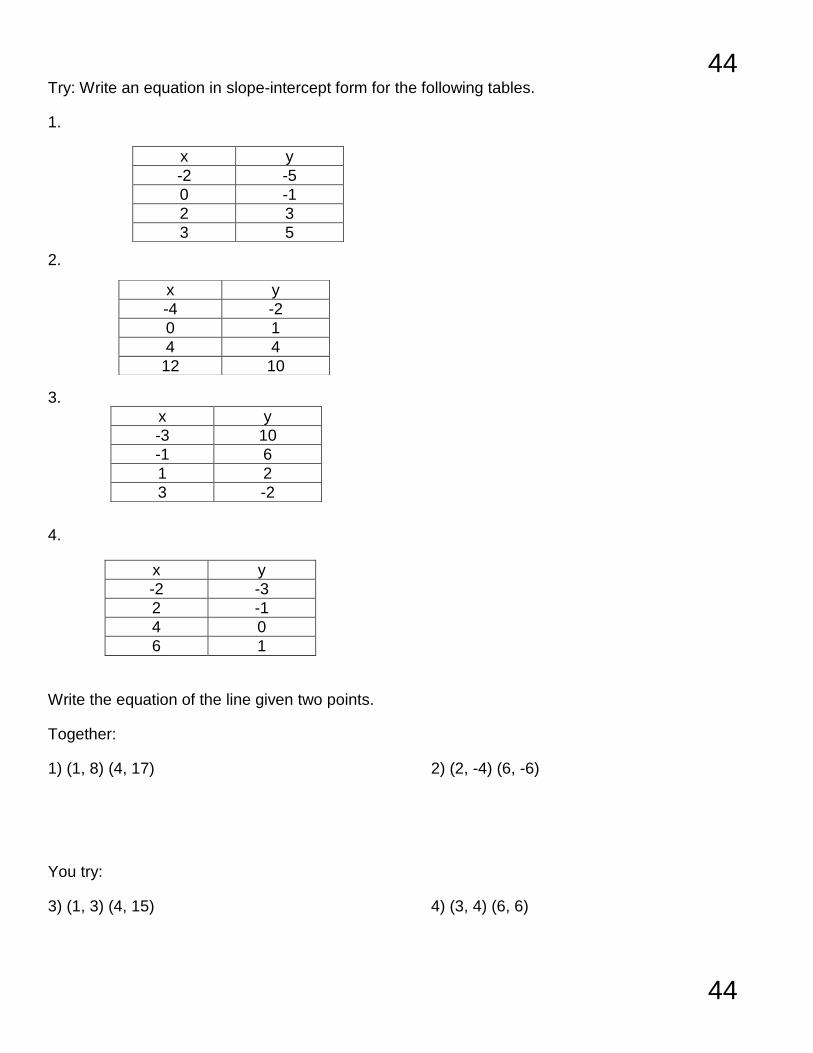
Try: Write an equation in slope-intercept form for the following tables.
1.
2.
3.
4.
x y
-2 -3
2 -1
4 0
6 1
Write the equation of the line given two points.
Together:
1) (1, 8) (4, 17) 2) (2, -4) (6, -6)
You try:
3) (1, 3) (4, 15) 4) (3, 4) (6, 6)
x y
-2 -5
0 -1
2 3
3 5
x y
-4 -2
0 1
4 4
12 10
x y
-3 10
-1 6
1 2
3 -2

45
45
Modeling Linear Relationships
In this activity, you will represent linear relationships in three forms. You will be given either an
equation, a table or a graph. Your task is to use the information given to create the other forms.
The first one will be done together.
Algebraic Equation Graph
4 8x y
Table

46
46
Algebraic Equation Graph
Table
Algebraic Equation Graph
Table

47
47
Algebraic Equation Graph
3 1y x
Table
Algebraic Equation Graph
Table

48
48
Algebraic Equation Graph
Table
Algebraic Equation Graph
5y
Table

49
49
Algebraic Equation Graph
Table
Algebraic Equation Graph
Table

50
50
Algebraic Equation Graph
3x y
Table
Algebraic Equation Graph
Table

51
51
Algebraic Equation Graph
Table
Algebraic Equation Graph
3 2 6x y
Table

52
52
Algebraic Equation Graph
Table
Algebraic Equation Graph
Table
53
53
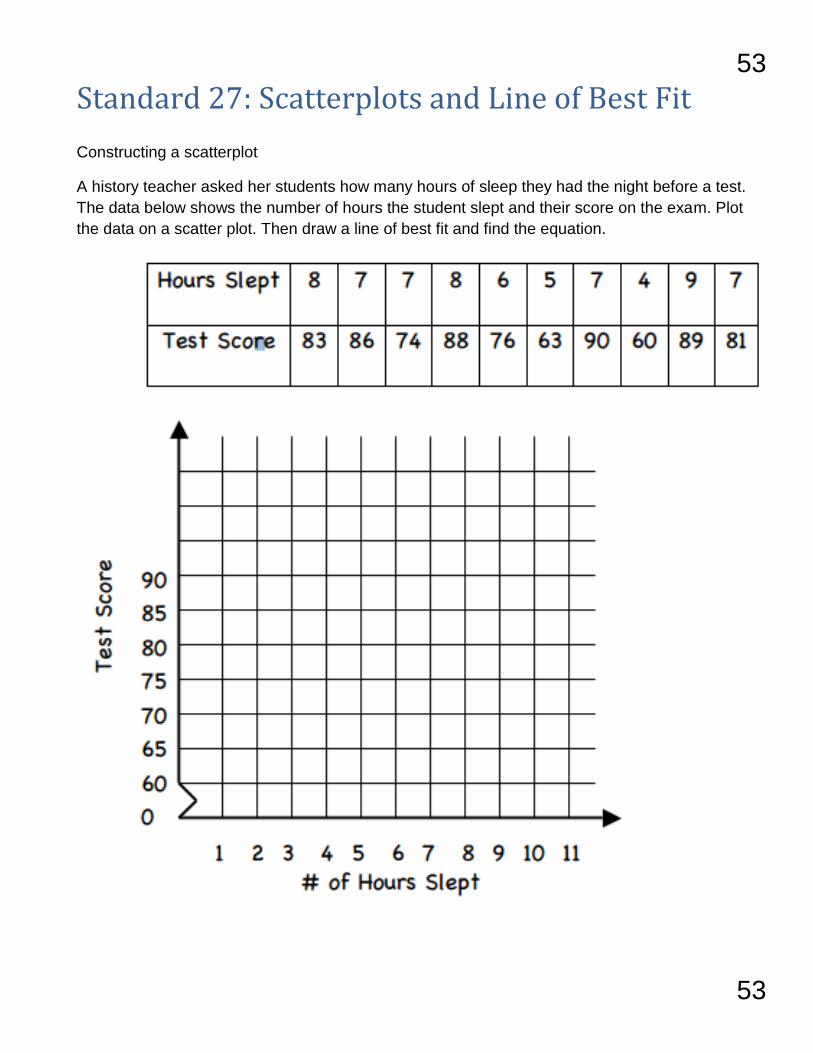
Standard 27: Scatterplots and Line of Best Fit
Constructing a scatterplot
A history teacher asked her students how many hours of sleep they had the night before a test.
The data below shows the number of hours the student slept and their score on the exam. Plot
the data on a scatter plot. Then draw a line of best fit and find the equation.

54
54
There are 3 main categories we have for describing the data in scatter plot
______________ ______________
______________ ______________ _____________
______________ ______________
Does the data
have a constant
rate of change ?
If we drew a line
“through” the
data would the
slope be
positive,
negative, or
none?
How close is the
data?

55
55
You Try
Using the descriptions below, describe the graphs.
Linear or Non-Linear ?
Positive , Negative, or None ?
Strong or Weak?
Describe the scatter plots using the three categories outlined in the notes.
___________ ____________ ___________
___________ ____________ ___________
___________ ____________ ___________

56
56
Linear Regression with Technology You have learned how to find and write equations for lines of fit by hand. Many calculators use complex algorithms that find a more precise line of fit called the best-fit line. One algorithm is called linear regression. We can find the linear regression using the graphing calculator. To enter the data: EDIT L1 is independent variable(x-vlaue); L2 is dependent variable (y-value)
Enter your data from the “height vs. time on one leg experiment” now Calculator Steps: CALC 4: LinReg Y-VARS FUNCTION 1: Y1
Your calculator may also compute a number called the correlation coefficient. This number will tell you if your correlation is positive or negative and how closely the equation is modeling the data. The closer the correlation coefficient is to 1 or -1, the more closely the equation models the data. To turn the correlation coefficient on: Diagnostic On
If the correlation coefficient is close to 1 or -1, the fit is .
The farther away from 1 or -1, the the fit.
If the scatterplot appears random, there is .
If the correlation coefficient is positive, the slope will be .
If the correlation coefficient is negative, the slope will be . What was the Coefficient for you data?__________ Do the two variables correlate?________
ST
AT VAR
S
2nd 0 Enter
Enter
STAT
57
57
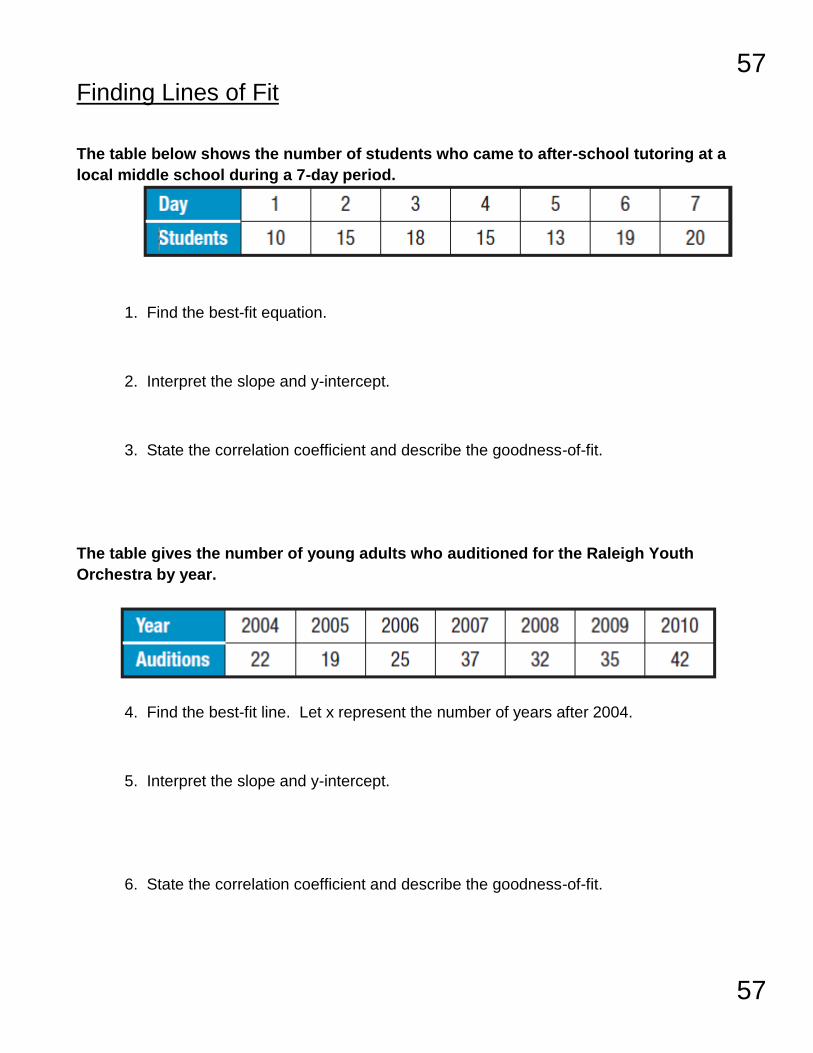
Finding Lines of Fit
The table below shows the number of students who came to after-school tutoring at a
local middle school during a 7-day period.
1. Find the best-fit equation.
2. Interpret the slope and y-intercept.
3. State the correlation coefficient and describe the goodness-of-fit.
The table gives the number of young adults who auditioned for the Raleigh Youth
Orchestra by year.
4. Find the best-fit line. Let x represent the number of years after 2004.
5. Interpret the slope and y-intercept.
6. State the correlation coefficient and describe the goodness-of-fit.

58
58
The table below shows the number of people participating in high school athletics.
7. Find the best-fit line.
9. Interpret the slope and y-intercept.
10. State the correlation coefficient and describe the goodness-of-fit.
Interpret the slope and y-intercept for each real-world situation.
11. The function, ℎ(𝑥) = 2.90 + 0.79𝑥, models the cost of a hamburger with varying numbers of
toppings.
12. The height of a candle, in inches, as a function of time, in hours, when burning is modeled
by ℎ(𝑡) = −0.2𝑡 + 12.
13. 14.
59
59
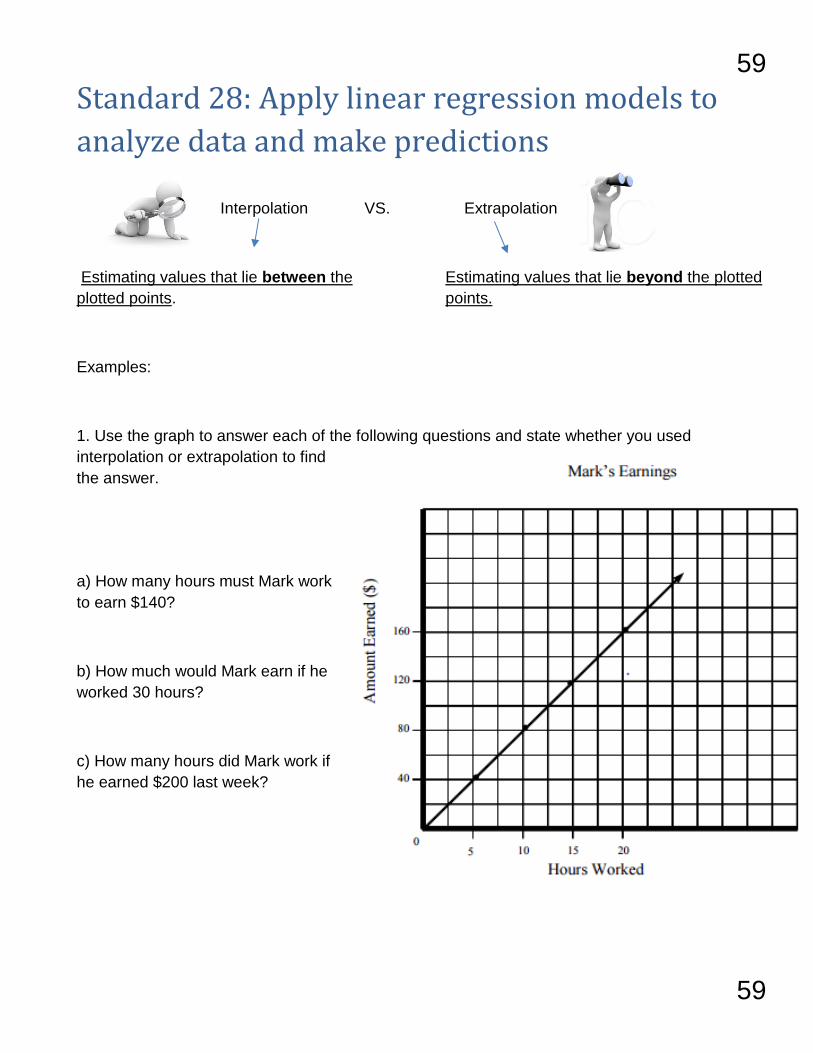
Standard 28: Apply linear regression models to
analyze data and make predictions
Interpolation VS. Extrapolation
Estimating values that lie between the
plotted points.
Estimating values that lie beyond the plotted
points.
Examples:
1. Use the graph to answer each of the following questions and state whether you used
interpolation or extrapolation to find
the answer.
a) How many hours must Mark work
to earn $140?
b) How much would Mark earn if he
worked 30 hours?
c) How many hours did Mark work if
he earned $200 last week?

60
60
2.
Anthropologists use a linear model that relates femur length to height. The model allows an
anthropologist to determine the height of an individual when only a partial skeleton (including the
femur) is found. Use the table to analyze the data on femur length and height for the ten males
given in the table.
a. Find the linear regression using the graphing calculator.
b. State the correlation coefficient and describe the fit.
c. Dr. Brennan finds a femur with a length of 58 cm. How tall
does she predict the person will be?
d. If the person is 151 cm tall, what does the model predict for femur length?
Femur Length
(cm)
Height (cm)
50.1 178.5
48.3 173.6
45.2 164.8
44.7 163.7
44.5 168.3
42.7 165.0
39.5 155.4
38.0 155.0

61
61
The table below gives the winning height for the men’s pole vault at each Olympic Games since
1900. Let x = the number of years after 1900.
a. Find the line of best fit using technology.
b. State the correlation coefficient and describe the fit.
c. Use the model to predict what the height should have been in 1992. How
does this compare to actual winning height in the table? Is this an example of
interpolation or extrapolation?
d. Use the model to predict what the height will be in the 2016 Olympics. Is
this an example of interpolation or extrapolation?
e. Look up the actual winning height from the 2016 Summer Olympics in Rio.
How does this compare to the answer you found in the previous problem?
f. The International Olympic Committee (IOC) wants a model they can use through 2050. Should
they use this one? Why or why not?
Year Height
(m)
1900 3.30
1904 3.50
1906 3.50
1908 3.71
1912 3.95
1920 4.09
1924 3.95
1928 4.20
1932 4.31
1936 4.35
1948 4.30
1952 4.55
1956 4.56
1960 4.70
1964 5.10
1968 5.40
1972 5.64
1976 5.64
1980 5.78
1984 5.75
1988 5.90
1992 5.87
1996 5.92
2000 5.90
2004 5.95
2008 5.96
2012 5.97
62
62
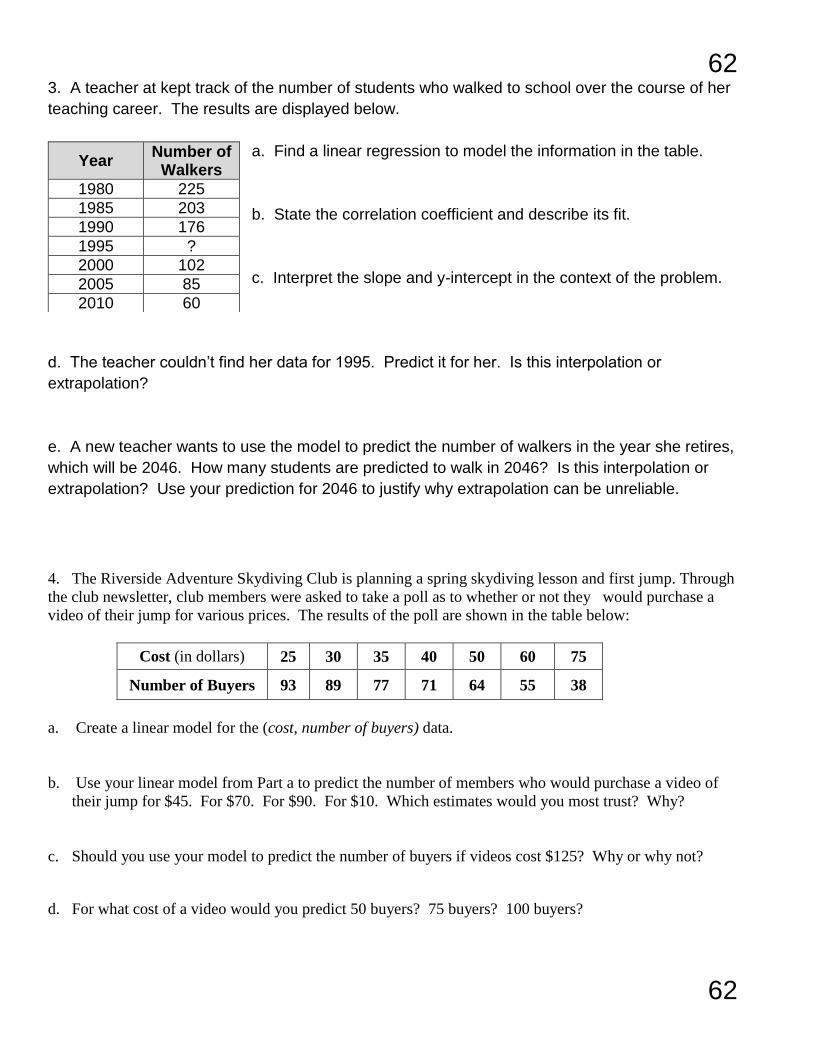
3. A teacher at kept track of the number of students who walked to school over the course of her
teaching career. The results are displayed below.
a. Find a linear regression to model the information in the table.
b. State the correlation coefficient and describe its fit.
c. Interpret the slope and y-intercept in the context of the problem.
d. The teacher couldn’t find her data for 1995. Predict it for her. Is this interpolation or
extrapolation?
e. A new teacher wants to use the model to predict the number of walkers in the year she retires,
which will be 2046. How many students are predicted to walk in 2046? Is this interpolation or
extrapolation? Use your prediction for 2046 to justify why extrapolation can be unreliable.
4. The Riverside Adventure Skydiving Club is planning a spring skydiving lesson and first jump. Through
the club newsletter, club members were asked to take a poll as to whether or not they would purchase a
video of their jump for various prices. The results of the poll are shown in the table below:
Cost (in dollars) 25 30 35 40 50 60 75
Number of Buyers 93 89 77 71 64 55 38
a. Create a linear model for the (cost, number of buyers) data.
b. Use your linear model from Part a to predict the number of members who would purchase a video of
their jump for $45. For $70. For $90. For $10. Which estimates would you most trust? Why?
c. Should you use your model to predict the number of buyers if videos cost $125? Why or why not?
d. For what cost of a video would you predict 50 buyers? 75 buyers? 100 buyers?
Year Number of
Walkers
1980 225
1985 203
1990 176
1995 ?
2000 102
2005 85
2010 60

63
63
Classwork Homework: Best fit Lines and Making Predictions For each of the following, write the prediction equation and then solve the problem.
1. A student who waits on tables at a restaurant recorded the cost of meals and the tip left by single diners.
Meal Cost $4.75 $6.84 $12.52 $20.42 $8.97
Tip $0.50 $0.90 $1.50 $3.00 $1.00
If the next diner orders a meal costing $10.50, how much tip should the waiter expect to receive?
Equation Tip expected
2. The table below gives the number of hours spent studying for a science exam (x) and the final exam grade (y).
X 2 5 1 0 4 2 3
Y 77 92 70 63 90 75 84
Predict the exam grade of a student who studied for 6 hours.
Equation Grade expected
3. The table below shows the lengths and corresponding ideal weights of sand sharks.
Length 60 62 64 66 68 70 72
Weight 105 114 124 131 139 149 158
Predict the weight of a sand shark whose length is 75 inches.
Equation Weight expected
4. The table below gives the height and shoe sizes of six randomly selected men.
Height 67 70 73.5 75 78 66
Shoe
size
8.5 9.5 11 12 13 8
If a man has a shoe size of 10.5, what would be his predicted height?
Equation Height expected

64
64
Test Review – Linear Functions
Use the following information to answer questions 1 – 3:
The time-distance graph shows Gina walking at a steady rate as measured by a motion detector.
1. How fast did Gina walk during the first 4 seconds?
2. If Gina maintains the same rate of walking, how
much more time will it take for her to reach 13 ft?
3. Write an equation to represent this graph
Use the following information to answer questions 4 – 8:
Suppose you have joined an online music program that charges you $12 plus $.10 per song you download.
4. Define the independent variable. 5. Define the dependent variable.
6. Write an equation to relate how much you are charged in terms of how many songs you download.
7. How much will you be charged to download 30 songs?
8. How many songs can you download for $20?
0
1
2
3
4
5
6
7
8
9
0 1 2 3 4 5 6 7
8 9
Time (sec)
Dis
tan
ce (
ft)
65
65
9. The moon’s temperature increases as you move from the surface toward the center. It increases
approximately 12°C for each kilometer beneath the moon’s surface and the temperature on the
surface is 8°C. Write a linear equation relating temperature T and distance beneath the moon’s
surface D.
10. Summer Time Ice Cream Parlor caters Make Your Own Sundae parties. They charge $40 to
deliver, set up the party, and serve. In addition, they charge $3.50 per person at the party. Write an
equation to determine the cost C of the party if there were n people attending the party?
11. Rachel got her grandfather to sponsor her in a read-a-thon to raise money for cancer research. He
said he would use the equation A = 5b + 12, where A is the amount he will pay if Rachel reads b
books.
A. Identify the slope and explain what it means in the context of this problem.
B. How much money will Rachel’s grandfather give her if she reads 5 books.
C. How many books does Rachel need to read if she wants to earn $72?
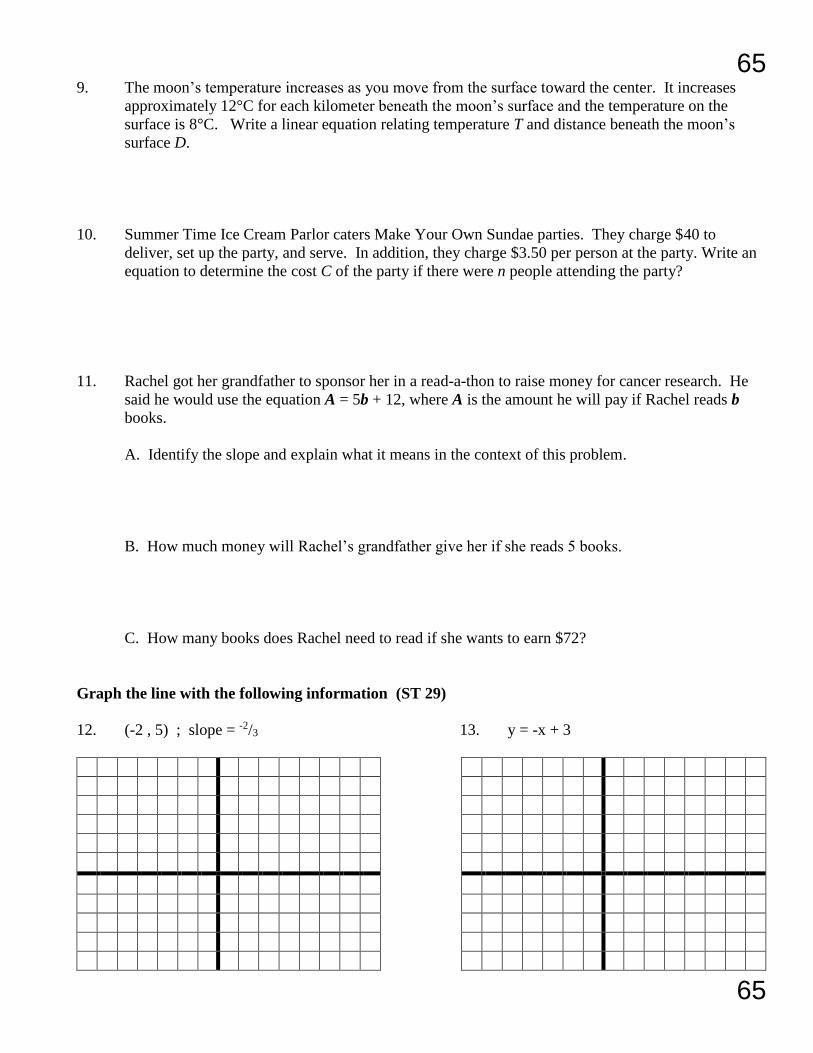
Graph the line with the following information (ST 29)
12. (-2 , 5) ; slope = -2/3 13. y = -x + 3

66
66
14. 3x – 6y = -12 15. x = 5
For # 16 – 19, find the slope with the given information
16. (9 , 2) ; (-3 , 2) 17. (5 , -2) ; (-1 , 8)
18. 19.
20. Find the rate of change for the graph to the right.

67
67
21. Find the x-intercept and the y-intercept of the following equation. -2x – 3y = 12
Graph the line with the following information
22. (-1 , -3) ; slope = 2/3 23. y = -2x + 5
24. 3x – 6y = 12 25. y = -2
26. Train A going to Washington, D.C. leaves the station traveling 35 mph. Train B going to Washington,
D.C. leaves with a 75 mile head start and is traveling 25 mph.
A. Write an equation to model train A B. Write an equation to model train B.
C. If Washington, D.C. is 350 miles away, which trains gets there first?
68
68
27. Suppose Latoya has a trust fund worth $25,000 and she withdraws $500 each month to
spend.
A. Write an equation to model this situation.
B. How much money will remain in Latoya’s trust fund after 20 months?
C. When does the value of the trust fund reach $5000?
28. Find the slope between (6 , -5) and (-9 , 7).
29. Find the x-intercept and the y-intercept of the following equation. -2x – 3y = 12
30. Write the equation of a line in point-slope form with a slope of 5/2 and passing through (-4 , 2).
31. Write the equation of line in point-slope form passing through (9 , -2) and (-1 , 4).
32. Write the equation of a line in slope-intercept form with a slope of 9 and the point (1 , -8).
33 Write the equation of line in slope-intercept form passing through (-2 , 3) and (4 , 12)

69
69
34. Write the equation of a line with m = 0 and the point (-2 , 7).
35. Write the equation of a line with m = undefined and point (4 , -3).
Find the linear regression equation to model each table and make each prediction.
22. x y 23. (-6 , 30) (-1 , 19) (4 , 8) (9 , -3)
-10 12
0 15
10 18
20 21
A. linear regression equation A. linear regression equation
B. find y when x = 12 B. find y when x = 20

70
70
24. Raphael’s workout schedule can be modeled by the following table. (ST 32)
week number 1 2 3 4
miles run 15 20 25 30
A. Find a linear equation to relate the miles Raphael runs to the number of weeks he workouts.
B. How many miles will he run in week 9? C. In what week will he run 80 miles?
25. The following table represents the relationship between the number of hot dogs (x) sold
and the profit (P) in dollars that the concession makes at a home football game. (ST 32)
x 2 5 10 12 20
P 2.50 6.25 12.50 15.00 25.00
A. Find a linear equation to relate the number of hot dogs sold and the profit made.
B. What is the slope and what does it mean in the context of this problem.
C. What is the profit if they sell 70 hot dogs?