Unit 1 Notes - Day 6.notebook - Anderson School District Five · Unit 1 Notes Day 6.notebook 2...
4
Unit 1 Notes Day 6.notebook 1 August 29, 2013 Histograms: • bar graphs that represent numerical data from a frequency distribution • Contain: > a title > a frequency of the vertical scale > classes on bottom or horizontal scale Example: Ungrouped (by hand) x f 3 2 4 5 5 10 6 1 7 8 Example: Grouped (by hand) Annual Salary (f) # of Managers 15-25 12 25-35 37 35-45 26 45-55 19 55-65 6 Calculator Steps: 1. Put lower boundaries in L1 2. Put upper boundaries in L2 3. Find the midpoints in L3 > Midpoint = the number in the middle of each class > Set a Formula: (L1 + L2)/2 4. Put frequencies in L4
Transcript of Unit 1 Notes - Day 6.notebook - Anderson School District Five · Unit 1 Notes Day 6.notebook 2...

Unit 1 Notes Day 6.notebook
1
August 29, 2013
Histograms:
• bar graphs that represent numerical data from a frequency distribution
• Contain:
> a title
> a frequency of the vertical scale
> classes on bottom or horizontal scale
Example: Ungrouped (by hand)
x f3 24 55 106 17 8
Example: Grouped (by hand)
Annual Salary (f) # of Managers15-25 1225-35 3735-45 2645-55 1955-65 6
Calculator Steps:
1. Put lower boundaries in L1
2. Put upper boundaries in L2
3. Find the midpoints in L3
> Midpoint = the number in the middle of each class
> Set a Formula: (L1 + L2)/2
4. Put frequencies in L4

Unit 1 Notes Day 6.notebook
2
August 29, 2013
Graph Using Statistical Plots:
1. Press 2nd y=
2. Turn on "stat plot"
3. Set to histogram
4. Set x-list to: L3 (where x's are)
5. Set frequency to: L4 (where f's are)
6. Press Zoom Stat
7. "Fix" window with class width for x (xscl = class width)
Press "2nd y="
"fix" - make bars touch by changing the window (xscl=class width)

Unit 1 Notes Day 6.notebook
3
August 29, 2013
Press "graph" when done Shapes of Histograms:
• Normal or Symmetrical
• Uniform or Rectangular
• Left Skew (negative)
• Right Skew (positive)
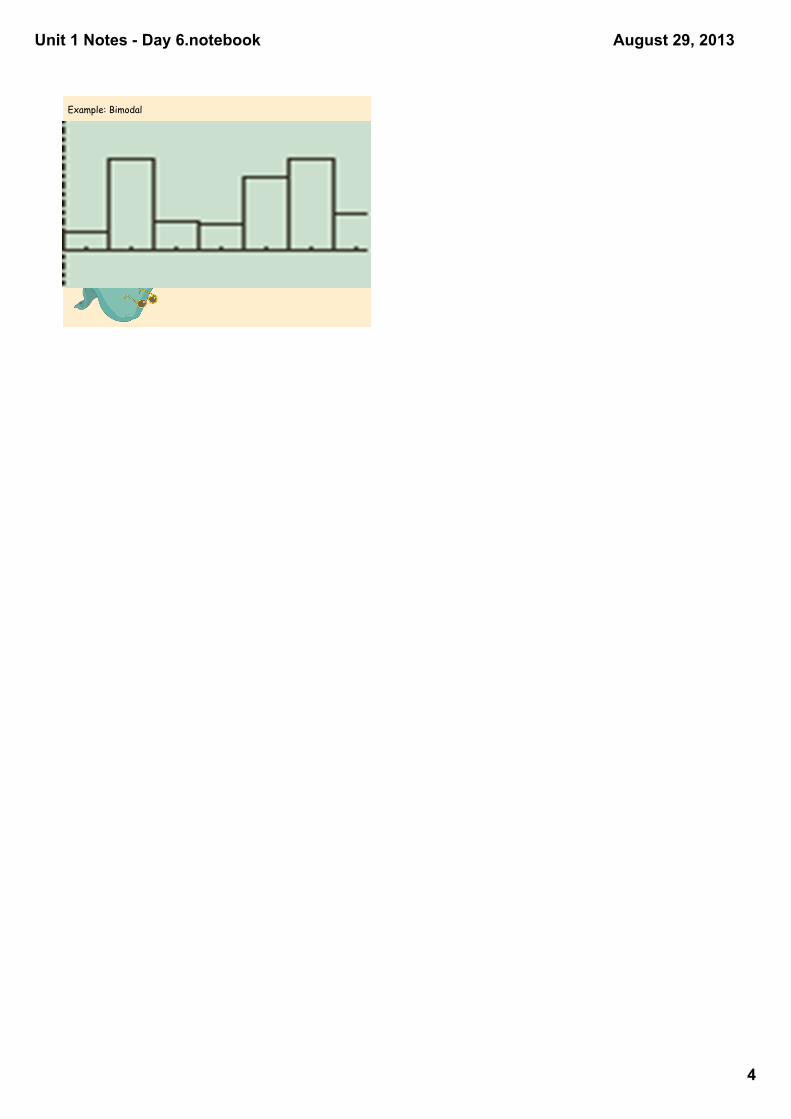
• Bimodal
You need to be able to recognize and name the shape of the histogram.
Example: Normal Example: Uniform or Rectangular
Example: Left Skew Example: Right Skew
Unit 1 Notes Day 6.notebook
4
August 29, 2013
Example: Bimodal