UNIT 1: Basic Economic Concepts
33
UNIT 1: Basic Economic Concepts
description
UNIT 1: Basic Economic Concepts. The Economizing Problem… Scarcity. SOCIETY HAS VIRTUALLY UNLIMITED WANTS. BUT LIMITED OR SCARCE PRODUCTIVE RESOURCES!. Analyzing Choices. Given the following assumptions, make a rational choice in your own self-interest (hold everything else constant)…. - PowerPoint PPT Presentation
Transcript of UNIT 1: Basic Economic Concepts
UNIT 1: Basic Economic Concepts
SOCIETY HAS VIRTUALLYUNLIMITED WANTS...
The Economizing Problem…Scarcity
BUT LIMITED OR SCARCEPRODUCTIVE RESOURCES!

Analyzing Choices
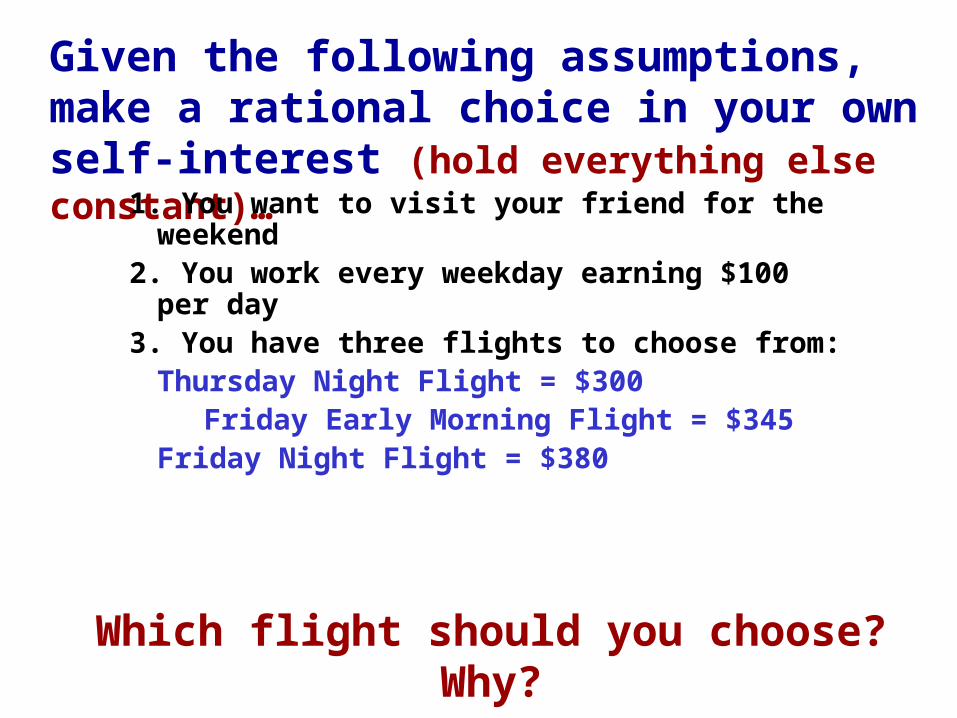
Given the following assumptions, make a rational choice in your own self-interest (hold everything else constant)…
1. You want to visit your friend for the weekend2. You work every weekday earning $100 per
day3. You have three flights to choose from:
Thursday Night Flight = $300Friday Early Morning Flight = $345
Friday Night Flight = $380
Which flight should you choose? Why?
Trade-offsALL decisions involve trade-offs.
The most desirable alternative given up as a result of a decision is known as opportunity cost.
Trade-offs are all the alternatives that we give up whenever we choose one course of action over others.
(Examples: going to the movies)
What are trade-offs of deciding to go to college? What is the opportunity cost of going to college?
The Production Possibilities Curve
(PPC)Using Economic Models…
Step 1: Explain concept in wordsStep 2: Use numbers as examplesStep 3: Generate graphs from numbersStep 4: Make generalizations using graph
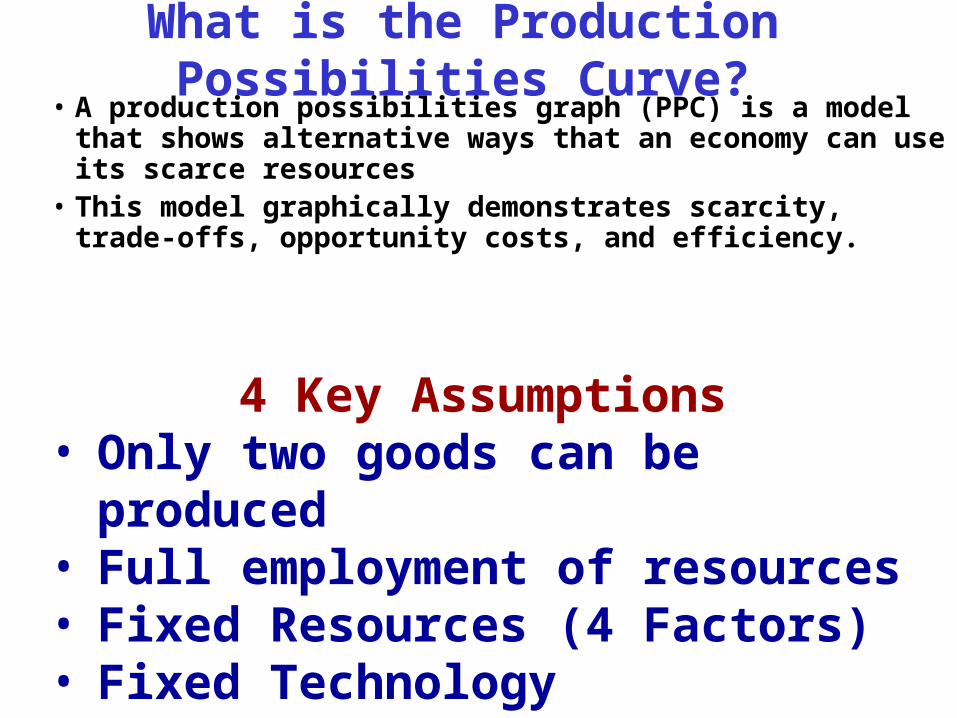
What is the Production Possibilities Curve?• A production possibilities graph (PPC) is a model that shows
alternative ways that an economy can use its scarce resources• This model graphically demonstrates scarcity, trade-offs,
opportunity costs, and efficiency.
4 Key Assumptions• Only two goods can be produced • Full employment of resources• Fixed Resources (4 Factors)• Fixed Technology
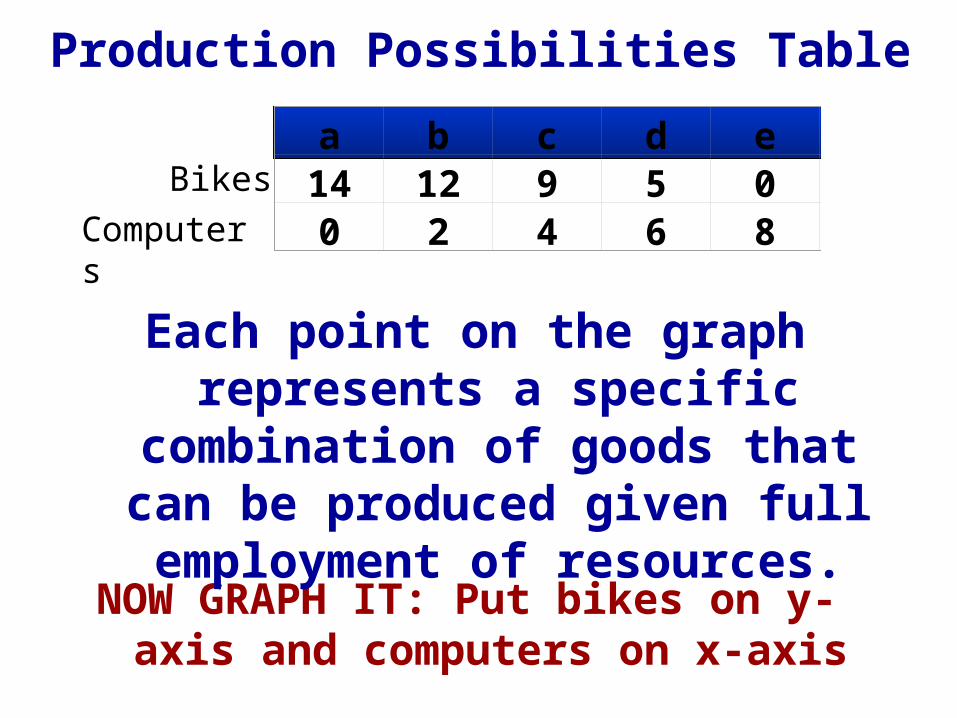
a b c d e f14 12 9 5 0 00 2 4 6 8 10
BikesComputers
NOW GRAPH IT: Put bikes on y-axis and computers on x-axis
Production Possibilities Table
Each point on the graph represents a specific combination of goods that can be produced given full employment of
resources.
Bik
es
Computers
14
12
10
8
6
4
2
00 2 4 6 8 10
A
B
C
D
E
G
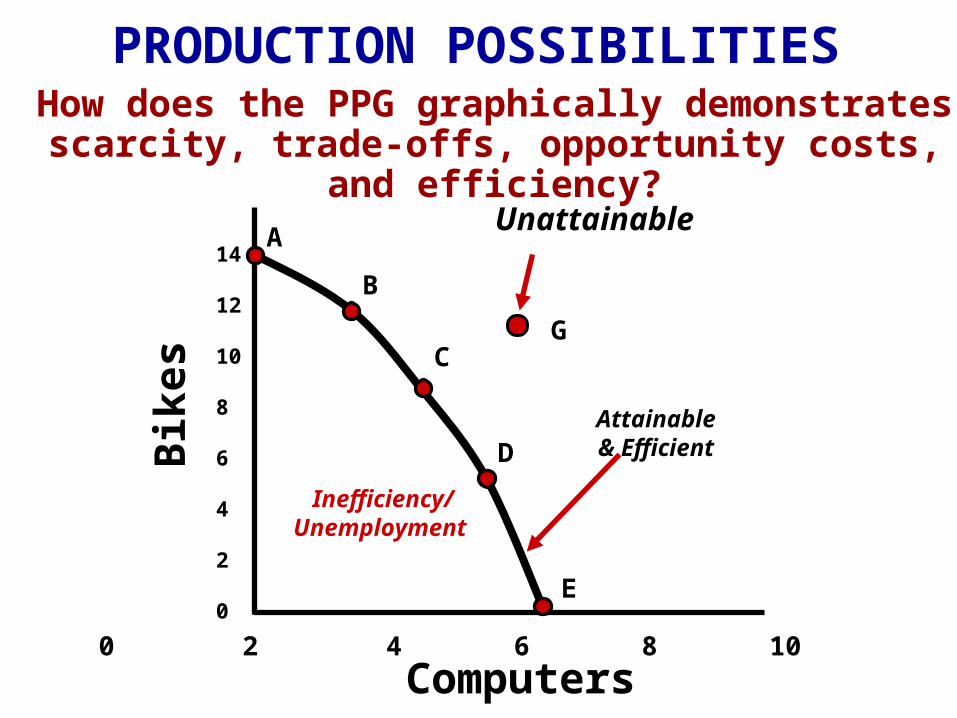
Inefficiency/ Unemployment
Unattainable
Attainable& Efficient
PRODUCTION POSSIBILITIESHow does the PPG graphically demonstrates scarcity,
trade-offs, opportunity costs, and efficiency?
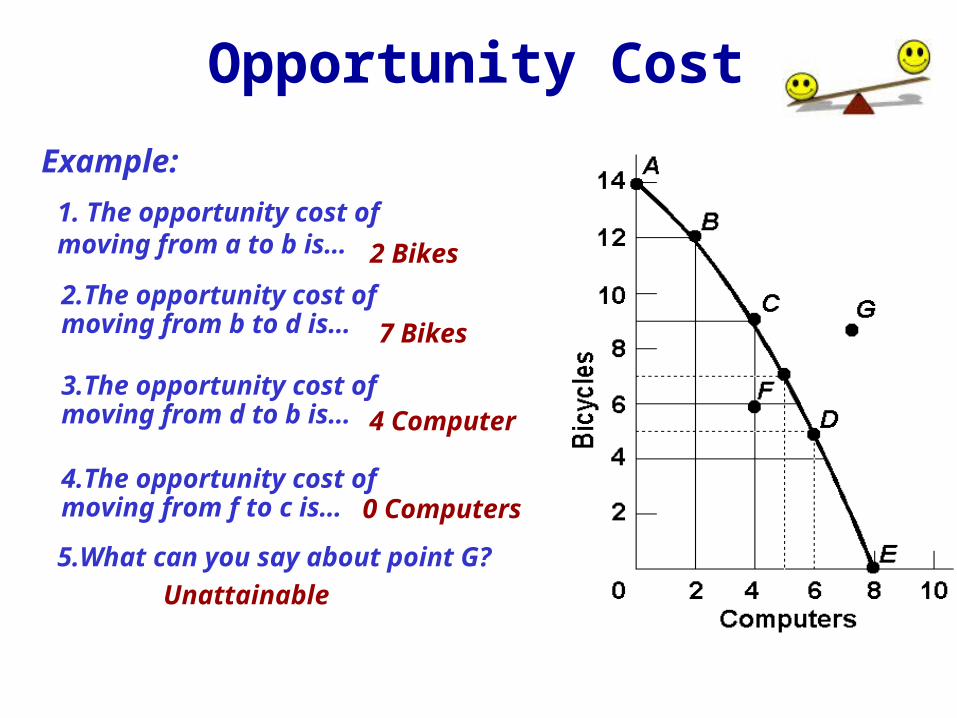
2 Bikes2.The opportunity cost of moving from b to d is…
4.The opportunity cost of moving from f to c is…
3.The opportunity cost of moving from d to b is…
7 Bikes
4 Computer
0 Computers
5.What can you say about point G?Unattainable
1. The opportunity cost of moving from a to b is…
Example:
Opportunity Cost
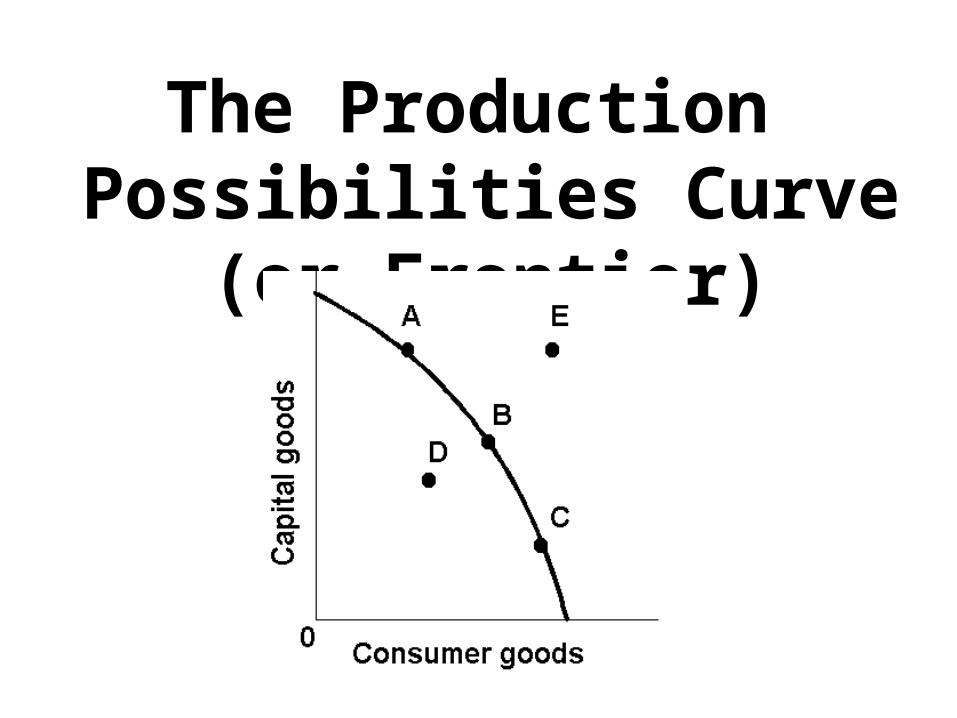
The Production Possibilities Curve (or Frontier)
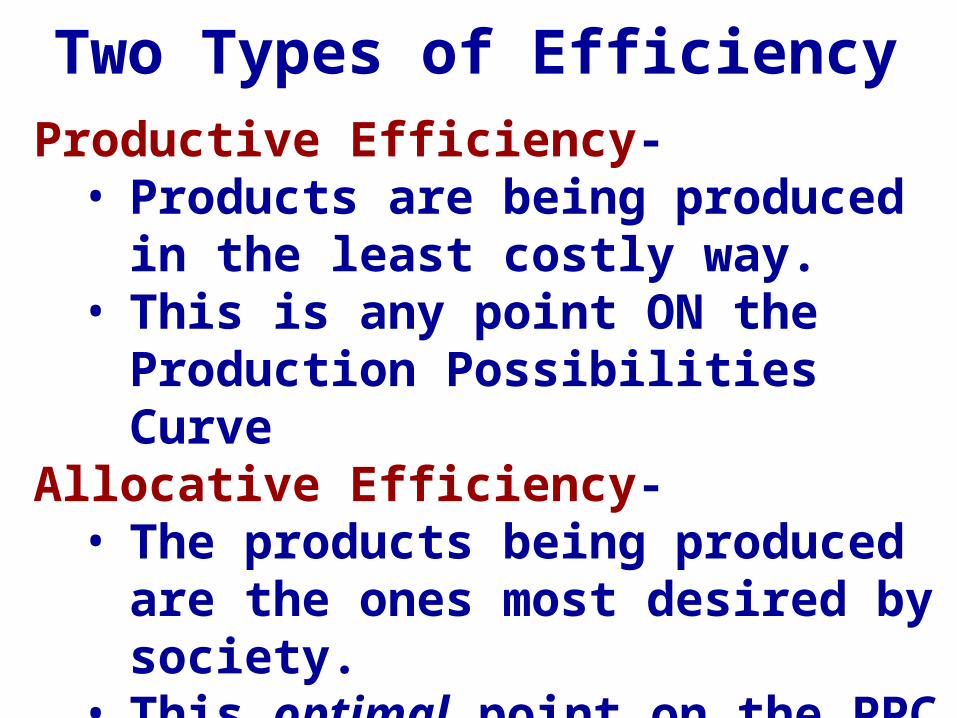
Productive Efficiency- • Products are being produced in the
least costly way. • This is any point ON the Production
Possibilities CurveAllocative Efficiency-
• The products being produced are the ones most desired by society.
• This optimal point on the PPC depends on the desires of consumers.
Two Types of Efficiency
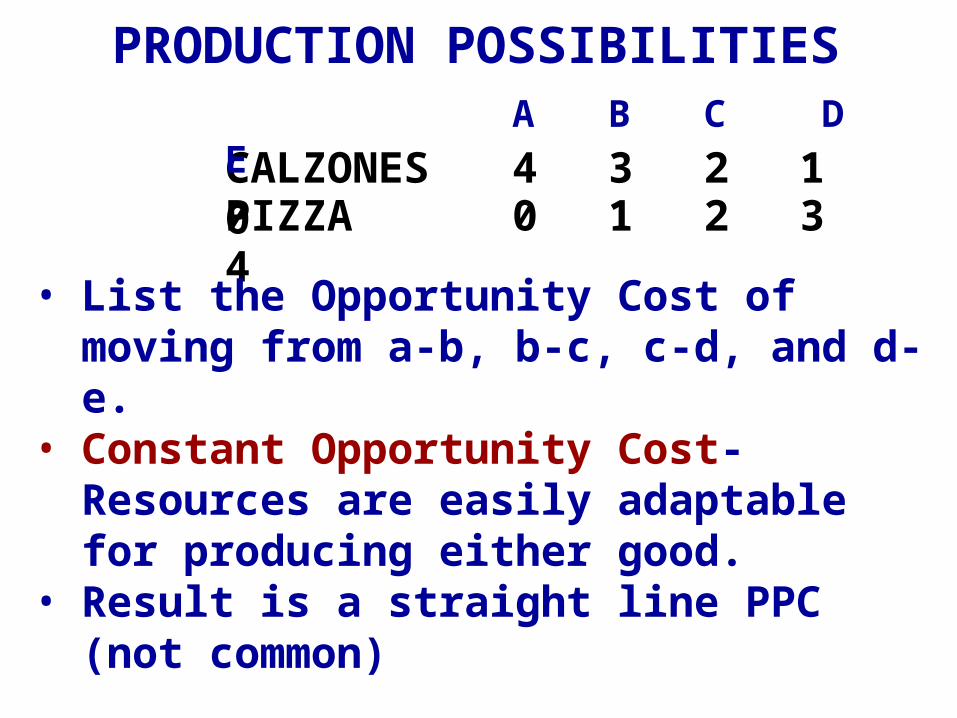
PIZZA 0 1 2 3 4CALZONES 4 3 2 1 0
• List the Opportunity Cost of moving from a-b, b-c, c-d, and d-e.
• Constant Opportunity Cost- Resources are easily adaptable for producing either good.
• Result is a straight line PPC (not common)
PRODUCTION POSSIBILITIESA B C D E
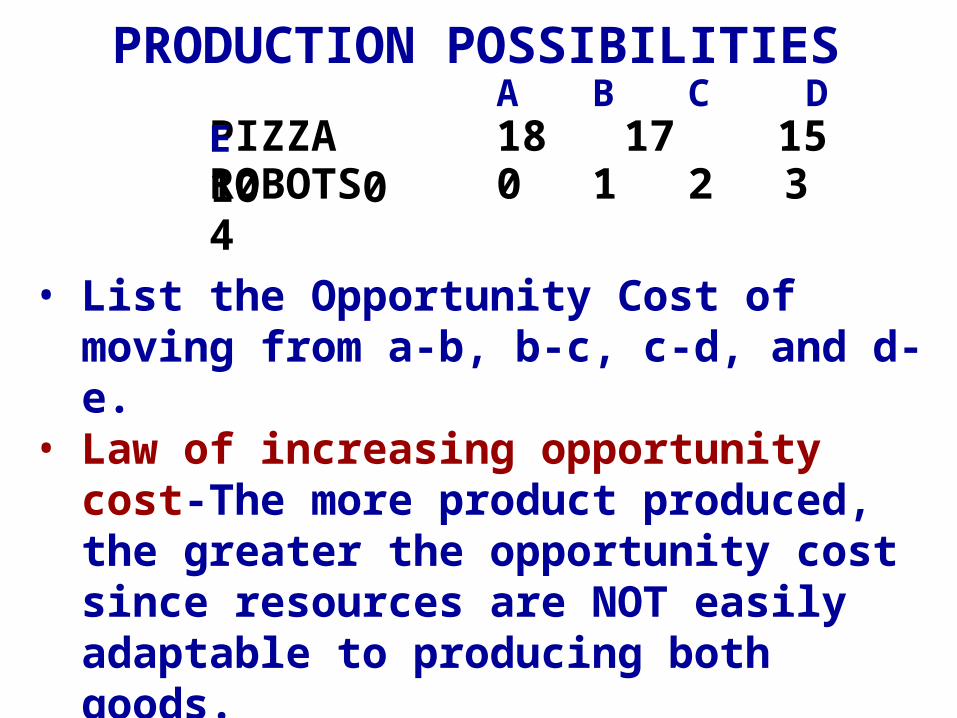
PIZZA 18 17 15 10 0ROBOTS 0 1 2 3 4
• List the Opportunity Cost of moving from a-b, b-c, c-d, and d-e.
• Law of increasing opportunity cost-The more product produced, the greater the opportunity cost since resources are NOT easily adaptable to producing both goods.
• Result is a bowed out (Concave) PPC
A B C D EPRODUCTION POSSIBILITIES
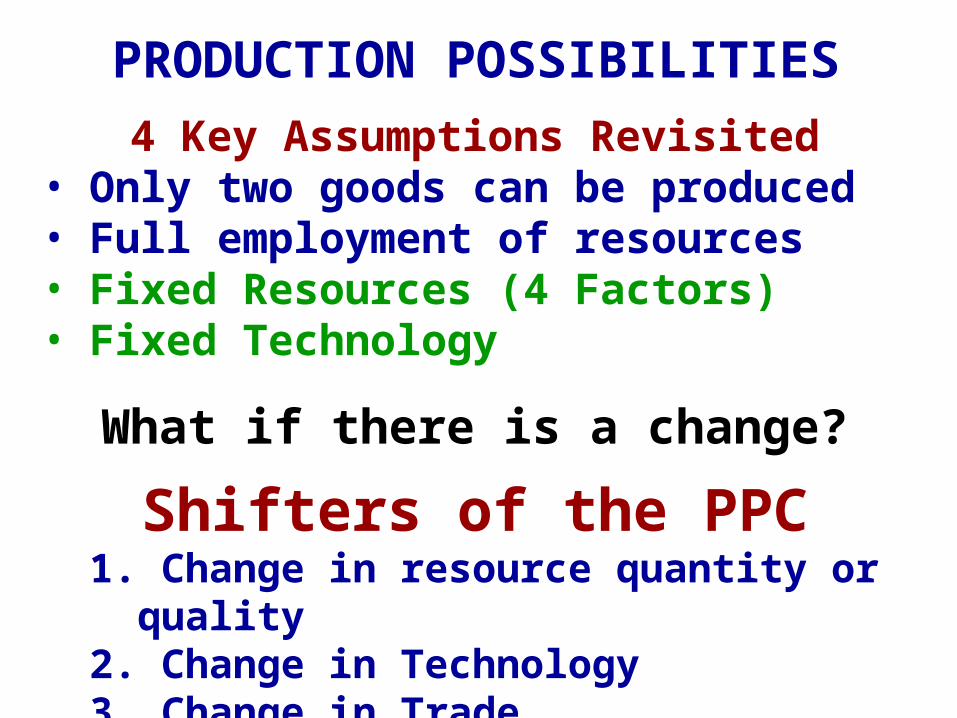
PRODUCTION POSSIBILITIES4 Key Assumptions Revisited
• Only two goods can be produced • Full employment of resources• Fixed Resources (4 Factors)• Fixed Technology
What if there is a change?
Shifters of the PPC1. Change in resource quantity or quality 2. Change in Technology3. Change in Trade
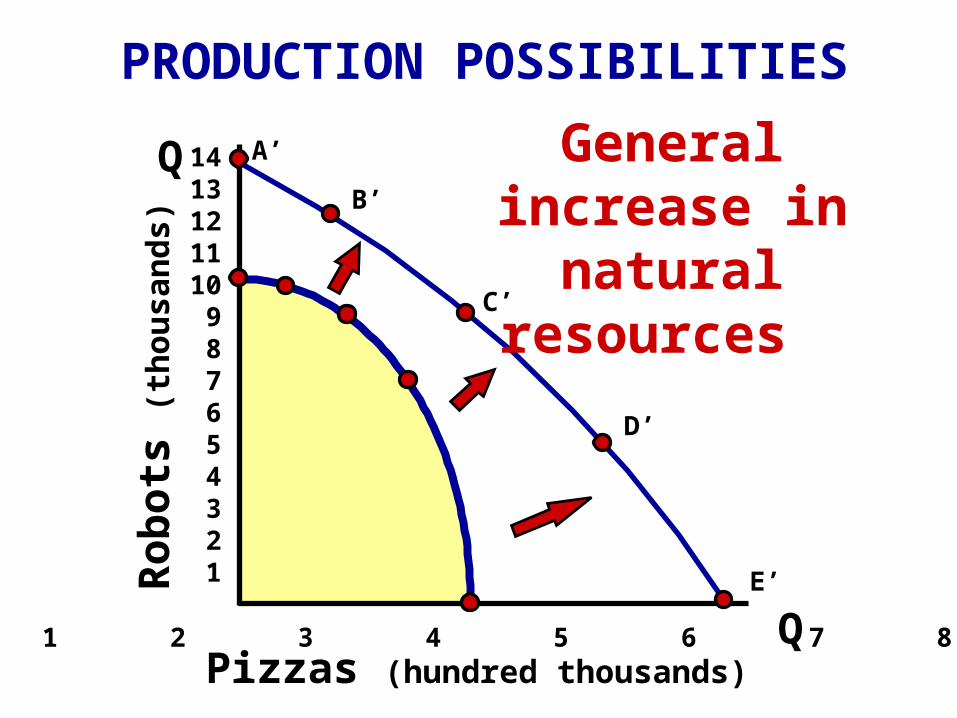
PRODUCTION POSSIBILITIES
Q
Q
Rob
ots
(thou
sand
s)
Pizzas (hundred thousands)
1413121110 9 8 7 6 5 4 3 2 1
1 2 3 4 5 6 7 8
A’
B’
C’
D’
E’
General increase in natural resources
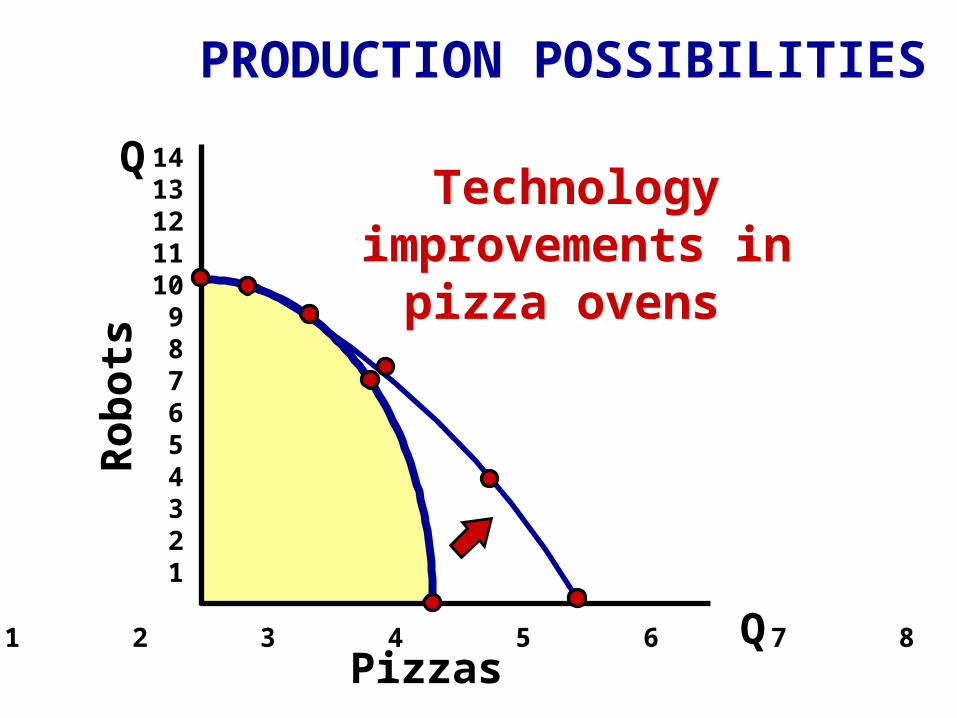
Technology improvements in pizza
ovens
Q
Q
Rob
ots
Pizzas
1413121110 9 8 7 6 5 4 3 2 1
1 2 3 4 5 6 7 8
PRODUCTION POSSIBILITIES
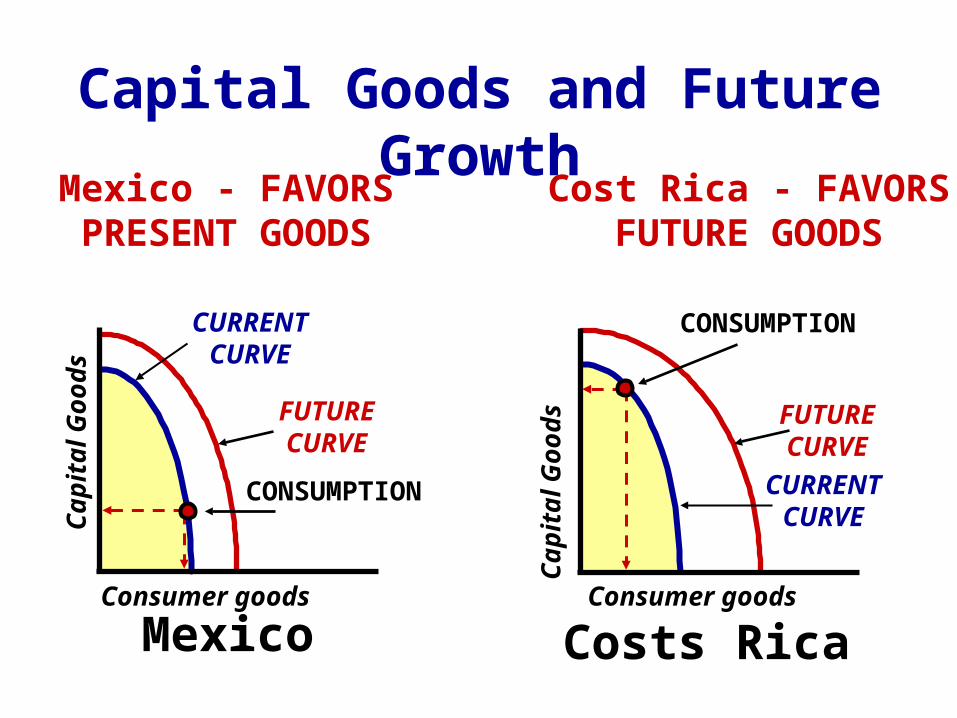
Mexico - FAVORSPRESENT GOODS
Cost Rica - FAVORSFUTURE GOODS
Consumer goods
Cap
ital G
oods
CURRENTCURVE
FUTURECURVE
CONSUMPTION
Consumer goodsC
apita
l Goo
ds FUTURECURVE
CONSUMPTION
CURRENTCURVE
Capital Goods and Future Growth
Mexico Costs Rica
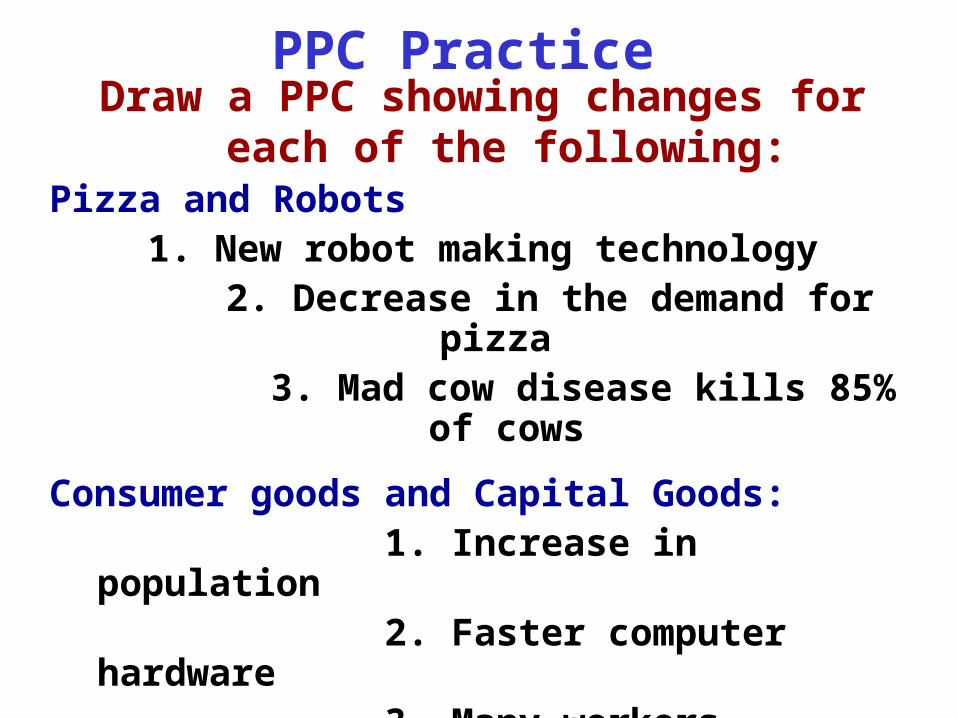
PPC PracticeDraw a PPC showing changes for each of the
following:Pizza and Robots
1. New robot making technology 2. Decrease in the demand for pizza
3. Mad cow disease kills 85% of cows
Consumer goods and Capital Goods: 1. Increase in population 2. Faster computer hardware 3. Many workers unemployed 4. Significant increases in education
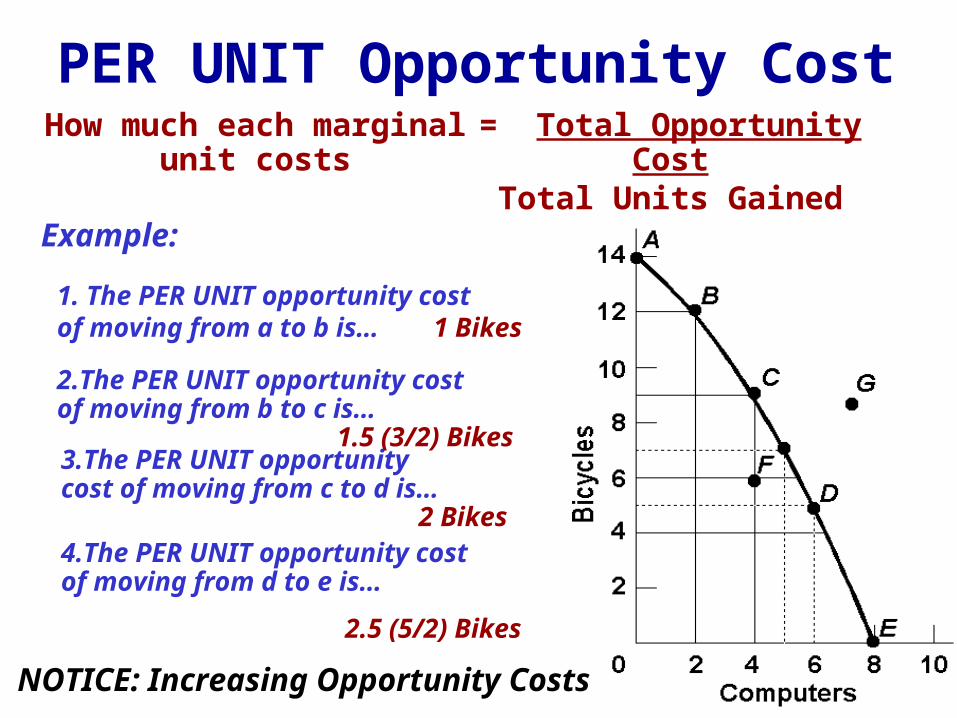
1 Bikes
2.The PER UNIT opportunity cost of moving from b to c is…
4.The PER UNIT opportunity cost of moving from d to e is…
3.The PER UNIT opportunity cost of moving from c to d is…
1.5 (3/2) Bikes
2 Bikes
2.5 (5/2) Bikes
= Total Opportunity CostTotal Units Gained
1. The PER UNIT opportunity cost of moving from a to b is…
Example:
PER UNIT Opportunity CostHow much each marginal
unit costs
NOTICE: Increasing Opportunity Costs
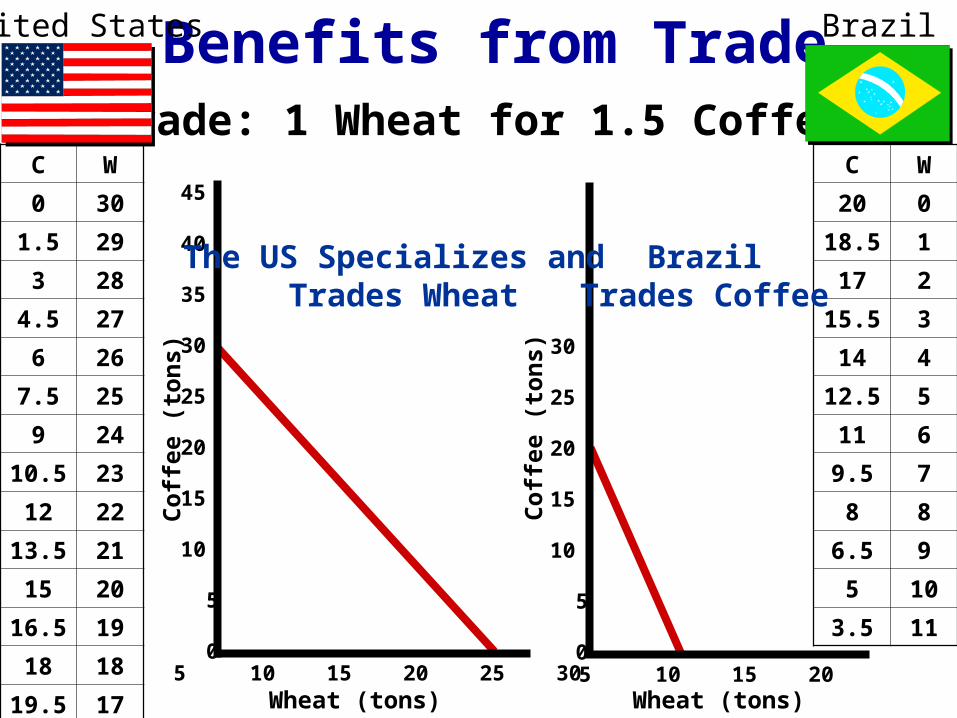
Benefits from TradeTrade: 1 Wheat for 1.5 Coffee
Cof
fee
(tons
)
Cof
fee
(tons
)
45
40
35
30
25
20
15
10
5
0
30
25
20
15 10 5
05 10 15 20 25 30 5 10 15 20
Wheat (tons) Wheat (tons)
United States Brazil
C W0 30
1.5 293 28
4.5 276 26
7.5 259 24
10.5 2312 22
13.5 2115 20
16.5 1918 18
19.5 17
C W20 0
18.5 117 2
15.5 314 4
12.5 511 69.5 78 8
6.5 95 10
3.5 11
The US Specializes and Trades Wheat
BrazilTrades Coffee
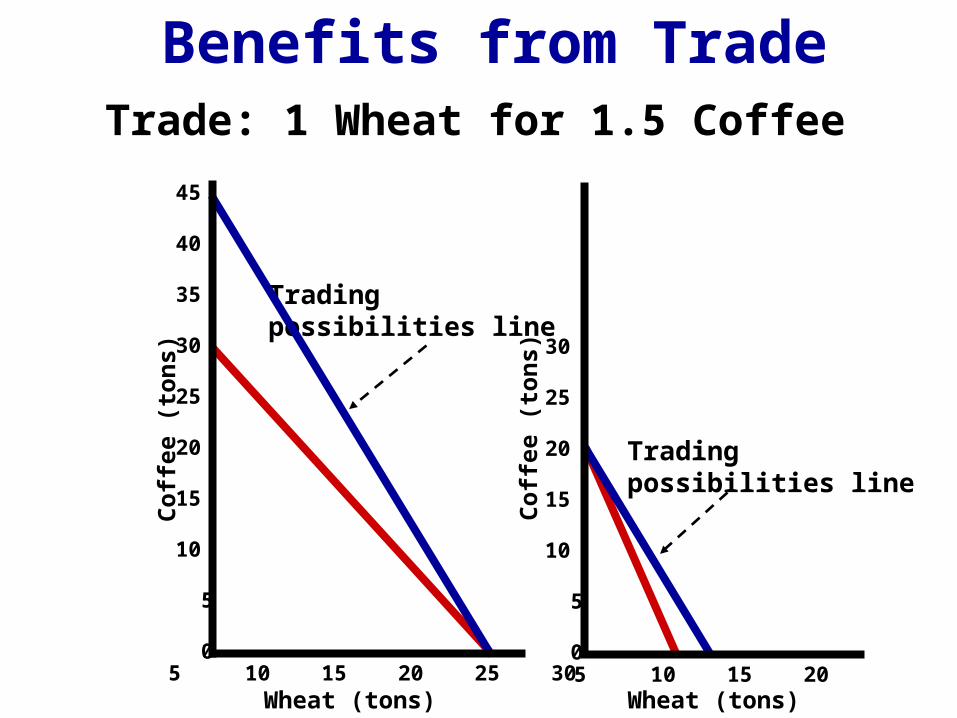
Benefits from TradeTrade: 1 Wheat for 1.5 Coffee
Cof
fee
(tons
)
Cof
fee
(tons
)
45
40
35
30
25
20
15
10
5
0
30
25
20
15 10 5
05 10 15 20 25 30 5 10 15 20
Tradingpossibilities line
Tradingpossibilities line
Wheat (tons) Wheat (tons)
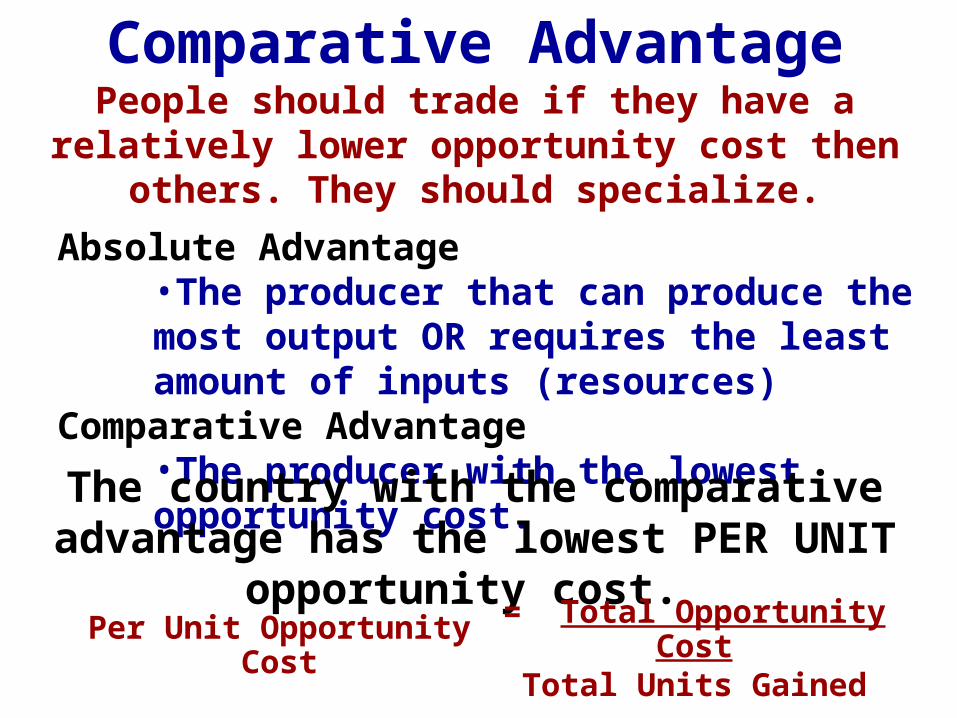
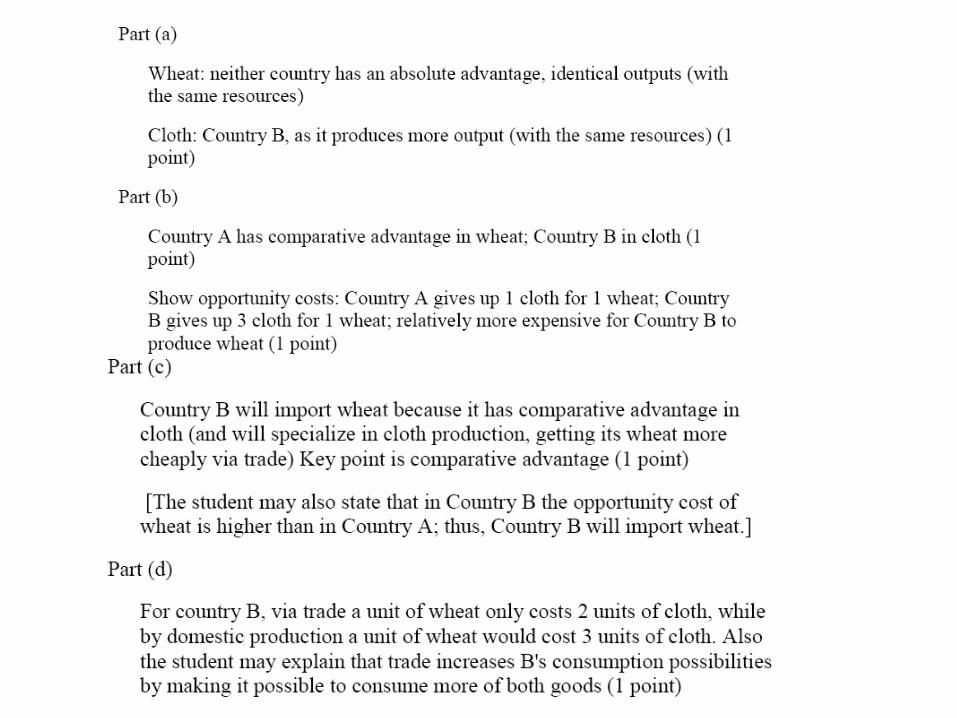
Comparative AdvantagePeople should trade if they have a relatively lower
opportunity cost then others. They should specialize.Absolute Advantage
•The producer that can produce the most output OR requires the least amount of inputs (resources)
Comparative Advantage•The producer with the lowest opportunity cost.
The country with the comparative advantage has the lowest PER UNIT opportunity cost.
= Total Opportunity CostTotal Units Gained
Per Unit Opportunity Cost
Cof
fee
(tons
)
Cof
fee
(tons
)
45
40
35
30
25
20
15
30
25
20
15 10
5 10 15 20 25 30 5 10 15 20Wheat (tons) Wheat (tons)
United States Brazil
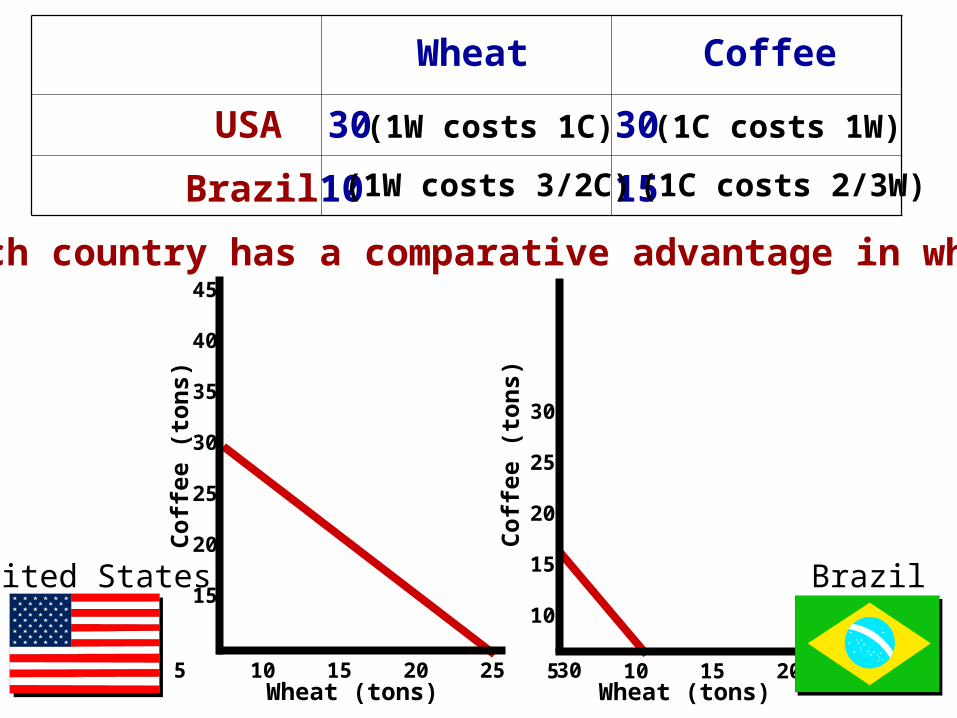
USABrazil
Wheat Coffee
30 3010 15
(1W costs 1C) (1C costs 1W)
(1W costs 3/2C) (1C costs 2/3W)
Which country has a comparative advantage in wheat?
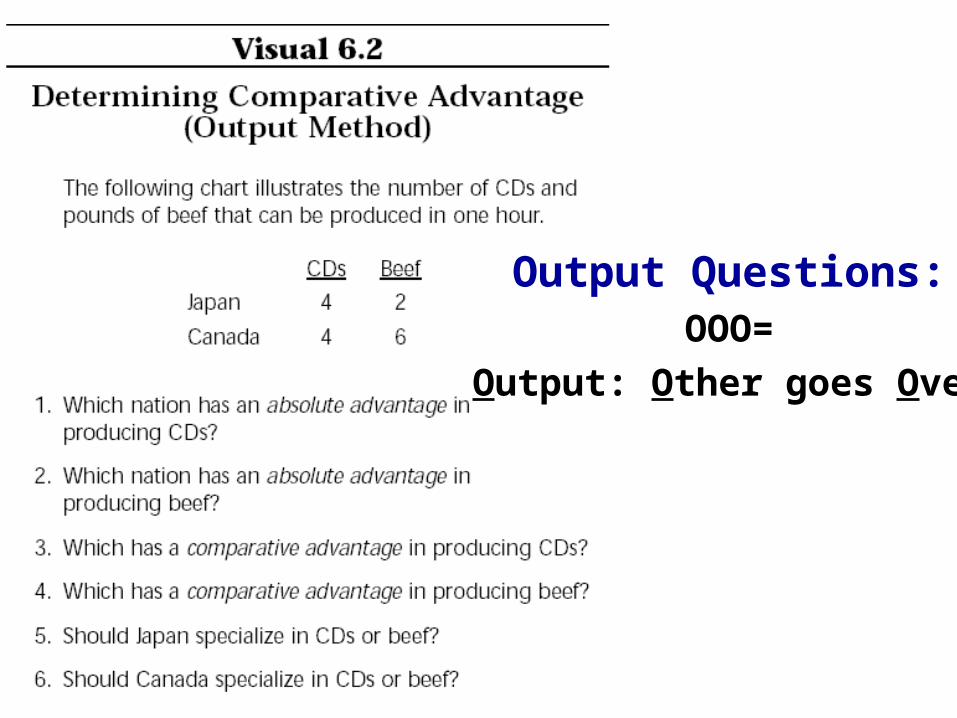
Output Questions:OOO=
Output: Other goes Over
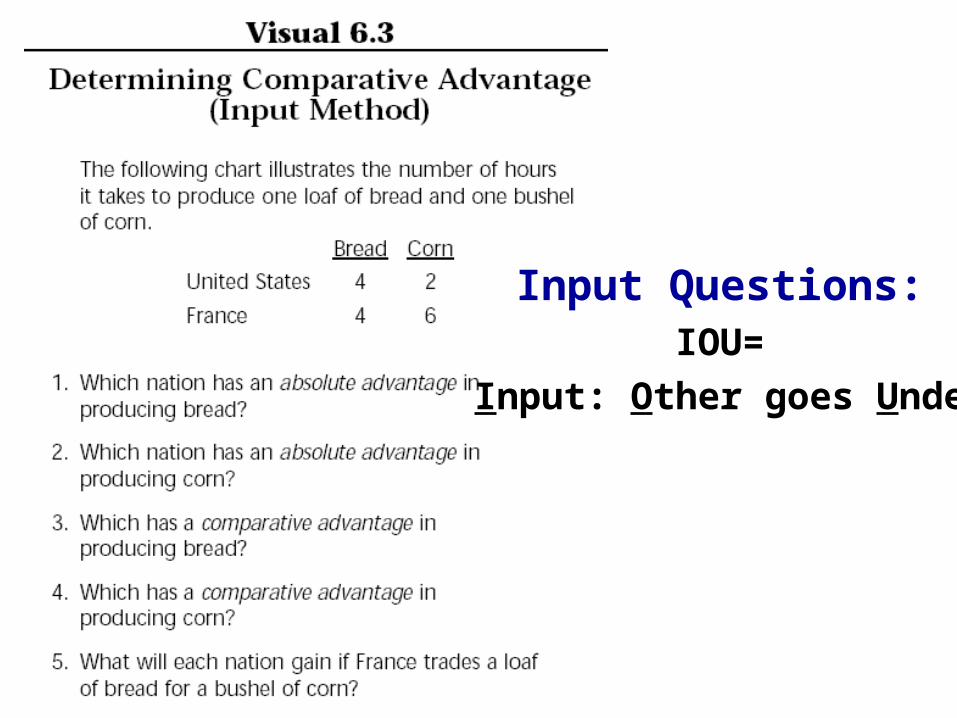
Input Questions:IOU=
Input: Other goes Under
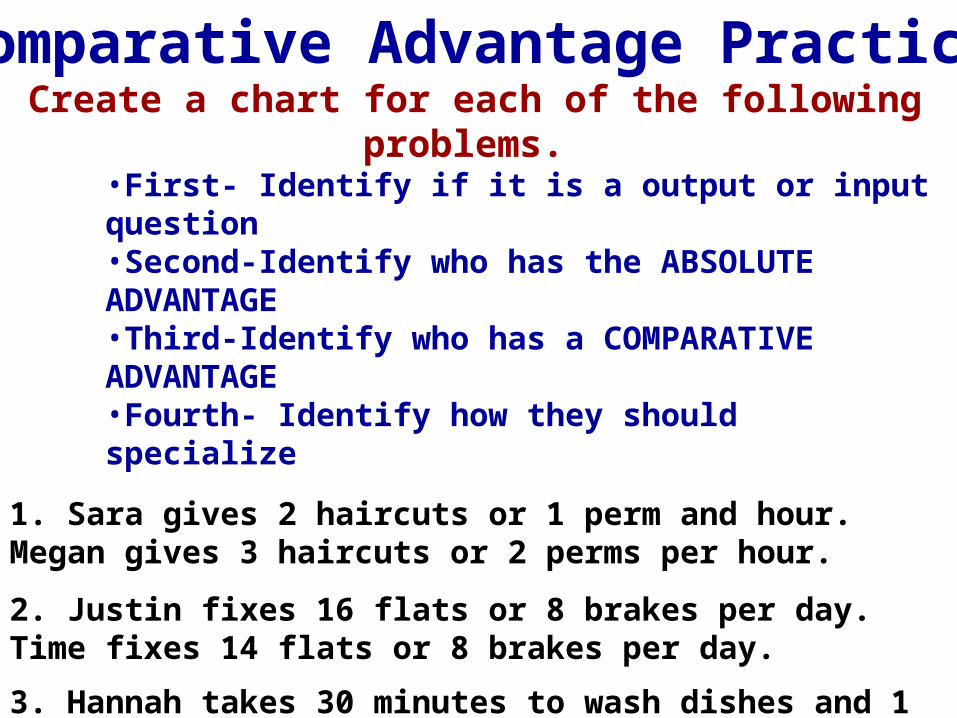
Comparative Advantage PracticeCreate a chart for each of the following problems.
•First- Identify if it is a output or input question •Second-Identify who has the ABSOLUTE ADVANTAGE•Third-Identify who has a COMPARATIVE ADVANTAGE•Fourth- Identify how they should specialize
1. Sara gives 2 haircuts or 1 perm and hour. Megan gives 3 haircuts or 2 perms per hour.
2. Justin fixes 16 flats or 8 brakes per day. Time fixes 14 flats or 8 brakes per day.
3. Hannah takes 30 minutes to wash dishes and 1 hour to vacuum the house. Kevin takes 15 minutes to wash dishes and 45 minutes to vacuum.
4. Americans produce 50 computers or 50 TVs per hour. Chinese produce 30 computers or 40 TVs per hour.

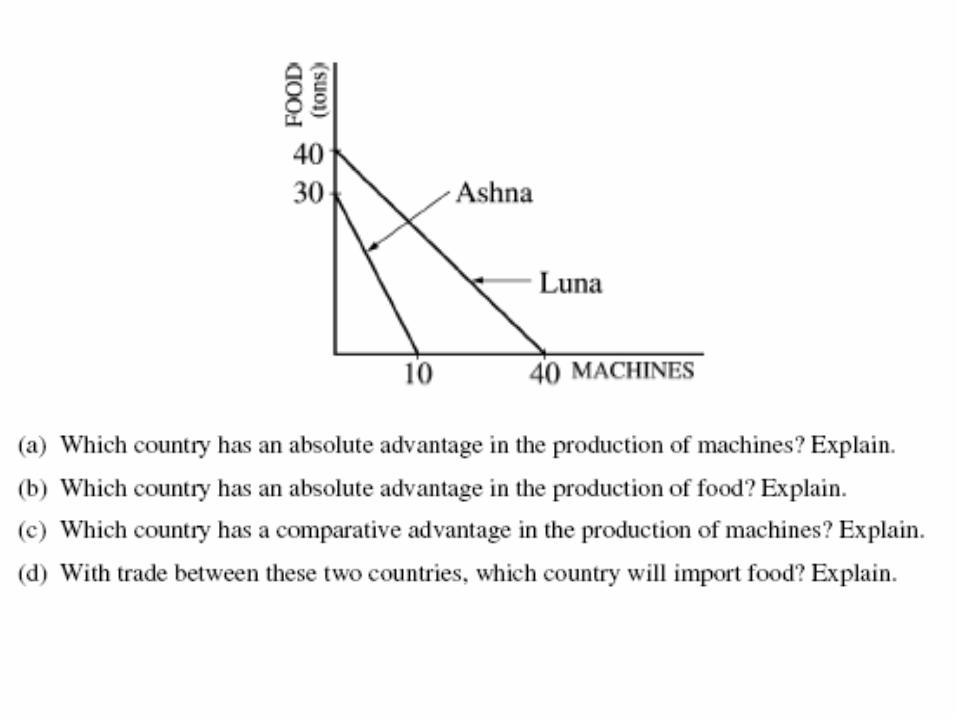
Practice FRQs

Memorizing vs. LearningMemorizing vs. Learning123571113171923
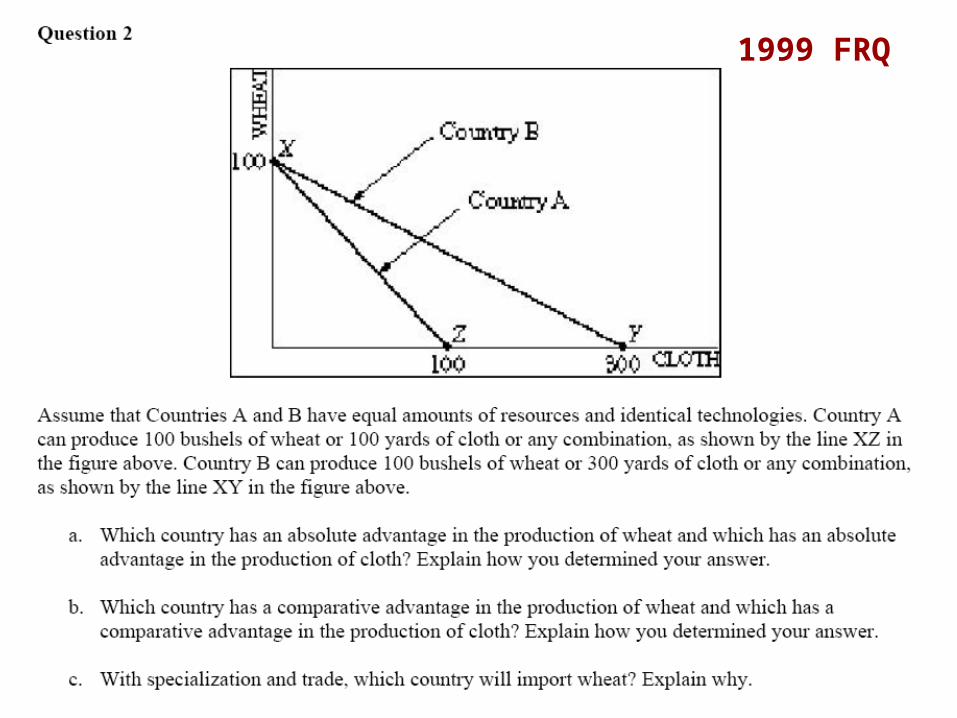
1999 FRQ