UNIPOL GROUP PRESENTATION · XFounded in 1963, and having commenced activities in 1968, the Unipol...
30
1 UNIPOL GROUP PRESENTATION March 2006
-
Upload
nguyenkien -
Category
Documents
-
view
215 -
download
2
Transcript of UNIPOL GROUP PRESENTATION · XFounded in 1963, and having commenced activities in 1968, the Unipol...

1
UNIPOL GROUP PRESENTATION
March 2006

2
Introduction: Unipol Group highlights and historyIntroduction: Unipol Group highlights and historyII
Agenda
II
Unipol Banca and the integrated network modelIII
Unipol Groups: results

3
The Unipol Group - Overview
Founded in 1963, and having commenced activities in 1968, the Unipol Group today ranks fourth in the Italian insurance market in terms of premium income.
Operating not only in the traditional Life and Non-Life insurance business sectors, but also in the supplementary pension and health schemes sectors, Unipol recorded an aggregate income from insurance business of over €10.7bn in 2005, of which:
63% in Life business (of which 55%from bancassurance companies)
37% in Non—Life business (of which over 60% in Motor business)
In 2005 around 45% of the Group’s Life insurance income derived from BNL Vita, a 50% joint venture between Unipol and BNL.
Thanks to a distribution network of almost 1,800 agencies and 4,500 sales points, the Group operates throughout Italy with around 6.5 million customers, also by way of innovative distribution channels, such as the internet and telephone (through its subsidiary Linear, one of the leading companies in this sector)
As from 1999 and following a precise strategic growth plan, the Group entered the banking business by acquiring a small credit institution which had 13 branches, and was subsequently renamed Unipol Banca.
Unipol Banca today has 250 branches throughout Italy; it is characterized by considerable growth rates and, above all, by the peculiar and successful development of the distribution network, based on the integration of banking branches and insurance agencies.

4
Strategic Agreement Unipol Group – BNP Paribas Group
On february 3rd, 2006 Unipol Assicurazioni and BNP Paribas reached an agreement forthe disposal of 48% of BNL share capital held by the Company and its financial partners, at € 2,925 per share.
Once acquired the aforesaid shares, BNP Paribas will launch a public tender offer on 100% of BNL at the same price offered to Unipol and its financial partners.
Unipol will acquire 1% of BNL Vita share capital from BNL and will strenghtenimportant commercial agreements with BNL, expecially in the bancassurance sector.
Unipol will become BNP Paribas’ privileged insurance partner in Italy, developing a strategic cooperation, expecially focused on:
Non-Life Insurance;
Supplementaty Pension Schemes.
BNP Paribas will acquire a 4,5% stake in the share capital of FINSOE.
The suspensive conditions assuring the financial efficacy of the agreement are the following:
Approval of the agreement by BoD of the companies involved (already held);
MTO launched by Unipol lapsing or becoming ineffective (already occurred – see Consob notice dated february 9th, 2006);
All relevant Authorities giving any furhter authorisations or approvals as deemednecessary for BNP Paribas acquiring control over BNL.

5
The Unipol Group today
COMPANY BUSINESS/CHANNEL
Life / BAM branches (MPS Group)
Mutual funds / Unipol Banca
Non-exclusive agents /brokers
Health / agreements, internet
Motor / telephone,
** Non-Life + Life / agenciesBank / branches, Fin. counters,Fin. advisers
Merchant bankingand medium-term loans
Life / BNL branches
BUSINESS / CHANNEL
*
* Operating company and parent company.** Unipol Assicurazioni also sells its Life products through Unipol Banca outlets.
BUSINESS / CHANNEL
INSURANCE BUSINESS BANCASSURANCE BUSINESS BANKING, ASSET MANAGEMENTAND MERCHANT BANKING
COMPANY COMPANY
Asset management
Non-Life + Life / agencies
internet
Group Holding

6
Shareholding structure
Stake of stable shareholding: 50.2% of
ordinary shares(32% of total capital)
100 % of preference shares
Total number of UNIPOL ASSICURAZIONI shares, as at today’s date: 2,360,144,410
Core shareholder
1,460,524,546ordinary shares(62% of total capital)
preference shares(38% of total capital)
MARKET
49.8 % of ordinary shares
Ordinaryshares
Preferenceshares
899,619,864
60.7% 27.8% 5.4% 4.6%
STRATEGIC PARTNERS
1.42%
HOLMO MPS Group HOPA P&V Group(BE)
JP MORGAN(USA)

7
Ranking in the insurance sector (2004)
NON-LIFE PREMIUMS (€/m) LIFE PREMIUMS (€/m) TOTAL PREMIUMS (€/m)
775
1,200
1,341
1,398
1,767
2,254
4,005
5,491
5,804
6,990
2.2%
3.4%
3.8%
3.9%
5.0%
6.4%
11.3%
15.5%
16.4%
19.7%
Sara
Axa
Zurigo
Cattolica
RealeMutua
Toro
Unipol
Allianz Ras
Generali
Fondiaria -Sai
106
479
517
679
797
2,687
3,381
5,718
8,501
16,540
0.2%
0.7%
0.8%
1.0%
1.2%
4.1%
5.2%
8.7%
13.0%
25.2%
Sara
Toro
RealeMutua
Axa
Zurigo
Fondiaria -Sai
Cattolica
Unipol
Allianz Ras
Generali
881
1,879
2,138
2,284
2,733
4,779
9,677
9,723*
13,992
22,344 22.1%
13.8%
9.6%
9.6%
4.7%
2.7%
2.3%
2.1%
1.9%
0.9%Sara
Axa
Zurigo
RealeMutua
Toro
Cattolica
Fondiaria -Sai
Unipol
Allianz Ras
Generali
= Market share
* Including premium income of the Mutuelles du Mans Assurance Group

8
32
14
Distribution networks as at 2005
Unipol Group agency network
7
55
34
9257
4
12 9
31
830
8
2
11 1
UNIPOL Banca network
10
5952
45
98
169
3324
313 141
87
136195
134
108
48
4
39
250 branches (129 of which are co-located with insurance agencies)
45 financial counters300,000 customers
1,741 agencies~ 4,500 sales points6.3 million customers
Capillary presence throughout ItalyPresence in all the main townsHigh average number of customers per agency
Bank Insurance
43%
31%
25%
52%
25%
23%
Network growing stronglyPresence throughout Italy according to ‘spotted’model

9
1999-2004 - Insurance business trend
Total investments: €2,189mTotal acquired premiums : €4,305mTotal acquired customers: 3,200,000
IN 6 YEARS THE GROUP SIZE HAS INCREASED 6-FOLD
Group premiums (Italian GAAP, €/m)
9,723
CAGR 99/05:+35%
90% CreditSuisse
ACQUISITIONS - 2003
Total premiums: €1,931m
Total assets
: €5,971m
Total invested: €1,319m
7,463
2000 2003 20041999
the Group ranks 8th
(2.9% market share)
MERGER - 2004
+
Total premiums: ~ €3,300m
Total assets: ~ €9,800m
ACQUISITIONS - 2004Acquired 100% of MMI Group from Mutuellesdu Mans Assurances §(premiums €140mn)
the Group ranks 3rd
(9.6% market share)
2005 Prec.
> 10,700*
* 8,2 €/bnIAS/IFRS compliant
4,2911,812
Acquiredcompany
Acquiredshare Vendor
51.4% TELECOM
100% GENERALI
98.2% GENERALI
50% GENERALI
(PTO) on 23.1% Market
Total premiums: €2,234m
Total assets : €6,300m
Total invested: €812m
ACQUISITIONS - 2000

10
Integration of the main companies acquired
Acquisition Merger
+
Acquisition Merger
+
2000
Total premiums:€1,044m
Life premiums / Total premiums: 23.4%
Agencies: 718
Combined ratio: 112.8%
Tech. account (Non-Life + Life): -€18.4m
Restructuring and reorganization
IT migration to Unipol system
Centralizing key functions
Streamlining portfolio and rationalizing sales network
Claims handling at Group level
2003
Total premiums:€1,238m
Life premiums / Total premiums: 34.3%
Agencies: 502
Combined ratio: 95.6%
Tech. account (Non-Life + Life): €43.5m
Centralizing finance and real estate management
Restructuring the supply chain
Extension of Unipol IT system to Winterthur
Streamlining human resources
Implementing restructuring process
One claims settlement system only
2004
Total premiums: €3,276m
Life Premiums / Total premiums: 34.5%
Agencies: 1,243
Combined ratio: 92.4%
Tech. account (Non-Life + Life): €221m
Net profit/loss
-€13.1m
Net profit€38.3m
(+27% over 2002)
Net profit €145m
(+12% over 2003)
Return on invested equity in the acquisitions of Meie, Aurora and Winterthur
20035.19%
20047.56%

11
Introduction: Unipol Group highlights and historyI
Agenda
IIII
Unipol Banca and the integrated network modelIII
Unipol Groups: resultsUnipol Groups: results

12
Consolidated Key Financials
MARKET SHARES COMBINED RATIO
TOTAL INVESTMENTS (INSURANCE) CUSTOMER DEPOSITS (BANK) NET PROFIT
2,2282,628
> 4,800
2002 2003 2005 Prel.
(€/m)(€/bn)
LifeN-L
7.0%
8.0%
9.0%
10.0%
11.0%
2003 2004
18
2629
2002 2003 2004
PREMIUMS – DIRECT BUSINESS*Italian GAAP
95.5%
93.2%93.2%
93.0%
93.5%
94.0%
94.5%
95.0%
95.5%
96.0%
2002 2003 2004
Non-Life
7,463
9,583~10,700
2,813
3,866 ~4,0004,650
5,717
~ 6,800
2003 2004 2005 Prel.Life
(€/m)
10,9% 10,9%
7,4%
8,7%
8,2%
(€/m)
211(Ital.
GAAP)
2003 2004(Italian GAAP)
147
244
2005 Prel.(IAS/IFRS)
(IAS/IFRS)
In line with2004
9,0%
* The figures corrspond to the Premium Income according to the Italian GAAP, in force until 2004.
2005 Prel.

13
Results as at 3Q 2005: key financials (IAS compliant)
COMBINED RATIO(italian GAAP)
71.9% 73.0%
23.4%23.0%
96.5%94.9%
9 M 2004 9 M 2005
Loss Ratio Expense Ratio
€/m
9 M 2004 9 M 2005
Life premiumsand inv.nt products
Non-Life premiums
+9.6%
2,856
2,763
3,358
2,731
5,5876,121
INSURANCE INCOME DIRECT BUSINESS
INVESTMENTS
€/m32,462
28,577
F. Y. 2004 9 M 2005
+13.6%
NET GROUP PROFIT
€/m
159
273
9 M 2004
+72%
9 M 2005
TECHNICAL PROVISIONS
€/m
18,491
21,277 +15%
F.Y. 2004 9 M 2005
GROUP PROFITby business
P&C
Life
Bank
ing
Tota
l
24158 11 (36)
273
Elim
in.
Inte
rbus
.
deal
ings

14
Results as at 30 September 2005 Summary of consolidated Profit and Loss Account
€/m
Figures as at 30 September 2004 result from reasonable and coherent estimates.
30 September 2005
30 September
2004
3rd Quarter
2005INCOME
Net premium income 5.685 4.559 1.581Fees and commissions receivable 95 82 39
441 395 171
15 4 (1)Income from other financial instruments and investment property 589 359 169Other income 60 68 38Total income 6.885 5.466 1.996CHARGES
Net claims charges (5.323) (4.171) (1.463)Fees and commissions payable (26) (15) (20)
(3) (0) (3)
(178) (153) (71)
(832) (760) (266)
(45) (82) (16)Total charges (6.408) (5.182) (1.839)Profit (loss) before taxation 478 284 157
(176) (110) (75)Consolidated profit (loss) 302 175 82Profit (loss) - Minority interests 29 16 10Profit (loss) - Group 273 159 72
Charges from other financial instruments and investment property
Operating expenses
Other charges
Taxation
Charges from shareholdings in subsidiaries, affiliated companies and joint ventures
Net income from financial instruments at fair value through profit or lossIncome from shareholdings in subsidiaries, affiliated companies and joint ventures
FIGURES OF
FIGURES AS AT

15
Results as at 30 September 2005 – Summary of consolidated P&L Account breakdown per business
€/m Banking elimination Totalbusiness interbusiness Group
Non-Life Life Total dealings as at 30/9/2005
INCOME
Net premium income 2.763 2.922 5.685 0 0 5.685
Fees and commissions receivable 4 24 28 67 (0) 95
142 297 439 2 (0) 441
33 17 50 0 (36) 15
191 232 423 169 (3) 589
Other income 27 33 60 15 (15) 60
Total income 3.159 3.526 6.685 254 (54) 6.885
CHARGES
Net claims charges (2.040) (3.285) (5.325) 0 2 (5.323)
Fees and commissions payable (1) (13) (14) (12) (26)
(3) (0) (3) (0) 0 (3)
(57) (45) (102) (93) 17 (178)
(624) (89) (713) (119) (0) (832)
(12) (26) (38) (7) 1 (45)
Total charges (2.737) (3.459) (6.196) (231) 19 (6.408)
Profit (loss) before taxation 422 67 490 23 (35) 478
(155) (9) (164) (11) (1) (176)
Consolidated profit (loss) 267 59 326 12 (35) 302
Profit (loss) - Minority interests 26 1 27 1 1 29
Profit (loss) - Group 241 58 299 11 (36) 273
Charges from shareholdings in subsidiaries, affiliated companies and joint ventures
Net income from financial instruments at fair value through profit or lossIncome from shareholdings in subsidiaries, affiliated companies and joint venturesIncome from other financial instruments and investment property
Insurancebusiness
Charges from other financial instruments and investment property
Operating expenses
Other charges
Taxation

16
Life Embedded Value
€/m
Life Business Figures
423
5681,011 1,049
432.2
444 478.2
382
1,528 1,455
1,135
805
2002 2003 2004
Adjusted Capital & Reserves In-Force Value
1H2005**
New Business Value
€/m
100.1 89.9
84.7
60.3
2002 2003 2004 1H2005**
* The figures corrspond to the Premium Income according to the Italian GAAP, in force until 2004** Annualised half-year data.
BASED USED (2003, 2004, 1 H 2005):- Discount rate: 6.5% - Rate of Return: 4.5% - Tax-rate: 35%
BASED USED (2002):- Discount rate: 7% - Rate of Return: 5% - Tax-rate: 35%
Notes
3,717
4,650
5,717
Life Income*
€/m
2002 2003 2004
Source: Study carried out by G. Ottaviani e Partners, actuarial consultancy and auditing services.
Life Embedded Value and New Business Valuefigures are net of taxes, policyholders benefits, cost of capital and minorities.
2005 Prel.
4.2 €/bnPremiumsIAS/IFRS compliant
~6.800

17
Non-Life NAV
Non-Life Direct Premiums
€/m
Non-Life Business Figures
2002 2003 2004
Non-Life Technical Result
€/m
204.1
136.3
83.8
2002 2003 2004
€/m1,202
1,035
2004 1H2005
2,290
2,813
3,866
70.9%
22.3%
93.2%
Global direct loss ratio Direct expense ratio
Combined ratio
2002 2003 2004
71.8%
21.4%
93.2%
75.7%
19.6%
95.3%
2005 Prel.
73.0%
23.4%
96.5%
9 M 2005IAS compliant
~ 4.000
18
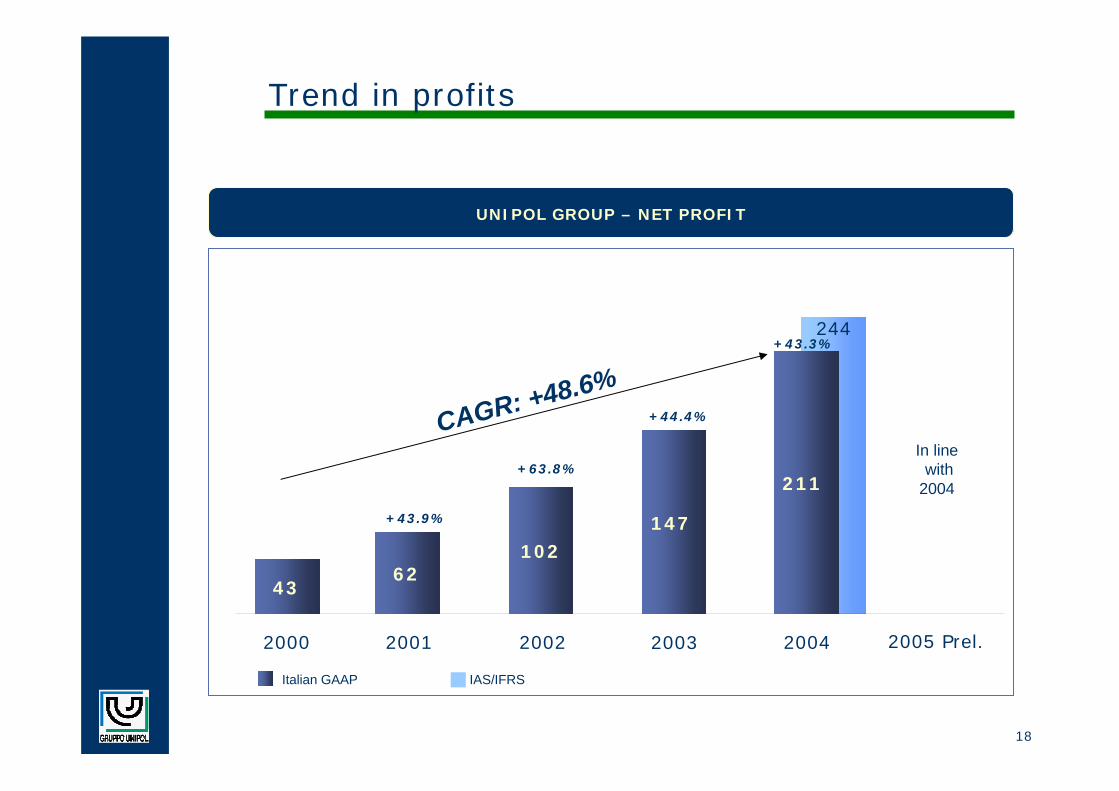
Trend in profits
UNIPOL GROUP – NET PROFIT
CAGR: +48.6%
43
2000
62
+43.9%
2001
102
+63.8%
2002
147
+44.4%
2003
211
244
2004 2005 Prel.
+43.3%
In line with
2004
IAS/IFRSItalian GAAP

19
Introduction: Unipol Group highlights and historyI
Agenda
II
Unipol Banca and the integrated network modelUnipol Banca and the integrated network modelIIIIII
Unipol Groups: results

20
The banking business – Unipol Banca overview
Unipol Banca was founded in 1999 and based on a precise strategic plan with the aim of exploiting the unique cross-selling opportunities afforded by integrating banking and insurance products at one sales point.
In the space of seven years Unipol Banca has achieved an extraordinary operating and territorial growth, both organically (opening of new branches) and through the acquisition of branches from other credit institutions.
Today Unipol Banca has 250 branches across 16 regions of Italy, 45 financial counters and 440 financial advisers.
In 2005, direct customer deposits exceeded €4.8bn, whilst loans (net of securitisation) reached €3.1bn.
The considerable growth of the bank, coupled with precise strategic targets, allowed a model of integration to be created between the insurance and the banking networks which is unique in Italy: the integrated network model.
This scenario means that around 50% of branches are integrated with group insurance agencies, while most of the remaining 50% operate as a target agency for insurance agencies nearby (the so-called ‘clustered branch’)
Notwithstanding the significant results already achieved as regards growth and profitability, the Unipol Banca development plan is still currently underway and includes the opening of about 200 new branches (almost all of them co-located with insurance agencies) by the end of 2008.

21
Unipol Banca:1999-2004 growth
Customer Deposits (EUR/bn)
Customers Funds (EUR/bn)
15.9
4.3
2004BranchesBranches: 221: 221Fin. Fin. AdvAdv.s: 448.s: 448Fin. Fin. shopsshops: 48: 48
CUSTOMER DEPOSITS HAVE INCREASED 9-FOLD IN 5 YEARS AND
CUSTOMER FUNDS 7-FOLD
3.4
0.5
2000BranchesBranches : 36: 36Fin. Fin. AdvAdv.s: 270.s: 270Fin. Fin. shopsshops: 17: 17
11.5
2.6
2003BranchesBranches: 185: 185Fin. Fin. AdvAdv.s: 425.s: 425Fin. Fin. shopsshops: 53: 53
7.0
2,2
2002BranchesBranches: 173: 173Fin. Fin. AdvAdv.s: 408.s: 408Fin. Fin. shopsshops: 57: 57
BranchesBranches: 95: 95Fin. Fin. AdvAdv.s: 373.s: 373Fin. Fin. shopsshops: 60: 60
2001
6.3
1.1
Start-up
1999BranchesBranches: 24: 24Fin. Fin. AdvAdv.s: 132.s: 132
0.42.2
22.0
6.1
2005 Prel.BranchesBranches: 237: 237Fin. Fin. AdvAdv.s: 440.s: 440Fin. Fin. shopsshops: 46: 46
Customer Deposits (EUR/bn)
Customers Funds (EUR/bn)
15.9
4.3
BranchesBranches: 221: 221Fin. Fin. AdvAdv.s: 448.s: 448Fin. Fin. shopsshops: 48: 48
CUSTOMER DEPOSITS HAVE
INCREASED 11 FOLD IN 6 YEARS
AND CUSTOMER FUNDS MORE-
3.4
0.5
BranchesBranches : 36: 36Fin. Fin. AdvAdv.s: 270.s: 270Fin. Fin. shopsshops: 17: 17
11.5
2.6
BranchesBranches: 185: 185Fin. Fin. AdvAdv.s: 425.s: 425Fin. Fin. shopsshops: 53: 53
CAGR 1999 – 2005: +49%
7.0
2.2
BranchesBranches: 173: 173Fin. Fin. AdvAdv.s: 408.s: 408Fin. Fin. shopsshops: 57: 57
Acquisition of60 branches
from Capitalia
(price paid:165 EUR/ mn)
Acquisition of60 branches
from Capitalia
(price paid:165 EUR/ mn)
BranchesBranches: 95: 95Fin. Fin. AdvAdv.s: 373.s: 373Fin. Fin. shopsshops: 60: 60
6.3
1.1
Start-up
Acquisition of51 branches
from B. Intesa(price paid: 205 EUR/ mn)
Acquisition of51 branches
from B. Intesa(price paid: 205 EUR/ mn)
Start-up project
Start-up project
BranchesBranches: 24: 24Fin. Fin. AdvAdv.s: 132.s: 132
0.42.2
Transformation ofUnipol Merchant into:
Specialized in corporate buiness
(cap. and reservesof 108 EUR/mn)
Acquisition of22 branches
fromBanca
Antonveneta
Acquisition of22 branches
fromBanca
Antonveneta
>23.5
4,8
BranchesBranches: 237: 250Fin. Fin. AdvAdv.s: 440.s: 440Fin. Fin. shopsshops: 46: 45
THAN 9 FOLD

22
UNIPOL BANCA: key financials (italian GAAP)
OPERATING COST/INCOME RATIO
72.5% 64.5%
€/m
F.Y. 2003 F.Y. 2004
150.8 193.5
GROSS OPERATING INCOME
PRE-TAX PROFIT
€/m
33
23
F. Y. 2003 F.Y. 2004
NET PROFIT
€/m
1518
F. Y. 2003 F.Y. 2004
F.Y. 2003 F.Y. 2004
GOODWILL AMMORTIZATION
€/m
7.711.4
F.Y. 2003 F.Y. 20049 M 2005
189.5
9 M 2005
61%
9 M 2005
12.3
9 M 2005 9 M 2005
44
26

23
1,946
2,609
TOTAL LOANS (net of securitisation)
€/m
F.Y. 2003 F.Y. 2004
12
23
NET NON PERFORMING LOANS
€/m
11,461
14,228
FUNDS UNDER CUSTODY
€/m
1,174
1,701
ASSETS UNDER MANAGEMENT
€/m
UNIPOL BANCA: key financials (italian GAAP)
2005 Prel.
~3,100
2005 Prel.F.Y. 2003 F.Y. 2004 2005 Prel.F.Y. 2003 F.Y. 2004
F.Y. 2003 F.Y. 2004 9 M 2005
35
~ 21.600
~ 2.100

24
UNIPOL CO-LOCATED BRANCH
Cross-Selling to insurance customers as regards:
current accountsloans / private lendingasset managementcorporate lending
Fees paid to the agent for promoting banking products
Cross-selling of insurance products (Non-Life, pensions, health) to customers at the branch, once considerable enough.
Fees from promoting cross-selling in banks
Insurance agencyBank branch
MORE QUALITY AND QUANTITY OF CONTACTS
BETTER COMMERCIAL FEEDBACK(success rate with contacts 4 times higher than
average)
Successful drivers
++
=
+=
Relationship governed by a consolidated
framework agreement, approved by the
agents’ organizations
Connectivity to customer database (further information)
More chance of spontaneous contact (visiting the bank)
Logistical benefits (one stop shop) with comprehensive list of products on offer
Benefits from product and price mix
Customer loyalty
Brand image and familiarity
+
Unipol Banca: the co-located branch
Agency IT system connected to the bank
Insurance agency
Bank transactions
Consultancy
Financial advisers
Agent
Branch

25
Unipol Banca: from the qualified agency to the co-located branch
INSURANCE AGENCY NEXT TO FINANCIAL COUNTER
Preliminary to the co-located branch
QUALIFIED INSURANCE AGENCY
Insurance
agency
Operates in connection with the bank’s IT systemand can therefore sell bank products
Financialcounter
Insurance agency
CLUSTERED BRANCH
Baricentric with regard to two or more Group agencies.Subject to passing the logistic requirements, it tends to become a co-located branch.
Op. Bancarie
Consulenza
Branch
CO-LOCATED BRANCH
Complete synergy and cross-selling
Insurance agency
Bank transactions
Consultancy
Financialadvisers
Agent
Branch

26
Preconditions to the opening of new co-located branches:opening the financial counter
Opening a financial counter is based on the decision to transform it into a bank branch
• Average size 150/200 square metres for the part that will turn into a bank branch
• Location in line with the Bank territorial plans
• At first agency financial advisers operate in the financial counter
• Sharing the commercial targets with the agent is a precondition to the opening. These targets involve planning the evolution in the following 12/18 months, with the agent subscribing a commitment of minimum production.
• Limited start-up investment, partly borne by the agency, based on detailed cost-sharing provisions
Limited start-up investment and almost absent recurrent costs for the bank, combined with high commercial preconditions for the quick transformation
into co-located branch and its related breakeven achievement

27
Preconditions to the opening of co-located branches:transformation of the financial counter into bank branch
a. The financial advisers have already opened at least 150 current accounts;
b. The co-located agency commits itself to achieve a total of 350 current accounts within 12 months from the opening of the branch;
c. The co-located agent commits itself in achieving a minimum of 480 current accounts within 18 months from the opening; bank commercial ratio on customer-base of co-located agency must not be less than 15% (benchmark);
d. Commitment to promote the commercial activity of the branch as regards the insurance agency, with VAT registration number aiming at opening at least 120 relationships, within 18 months from the branch opening;
e. Commitment to achieve at least 30% of the customers of the co-located sales point, within 42 months from the branch opening.
Achievement of the co-located branch breakeven in 9-12 months and following positive and growing contribution, which can count on sound basis and definite commitments with agents aiming at further growth.
The financial counter develops into co-located branch, subject to the following conditions:

28
Integrated model
Ver
y lim
ited
fix
ed a
nd flo
ating c
ost
s
Financial counter
Branchopening
6 months 12 months 18 months more
A minimum of 150
relationships already set up
Gross operating income
Fixed costs- Staff- Amortization- General
expenses
Contribution margin to the bank account
Num
ber
curr
ent
acc
ounts
Ver
y lim
ited
fix
ed a
nd flo
ating c
ost
s
Financial counter
Branchopening
6 months 12 months 18 months more
A minimum of 150
relationships already set up
Gross operating income
Fixed costs- Staff- Amortization- General
expenses
Contribution margin to the bank account
Num
ber
curr
ent
acc
ounts
Cross-selling achieved results
Cross-selling (from insurance to bank) Cross-selling (from bank to insurance)
8.0%12.0%
16.0%20.0%
22.0%
3.0%4.5% 6.0% 7.5%
9.4%
4.0%8.0%
12.0%16.0%
21.0%
1.5% 3.0% 4.5% 6.0%9.0%
I year II year III year IV year uponcompletion
co-located branches clustered branches
I year II year III year IV year uponcompletion
clustered branchesco-located branches
Co-located branch break-even and contribution to the bank P&L account

29
The agent is a key player in the success
On average 34% of customers from a single integrated branch have been introduced by the agency channel,
reaching 52% at peak times.
Quick development and regular branch operational
activities(insurance customers become
banking customers)
Thanks to the know-how obtained and the preliminary agreements with agents, the breakeven period for newly
opened branches has been consolidated in about 12 months (in some cases 9 months).
In the consolidated branches the level of cross-selling (insurance customers who have become banking
customers) has exceeded 30% and is still growing.Also, for the branches acquired the breakeven process
has been very quick (rearranging loans and aligning with Unipol criteria).
Banking customers become insurance customers
The same factors key to the success of the co-located branch are mirrored in an important migration of
customers from banking to insurance. The average cross-selling rates are basically higher than for the reverse case which is also due to easier get-out clauses for
insurance customers.
Well-consolidated expertise in implementing
integrations
Only 6 months are needed to implement a branch’s integration project (this has more than halved compared
to initial attempts).
Framework agreement approved by agents
The relationships between agencies and banking branches are based on a framework agreement approved
by agents, resulting from consolidated co-operation among the several key players involved.
THE INTEGRATED NETWORK MODEL : RESULTS ACHIEVED AND EXPECTED GROWTH
Unipol Banca: summary of the integrated network. A model already successfully tested

30
DISCLAIMER
THIS PRESENTATION CONTAINS INFORMATION RELATING TO FORECASTS OF FIGURES, RESULTS AND EVENTS THAT REFLECT THE CURRENT OUTLOOK, BUT THESE COULD DIFFER FROM WHAT ACTUALLY HAPPENS OWING TO EVENTS, RISKS AND MARKET FACTORS THAT IT IS CURRENTLY IMPOSSIBLE EITHER TO KNOW OR TO PREDICT.