Union Effects on Employment Stability: A Comparison of...
16
Union Effects on Employment Stability: A Comparison of Panel Versus Cross-Sectional Data* SOLOMON W. POLACHEK State University of New York at Binghamton, NY 13901 and University of North Carolina at Chapel Hill, NC 27514 ERNEST P. McCUTCHEON University of North Carolina at Chapel Hill, NC 27514 In analyzing the impact of unions on employment stability, we introduce two innovations to correct for previous overestimates ofthe union effect: (1) a differ- ent approach to measure employment stability (although we use traditional mea- sures for comparisons) and (2) panel data to obtain estimates uncontaminated by unmeasurable person differences between union and nonunion workers. Using common cross-sectional techniques, the new measures of employment stability indicate that unions accountfor 15 to 20 percent of employment stability variance rather than the 40 to 60 percent indicated in previous findings. Using panel tech- niques further reduces these measured union effects to no more than 11 percent. I. Introduction The problem of how to measure the effect of labor unions on employee well-being has long intrigued labor economists and remains a subject of intense debate (see, for example. Freeman and Medoff, 1981). Until recently, well-being was gener- ally measured in terms of wages, and the literature on this issue focused entirely on the comparison of union and nonunion wage gains (see Lewis, 1963, and 1982). Typically, in the early studies ordinary least squares regression analysis was applied to cross-sectional data. While specific estimates have varied widely, results have generally shown that union members receive a wage advantage rang- ing between 10 and 20 percent. •This research emanates from an undergraduate honors thesis written by McCutcheon, under the direction of Polachek. The authors wish to thank Thomas Kniesner, H. Gregg Lewis, and W Stanley Siebert for valuable comments; Paul Jellinek and Lynn Igoe for superb editorial assistance; and the editor and a referee of this journal for valuable comments. The research was supported by the Carolma Population Center and the NICHD. All errors are the responsibility of the authors. JOURNAL OF LABOR RESEARCH Volume IV, Number 3 Summer, t983
Transcript of Union Effects on Employment Stability: A Comparison of...

Union Effects on Employment Stability:A Comparison of Panel VersusCross-Sectional Data*
SOLOMON W. POLACHEKState University of New York at Binghamton, NY 13901 andUniversity of North Carolina at Chapel Hill, NC 27514
ERNEST P. McCUTCHEONUniversity of North Carolina at Chapel Hill, NC 27514
In analyzing the impact of unions on employment stability, we introduce twoinnovations to correct for previous overestimates ofthe union effect: (1) a differ-ent approach to measure employment stability (although we use traditional mea-sures for comparisons) and (2) panel data to obtain estimates uncontaminated byunmeasurable person differences between union and nonunion workers. Usingcommon cross-sectional techniques, the new measures of employment stabilityindicate that unions account for 15 to 20 percent of employment stability variancerather than the 40 to 60 percent indicated in previous findings. Using panel tech-niques further reduces these measured union effects to no more than 11 percent.
I. Introduction
The problem of how to measure the effect of labor unions on employee well-beinghas long intrigued labor economists and remains a subject of intense debate (see,for example. Freeman and Medoff, 1981). Until recently, well-being was gener-ally measured in terms of wages, and the literature on this issue focused entirelyon the comparison of union and nonunion wage gains (see Lewis, 1963, and1982). Typically, in the early studies ordinary least squares regression analysiswas applied to cross-sectional data. While specific estimates have varied widely,results have generally shown that union members receive a wage advantage rang-ing between 10 and 20 percent.
•This research emanates from an undergraduate honors thesis written by McCutcheon, under thedirection of Polachek. The authors wish to thank Thomas Kniesner, H. Gregg Lewis, and W StanleySiebert for valuable comments; Paul Jellinek and Lynn Igoe for superb editorial assistance; and theeditor and a referee of this journal for valuable comments. The research was supported by theCarolma Population Center and the NICHD. All errors are the responsibility of the authors.
JOURNAL OF LABOR RESEARCHVolume IV, Number 3 Summer, t983
274 JOURNAL OF LABOR RESEARCH
Over the past several years, criticism of such studies has escalated (Lee, 1978;Schmidt, 1978; Schmidt and Strauss, 1976), particularly surrounding the argu-ment that single equation regression methods do not take into account possibleinnate, and perhaps unmeasurable, differences between union and nonunionworkers. To the extent that such differences exist — for example, because moreproductive workers are more strongly attracted to unions — single equation esti-mates of union effects are subject to an upward selectivity bias. Althoughattempts have been made to reduce this selectivity bias with the use of cross-sectional simultaneous equation techniques (see Heckman, 1976; Duncan andLeigh, 1980), the robustness of such simultaneous equation estimates has beenquestioned on the grounds that such techniques are extremely sensitive to errorsin functional specification (Goldberger, 1980).
Proponents of the hedonic pricing model (Borjas, 1979; Duncan and Staf-ford, 1980) advocate another approach to the measurement of union effects onwork force well-being. This approach treats wages as an element in the total pack-age of union-supplied amenities that contribute to worker well-being. Viewedfrom this perspective, higher union wages may be traded off against relativelysmaller nonwage amenities, leaving a smaller net gain in well-being for unionmembers than an exclusive focus on wages would suggest. Because the hedonicpricing model permits a more comprehensive analysis of labor market dynamicsthan do the traditional wage-oriented models, it has been adopted in numerousstudies measuring union effects on a wide range of nonwage amenities.
This study explores the effect of union membership on employment stability,an especially important nonwage amenity. Considerable work has been done inthis area, most of it drawing on cross-sectional data and expressing employmentstability in terms of either quit or layoff probabilities or job tenure. Most often,researchers have concluded that unions greatly increase employment stability, atleast among union members (Becker, 1978; Bloch and Kuskin, 1978; Freeman,1980a, 1980b; Kahn and Morimune, 1979; Medoff, 1979).
This study questions these results. First, the consideration of employmentstability in terms of quit and layoff probabilities or job tenure misses the potentialeffects of strikes and temporary layoffs, and consequently, may create an upwardbias on estimates of the union effect on stability. Second, the use of cross-sectional analysis may introduce upward selectivity bias if, for example, more"stable" workers are attracted to unions in the first place.
The results of this study suggest that past estimates of union effects onstability suffer from both problems. Considerable upward bias is detected in theuse of tenure as a measure of employment stability. Also important, from thestandpoint of method, are the differences that occur between cross-section andpanel data estimates: Cross-section estimates persistently indicate a union effectwhile panel estimates show the effect to be small. This lends tentative support tothe observation that part of the relatively strong effect of unions on employment
SOLOMON W. POLACHEK and ERNEST P. McCUTCHEON 275
Stability found in cross-sectional studies may be attributable to the self-selectionof more "stable" workers into unions.
II. The Theory of Unions and Employment Stability
The analytic framework most commonly used to study the effect of union member-ship on employment stability is drawn from the monopoly theory of unionization,primarily because of the wage effects that result from unionization. Unionizationrestricts the free flow of workers to the firm, reducing downward competitivepressure on wages and raising worker incentives to remain with the firm. In addi-tion, higher wage rates force the firm to select higher quality workers in order tomaintain optimal output levels in the product market, where "quality" may man-ifest itself either as improved productivity (output per hour) or as reduced turn-over, which reduces the firm's long-run on-the-job training costs.
A second analytic framework that is consistent with monopoly theory drawson "exit-voice" theory. According to this approach, which has been applied tounions by Freeman (1980a) and others (Blau and Kahn, 1980), employees dis-satisfied with some aspect of their work have two options: voicing dissatisfactionverbally or showing dissatisfaction by leaving the firm. If no formal voicingmechanisms exist, dissatisfied workers are more likely to resort to exit behavior,thus raising turnover rates and reducing employment stability. Conversely, ifformal voicing mechanisms do exist, such as labor unions, exit behavior shoulddecline and employment stability should improve. Freeman points out thatalmost all union contracts contain explicit provisions for grievance and arbi-tration systems (U.S. Department of Labor, 1964; 1977). Many contracts alsoestablish complex rules of procedure that management must follow in order todismiss unsatisfactory workers, thereby raising severance costs and further sta-bilizing employment.
While both the monopoly and exit-voice theories imply greater employmentstability among union than nonunion workers, counter-arguments can be raised.For example, high union wage requirements may encourage increased capitalsubstitution or subcontracting to lower-cost producers. High wage requirementsare also apt to raise the firm's sensitivity to fluctuations in the business cycle, sothat temporary layoffs may increase dramatically in periods of recession.
Because there is no theoretical basis for ascertaining a priori which set ofeffects will predominate in actual practice — that is, whether union membershipultimately promotes or inhibits employment stability — the question must be pur-sued empirically. While past research strongly suggests a net positive effect, thereis reason to suspect on both definitional and statistical grounds that this effectmay have been substantially overstated.

276 JOURNAL OF LABOR RESEARCH
III. The Data
The data set chosen for this study is the Panel Study of Income Dynamics (PSID),a cross-sectional and panel survey of about 5,000 "family units" over the period1968 to 1976. The survey contains a wealth of economic and demographic infor-mation, including individual histories of union membership.
The PSID does contain some observations not pertinent to this study, raisingthe possibility of distortion by irrelevant exogenous factors. One such observa-tion is discrimination. In order to eliminate any possible race and sex discrimina-tion effects, nonwhite and female household heads are deleted from the sample.To minimize any effects of age, health, and disability discrimination, observa-tions containing retired persons, handicapped and disabled persons, and personswho were student household heads when the survey was initiated are also deleted.
The effect of these deletions is to leave a sample of white males, employedof unemployed, but still in the labor force. (Persons not in the labor force in thefirst year of the survey are also deleted.) The remaining sample is divided intothree groups:
1. AL WA YS — those persons with continuous union membership during the''nine years of data collection;'
2. NEVER — those persons with no union membership during the nine years ofdata collection; and
3. SOME—those persons with discontinuous union membership during the nineyears of data collection.
Two variables are used to measure employment stability: TENURE andVA WH (variation in annual work hours). TENURE measures years on currentjob (as of 1976) and is used to link this study to past research. VAWH, which isdefined specifically to isolate the effect of union membership on variability inworking hours, measures the standard deviation of annual hours worked both forthose years that the respondent was in the union and for those years he was out ofthe union. Note that VAWH is, sensitive to strikes and temporary layoffs whileTENURE is not, since strikes and temporary layoffs tend to affect hours but nottenure. (An exception is where a worker in a higher cyclical industry quits to findmore stable employment elsewhere.)
The data in Table 1 indicate substantial differences among the three unionmembership groups (AL WA YS, NEVER, and SOME) with respect to both stabil-ity measures {TENURE and VA WH). Respondents in the AL WA YS group have
'For ease of exposition, we refer to these people as being always in the union, although no informationis available on their unionization prior to the sample. Thus, ALWA YS refers strictly to the nine yearsof sampling. This also applies to the NEVER group. One other caveat is that no union membershipdata are available for 1973. It is conceivable, therefore, that individuals within the ALWA YS andNEVER states changed status in 1973 but were undetected in the data. The probability of this is small,however, and at most very few individuals would be affected.

SOLOMON W. POLACHEK and ERNEST P. McCUTCHEON 277
Table 1
Means for Employment Stability Variabies by Strata
Variable
TENURE
Standard Deviation of
Annual Work Hours (VAWH)
Education
Age
Always
Never
N
ALWAYS
16.94
305.04
10.93
39.00
175
NEVER
11.80
360.90
13.14
37.71
518
SOME
8.99
417.04
11.60
36.92
324
AGGREGATE
DATA SET
11.79
369.19
12.27
37.68
.172
.509
1017
Source: PSID Data
Note: All variables are defined in the text. Precise definitions are as follows: ALWA YS refers to those individualsin a union in each year for which such information is available of the PSID tape (1968, 1969, 1970, 1971, 1972,1974, 1975, and 1976). NEVER refers to those individuals who were not in a union in each of these years. SOMErefers to all else; namely, those who were in a union in at least one but not all of the above years. TENURE refers toyears on current job in 1976. VA WH is the standard deviation in annual hours worked over the period 1968-76. Ageand education refer to values in 1968.
the highest stability ratings. Their TENURE stands at 16.9 years, compared with11.8 years for the NEVER group and 9.0 years for the SOME group. TheirVA WH stands at 305 hours, compared with 361 for the NEVER group and 417for the SOME group. In other words, the tenure for the ALWAYS group is longerand the working hour variability is smaller than that of those with no unionmembership and those whose membership was discontinuous. Whether theseunion effects are attributable to differences in measurable worker character-istics is unclear.
IV. Cross-Sectional A nalysis
In order to apply cross-sectional analysis to the study sample, the data for each ofthe three membership groups are pooled. Dummy variables ALWAYS andNEVER are defined to identify membership status for any individual observa-tion, where the respondent's membership history over the nine years of the surveyconstitutes a single observation. Within the context of an ordinary least squaresregression, the coefficients of these dummy variables can be taken as estimates ofunion effects on stability, with age and education included to adjust for individ-ual characteristics. The regression takes the form:
"»"'""' ALWA YS + a2 NEVER + a,AGE-\-a^ EDUC + e, (1)
with coefficient estimates reported in columns (1) and (3) of Table 2.
278 JOURNAL OF LABOR RESEARCH
Table 2
Cross-Sectional OLS Regressions of Employment Stability
Independent Variables
Intercept
ALWAYS
NEVER
Age
Education
VAWH
TENURE
R'
E Statistic
TENURE
-3.658(-1.97)
7.449(9.17)
2.248(3.60)
0.296(10.30)
0.241(3.02)
.18
31.35
Dependent
TENURE
1.928(1.03)
6.380(8.11)
1.765(2.94)
0.264(9.49)
0.205(2.68)
-.010(-9.56)
.25
41.30
Variable
VAWH
560.841(10.44)
-107.332(-4.56)
-48.535(-2.69)
-3.283(-3.94)
-3.614(-1.56)
.04
6.12
VAWH
530.333(10.28)
-45.211(-1.93)
-29.785(-1.71)
-.811(-.98)
-1.603(-.72)
-8.340(-9.56)
.12
17.25
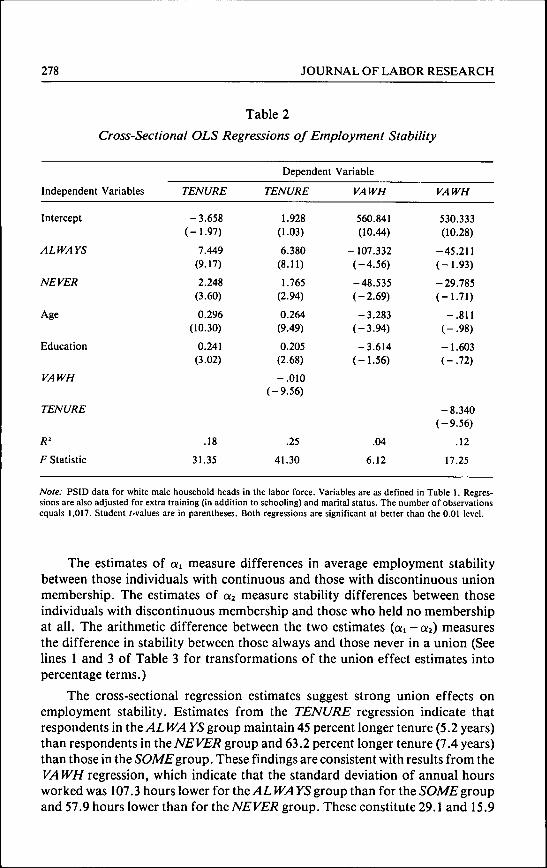
Note: PSID data for white male household heads in the labor force. Variables are as defined in Table 1. Regres-sions are also adjusted for extra training (in addition to schooling) and marital status. The number of observationsequals 1,017. Student /-values are in parentheses. Both regressions are significant at better than the 0.01 level.
The estimates of ai measure differences in average employment stabilitybetween those individuals with continuous and those with discontinuous unionmembership. The estimates of 02 measure stability differences between thoseindividuals with discontinuous membership and those who held no membershipat all. The arithmetic difference between the two estimates (cui -0:2) measuresthe difference in stability between those always and those never in a union (Seelines 1 and 3 of Table 3 for transformations of the union effect estimates intopercentage terms.)
The cross-sectional regression estimates suggest strong union effects onemployment stability. Estimates from the TENURE regression indicate thatrespondents in the AL WA YS group maintain 45 percent longer tenure (5.2 years)than respondents in the NEVER group and 63.2 percent longer tenure (7.4 years)than those in the SOAffigroup. These findings are consistent with results from theVA WH regression, which indicate that the standard deviation of annual hoursworked was 107.3 hours lower for the AL WA yS group than for the SOAffi groupand 57.9 hours lower than for the NEVER group. These constitute 29.1 and 15.9

SOLOMON W. POLACHEK and ERNEST P. McCUTCHEON 279
Table 3
Union/Nonunion Percentage Differentials in Employment Stability
Comparison Groups
Union Effect
Increased Tenure(TENURE)
Estimated with Eq(l)Estimated with Eq(2)
Decreased Variance inAnnual Hours Worked(VAWH)
Estimated with Eq(l)Estimated with Eq(2)
ALWAYS/NEVER
45.039.2
15.94.2
ALWAYS/SOME
63.254.5
29.112.2
NEVER/SOME
19.115.0
13.48.1
Note: Computed from Tables 1 and 2.
percent differences, compared to the 63.2 and 45 percent measures obtainedwithin the "tenure" regressions.
Even these smaller differences in the VA W^//regressions are overestimates ofthe union effect on hours variations. If higher union wages reduce turnoveramong union workers and turnover in turn reduces hours variability, then unionmembers may have less hours variation solely because of diminished turnover. Inshort, hours variability may be higher among nonunion workers because job sep-arations are not held constant. To avoid this bias, equation (1) is respecified tohold job duration constant:
IVAWH J = ' o + '^»ALWAYS + ^2NEVER + ^^AGE + fi^EDUCATION
The inclusion of job tenure and hours variation serves to ascertain the union ef-fect independent of known union/nonunion stability differences. As expected,union effects (though still statistically significant) have been reduced further tobetween 4 and 12 percent (column 4 of Table 2 and line 4 of Table 3). As a com-parison, the regressions with tenure as a dependent variable are adjusted byVA WH (column 2 of Table 3 and line 3 of Table 3) and yield similar effects.
Of particular interest is the comparison between union effects on tenure andon hours-of-work variation, for it is in this comparison that much of the effect ofsuch factors as strikes, temporary layoffs, and overtime can be isolated. Becauseeach of these factors tends to increase significantly hours-of-work variation whilehaving a minimal impact on tenure (in all but the most sensitive cyclical indus-

280 JOURNAL OF LABOR RESEARCH
tries), union workers should report longer tenure and lower hours-of-work varia-tion than nonunion workers. Indeed, this is the case. As already indicated, tenurewas 45 percent higher for ALWAYS respondents than for NEVER respondents,while hours-of-work variability was 15.9 percent lower. These figures are 15.9and 4.2 percent for the so-called adjusted regressions given in equation (2).
The results of cross-sectional analysis, then, support the hypothesis thatunions increase employment stability. The results also suggest that the use of ten-ure as an operational measure of employment stability leads to an overestimate ofthe union effect because such factors as strikes, temporary layoffs, and overtimeare not taken into account.
V. Selectivity
There is yet another problem in the interpretation of these cross-sectional esti-mates. On the one hand, employment stability is greater for the AL WA YS groupthan for the SOME and NEVER groups, a finding consistent with positive unioneffects on stability. On the other hand, as Tables 2 and 3 indicate, stability isgreater for the NEVER group than for the SOME group. If unions do increasestability, how does one account for this apparent inconsistency?
The problem may be due in part to selectivity. If respondents in the differentmembership groups are in some way innately different from one another, thenpart of the effect on stability attributed to unions in the cross-sectional analysismay be attributable to these innate personal differences. It seems reasonable, forexample, in light of the apparent inconsistency noted in the cross-sectional esti-mates, to suspect that those in the ALWAYS and NEVER groups may share cer-tain innate characteristics more compatible with stability than those possessed byrespondents in the SOME group. If the effect of such innate characteristics onstability were in fact more powerful than the effect of union membership, thenthe apparent inconsistency in the cross-sectional estimates would be resolved.
For reasons of selection, respondents in the NEVER group might innately bemore prone to stability than respondents in the SOME group; and if this innateeffect were greater than the union effect, then stability would necessarily begreater for the NEVER than for the SOME group.
To pursue this possibility, it is necessary to demonstrate that union member-ship does not account for as much of the employment stability as the cross-sectional estimates suggest. This in turn requires that the effect of unions beisolated from other possible factors affecting stability, so that the "pure" unioneffect may be compared with the cross-sectional estimates of union effect. Thesesteps are taken with the use of panel data.
VI. A nalysis of Panel Data
Panel data provide observations on an array of characteristics for each individualin the sample collected at regular intervals over a period of years. The chief ad-

SOLOMON W. POLACHEK and ERNEST P. McCUTCHEON 281
vantage of such data over cross-sectional data is that it permits the analyst to con-trol for personal characteristics that might otherwise confound the analysis.
The panel data used in this study (and described in section III) include obser-vations on all three membership groups. However, for the purpose of isolatingthe "pure" union effect on employment stability, it is the SOM£'group that is ofimmediate interest. Controlling for all other potentially relevant individual char-acteristics, one is able to compare employment stability before and after joiningor leaving the union, recognizing that whatever differences are detected must beattributed entirely to union membership.^
The PSID data set contains nine time periods. Analysis of hours-of-workvariation' requires that respondents in the sample have been both in and out ofthe union for at least several periods. Consequently, the study sample is restrictedto those respondents in the SOME group who have switched only once (either intoor out of the union) and who have been both in and out of the union for at leastthree of the nine years." These criteria yield a total of six patterns, three for joinersand three for leavers (see Table 4).
The mean VA W7/(standard deviation of annual hours worked) is computedfor each of the six patterns, for all joiners and all leavers and for the periodsbefore and after joining or leaving the union. Comparison of the means yieldsmixed results. Union membership improved stability for those with patterns a, d,and f (see Table 4) and reduced stability for those with patterns b, c, and e, so thata clearly positive union effect does not emerge. Analysis of individual observa-tions sheds no further light on these results.
In such a direct comparison of means, however, adjustments are not made forfactors other than union membership that may affect stability. As a next step,therefore, regression analysis is applied, so that possible confounding effects maybe screened out. With regression, account can be taken of both potential sources ofdistortion: individual characteristics, both measurable, and economy-wide trends.
'Some may argue that individuals change when they join a union (much like professors change whenthey get tenure). But we believe that such changes are union induced and, thus, should be consideredas a union effect. Our approach incorporates these changes into the union impact.
Tor the panel analysis, we concentrate on hours variations because analysis of tenure before and aftera status switch would have little meaning. Often, union status changes entail a job change. Any recentjob change implies low tenure, even if intentions of staying long on one's new job are high. Usingvariations in weeks worked would also be problematic. Definitional problems exist in terms of how todistinguish voluntary vacations from forced furloughs. Besides, our measure of annual hours encom-passes both weeks worked per year and hours worked per week. For this reason we concentrate onVAWH for the panel analysis.
'The small sample size (23 union joiners and 28 union leavers) is not as problematic as some might sus-pect. First, two observations exist per observation, so that almost 100 degrees of freedom exist in theregressions performed in Table 5. Second, the robustness of the results is tested by comparing theunion effects separately for joiners and leavers.

282 JOURNAL OF LABOR RESEARCH
Table 4Variation in Annual Work Hours for Union Status Switchers
by Unionization Pattern
VA WH (nonunion)
VAWH (union)
N
VA WH (union)
K4W//(nonunion)
N
Pattern a
(XX)|11X111
475.43
442.84
8
Pattern d
111|OOXOOO
243.98
510.33
11
Joiners
Pattern b
(X)OO|1X111
233.95
267.28
9
Leavers
Pattern e
1111|OXOOO
479.24
268.25
8
Pattern c
OOOOOX|111
359.49
437.29
6
Pattern f
11111|XOOO
173.94
311.11
9
OverallTotal
350.67
372.67
23
OverallTotal
288.47
377.13
28
Note: PSID data 1968-76. VA WH is the standard deviation of annual hours worked for the years worked as indi-cated by the unionization pattern (0=nonunion; I s union; and A^H 1973, for which union data are not available).
In specifying the regression equation, it is again noted that for each individ-ual two sets of hours-of-work variations (VAWH) were computed: one for theyears before the individual joined or left the union and one for the years after.Along with the measured individual characteristics, then, two critical pieces of in-formation must be taken into account in the regression: first, whether the individ-ual was initially in the union and then left or was initially not in the union and thenjoined; second, the hours-of-work variation both before and after the switch. Thefirst, included in the regression equation as dummy variable TD,, makes it possi-ble to relate measures of hours-of-work variation to membership status. The sec-ond, denoted VAWHj,, makes it possible to account for unmeasured individualcharacteristics that might otherwise distort estimates of the union effect.
With TD,, VAWHj,, and the necessary personal characteristic variablesincorporated into the regression equation, the coefficient of the union dummyvariable VD, can be estimated to measure the pure union effect on hours-of-workvariability. The exact specification is
VA , + a^UD, + a^TD,
= \,2,. . ., T
VA WHj, + e.
(3)

SOLOMON W. POLACHEK and ERNEST P. McCUTCHEON 283
where
VA WHi, = work hours variation for the t"" worker in union status /;A, = dige. of the t"' worker;E, = education of the t"' worker;
UD, = union dummy variable (0 = nonunion and 1 = union) for the /"" worker;TD, = time dummy variable {TD, = 0 when VA WHi, refers to the initial work
segment; TD, = 1 when VA WHi, refers to the final work segment) forthe /"• worker;
VA WHj, = hours variation in alternative work segment (compared to VA WHi,) ofthe r* worker;
r = number of individuals; and/, y'=time period of the work segment and a normal and independently dis-
tributed error term with a zero mean and constant variance for thesample of switchers.
The regression results are presented in Table 5. The first column of results,headed "joiners and leavers," reports estimates for all respondents in therestricted subsample; that is, those in the SOME group who either joined or leftthe union during the nine-year survey period, with at least three years both in andout of the survey. The second and third columns report disaggregated estimatesfor "joiners" and "leavers," respectively.
Table 5
Panel Estimates of the Impact of Unions on Employment Stability
Constant
Age (A)
Education (£)
Union Dummy (UD)
Time Period Dummy (TD)
Hours Variation inAlternative State (VAWHj)
R'
N (observations)
N (individuals)
(1) Joiners andLeavers
205.65(1.2)
0.54(0.2)
-2 .24( - .3 )
-46.01 (-1.0)
76.45(1.6)
0.38(4.1)
.17
102
51
(2) Joiners
264.12(1.2)
0.17(0.1)
-8 .02( - .7 )
32.33(0.5)
0.47(3.4)
.25
46
23
(3) Leavers
89.97(0.3)
2.19(0.5)
11.00(0.7)
-113.11(-1.7)
0.28(2.1)
.12
56
28
Note: PSID data. Variables defined in text and previous tables. T-values in parentheses. Note there are two obser-vations per individual, one before and one after union status change.

284 JOURNAL OF LABOR RESEARCH
In the first column, only the coefficient estimate for VA WHj, which repre-sents unobserved individual characteristics, is statistically significant at the 95percent level, followed by the estimates on the time period dummy, TD,, and theconstant. The low statistical significance of the remaining estimates in the regres-sion implies an overall lack of understanding of employment variability in themarket. Most of the explained variance is ascribed to unobservable individualcharacteristics and to overall market phenomena as embodied in the time trenddummy and the constant. Measured individual characteristics, while signed inkeeping with theoretical expectations, have little explanatory power (although itis recognized that not all pertinent characteristics in this category, such as specifictraining, were included in the model) and neither, it appears, does the unioneffect. What clearly emerges is that the positive effect of union membership onemployment stability, so readily apparent in cross-sectional analysis, is of smallimportance when assessed with panel data. Union effects that are blatant inTables 2 and 3 are barely discernible in Table 5.
Even if the problem of statistical insignificance is ignored and the observedestimate of the union effect ( - 46.01) is taken at face value as the most likely pointestimate, it still indicates a union effect of at most 11 percent (dividing the 46.01hour reduction by the 417.04 sample mean), in contrast to the on average largerpercentage effect estimated with cross-sectional analysis. The importance of thisresult is apparent: Cross-sectional analysis overestimates the union effect onemployment stability.
In order to test for consistency between joiners and leavers, the regressionwas applied to both groups separately. Separation into two groups, however,leads to perfect correlation between TD and UD, so that the time trend cannot beisolated and estimates of the UD coefficient will consistently be biased. The prob-lem can be circumvented by subtracting (adding) the time trend estimate reportedin the first column of Table 5 from (to) the a, coefficients estimate on UD forjoiners (leavers), so that
03 = union effect for joiners = 32.33-76.45= -44.12
fl3, = union effect for leavers = - 113.11 +76.45= -36.66.
This arithmetic manipulation reveals a union effect of almost identical magnitudefor the two groups (8.8 percent for leavers and 10.6 percent for joiners).
That nearly equal union effects are obtained for such seemingly diversegroups suggests that the efforts to screen out the effect of individual character-istics have been largely successful and that the study estimates, based on a limitedsample of "switchers," may be generalized to the population at large.
VII. SummaryIn this study, the effect of union membership on employment stability is investi-gated. We allege that past studies overestimate the union effect for two reasons.First, traditional quit, layoff, and tenure measures fail to take into account the

SOLOMON W. POLACHEK and ERNEST P. McCUTCHEON 285
variations in hours of work caused by strikes, temporary layoffs, and overtime.Second, the cross-sectional methods adopted in these studies are not sensitive topossible selectivity bias.
In response to these problems, we introduce two innovations. First, employ-ment stability is measured by the standard deviation of annual hours workedrather than by traditional tenure, quit, and layoff indices. Second, panel data areused, making possible uncontaminated comparisons of employment stabilitybefore and after changes in union membership status.
The results are strong. Differences between union and nonunion hours-of-work variation are smaller than the differences between union and nonuniontenure, suggesting that use of tenure data to measure employment stability leadsto overestimates of the union effect on stability. In fact, when stability ismeasured in terms of hours-of-work variation rather than tenure, cross-sectionalestimates of the union effect decline from the 40 to 63 percent range to the 4 to 30percent range. Panel analysis, free from selectivity bias, further reduces theseunion effect estimates to not more than 11 percent. Thus, although unions mayhave some affect on employment stability, past estimates appear to suffer fromsubstantial upward bias. The introduction of a new measure of employmentstability and the use of panel data have reduced estimates of the union effect byapproximately five-fold.

286 JOURNAL OF LABOR RESEARCH
II.1o
I
IK:
s:oa
aI
P
— r n o o o — 0000 <*>r^fn— \omr»
. _H (N vo M Ov
g
asS o •^ r- 00 ^
00 4 — q (NS ' -^ >X ^ r- — ^
*O m OV t<N Tt W <00 »n »*> '

SOLOMON W. POLACHEK and ERNEST P. McCUTCHEON 287
BIBLIOGRAPHY
Becker, Brian. "Hospital Unionism and Employment Stability," IndustrialRetations 17 (February1978): 96-101.
Blau, Francine and Kahn, Lawrence. "The Exit-Voice Tradeoff in the Labor Market: Some Addi-tional Evidence." Mimeographed, 1980.
Bloch, Farrell E. and Kuskin, Mark S. "Wage Determination in the Union and Nonunion Sectors."Industrial and Labor Relations Review "iX (January 1978): 183-92.
Borjas, George J. "Job Satisfaction, Wages and Unions." Journal of Human Resources 14 (Winter1979): 21-40.
Duncan, Greg J. and Leigh D. "Wage Determination in the Union and Nonunion Sectors: A SimpleSelectivity Approach." Industrial and Labor Relations Review 2A (October 1980): 24-34.
and Stafford, Frank P. "Do Union Members Receive Compensating Wage Differ-entials?" American Economic Review 70 (June 1980): 355-71.
Freeman, Richard B. "The Effect of Unionism on Worker Attachment to Firms." Journal of LaborResearch 1 (Spring 1980a): 29-61.
"The Exit-Voice Tradeoff in the Labor Market: Unionism, Job Tenure, Quits, andSeparations." Quarterly Journal of Economics 94 (June 1980b): 643-73.
and Medoff, James L. "The Impact of Collective Bargaining: Illusion or Reality?"Memographed, March 1981.
Goldberger, Arthur. "Abnormal Selection Bias." Working Paper 8006. Social Systems ResearchInstitute, University of Wisconsin, Madison, May 1980.
Heckman, James J. "The Common Structure of Statistical Models of Truncation, Sample Selectionand Limited Dependent Variables and a Simple Estimator for Such Models." Annals of Eco-nomics and Social Measurement 5 (Fall 1976): 475-92.
Kahn, Lawrence M. and Morimune, Kimio. "Unions and Employment Stability: A Sequential LogitApproach." International Economic Review 20 (February 1979): 217-35.
Lee, Lung-Fei. "Unionism and Wage Rates: A Simultaneous Equations Model with Qualitative andLimited Dependent Variables." International Economic Review 19 (June 1978): 415-33.
Lewis, H. Gregg. Unionism and Relative Wages in the United States: An Empirical Inquiry. Chicago:University of Chicago Press, 1963.
"Union Relative Wage Effects: A Survey." Paper presented at National BureauConference on Labor Economics, Boston, 1982.
Medoff, James L. "Layoffs and Alternatives Under Trade Unions in U.S. Manufacturing." Amer-ican Economic Review 69 (June 1979): 380-95.
Schmidt, Peter. "Estimation of a Simultaneous Equations Model with Jointly Dependent Continuousand Qualitative Variables: The Union-Earnings Question Revisited." International EconomicReview 19 (June 1978): 453-65.
and Strauss, Robert P. "The Effects of Unions on Earnings and Earnings onUnions: A Mixed Logit Approach." /nre/-«fl//o/!a/£co/io/n/c/?ev(e>v 17 (February 1976): 204-12.
U.S. Bureau of Labor Statistics. Chacteristics of Major Collective Bargaining Agreements, July I,1975. Bulletin 1957. Washington, D.C, 1977.
U.S. Department of Labor, Bureau of Labor Statistics. Major Collective Bargaining Agreements,Grievance Procedures. Bulletin 1425-1. Washington, D.C, November 1964.