Unintended Negative Consequences of Rewards for …...Unintended Negative Consequences of Rewards...
23
Unintended Negative Consequences of Rewards for Student Attendance: Results from a Field Experiment in Indian Classrooms Melody M. Chao * Rajeev Dehejia $ Anirban Mukhopadhyay # Sujata Visaria % April 21, 2015 In an experiment in non-formal schools in Indian slums, an incentive for attending a target number of school days increased average attendance when the incentive was in place, but had heterogeneous effects after it was removed. Among students with high baseline attendance, the post-incentive attendance returned to previous levels and test scores were unaffected. Among students with low baseline attendance, post-incentive attendance dropped even below previous levels, and test scores decreased. These students also reported lower interest in school material and lower expectations of themselves. Thus incentives might have unintended negative consequences in the long term for the very students they are most expected to help. Keywords: educational economics, incentives, attendance, motivation, experiment *: Department of Management, School of Business and Management, The Hong Kong University of Science & Technology, Clear Water Bay, Hong Kong. E-mail: [email protected] $: Wagner School of Public Policy, New York University, The Puck Building, 295 Lafayette Street, Room 3004, New York, NY 10012, USA. E-mail: [email protected] #: Department of Marketing, School of Business and Management, The Hong Kong University of Science & Technology, Clear Water Bay, Hong Kong. E-mail: [email protected] %: Department of Economics, School of Business and Management, The Hong Kong University of Science & Technology, Clear Water Bay, Hong Kong. E-mail: [email protected], Corresponding author. We thank Dr. Pankaj Jain, Hiral Adhyaru, Sonal Mody and numerous class teachers and supervisors at Gyan Shala for their support and cooperation on this project. Putul Gupta expertly managed the project in the field. Funding for the field implementation of this project was received from the Research Project Competition at The Hong Kong University of Science and Technology through grant RPC10BM11. All errors are our own.
Transcript of Unintended Negative Consequences of Rewards for …...Unintended Negative Consequences of Rewards...
Unintended Negative Consequences of Rewards for Student Attendance: Results from a Field Experiment in Indian Classrooms
Melody M. Chao* Rajeev Dehejia$
Anirban Mukhopadhyay# Sujata Visaria%
April 21, 2015
In an experiment in non-formal schools in Indian slums, an incentive for attending a target number of school days increased average attendance when the incentive was in place, but had heterogeneous effects after it was removed. Among students with high baseline attendance, the post-incentive attendance returned to previous levels and test scores were unaffected. Among students with low baseline attendance, post-incentive attendance dropped even below previous levels, and test scores decreased. These students also reported lower interest in school material and lower expectations of themselves. Thus incentives might have unintended negative consequences in the long term for the very students they are most expected to help.
Keywords: educational economics, incentives, attendance, motivation, experiment
*: Department of Management, School of Business and Management, The Hong Kong University of Science & Technology, Clear Water Bay, Hong Kong. E-mail: [email protected] $: Wagner School of Public Policy, New York University, The Puck Building, 295 Lafayette Street, Room 3004, New York, NY 10012, USA. E-mail: [email protected] #: Department of Marketing, School of Business and Management, The Hong Kong University of Science & Technology, Clear Water Bay, Hong Kong. E-mail: [email protected] %: Department of Economics, School of Business and Management, The Hong Kong University of Science & Technology, Clear Water Bay, Hong Kong. E-mail: [email protected], Corresponding author.
We thank Dr. Pankaj Jain, Hiral Adhyaru, Sonal Mody and numerous class teachers and supervisors at Gyan Shala for their support and cooperation on this project. Putul Gupta expertly managed the project in the field. Funding for the field implementation of this project was received from the Research Project Competition at The Hong Kong University of Science and Technology through grant RPC10BM11. All errors are our own.

1 Introduction A growing literature in economics examines whether student incentives can improve schooling outcomes in contexts with low academic achievement (Angrist & Lavy 2009, Miguel, Kremer & Thornton 2009, Fryer 2011, Bettinger 2012, Levitt, List, Neckermann & Sadoff 2012). The underlying assumption behind incentive interventions is that the target student population has sub-optimally low motivation to exert effort at school. This may be because students are unaware of the benefits of schooling, are too impatient to work for benefits that will accrue far in the future, or lack the self-control to trade-off current costs against future benefits. A nearer-term incentive that rewards them for say, reading a book or attending school, can provide the “carrot” that will change their behavior.
Problems of impatience and self-control notwithstanding, some students do exert effort and achieve high test scores. Economists examining incentive interventions do not expect the largest gains among these students: since they already exert high effort even in the absence of the incentive, any gains at the margin will be small. Instead, incentives are expected to have large treatment effects on children who have lower baseline academic outcomes due to the lack of motivation. For such students, the promise of a reward creates the necessary motivation to perform a school-related task. Holding everything else constant, this increased effort at school tasks should improve academic performance eventually.
Contrary to the economist’s view that incentivizing student can increase their motivation, is the literature arguing that incentives can destroy students’ intrinsic motivation to learn (Deci, Ryan & Koestner 1999). Research in psychology shows that students are successful when they enjoy the process of mastering knowledge and skills (Dweck & Leggett 1988, Dweck 2000, Payne, Youngcourt & Beaubien 2007). The extrinsic motivation provided by an incentive can reduce intrinsic motivation: that is, attaching a price to a task that was initially enjoyable can make it less enjoyable (Deci & Ryan 1985). If the incentive is large enough, students might be motivated extrinsically to increase their effort in order to earn the reward. However, if it reduces intrinsic motivation, then when it is removed, the lack of extrinsic motivation and lower intrinsic motivation together could lower student effort even below what it would have been if the task had never been incentivized to begin with (Gneezy, Meier & Rey-Biel 2011).1
Two points emerge from this literature. First, economists expect that the benefits of incentives will be largest for students with low prior motivation. Psychologists expect instead that incentives will lower effort and achievement, particularly for students who had some intrinsic
1 Some research in economics also points to other negative effects of incentives, such as when by offering an incentive the principal signals that they do not trust the agent (Fehr & Rockenbach 2003), or that the task is difficult (Bremzen, Khokhlova, Suvorov and van de Ven 2015).
1

motivation to start with, i.e. those who exerted effort in the absence of incentives. Most studies have focused on the average effects, thus pooling the effects on the two subgroups of students: those with low and with high prior motivation.
Second, our reading of the literature suggests that the effects of an incentive could be different when one examines only the period when the incentive is in place, or the period after it has been removed. Most experimental studies examine effects only during the period when the incentive is in place. To the extent that most incentive schemes have short durations whereas schooling is a long-term activity, there is a case for examining the longer-term impacts of an incentive, after it has been removed.
In this paper we report on a field experiment in non-formal schools in Indian slums, where all students in randomly selected classes were offered an incentive for meeting an attendance target during a specified 40-day period. We examine its effect separately on students with low and with high prior attendance rates. Also, we examine the effect on student attendance both during the 40-day target period, and after this period ended, which allows us to examine the longer-term effects of the incentive.
We find that both in the pooled sample as well as within the two sub-groups, student attendance increased when the incentive was in place. However, the two sub-groups behaved very differently after the incentive was removed. Students who had high prior attendance continued to attend school at the same rate as before the intervention. In contrast, those with low prior attendance became even less likely to attend school than they would have been if the incentive had not been offered.
Our results show that it is instructive to examine the effects of incentives for students with low and high initial motivation separately. However, the effects of incentives are not in line with the ideas that incentives primarily help students with low motivation (the economist view), or that they hurt students with high motivation (the psychologist view). Instead, the incentive appears to have had no long-term effects on students who had high motivation to begin with. Instead, it had negative long-term impacts on students with low motivation to begin with, a group that arguably needed to improve academic performance the most. Scores on a test administered three months after the incentive scheme were also affected in the same manner: the test scores of students with high prior attendance are unaffected by the incentive scheme, but those of students with low prior attendance became lower than if there had been no incentive at all. The reward also lowered these students’ liking for school subjects, and lowered their expectations of themselves.
2

Thus, in contrast to the existing literature, we find that although the incentive motivated students in the short-run while it was in place, it had unintended negative consequences for students with low baseline motivation, whom they were intended to help.
The rest of this paper is organized as follows. Section 2 describes the empirical context. Section 3 describes the experimental intervention and data. Section 4 presents the empirical results. Section 5 discusses the implications of the study and concludes.
2 The Empirical Context Our experiment was conducted in collaboration with Gyan Shala, a non-government organization that runs non-formal education centers (henceforth referred to as GS classes) in the slums of Ahmedabad in the state of Gujarat in western India. In 2010, Gyan Shala had 343 classes operating across 5 areas in the city (CfBT Education Services 2010).
Each Gyan Shala education center is a single-grade class housed in a single room in a slum, usually rented from a local resident. Students pay no fees. The median class (in our sample) has 22 students, all of whom are from the same or from neighboring slums.2 Each classroom has basic school supplies, and teaching is mainly lecture-based. In addition, each student has a workbook with exercises that he/she must work on during class. Three subjects are taught: language (Gujarati), mathematics and science.
Gyan Shala’s mission is to provide low SES children a high quality education at a low cost. Operational costs are kept low by hiring teachers who do not have a teaching qualification, and therefore would not be hired by formal schools. Most teachers have only a Class 12 school certificate. To ensure quality, Gyan Shala trains these teachers intensively: the typical school year includes 30 training days. The teachers closely follow day-wise lesson plans that they receive from a “design team” made up of subject specialists who hold bachelors or masters degrees. Also, a supervisor visits each class once a week to observe and provides inputs as needed. When it is revealed that students in particular classes are having difficulty with a particular topic, the appropriate design team members visit the classroom to investigate further and to help the teacher. The information gathered is fed back into the lesson plan for the future.
The parents of Gyan Shala students are for the most part self-employed or casual workers in the unorganized sector. They have low education levels and therefore limited ability to support their children’s learning at home. Gyan Shala hopes to provide these parents with an attractive alternative to the local municipal school, while also demonstrating that a good education need
2 An important consideration for Gyan Shala is that children be able to walk to school unescorted, since this lowers the time and transport costs of attending school and helps to lower absenteeism.
3

not be expensive. An independent evaluation found that Gyan Shala students outperformed their peers in municipal schools on language, mathematics and science by wide margins (Educational Initiatives 2010). On average Gyan Shala students were also better able to answer the more difficult, “non-straightforward” questions. A short-lived experimental intervention where Gyan Shala’s teaching techniques were adopted in municipal schools also generated significant impact, with treatment municipal schools outperforming control municipal schools (Educational Initiatives 2010).
Gyan Shala’s main effort has been to run classes for grades 1, 2 and 3. Our experiment was conducted in grade 2 and grade 3 classes, but we report here only the results for grade 3 classes because those are the only students who took a test administered by Educational Initiatives (EI), that provides us with an independent assessment of their achievement. The EI examination only tested mathematics and science.
The goal of this study was to examine the effect of an incentive to increase student effort, on student performance.3 The administrators at Gyan Shala identified attendance as the appropriate task to target. Research in higher-income countries has shown that student attendance is correlated with performance (Roby 2004, Paredes & Ugarte 2011). It is likely that this relationship is even stronger in our context, where parents can provide limited support at home. At an unannounced visit made by our investigators two months into the 2011-12 school year, 75 percent of students in sample classes were present. This number matches the 75 percent average attendance rate for Gujarat state reported by previous research (Educational Consultants India 2007). While considerably lower than the standard of 92-93 percent set by school boards in many developed countries, this number is also not so low that it might be mainly caused by structural factors outside students’ control. Gyan Shala administrators believed that some part of their students’ absence was truancy, i.e. missing school for reasons such as wanting to play instead, attending festivals, or because their siblings had a day off at their school.
3 The Experimental Intervention and Data Our study took place during the academic year 2011-12. The academic year begins in June and ends in April. Our sample consists of 68 grade 3 classes spread evenly across all 5 city zones where Gyan Shala operates. In each class, we drew a random sample of 12 students. Investigators made six unannounced visits to the classrooms. At all six, they took roll-call of the
3 This is part of a larger project aimed at understanding the impact of economic and psychological interventions on student achievement. For more detail, see Chao, Dehejia, Mukhopadhyay & Visaria (2015). In this paper we focus on the intervention that rewarded students for good attendance.
4

sample students to check if they were present. 4 At three of the visits they also conducted 10-minute surveys with the sample students. Survey questions were about the students’ like and dislike for particular subjects, and their expectations and attitudes about learning and exerting effort on difficult tasks. In the very first round, students were also asked to provide demographic information about themselves and their family members.
In December, the supervisors introduced the incentive scheme in randomly selected classes. To avoid the spread of information about the incentive scheme across classes, classes were first stratified by neighborhood and then randomized so that classes with and without the incentive scheme were in different neighborhoods. The scheme promised a reward to all students in the class who attended more than 85% of school days during the 38-day period between 10th December and 25th January.5 To inform students about the scheme, the supervisors put up on the wall a chart with each student’s name and each school date during the incentive period. Next, following a script that the research team had prepared, they told the students that when they skipped school, it became harder for them to understand the material that was taught, and this also affected their ability to learn subsequent material. The school had decided that any student who attended school regularly would receive a reward. Their attendance would be marked on the chart every day during the specified period. At the end of this period, all students who had attended more than 32 days would be eligible for a reward. The students were then shown samples of the reward (each reward was two pencils and an eraser), and were told that the supervisor would give them one of these as a reward.
In the classes that were assigned to the control group, the supervisors gave each teacher a similar chart to fill in every day. The chart was not made public, and the supervisor did not make any announcements in class.
At the end of the incentive period, our project coordinator collected all the charts and identified the students who had earned the reward. She then provided the supervisors with a list of these students. The supervisors distributed the rewards to the winning students, in the presence of all other students. Students who received the reward were asked to sign their name to acknowledge receipt. All rewards were distributed within two weeks of the end of the incentive period. No further announcements about attendance were made.
4Visits were all scheduled to begin at least an hour after the school day began, so as to not miss late-comers. However, since the Gyan Shala classes are located within the student’s own neighborhood, a teacher could send word to a student and summon him or her to class when the investigator arrived. To prevent this from contaminating our attendance measure, we instructed the investigator to assign a separate code (E for “entered during visit”) to any child who entered the classroom after she had entered it. In our analysis such students are considered absent. 5The exact length of the reward period varied slightly across neighborhoods because depending on the dominant religion in the slum, Gyan Shala uses a different holiday list.
5

In March, all grade 3 students took a test in mathematics and science, administered by an independent testing authority, Educational Initiatives (EI). The scores on tests administered by EI have been used to evaluate student performance in previous research on education in India (Muralidharan & Sundararaman 2011). Their test questions were aimed at uncovering student ability, and so did not directly test the material covered in the classroom. Thus, memorizing material taught in school was unlikely to guarantee a high test score, and since Gyan Shala teachers are required to follow their day-wise lesson plan, they were unlikely to be able to teach to the test. All test questions were multiple-choice. Students were given question papers, the exam administrator read aloud an exam question, asked students to circle the correct alternative, and then moved on to the next question. Test administrators unaffiliated with Gyan Shala then took these question papers and filled in an optimal mark recognition (OMR) sheet for the student. To minimize costs, Gyan Shala opted to have a random subsample of exam scripts graded. These were then processed, and the test scores were delivered both to EI and to Gyan Shala. EI then prepared a summary report of the students’ performance in each class. This report also classifies each question in the test according to the type of knowledge it was testing. Using this information, we classify the questions into “simple”, “intermediate” and “complex” and we analyze not just the total scores in the math and science tests, but also the scores on the simple, intermediate and complex questions in each subject. We have test score data for 584 of the 799 students in our sample. Figure 1 summarizes the sequence of events.
Figure 1: Sequence of Events
Jun 2011
•School year
began
Aug 2011
•Time 0 attendance
visit
Sep -- Oct 2011
•Time 1 interview
visit
Nov 2011
•Time 2 attendance
visit
Dec -- Jan 2012
•Reward period
•Time 3 interview
visit
Feb 2012
•Time 4 attendanc
e visit
Mar 2012
•Time 3 interview
visit •EI test
6

Table 1: Sample Characteristics
All No reward Reward p-value
(1) (2) (3) (4)
Student characteristics: Female 0.51 0.49 0.54 0.257
(0.02) (0.03) (0.03)
Year of birth 2002.8 2002.8 2002.8 0.785
(0.06) (0.08) (0.08)
Body Mass Index (kg/m2) 13.83 13.85 13.81 0.842
(0.11) (0.15) (0.16) Household assets:
Mobile phone 0.93 0.92 0.93 0.810
(0.01) (0.01) (0.01)
VCR/DVD 0.36 0.37 0.35 0.791
(0.03) (0.04) (0.04)
Computer 0.01 0.01 0.01 0.659
(0.00) (0.01) (0.01)
Autorickshaw/motorbike/car 0.25 0.23 0.27 0.275
(0.02) (0.03) (0.03)
Toilet in the house 0.73 0.69 0.78 0.148 (0.03) (0.04) (0.05) School-related variables:
Present at Time 0 0.75 0.74 0.75 0.817
(0.02) (0.03) (0.03)
Administrative attendance record 0.78 0.79 0.78 0.585
(0.01) (0.01) (0.01)
z-score on previous year's exam 0.00 0.02 -0.03 0.687
(0.06) (0.08) (0.09)
Likes maths (range = [-3, 3]) 2.46 2.51 2.41 0.367
(0.06) (0.08) (0.08)
Likes science (range = [-3, 3]) 1.99 2.09 1.87 0.158
(0.08) (0.10) (0.11)
Can learn to do crossword puzzle 0.96 0.96 0.96 0.723
(0.01) (0.01) (0.01)
Performance of a weak student (range = [1, 5]) 2.24 2.30 2.17 0.481 (0.09) (0.12) (0.13) Means are computed from the baseline student survey data. t-tests account for correlation at the class level.
3.1 Descriptive Statistics Table 1 presents summary statistics from our sample, and checks whether there were significant differences between the control and treatment classes. Our sample consists of 799 students from
7

68 grade 3 classes. About half the students were female. They were on average 9 years old, suggesting only slightly delayed grade-for-age progression, since children start in grade 1 when they are six years old. Since we did not interview their parents, we had to rely on the children’s reports of household assets to infer socio-economic status. We also measured their height and weight, on the grounds that their body mass index may be correlated with their socio-economic status. Note however that all children are residents of low-income neighborhoods and so variation in SES is likely to be small. The average child had a body mass index of 13.8, which places them between the 3rd and 5th percentiles of a normal international population (World Health Organisation 2007).
Ninety-three percent of children reported that at least one person in their household owned a mobile phone. A quarter reported that their parents had a motorized vehicle. Three quarters had a toilet in the house, and a little over a third had a VCR or DVD player. Computers were almost non-existent. There were no significant differences between the control and treatment groups on these dimensions.
At their unannounced visit conducted about 6 weeks after the school year had begun (Time 0), investigators found 75 percent of the sample students present in class. According to the administrative attendance record for the first two months of school, these students were present for 78 percent of school days. We compute a z-score of the students’ scores on their final exam (conducted by Gyan Shala) the previous year, and do not find a significant difference across treatment (mean = 0.02) and control classes (mean = -0.03). In the interview at Time 1 we asked students to report their liking for particular subjects they learn in school, and their expectations of themselves and of a hypothetical weak student. Students provided a rating for their liking for each subject on a 7-point scale. As can be seen, mathematics was very popular among students, with an average rating of 2.5 on a scale ranging from -3 to +3. The difference between control and treatment schools was not significant. Science was relatively less popular, with an average rating of 2. Ninety-six percent of students said they thought they could learn how to solve a crossword puzzle (they had been introduced to crossword puzzles shortly before the Time 1 interview). Students were also asked a question about a hypothetical child who is unable to solve a sum, and asked how that child would perform on a test, on a scale of 1 to 5. The average score that children predicted was 2.2, and the difference between treatment and reward schools was not statistically significant.6 We therefore conclude that the control and treatment groups were balanced on observables.
6 To collect data on how much the students liked something, they were shown pictures and asked to point to the one that best described their answer to the question. For example, to assess how much they liked a subject they were taught in school, they were first asked to choose either a smiling, neutral or crying face to indicate if they liked, were indifferent towards, or disliked the subject. If they chose the smiling face,
8

Table 2: Effect of reward scheme on attendance at unannounced visits
All students Present at Time
0 Absent at Time
0
(1) (2) (3)
Time 3 1.320 1.420 1.155
(0.227) (0.304) (0.341)
Time 4 0.878 0.902 0.823
(0.141) (0.176) (0.237)
Time 5 0.821 0.714* 1.155
(0.131) (0.134) (0.341)
Reward school x Time 3 1.993*** 1.838* 2.307*
(0.532) (0.589) (1.137)
Reward school x Time 4 1.109 1.095 1.130
(0.255) (0.298) (0.493)
Reward school x Time 5 0.822 1.055 0.421**
(0.184) (0.277) (0.182)
Observations 2,270 1,625 645
Number of students 454 325 129
All columns report student fixed-effects logit regressions, where the dependent variable indicates if the student was present or absent at the unannounced visit. Odds ratios are reported. *** p<0.01, ** p<0.05, * p<0.1.
4 Empirical Specification and Results
4.1 Attendance We start by examining the effect of the incentive scheme on attendance, both when the incentive was in place and also after it had been removed. We use a panel dataset of student-time observations with one time point for each visit that the investigators made to the class. The Time 0 observations are dropped because as we shall see below they are used to classify students by baseline attendance levels. We run logit regressions of the following specification:
𝑦𝑦𝑖𝑖𝑖𝑖𝑖𝑖 = 𝛼𝛼𝑖𝑖 + 𝛽𝛽1 Time 3𝑖𝑖 + 𝛽𝛽2 Time 4𝑖𝑖 + 𝛽𝛽3 Time 5𝑖𝑖 + 𝛽𝛽4(Reward × Time 3𝑖𝑖)+ 𝛽𝛽5 (Reward × Time 4𝑖𝑖) + 𝛽𝛽6 (Reward × Time 5𝑖𝑖) + 𝜖𝜖𝑖𝑖𝑖𝑖𝑖𝑖 (1)
they were then asked to choose one of three happy faces where the faces and smiles were small, medium or large, to indicate how intensely they liked it. If they had chosen the crying face, then this question gave them three unhappy faces to choose from, where the faces, frowns and tears became incrementally larger. To collect their opinion on a student’s test performance, they were asked to choose one of five pictures, ranging from one star to five stars.
9
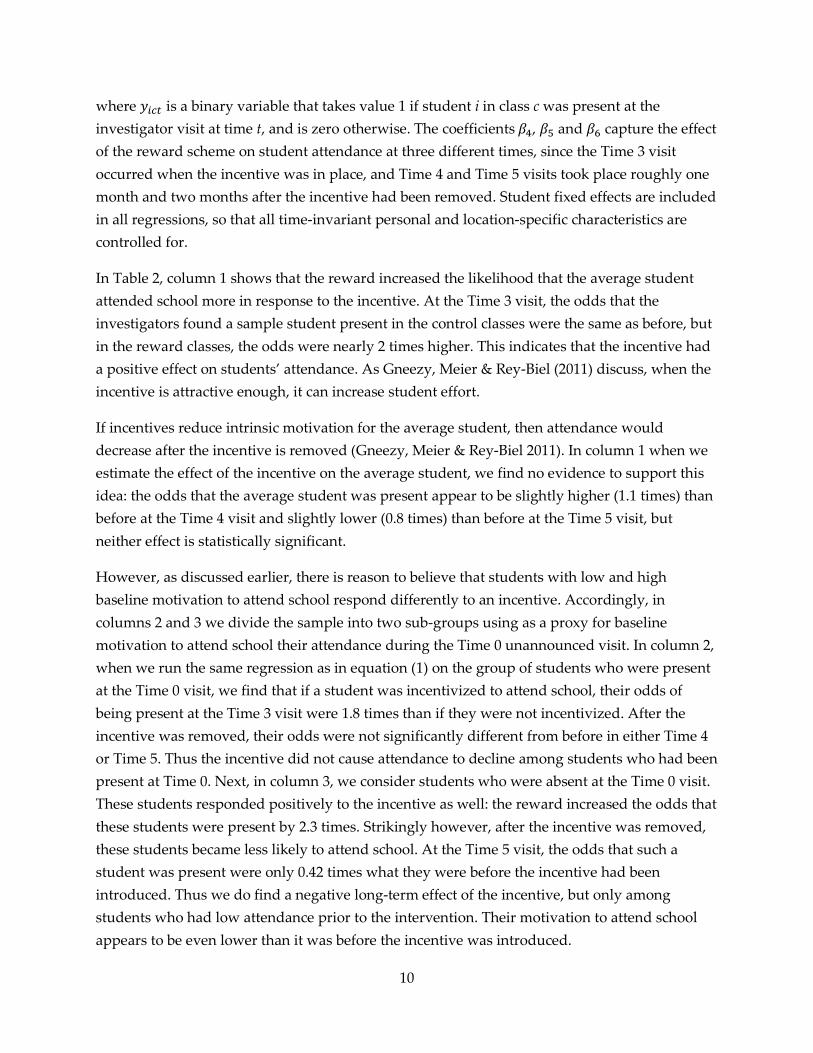
where 𝑦𝑦𝑖𝑖𝑖𝑖𝑖𝑖 is a binary variable that takes value 1 if student i in class c was present at the investigator visit at time t, and is zero otherwise. The coefficients 𝛽𝛽4, 𝛽𝛽5 and 𝛽𝛽6 capture the effect of the reward scheme on student attendance at three different times, since the Time 3 visit occurred when the incentive was in place, and Time 4 and Time 5 visits took place roughly one month and two months after the incentive had been removed. Student fixed effects are included in all regressions, so that all time-invariant personal and location-specific characteristics are controlled for.
In Table 2, column 1 shows that the reward increased the likelihood that the average student attended school more in response to the incentive. At the Time 3 visit, the odds that the investigators found a sample student present in the control classes were the same as before, but in the reward classes, the odds were nearly 2 times higher. This indicates that the incentive had a positive effect on students’ attendance. As Gneezy, Meier & Rey-Biel (2011) discuss, when the incentive is attractive enough, it can increase student effort.
If incentives reduce intrinsic motivation for the average student, then attendance would decrease after the incentive is removed (Gneezy, Meier & Rey-Biel 2011). In column 1 when we estimate the effect of the incentive on the average student, we find no evidence to support this idea: the odds that the average student was present appear to be slightly higher (1.1 times) than before at the Time 4 visit and slightly lower (0.8 times) than before at the Time 5 visit, but neither effect is statistically significant.
However, as discussed earlier, there is reason to believe that students with low and high baseline motivation to attend school respond differently to an incentive. Accordingly, in columns 2 and 3 we divide the sample into two sub-groups using as a proxy for baseline motivation to attend school their attendance during the Time 0 unannounced visit. In column 2, when we run the same regression as in equation (1) on the group of students who were present at the Time 0 visit, we find that if a student was incentivized to attend school, their odds of being present at the Time 3 visit were 1.8 times than if they were not incentivized. After the incentive was removed, their odds were not significantly different from before in either Time 4 or Time 5. Thus the incentive did not cause attendance to decline among students who had been present at Time 0. Next, in column 3, we consider students who were absent at the Time 0 visit. These students responded positively to the incentive as well: the reward increased the odds that these students were present by 2.3 times. Strikingly however, after the incentive was removed, these students became less likely to attend school. At the Time 5 visit, the odds that such a student was present were only 0.42 times what they were before the incentive had been introduced. Thus we do find a negative long-term effect of the incentive, but only among students who had low attendance prior to the intervention. Their motivation to attend school appears to be even lower than it was before the incentive was introduced.
10

4.2 Test scores This pattern in long-term attendance is also found when we consider scores on a test administered two months after the incentive was removed. In Table 3, we run regressions with the following specification
𝑦𝑦𝑖𝑖𝑖𝑖 = 𝛽𝛽0 + 𝛽𝛽1Rewardi𝑖𝑖 + 𝛽𝛽2𝑋𝑋𝑖𝑖𝑖𝑖 + 𝜖𝜖𝑖𝑖𝑖𝑖 (2)
where the dependent variable is standardized score of the student’s marks on the Educational Initiatives test administered at the end of the school year. As was described earlier, the EI test consisted of questions about mathematics and science. Each student receives a z-score which tells us by how many standard deviations this student’s test score was different from the mean score (where the mean is computed across all students in all 68 classes in the sample). Controls include the student’s z-score on the final exam in the previous year, the student’s gender, the city zone where the class is located, and a dummy variable for the psychological intervention that was conducted in an orthogonal design to the reward intervention. Standard errors are clustered at the class-level.
As column 1 in Table 3 shows, although the average treatment effect on the aggregate test score is negative it was not statistically different from zero. This is also true when we analyze the mathematics (column 4) and science (column 7) scores separately.
However, as we see in columns 2, 5 and 8, this null effect was driven by students who were present at Time 0. Although we have noted above that these students attended school more during the reward period and attended it no differently afterwards, there was no effect on their test scores. This could be because the reward did not influence their interest in learning or that their attendance was high enough that their test scores were not responsive on that margin.
In sharp contrast, column 3 shows that among students who were absent at Time 0, the reward scheme lowered test performance, so that their score was 0.59 standard deviations lower than their counterparts who were in non-reward classes. This result is replicated when we analyze their mathematics (-0.48σ, column 6) and science scores separately (-0.59 σ, column 9). Thus after the incentive was removed, these students attended school less, and had worse academic performance than if the reward scheme had not been introduced at all.
4.3 Mechanisms 4.3.1 Lower Scores on Difficult Questions In an attempt to understand what lowered test scores for these students, we examine separately their scores on questions of different difficulty levels. Educational Initiatives provided a description of the type of knowledge that each question was assessing, and we use this to
11

Table 3: Effect of reward scheme on test scores
Aggregate
Mathematics
Science
All students
Present at Time 0
Absent at Time 0
All students
Present at Time
0
Absent at Time
0
All students
Present at Time
0
Absent at Time
0 (1) (2) (3) (4) (5) (6) (7) (8) (9) Reward -0.062 0.055 -0.586**
-0.055 0.036 -0.483**
-0.052 0.069 -0.594**
(0.202) (0.216) (0.235)
(0.207) (0.233) (0.202)
(0.182) (0.179) (0.278)
Constant 0.187 0.270 0.052
0.112 0.165 0.051
0.207 0.293 0.053
(0.286) (0.291) (0.430)
(0.290) (0.322) (0.413)
(0.245) (0.246) (0.372)
Observations 584 419 152
584 419 152
583 418 152
R-squared 0.076 0.101 0.151 0.059 0.070 0.126 0.077 0.107 0.141
All columns report OLS regressions. The dependent variable is the student's z-score on Educational Initiatives’ test. The student's z-score on the previous year's final exam is controlled for. A female dummy, zone dummies and a dummy for the orthogonal psychological intervention are included. Standard errors in parentheses are clustered at the school level. *** p<0.01, ** p<0.05, * p<0.1.
12

Table 4: Effect of reward scheme on test scores, broken by difficulty level
Mathematics
Science
Present at Time 0 Absent at Time 0
Present at Time 0 Absent at Time 0
Simple
Inter-mediate Complex Simple
Inter-mediate Complex
Simple
Inter-mediate Complex Simple
Inter-mediate Complex
VARIABLES (1) (2) (3) (4) (5) (6) (7) (8) (9) (10) (11) (12)
Reward 0.142 0.046 -0.141 -0.075 -0.475** -0.567**
0.072 -0.033 0.186 -0.234 -0.715** -0.308
(0.183) (0.225) (0.220) (0.197) (0.210) (0.231)
(0.190) (0.168) (0.145) (0.201) (0.276) (0.269)
Constant 0.165 0.111 0.201 0.244 -0.067 0.167
0.330 0.164 0.311 0.170 -0.033 0.068
(0.246) (0.295) (0.306) (0.381) (0.380) (0.293)
(0.211) (0.239) (0.239) (0.285) (0.337) (0.378)
Observations 419 419 419 152 152 152
419 418 419 152 152 152
R-squared 0.059 0.058 0.066 0.089 0.111 0.155 0.057 0.111 0.074 0.147 0.119 0.108
All columns report OLS regressions. The dependent variable is the student's z-score on the Educational Initiative's test. The student's z-score on the previous year's final exam is controlled for. A female dummy, zone dummies and a dummy for the orthogonal psychological intervention are included. Standard errors in parentheses are clustered at the school level. *** p<0.01, ** p<0.05, * p<0.1
13

Table 5: Effect of reward scheme on change in students' liking for maths and science
Mathematics
Science
VARIABLES All
students Present at
Time 0 Absent at
Time 0
Absent at both Time 0 & Time 5
All students
Present at Time 0
Absent at Time 0
Absent at both Time 0 & Time
5
(1) (2) (3) (4)
(5) (6) (7) (8)
Time 5 0.149** 0.131* 0.159 0.650**
0.120 0.100 0.098 0.300*
(0.060) (0.071) (0.133) (0.292)
(0.103) (0.109) (0.185) (0.152)
Reward × Time 5 0.007 0.053 -0.159 -0.923**
0.178 0.180 0.204 -0.073
(0.110) (0.115) (0.209) (0.372)
(0.144) (0.156) (0.237) (0.353)
Constant 2.584*** 2.625*** 2.527*** 2.346***
2.189*** 2.194*** 2.201*** 2.316***
(0.027) (0.029) (0.053) (0.096)
(0.037) (0.040) (0.062) (0.088)
Observations 1,437 1,068 349 102
1,437 1,068 349 102
Number of students 785 581 194 60
785 581 194 60
R-squared 0.017 0.021 0.009 0.125 0.019 0.016 0.022 0.035
All columns report student fixed effects regressions, where the dependent variable is the student's rating of her liking for the subject, at interviews in Time 3 and Time 5. A female dummy, zone dummies and an indicator for the orthogonal psychological intervention are included. Standard errors in parentheses are clustered at the class level. *** p<0.01, ** p<0.05, * p<0.1.
14

classify questions into simple, intermediate or complex.7 In Table 4 when we focus on students with low prior attendance, we see that students’ scores on simple questions were unaffected (columns 4 and 10). Instead, the negative effects were driven by the more difficult questions: intermediate and complex questions in mathematics (column 5 and 6) and intermediate questions in science (column 11). Among students who had high prior attendance, the reward did not have a significant impact on scores in any of these categories. (The coefficient for complex mathematics questions in column 3 was negative, but not significantly different from zero.) Thus the reward appears to have lowered the ability or willingness to answer difficult test questions among students who had low prior attendance to begin with.
4.3.2 Lower Interest in School Subjects We also find evidence that after the incentive was removed, students with low prior attendance reported a reduction in how much they liked their school subjects. In Table 5, we use data from the student interviews at Times 3 and 5 to run student fixed-effects regressions on their liking for mathematics and science using the following regression specification:
𝑦𝑦𝑖𝑖𝑖𝑖𝑖𝑖 = 𝛼𝛼𝑖𝑖 + 𝛽𝛽1Time 5𝑖𝑖 + 𝛽𝛽2 (Reward𝑖𝑖 × Time 5𝑖𝑖) + 𝜖𝜖𝑖𝑖𝑖𝑖 (3)
The dependent variable is the student’s rating of the subject on the 7-point scale. Student fixed effects, 𝛼𝛼𝑖𝑖, are included. The coefficient β2 captures whether students in reward scheme classes changed their rating after the reward scheme. As we see in column 1, for the average student, the rating for mathematics increased by 0.15 points (on a mean of 2.46) between Time 3 (when the incentive was in place) and Time 5 (after the incentive was removed), and this was unaffected by the reward scheme. For students with high prior attendance, the rating for mathematics increased by 0.13 points, and once again the reward scheme had no effect (column 2). When we instead focus on students with low prior attendance (absent at the Time 0 visit, column 3), the coefficient β2 becomes negative, although not significant.
One may worry that the investigators conducted the interviews in the classrooms, and so students who were absent at the time of the visit were less likely to be interviewed. To mitigate this problem of sample selection in the interview data, our investigators were required to make three efforts to find these students and interview them. This involved trying to find out where and when the student would be available, and making follow-up visits to these locations on these dates. Note that since the Gyan Shala classes are in the same neighborhoods as the students’ homes, it is easy to locate homes and interview the students at home if they are available. As a result, 79% of students who were absent on the day of the Time 5 visit, were
7 For a list of the knowledge categories that were tested and our classification into simple, intermediate and complex categories, see the Appendix.
15

Table 6: Effect of reward scheme on student expectations
Performance of a weak student
Can learn to solve a crossword puzzle
VARIABLES All
students
Present at Time
0
Absent at Time
0
Absent at both Time 0 & Time
5
All students
Present at Time
0
Absent at Time
0
Absent at both Time 0 & Time
5
(1) (2) (3) (4)
(5) (6) (7) (8)
Reward -0.081 -0.015 -0.309** -0.469**
-0.012* -0.007 -0.029* -0.024
(0.095) (0.109) (0.144) (0.174)
(0.007) (0.005) (0.014) (0.025)
Constant 2.022*** 1.981*** 2.059*** 2.360***
1.008*** 1.007*** 1.007*** 1.024***
(0.114) (0.127) (0.143) (0.215)
(0.005) (0.005) (0.007) (0.022)
Observations 777 576 191 55
776 575 191 55
R-squared 0.075 0.062 0.142 0.237 0.029 0.014 0.094 0.129 All columns report OLS regressions using student interview data from Time 3. In columns 1, 2 and 3 the dependent variable is the number of stars (maximum = 5) the student expects a child will receive on a maths sum that he/she does not know how to solve. In columns 4, 5 and 6 the dependent variable is an indicator variable for whether the student expects he/she can learn how to solve a crossword puzzle. A female dummy, zone dummies and a dummy for the orthogonal psychological intervention are included. Standard errors in parentheses are clustered at the school level. *** p<0.01, ** p<0.05, * p<0.1.
16

nevertheless interviewed. While significantly less than the 95% interview rate for those who were present in school during the Time 5 visit, this does give us a sample size large enough to measure these children’s liking for the subject. Therefore, in column 4 we restrict the sub-sample of students who were absent at the Time 0 interview further, to the subset that was also absent at Time 3 and therefore was interviewed at a special follow-up visit. If repeated absence is indicative of a lack of interest in school, then both reward and non-reward students in this sub-sample should have a lower liking for school subjects, and so we do not worry about sample selection. Within this sample we find that among non-reward students the rating for mathematics increased by 0.65 points, but for reward students it declined by 0.27 points and this decline was statistically significantly different from zero. Thus the results indicate that among students with low prior attendance, the incentive caused students’ liking for mathematics to decline.
Columns 5-8 repeat this analysis for the liking for science. In column 8 although the sign on β2
was negative, it was not statistically different from zero. We conclude that there is some evidence that for students with low prior attendance, the reward scheme reduced their interest in school. This is consistent with the psychological insight that intrinsic motivation is a key determinant of liking – as the intrinsic motivation to study a particular subject dwindles, liking for that subject correspondingly decreases.
4.3.3 Lower Expectations of Themselves Finally, in Table 6 we consider two other interview questions that measure student expectations. Students were told about a hypothetical student who was unable to solve a mathematics sum and asked to predict how he or she would perform on a test, on a scale of 1 to 5. As the results in column 3 show, in the Time 5 interview, students with low prior attendance who were in the reward condition gave on average 0.3 points lower to this hypothetical student than those who had not faced a reward scheme. This difference becomes even larger when we restrict the sample to students who were absent at both Time 0 and Time 5 (column 4). Students were also asked how confident they were that they could learn how to solve a crossword puzzle. (Teachers had introduced crossword puzzles in classes prior to the Time 1 interviews.) Once again, among students with low prior attendance, those in the reward condition were less likely to believe they could learn this new skill (columns 7 and 8, although the coefficient in column 8 is imprecisely estimated).
Since we have daily data from the incentive period for all classes in both the treatment and control groups, in unreported results we examine separately those students with low prior attendance who met the incentive target of 85% of school days during the incentive period, and those who did not. Among those who met the target, longer-term attendance (at the visit at Time 5) did not decline significantly. Among those who failed to meet the target, the reward
17

caused the odds of being present to decline to only 0.24 times their previous level. It is possible that the incentive scheme underscored these students’ low attendance rates and thus demotivated them even further.8
5 Conclusion We considered both the economists’ view and the psychologists’ view on student incentives and identified two issues that have not received much attention in the experimental incentive literature in economics: one, that the two views have different predictions for different groups of students, and two, that even if incentives have positive effects on student effort while they are in place, they could have longer-term negative effects. Our empirical evidence suggests that a separate analysis of students with high and low baseline effort is important, because incentives do indeed have different longer-term effects in the two groups. Specifically, we find that students with high baseline attendance (and presumably high baseline motivation) were influenced positively by the incentive in the short run. After the incentive was removed, this group was unaffected, but those with low baseline effort were negatively affected. Not only did these low baseline attendance students attend school less often after the incentive was removed than before the incentive was introduced,, they also had lower academic performance three months after the reward scheme ended, lower enjoyment of the material taught in school and lower optimism about their ability to learn a new skill.
In any incentive scheme, it is likely that some students will fail to earn the incentive because they do not meet the target. When an attendance target is absolute (as it was in our case), students with high attendance levels earn the incentive more easily, and the losers are disproportionately those with low attendance levels to start with. This paper shows that the incentive scheme can have unintended negative consequences for this very set of students, which is the group that the incentive scheme intended to help.
A few caveats are in order. First, it could be argued that if students were unable to attend school due to circumstances out of their control, then the reward scheme might have imposed an extremely challenging standard that only served to make their constraints more salient and discouraged them further. However, our attendance target was not unreasonable: it represented only a 13.3% increase over the 75% baseline attendance rate. In addition, according to school administrators, truancy was to blame for much of the absence. The reward period was deliberately chosen during a period when there are no festivals that often cause students to miss school. Despite this caveat, our findings provide robust support for the central message of this
8 Clearly in the treatment classes the attendance during the incentive period was affected by the reward and therefore cannot be treated as exogenous. This result should be interpreted with this caveat in mind.
18

paper, that rewards can have negative consequences on the students that educators intend to help the most.
Second, if the attendance target had been relative, students would have earned a reward if they improved their effort relative to their own baseline. Then students with low prior attendance could have earned rewards with relatively small increases in attendance and would have been less likely to be discouraged than in our experiment. Given that there is a distribution of student attendance within each classroom, this would have required catering the target to each student individually.9 Not only would this have been difficult to administer, it would have been difficult to ensure that each student understood what their own target was.10 Although pedagogical best practices prescribe that each student be set an achievement target that is appropriate for them individually, it is rare, especially in low SES contexts where teaching resources are scarce, that different standards of achievement are applied to different students. Thus our experiment tests an incentive scheme that closely simulates one that might be implemented in such a setting. It cautions educators and policymakers that such a scheme could end up hurting students whose effort and motivation need the greatest boost, without benefiting those who are already performing well.
9 However this might have discouraged students with high prior attendance, since some of them might have missed their own attendance target even if their attendance improved by more than their low prior-attendance peers’ attendance did. 10 In Bettinger (2012)’s study, for eighth and ninth graders the eligibility to receive cash rewards was randomized at the student level. However the target was still the same for all incentivized students. In Berry (2014)’s experiment, all students were offered rewards of the same value for meeting the same targets, but the type of reward was randomized at the student level.
19

References Angrist, Joshua and Victor Lavy (2009), “The Effects of High Stake High School Achievement Awards: Evidence from a Randomized Trial”, American Economic Review, 99(4): 1384—1414.
Berry, James (2014), “Child Control in Education Decisions: An Evaluation of Targeted Incentives to Learn in India”, Mimeo.
Bettinger, Eric P. (2012), “Paying to Learn: The Effect of Financial Incentives on Elementary School Test Scores”, The Review of Economics and Statistics, 94(3): 686—698.
Bremzen, Andrei, Elena Khokhlova, Anton Suvorov and Jeroen van de Ven (2015), “Bad News: An Experimental Study on the Informational Effects of Rewards”, The Review of Economics and Statistics, 97(1): 55—70.
Cameron, Judy & W. David Pierce (2002), Rewards and Intrinsic Motivation: Resolving the Controversy, Bergin & Garvey.
CfBT Education Services (2010), “The Gyan Shala Programme: An Assessment”, Technical Report.
Chao, Melody M., Rajeev Dehejia, Anirban Mukhopadhyay & Sujata Visaria (2015), “Effects of Lay Theories and Incentive Mechanisms on Human Capital Formation: Evidence from a Field Experiment in Low-Income Indian Schools”, Mimeo.
Deci, Edward L. and Richard M. Ryan (1985), Intrinsic Motivation and Self-determination in Human Behavior, New York, NY: Plenum Press.
Deci, Edward L., Richard Koestner and Richard M. Ryan (1999), “A Meta-Analytic Review of Experiments Examining the Effects of Extrinsic Rewards on Intrinsic Motivation”, Psychological Bulletin, 25(6): 627—668.
Dweck, Carol S. (2000), Self-Theories: Their Role in Motivation, Personality, and Development, Philadelphia: Psychology Press.
Dweck, Carol. S., & E. L. Leggett (1988), “A Social-Cognitive Approach to Motivation and Personality”, Psychological Review, 95(2), 256–273.
Educational Consultants India Limited (2007), “Study of Students’ Attendance in Primary & Upper Primary Schools: Abridged Report”, Technical Report.
Educational Initiatives Private Limited (2010), “Test of Student Learning for Gyanshala: Assessment Report”, Technical Report.
Fehr, Ernst and Bettina Rockenbach (2003), “Detrimental Effects of Sanctions on Human Altruism”, Nature, 422: 137—140.
Fryer, Roland (2011), “Financial Incentives and Student Achievement: Evidence from Randomized Trials”, Quarterly Journal of Economics, 126, 1755—1798.
Gneezy, Uri, Stephan Meier and Pedro Rey-Biel (2011), “When and Why Incentives (Don’t) Work to Modify Behavior”, Journal of Economic Perspectives, 25(4): 191—210.
20
Kremer, Michael, Edward Miguel & Rebecca Thornton (2009), “Incentives to Learn”, The Review of Economics and Statistics, 91(3): 437—456.
Levitt, Steven D., John A. List, Susanne Neckermann and Sally Sadoff (2012), “The Behavioralist Goes to School: Leveraging Behavioral Economics to Improve Educational Performance”, NBER Working Paper 18165.
Muralidharan, Karthik & Venkatesh Sundararaman (2011), “Teacher Performance Pay: Experimental Evidence from India”, Journal of Political Economy, 119(1): 39—77.
Paredes, Ricardo D. and Gabriel A. Ugarte (2011), “Should Students Be Allowed to Miss?”, The Journal of Educational Research, 104: 194—201.
Payne, S. C., S. S. Youngcourt & J. M. Beaubien (2007). “A Meta-Analytic Examination of the Goal Orientation Nomological Net”, Journal of Applied Psychology, 92(1), 128–150.
Roby, Douglas E. (2004), “Research on School Attendance and Student Achievement: A Study of Ohio Schools”, Educational Research Quarterly, 28(1): 3—14.
World Health Organisation (2007), “Growth Reference data for 5-19 years”, http://www.who.int/growthref/en/ (Accessed on 21st March 2015).
21

Appendix Table A.1: Classification of Educational Initiatives’ test questions by difficult level
Difficulty level Knowledge Tested Number of questions
Mathematics 30
Simple Number sense, related concepts and basic number competency 5 Intermediate Arithmetic operations: Addition & Subtraction 3
Arithmetic operations: Multiplication 3 Word problems & visual based problems 6 Basic shapes & geometry 4 Applications in daily life: money, time, calendar, length, etc. 5
Complex Problem solving (advanced or challenging problems) 4
Science 30 Simple Recollection or recognition of science facts & concepts 3
Definition or description of scientific terms, organisms or materials 4 Intermediate Knowledge of use of scientific instruments, tools and procedures 3
Classification/comparison of organisms/processes: giving examples 5 Representing or explaining processes or observed phenomena 5
Complex Extraction, translation and application of knowledge or information 3
Complex analysis, data interpretation, integrating different concepts 4 Hypothesis formulation or prediction of outcome 3
Note: The maximum score for each question was 1.
1


![20110712 Unintended Consequences 12[1].07](https://static.fdocuments.in/doc/165x107/577d278b1a28ab4e1ea429b5/20110712-unintended-consequences-12107.jpg)