Duplicate Orders: An Unintended Consequence of Computerized ...

Unintended Consequence of Voluntary Disclosure: Evidence from Informed Trading
after Firms’ Initiation of Quarterly Earnings Guidance*
Yun Ke
Assistant Professor
Goodman School of Business
Brock University
January 2015
* I thank Kin Lo and Sandra Chamberlain (co-supervisors) for their early comments and suggestions on
this paper. I also thank Joy Begley, John Gallemore (AAA discussant), Russell Lundholm, Rafael Rogo,
Rahul Vashishtha (AAA discussant), Shuo Yang (CAAA discussant), Jenny Zhang, workshop
participants at the University of British Columbia, the 2014 CAAA conference, and the 2014 AAA
conference for their comments. Any remaining errors are mine.

Unintended Consequence of Voluntary Disclosure: Evidence from Informed Trading
after Firms’ Initiation of Quarterly Earnings Guidance*
Yun Ke
January 2015
Abstract
Economic theory suggests disclosure reduces information asymmetry; recent disclosure models
incorporating investor heterogeneity (investor sophistication), however, argue that sophisticated
investors can benefit more from disclosure than unsophisticated investors. This paper examines
whether the level of informed trading in the market, measured by the PIN (probability of informed
trade) score, changes after firms initiate quarterly earnings guidance. After controlling for firms’
self-selection of guidance initiation, I find that the probability of informed trading increases after
guidance initiation and it is mainly due to the reduction of the intensity of uninformed
(unsophisticated) investors’ trading. I further examine how guidance characteristics affect the level
of informed trading and show that the increase in informed trading is mainly driven by bad news
and more precise earnings guidance. This is consistent with that bad news is complex and impedes
unsophisticated investors’ information processing. I also show that whether firms bundle guidance
with earnings announcement or not does not affect informed trading and the increase in informed
trading is concentrated in the first two quarters after guidance initiation.
Keywords: voluntary disclosure; earnings guidance; information asymmetry; probability of
informed trade (PIN)
Data availability: Data are available from sources identified in the paper.
JEL Classification: G14; M41
* I thank Kin Lo and Sandra Chamberlain for their early comments and suggestions on this paper. I also
thank Joy Begley, John Gallemore (AAA discussant), Russell Lundholm, Rafael Rogo, Rahul Vashishtha
(AAA discussant), Shuo Yang (CAAA discussant), Jenny Zhang, workshop participants at the University
of British Columbia, the 2014 CAAA conference, and the 2014 AAA conference for their comments. Any
remaining errors are mine.
1
1. Introduction
Conventional wisdom suggests that disclosure can reduce information asymmetry between firm
insiders and outside investors so that uninformed investors bear less risk trading again informed
investors. Disclosure models that derived this notion, however, assume that investors are
homogeneous and public information can substitute for certain private information held by
informed investors (Diamond, 1985; Diamond and Verrecchia, 1991). Incorporating investor
heterogeneity in terms of investor sophistication or information processing ability, other
disclosure models predict that sophisticated and unsophisticated investors can benefit from
disclosure differentially, which leads to an increase in the information gap between these two
types of investors so that the likelihood of informed trading increases (e.g., Indjejikian, 1991).1
While the intuition is simple, empirical evidence supporting this idea is limited.2 Using firms’
initiation of quarterly earnings guidance, this paper examines the impact of voluntary disclosure
on informed trading in the capital market.
Earning guidance, one major form of voluntary disclosure, contains more information
than earnings announcements (Beyer et al., 2010).3 More importantly, it contains forward-
looking information that is inherently unreliable and subject to management’s
optimistic/pessimistic bias.4 When firms initiate quarterly earnings guidance, sophisticated
investors quickly adjust their portfolios to include these firms as they favor firms with more
1 This stream of literature also includes Bushman et al. (1996), Fischer and Verrecchia (1999), and Kim and
Verrecchia (1994, 1997). 2 Some evidence emerges recently in the case of mandatory disclosure. For example, Gow et al. (2012) show
sophisticated investors benefit more than unsophisticated investors from more precise earnings. 3 Beyer et al. (2010) decompose the quarterly stock return variance and find that management forecasts provide
about 55% accounting-based information, which dominates other types of information resources (analyst forecasts
22%, earnings pre-announcements 11%, earnings announcements 8%, and SEC filings 4%). Ball and Shivakumar
(2008) reach a very similar conclusion. 4 For example, Ciconte et al. (2012) show that managers set their true earnings expectation close to the upper bound
of range forecasts, instead of the middle point. Nevertheless, even financial analysts as sophisticated information
intermediaries can only partially unravel the pessimistic bias in management earnings forecasts.

2
disclosure, a phenomenon called disclosure clientele (Kalay, 2012). As sophisticated investors
have superior abilities to process information than unsophisticated investors, it is likely the
information gap between these two types of investors will widen, which results in an increased
informed trading in the market.
Using the probability of informed trade (PIN) to measure the level of informed trading, I
examine whether firms experience any changes in informed trading after they initiate quarterly
earnings guidance during the period 2004–2009.5 Controlling for firms’ self-selection, I find
evidence that informed trading increases after the initiation of quarterly earnings guidance. The
increase in informed trading is both statistically and economically significant. Guidance
initiation leads to a 2% increase in informed trading.
To investigate the channels through which earnings guidance affects informed trading, I
examine the changes in the PIN parameters associated with guidance initiation. I show that when
firms initiate quarterly earnings guidance, the intensity of trades from both informed and
uninformed investors declines. However, the decline in the intensity of uninformed trade is
greater, which leads to an increase in informed trading (PIN) in the market. If one can assume
the information in earnings guidance is more complex than that in earnings announcement, this
finding is consistent with Miller’s (2010) finding that compared with large (sophisticated)
investors, small (unsophisticated) investors reduce their trading activities when company filings
5 This paper only focuses on the initiation or cessation of quarterly earnings guidance, not annual guidance. Houston
et al. (2010) point out that most guidance stoppers do not stop their annual earnings guidance. Chen et al. (2011)
also find that many firms switch from quarterly guidance to annual guidance only. Therefore, I only use quarterly
earnings guidance to identify the initiation and cessation. In a case where a firm already gives annual guidance
before the initiation of quarterly guidance or continues to provide annual guidance after the cessation of quarterly
guidance, it should work against my hypothesis.

3
are more complex (longer and less readable), suggesting that complex information costs more for
small investors to process.
Next, I explore how guidance characteristics affect the level of informed trading. Firms
can use guidance to provide good or bad news, provide forecasts at different levels of precision,
and choose to bundle with earnings announcement or not. Prior literature suggests that bad news
is more complex than good news (Bloomfield, 2008) and information complexity impedes
investors’ processing of information (e.g., Plumlee, 2003), so I hypothesize and find evidence
that informed trading increases with bad news. Examining the PIN parameters, I show the
reaction from uninformed investors is systematically greater than that from informed investors
and the likelihood of private information event increases after bad news guidance.
Prior research is inconclusive on whether sophisticated investors benefit more from
precise disclosure than unsophisticated investors (Indjejikian, 1991; Han and Tan, 2007; Gow et
al., 2012). This study, however, shows that informed trading increases with guidance precision,
suggesting that sophisticated investors benefit more from precise disclosure. This result is
consistent with Gow et al.’s (2012) finding.
Finally, I also find whether firms bundle guidance with earnings announcement or not
does not affect the level of informed trading. However, the result suggests that bundling
significantly reduces the probability of private information event afterward. Additional analysis
reveals that the increase in informed trading is concentrated in the first two quarters after
guidance initiation.
This paper contributes to the voluntary disclosure literature in several ways. First, I
provide new evidence that voluntary disclosures can lead to an increase in informed trading in

4
the market. While prior literature studies whether earnings guidance helps to reduce information
asymmetry between insiders and outsider investors (Coller and Yohn, 1997; Pevzner, 2007), they
do not examine the level of informed trading in the market due to the limitation of empirical
proxy. This paper, however, use the PIN score and its parameters to investigate the level of
informed trading. Developed based on market microstructure theory, the PIN score is fully
parameterized and has been shown to capture the likelihood of informed trading well.
Next, this paper uses propensity score matching method to control for firms’ self-selected
decision to initiate quarterly earnings guidance, which has been overlooked by prior research.
Voluntary disclosure literature suggests that firms are more likely to disclose when their
performance is good or when they anticipate good future performance (Miller, 2002). Brown et
al. (2009) show that good performance (positive earnings surprise) can reduce information
asymmetry as it attracts investors’ attention and increases investor recognition. Therefore,
without controlling for self-selection, prior research’s finding that disclosure reduces information
asymmetry can be attributed to firm performance. This paper addresses this self-selection bias.
Furthermore, as Gow et al. (2012) find that sophisticated investors benefit from precise
earnings information more than unsophisticated investors do, this paper complements their study
by focusing on earnings guidance and showing that this is also true for voluntary disclosure.
Although prior research provides only limited support for the notion that voluntary disclosure
reduces information asymmetry, a majority of executives believe this notion. For example, a
survey of financial executives indicates that 80% of them agree that they use voluntary
disclosure to reduce information asymmetry (Graham et al., 2005). This paper, however, points
out that voluntary disclosure can have unintended consequences, an increase in informed trading.
More importantly, the impact of earnings guidance on informed trading depends on the nature of

5
guidance (good vs. bad), the precision of guidance (e.g., point vs. range), and the form of
guidance (bundled or not). While the SEC strives to protect unsophisticated investors by
encouraging more voluntary disclosure, this study provides new insights to securities regulators
on how to make voluntary disclosure more effective so that unsophisticated investor can process
earnings guidance efficiently.
I acknowledge two limitations of this study. First, the inferences depend mainly on the
measure of the level of informed trading, the PIN score. To the extent that this measure fails to
capture informed trading in the market, the inferences will be affected. However, this is an issue
facing all researchers using the PIN score. Second, while the results are robust to self-selection
bias, the inferences are only valid to the extent that the decision model of guidance initiation is
valid.
The remainder of the paper is organized as follows. Section 2 reviews the literature and
develops the hypotheses. Section 3 describes the propensity score matching method, the PIN
score measure of informed trading and presents the research design. Data sources and sample
collection are provided in Section 4. Section 5 presents the empirical analysis and results.
Section 6 examines how guidance characteristics affects informed trading. Section 7 concludes.
2. Literature review and hypothesis development
2.1.Literature review
Several papers are closely related to this study. Coller and Yohn (1997) study whether quarterly
earnings guidance reduces information asymmetry. They use the bid–ask spread to proxy for
information asymmetry and examine the change in the bid–ask spread of forecasting firms
around the management earnings forecast date. They find a significant reduction in spreads in the
6
nine days after the forecast and conclude that management earnings forecasts help to reduce
information asymmetry in the short term.6 Limited by the measure of information asymmetry,
they could not investigate the impact of guidance on informed trading in the market. More
importantly, they do not consider how investor sophistication may affect the result cross-
sectionally.
Pevzner (2007), on the other hand, finds that the initiation of quarterly earnings guidance
does not affect information asymmetry over the long term. Using the bid–ask spread, quoted
depths, Amihud’s (2002) illiquidity, and trading volume to measure liquidity, Pevzner finds that
the liquidity improvement after earning forecasts is only effective in the short term. In addition,
he shows that the initiation of quarterly earnings guidance does not have a long-term effect on
the firm’s liquidity. As the bid–ask spread is often used to proxy for information asymmetry, he
concludes earning guidance has no long-term effect in information asymmetry.
Lakhal (2004) provides international evidence by examining French market liquidity and
information asymmetry around voluntary earnings-related announcements that include earnings
forecasts and earnings announcements. He also uses volume and spread to proxy for liquidity
and information asymmetry, respectively. His results show that market liquidity improves for
both types of voluntary disclosure. However, while information asymmetry decreases after
earnings announcements, it increases after earnings forecasts. Lakhal’s interpretation is that
earnings forecasts are perceived to be less credible.
While all these papers examine the relation between earnings guidance and information
asymmetry, they are different from this study in several ways. First, prior studies focus on
6 Coller and Yohn (1997) do not examine the long-term effect of management earnings forecasts on information
asymmetry.

7
information asymmetry between firm insiders and outside investors. This study, however, is
interested in the information gap between sophisticated and unsophisticated investors in the
capital market. Both types of investors can be outside investors. Second, this paper is interested
in how the degree of investor sophistication can affect the capital market consequences of
earnings guidance, while prior studies do not consider this factor specifically. Finally, this paper
shed new light on how different characteristics of earnings guidance can affect information
trading in the market, which has not been examined by prior studies.
This study is also related to two other papers examining the consequence of mandatory
disclosure. Taylor (2010) finds that more informative earnings announcements lead to greater
losses for individual investors and that the losses are concentrated in inactive traders. He argues
that this is due to individual investors’ limited information-processing ability and raises the
question of the welfare of disclosure. Gow et al. (2012) find evidence that more precise earnings
information can complement sophisticated investors’ private information and lead to an increase
in information asymmetry between sophisticated and unsophisticated investors. While these two
studies look at earnings information, one major form of mandatory disclosure, this study focuses
on voluntary disclosure, more specifically quarterly earnings guidance.
2.2.Hypothesis development
Informed trading exists because certain investors are better informed about the value of a firm.
Uninformed investors therefore bear the risk of losing trading against informed ones. Economic
theory suggests the risk depends on two factors: (1) the probability that some investors possess
private information and (2) the trading intensity of those informed investors relative to that of
uninformed ones (Easley and O’Hara, 1992). Firms’ initiation of quarterly earnings guidance can

8
affect both factors, change the dynamics between sophisticated and unsophisticated investors,
and influence the level of informed trading in stock market.
Guidance initiation can lower the level of informed trading by reducing the likelihood of
private information events and the incentive of private information collection. Timely corporate
earnings guidance preempts some important private information about future earnings, making
public what would otherwise have been privately discovered later, and therefore reduces
information asymmetry among investors. Brown et al. (2004) support this view by showing that
conference calls, a form of voluntary disclosure, reduce the level of information asymmetry
among equity investors in long-term. Meanwhile, the initiation of quarterly earnings guidance
leads investors to believe that the firm is committing itself to timely information disclosure,
which reduces the effort that informed investors spend on seeking private information (King et
al., 1990).
On the other hand, the initiation can possibly lead to an increase in the production of and
search for private information because disclosure can complement certain investors’
(sophisticated ones) information set. Early disclosure models (Diamond, 1985; Diamond and
Verrecchia, 1991) overlooked this possibility by assuming investors are homogeneous. However,
by incorporating investor heterogeneity, later disclosure models predict that disclosure can
actually increase information gap between sophisticated and unsophisticated investors under
some conditions (Indjejikian, 1991; Kim and Verrecchia, 1994; Bushman et al., 1996; Fischer
and Verrecchia, 1999). For example, Indjejikian’s (1991) model suggests that public disclosure
enhances the information advantage of sophisticated investors if information-processing cost is
heterogeneous among investors, which suggest sophisticated investors spend less time and effort
to process information and act upon it faster than unsophisticated ones. Another example is the

9
work of Kim and Verrecchia (1994), who develop a trading model and show that there can be
more information asymmetry associated with public disclosure of financial data if certain traders
make better judgments than others do. Recent empirical also studies provide support to this
prediction in the cast of earnings announcements (e.g., Gow et al., 2011; Taylor, 2010).
Therefore, ex ante, disclosure models do not yield unambiguous prediction whether guidance
initiation increases or decreases the level of informed trading.
Furthermore, the initiation can affect the level of informed trading by changing the
trading intensity in the equity markets. A model developed by Diamond and Verrecchia (1991)
suggests that disclosures lead to lower cost of information collecting and processing so that
trading by uninformed large investors increases as firms increase their disclosure level. For
“noise traders,” the finance literature suggests that they are attracted by firms’ disclosure too
because (1) they rationally choose high liquidity stocks to minimize trading cost (e.g., Admati
and Pfleiderer, 1988; Chowdhry and Nanda, 1991) and (2) voluntary disclosures give firms more
media exposure, which helps to catch noise traders’ limited attention (Peng and Xiong, 2006;
Barber and Odean, 2008).
The initiation can affect informed investors’ trading as well. By assuming that informed
investors are risk neutral and are not capital-constrained, Kyle (1985) shows that a change in
uninformed investors’ trading induces a change in informed investors’ trading, and the changes
are proportional so that the relative amount of informed trading remains fixed. Brown et al.
(2004) argue that, because informed investors are likely to be risk-averse and/or capital-
constrained, the change in the intensity of informed trading is likely to be less than fully
proportional to the change in uninformed trading. In addition, recent study by Kalay (2012)
shows that sophisticated investors prefer firms issuing regular earnings guidance and they

10
concentrate trading activities in these firms. Therefore, whether the changes in the intensity of
informed and uninformed trading are proportional depends on investors’ risk aversion, capital
constraint, and their preference on disclosure. Hence, it is unclear how the level of informed
trading will change upon the initiation of quarterly earnings guidance, which leads to my first
non-directional hypothesis (stated in alternative form):
H1: The level of informed trading in the stock market changes after firms’ initiation of
quarterly earnings guidance.
As the foregoing discussion suggests that earnings guidance initiation changes the level
of informed trading by (1) altering the probability of private information events, or (2) the
relative amount of informed trading , or both channels, my next set of hypotheses (stated in
alternative form) tests through which channels guidance initiation affects informed trading:
H2a: Uninformed investors’ trading intensity changes after firms’ initiation of quarterly
earnings guidance.
H2b: Informed investors’ trading intensity changes after firms’ initiation of quarterly
earnings guidance.
H2c: The probability of private information events changes after firms’ initiation of
quarterly earnings guidance.
3. Empirical design
3.1.Propensity-score matched sample
Firms self-select to initiate quarterly earnings guidance, which suggests that they likely differ
systematically from firms that do not initiate regular earnings guidance. Consequently, using all
non-guidance-initiating firms as a control sample can create self-selection bias. To address this

11
issue, I use propensity score matching method to construct control sample and compare firms
that initiate quarterly guidance to a control sample matched on observable firm characteristics
associated with the decision of initiating quarterly guidance. This procedure mitigates the
concern that observable firm characteristics associated with the choice to initiate quarterly
guidance drive differences in the relation between guidance initiations and informed trading.
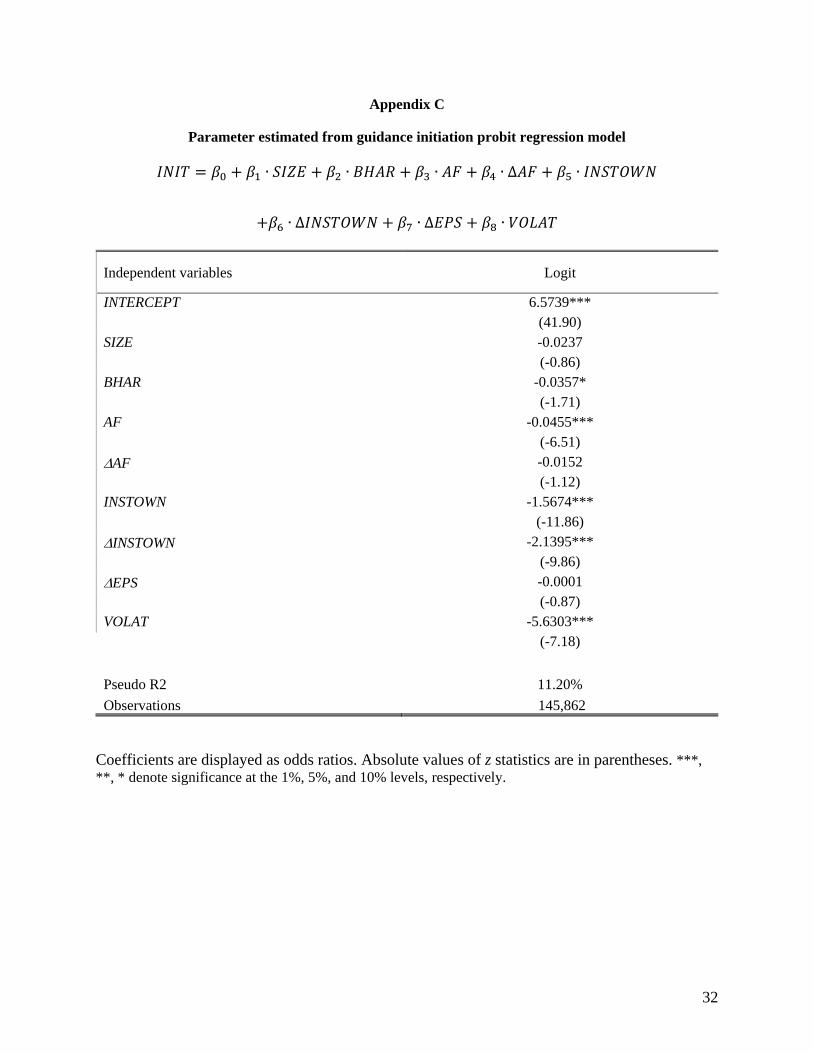
Propensity scores are generated using a probit regression model, which models the
likelihood of a firm initiating guidance based on several firm characteristics documented by prior
literature (e.g., Miller, 2002; Hutton, 2005; Ajinkya et al., 2005):
𝐼𝑁𝐼𝑇 = 𝛽0 + 𝛽1 ∙ 𝑆𝐼𝑍𝐸 + 𝛽2 ∙ 𝐵𝐻𝐴𝑅 + 𝛽3 ∙ 𝐴𝐹 + 𝛽4 ∙ ∆𝐴𝐹 + 𝛽5 ∙ 𝐼𝑁𝑆𝑇𝑂𝑊𝑁
+𝛽6 ∙ ∆𝐼𝑁𝑆𝑇𝑂𝑊𝑁 + 𝛽7 ∙ ∆𝐸𝑃𝑆 + 𝛽8 ∙ 𝑉𝑂𝐿𝐴𝑇
(1)
where INIT equals to one if the firm initiates quarterly guidance and zero otherwise. Prior
research finds that firms with larger size (SIZE), better performance (BHAR and EPS), greater
analyst following (AF) and institutional ownership (INSTOWN), and higher information
asymmetry (VOLAT) are more likely to issue guidance (Ajinkya et al., 2005; Hutton, 2005;
Miller, 2002). Chen et al. (2011) argue that it is the changes in these factors affect firms’
disclosure decision. Therefore, I also include the changes in analyst following (AF) and
institutional ownership (INSTOWN). The results (in Appendix C) suggest that analyst
following, institutional ownership, and information asymmetry are the key factors driving firms’
guidance initiation decision. I identify a control firm in the same quarter that does not initiate
quarterly earnings guidance but with the closest predicted probability of initiating guidance.
Detailed variable definitions are shown in Appendix B.
3.2.Measure of information asymmetry

12
I use the PIN score to measure the level of informed trading on the market. The PIN score is the
probability of information-based trading estimated using the daily order flow for a stock over a
particular period. The measure was theoretically developed in Easley and O’Hara (1992) and
then empirically implemented in Easley et al. (1997) (hereafter, the EKO model). The intuition is
that large imbalances between the number of buy and sell orders can be used to (imperfectly)
infer the occurrence of private information events and the presence of privately informed traders
in the market. A series of studies have used the PIN score, and their findings are consistent with
the PIN score being able to capture the level of information asymmetry between informed and
uninformed investors in equity markets.7
Fig. 1 shows the game tree of the EKO model’s basic structure. The three basic
assumptions are: (1) at the beginning of each trading day, private information events happen with
probability α, and no event days occur with probability (1-α); (2) when information events occur,
it can be either “good” news with probability (1-δ) or “bad” news with probability δ; and (3)
trade orders come to the market sequentially following a Poisson process, and the daily order
arrival rates are ε and μ (=ε) for uninformed and informed traders, respectively.8 All of the
orders arrive independently, and the parameters are common knowledge across all traders and
the market maker.
The EKO model predicts three general patterns of trade orders corresponding to the three
branches in the game tree in Fig. 1. On a no-news day, the number of buyer- and seller-initiated
trade orders should be roughly equal (top branch) to each other. On a “bad-news” day, the
7 In the accounting literature, these papers include Brown and Hillegeist (2007), Brown et al. (2004, 2009), and
Kalay (2012). 8 This assumption implies that sellers are not short-sale constrained.

13
number of seller-initiated order dominates because of informed investors’ selling (middle
branch). On a good-news day, buyer-initiated trades dominates (bottom branch).
The original EKO model makes an important assumption that the daily arrival rates of
uninformed buy and sell orders are drawn from independent Poisson distributions with constant
parameter ε. I use the extended model of Venter and de Jongh (2004), which relaxes this
assumption by allowing the average trading intensity of uninformed investors to vary daily with
a scaling factor Wt, and the factor Wt is drawn from an inverse Gaussian distribution with
parameter > 0. By doing so, the extended model allows for a positive correlation between the
daily number of buyer-initiated and seller-initiated orders.9
The extended model’s parameters (α, δ, , ε, ) are estimated by the maximum likelihood
method.10 Then the PIN is calculated as follows:
𝑃𝐼𝑁 =𝛼𝜇
𝛼𝜇 + 2𝜀, (2)
Equation 2 clearly shows how the level of informed trading (the PIN score) changes with
the PIN parameters. While the PIN score increases with the probability of information event
occurrence (α) and the intensity of informed trading (μ), it decreases with the intensity of
uninformed trading (ε).
3.3.Regression model
9 For the details of the extended model, please see Venter and de Jongh (2004). Brown and Hillegeist (2007) also
provide a concise summary of the extended model in their appendix. 10 The maximum likelihood function is not shown here. Interested readers can find it in Brown and Hillegeist (2007)
and Brown et al. (2009).

14
To examine the impact of quarterly earnings guidance initiation on informed trading, I employ
the following pooled cross-sectional regression to test my main hypothesis (H1):
𝐼𝐴𝑉 = 𝛽0 + 𝛽1 ∙ 𝐼𝑁𝐼𝑇 + 𝛽2 ∙ 𝑃𝑂𝑆𝑇 + 𝛽3 ∙ 𝑃𝑂𝑆𝑇 ∙ 𝐼𝑁𝐼𝑇 + 𝛽4 ∙ 𝑆𝐼𝑍𝐸 + 𝛽5 ∙ 𝐴𝐹
+𝛽6 ∙ 𝐼𝑁𝑆𝑇𝑂𝑊𝑁 + 𝛽7 ∙ 𝐿𝐸𝑉
(3)
where IAV can be PIN or one of its parameters (, , ), INIT is the indicator variable for
guidance initiation, POST equals to 1 for the quarters after guidance initiation and 0 otherwise.
The focus is on the interaction term (𝑃𝑂𝑆𝑇 ∙ 𝐼𝑁𝐼𝑇). For example, using PIN as dependent
variable, if informed trading increases, the coefficient is positive; otherwise it will be negative.
Following prior literature (Brown and Hillegeist, 2007; Brown et al., 2004, 2009), I
include several control variables in the regression model. The first one is size (SIZE). Atiase
(1985) finds unexpected stock price change in response to earnings reports is smaller for larger
firms, suggesting predisclosure information production and dissemination is higher for these
firms. Several studies confirm that there is a negative relation between SIZE and PIN (Brown et
al., 2004; Brown and Hillegeist, 2007). Brown et al. (2009) also show that the change in PIN is
negatively associated with the change in size. Therefore, I expect the coefficient on SIZE to be
negative.
Next, I include analyst following (AF). Ayers and Freeman (2003) and Piotroski and
Roulstone (2005) suggest that higher analyst following results in more trading by privately
informed investors. Brown et al. (2004) and Easley et al. (1998), however, find that analyst
coverage is positively associated with the amount of uninformed trading. Thus, the sign of the
coefficient on AF is unclear.
15
The third one is institutional ownership (INSTOWN). Certain types of institutional
investors trade on private information (Ke and Petroni, 2004; Bushee and Goodman, 2007).
Other types of institutional investors, for example index funds, are unlikely to trade on private
information. Prior studies also show mixed results (Brown et al., 2004; Brown and Hillegeist,
2007). Therefore, I do not have a prediction about the sign on INSTOWN.
Finally, I include leverage (LEV) as one control variable. Boot and Thakor (1993) argue
that as the firm’s leverage increases, the incentive to seek private information becomes higher
because of the increasing expected benefit from trading on information. On the other hand,
Brown and Hillegeist (2007) argue that the “pecking order” theory suggests that the relation
between leverage and information asymmetry should be negative. Therefore, I do not predict the
sign of the coefficient on LEV. Detailed variable definitions are listed in Appendix B.
4. Data source and sample collection
4.1.Data source
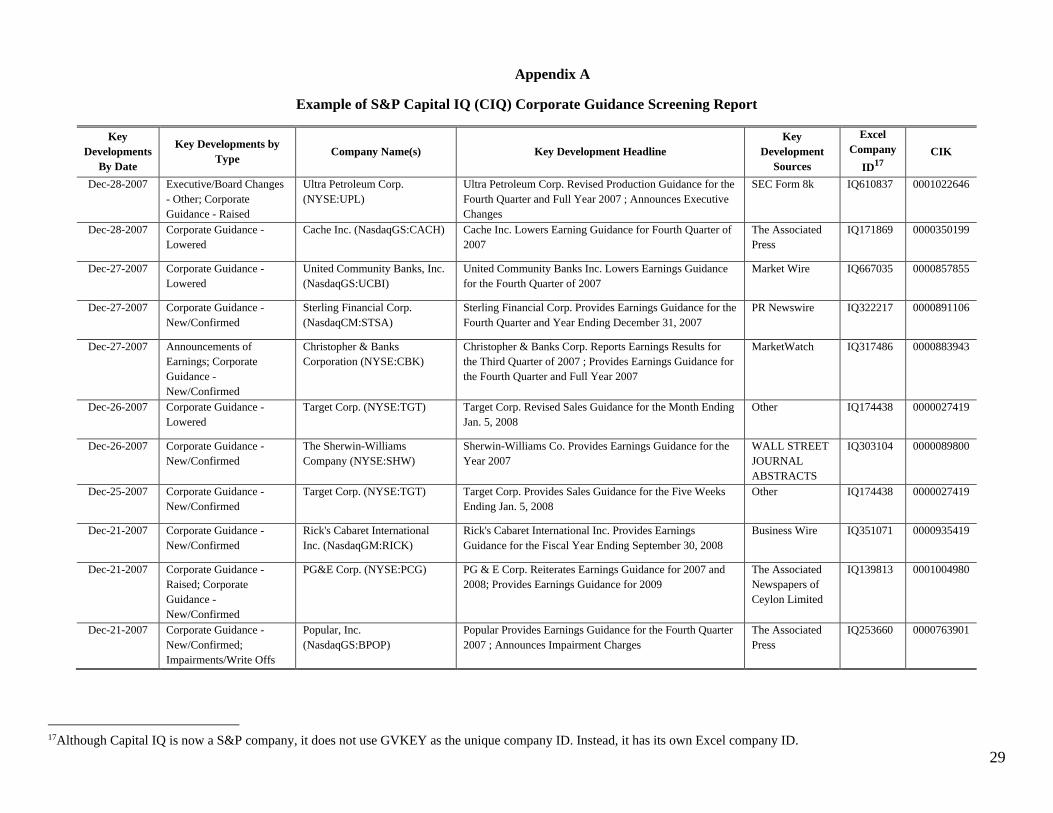
Earnings guidance data from year 2003 to 2010 are from S&P Capital IQ.11 Stock returns are
from CRSP. Accounting data are from COMPUSTAT. Analyst forecast data are from I/B/E/S.
Institutional holdings data are from Thomson-Reuters Institutional Holding (13F) database. I
obtained the PIN scores from Professor Stephen Brown at the University of Maryland.12 Detailed
data requirements are specified in Appendix B by variable definition.
4.2.Sample selection
11 An example of corporate guidance is provided in Appendix A. 12 The website is http://www.janssenbrown.net/StephenBrownresearch/index.html.

16
Following prior literature’s identification strategy (e.g., Houston et al., 2010; Chen et al., 2011), I
find firms that actually initiated quarterly earnings guidance during the period 2004Q1 –
2009Q4.13 I limit my sample period because the PIN score data obtained from Professor Stephen
Brown is from 2003 to 2010. As I examine the changes in PIN and its parameters following the
initiation of quarterly earnings guidance, I need one pre-event year and one post-event year.
Therefore, the event period starts from 2004 and ends in 2009. Non-quarterly earnings forecasts
are excluded.14 Firms not traded on major US exchanges are deleted.
Following prior literature, I identify a guidance “initiation” event when a firm gives
guidance in a quarter but no guidance in the previous four quarters and gives guidance for at
least two out of the following three quarters. The “event quarter” is the quarter in which the firm
starts providing guidance.15
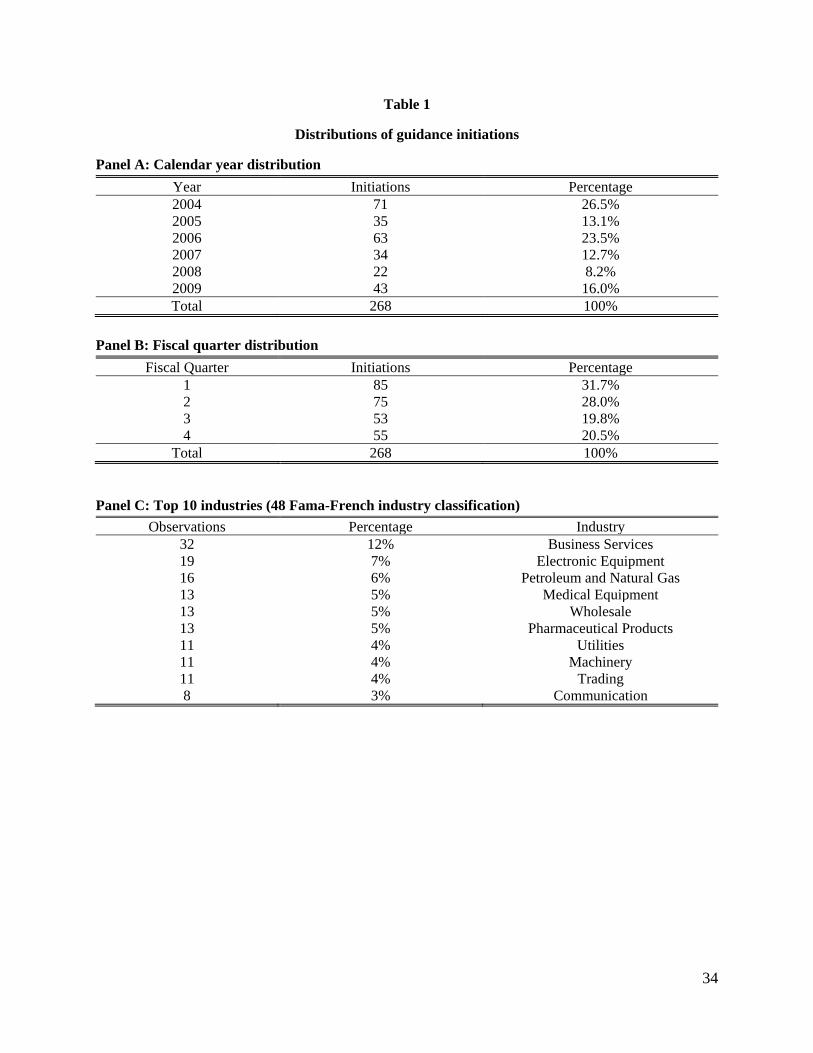
For the period 2004–2009, there are 268 guidance initiations that have the necessary data
for regression analysis. Table 1 presents the sample distribution. Panel A shows the distribution
by calendar year. Year 2004 has the most initiations (71 initiations, which is 26.5% of the
sample); year 2008 has the least initiations (22 initiations, which is 8.2% of the sample). The
number of initiation reduced significantly in year 2007 and 2008, when financial crisis happened.
This suggests that voluntary disclosure is affected by macroeconomic condition (e.g., economic
uncertainty). Panel B shows the distribution of guidance initiations by fiscal quarter. Many firms
choose to initiate guidance in the first two fiscal quarters (about 59.7% versus 40.3% in the last
two fiscal quarters). Panel C shows the top 10 industries for guidance initiation. Overall,
13 I downloaded all three types of corporate guidance (New/Confirmed, Lowered, and Raised) from Capital IQ. 14 S&P Capital IQ has both “annual” or “quarterly” earnings guidance. As this paper focuses on the practice of
issuing quarterly earnings guidance, I delete annual guidance. 15 I also try to require more guidance in a longer post-event time period to identify guidance initiation (e.g., require
at least six guidance in eight quarters). While this significantly reduces my sample size, the results are qualitatively
unchanged.

17
Business Services is the top industry in which guidance initiations occur the most (12%),
followed by Electronic Equipment (7%).
5. Empirical analyses and results
5.1.Descriptive statistics
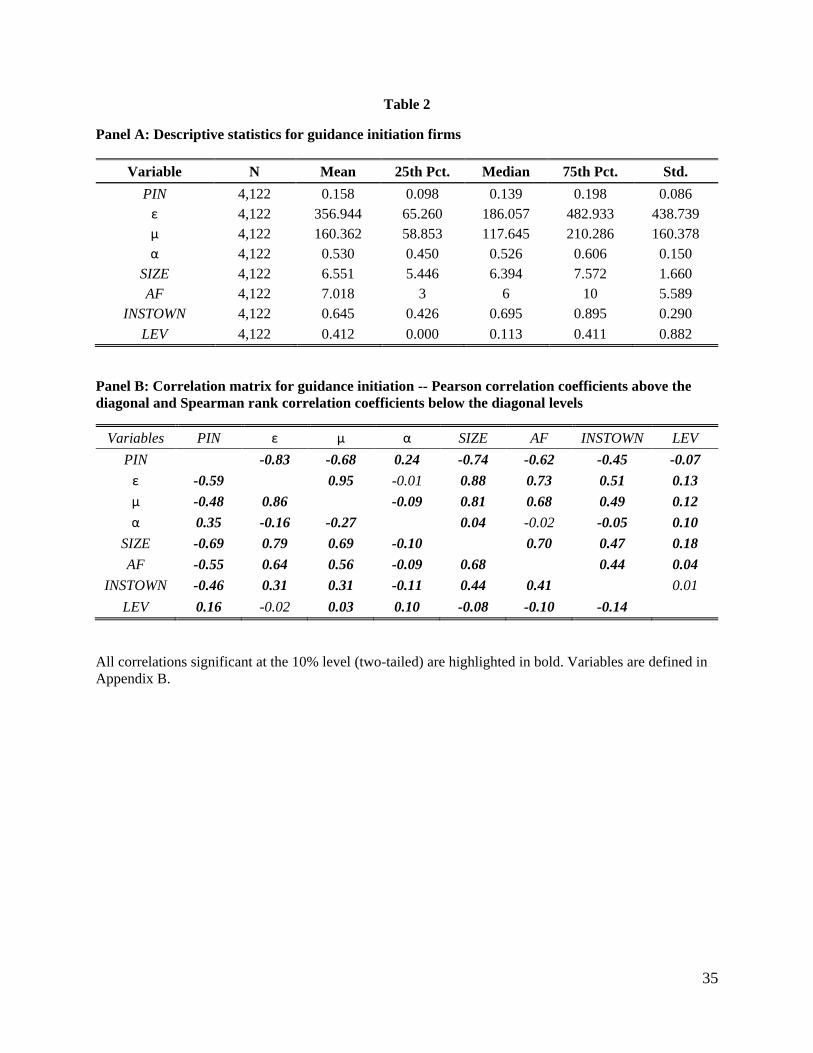
Table 2 Panel A reports descriptive statistics for my sample and control firms. For each firm
observation, I include 8 quarters (4 pre- and 4 post-event). Listed in the table are the number of
observations, the mean, P25, the median, the P75, and the standard deviation. The mean and
median of PIN are 15.8% and 8.6%, respectively. This suggests informed trading happens often
in the market. The descriptive statistics of PIN parameters is similar to previous studies (Brown
et al., 2009; Brown and Hillegeist, 2007). On average, each firm is covered by more than seven
analysts. The average institutional ownership is about 65%. Panel B presents the matrices of
correlation coefficients. Pearson (Spearman) correlations are shown above (below) the diagonal
levels. PIN is negatively correlated with SIZE, AF, and INSTOWN, and positively correlated with
LEV.
5.2.Tests of H1 and H2
Table 3 presents the main results of estimating Eq. (3). Columns (1) through (4) are for different
dependent variables (PIN, , , and , respectively). Column (1) shows the result of testing the
probability of informed trading. The most important result is that the coefficient on the
interaction term (POST*INIT) is positive and significant at the level of 5 percent (0.0037, t =
2.06), which suggests an increase in informed trading relative to control sample. Next, the
coefficient on INIT is insignificant, suggesting that initiation firms and non-initiation firms are
not different in the level of informed trading before guidance initiation. This also means that my
18
control sample selection through propensity score matching is effective in controlling pre-event
firm characteristics. The coefficient on POST is significantly negative, which suggests that both
sample firms and control firms experiencing a decrease in informed trading. Brown et al. (2009)
show that good performance in terms of earnings surprise can help to reduce information
asymmetry. As both guidance initiation firms and control firms are expected to have good
performance, the decrease in informed trading is expected.
The results of testing H2 are also included in Table 3. Column (2) tests the impact on the
intensity of uninformed trading. The coefficient on POST*INIT is negative and significant at the
10 percent level, which suggests a reduction of the uninformed trading intensity. While this is
also the case for the intensity of informed trading (Column 3), the magnitude of the reduction in
the intensity of informed trading is less than that of uninformed trading, which offers an
plausible explanation why PIN score increases. The results suggest that when firms initiate their
quarterly earnings guidance, uninformed investors can reduce their trading relative to informed
trading. The probability of private information event, however, does not change significantly
(Column 4). Finally, the signs of the coefficients on control variables are generally consistent
with prior studies’ results (Brown et al., 2004, 2009; Brown and Hillegeist, 2007).
In summary, the OLS results suggest two findings: (1) firms experience an increase in
informed trading when they initiate quarterly guidance, and (2) the increase in informed trading
is mainly due to the reduction in the intensity of uninformed trading, which suggests that
unsophisticated investors may recognize their limited ability in information processing and
choose to reduce their trading.
6. Characteristics of earnings guidance and informed trading

19
In this section, I further explore how guidance characteristics can affect informed trading
systematically. More specifically, I examine the impact of the nature of news (good vs. bad), the
precision of guidance (point, close range, open range, and qualitative), and the form of guidance
(bundled with earnings announcement or non-bundled) on informed trading.
6.1.Good versus bad news
Both good and bad news can be communicated to investors by earnings guidance. However, their
impacts on informed trading can be different. Prior literature suggests that bad news is generally
more complex than good news (Bloomfield, 2008), which implies that more uncertainty can arise
after bad news. Consistent with this implication, Rogers et al. (2009) document that short-term
volatility increases after bad news earnings guidance. Information complexity generally impedes
investors’ efficient usage of information (Plumlee, 2003; Duru and Reeb, 2002; Lehavy et al.,
2011). While there is no direct evidence showing investors have limited ability processing bad
news, indirect evidence suggests that is the case. For example, Li (2008) finds that the readability
of firm’s annual report tends to be low when its performance is bad. Lee (2012) documents that
lower report readability explains a significant part of post-earnings announcement drift,
suggesting investors are not efficient in processing bad news. I conjecture that the ability gap
between sophisticated and unsophisticated investors is likely to be wider when processing bad
news so that the information gap becomes greater and informed trading increases. At the same
time, uninformed investors reduce their trading more when earnings guidance is bad news.
P1: For firms initiating quarterly earnings guidance, the increase in informed trading is
greater when earnings guidance is bad news than when earnings guidance is good news.

20
To test this prediction, I focus on the sample firms that actually initiate quarterly
guidance.16 If the guidance is to raise earnings forecast, I treat it as a positive surprise and assign
1 to the variable (SURPRISE). If the guidance is to confirm previous forecast, SURPRISE equals
to zero. Finally if the guidance is to lower forecast, I let SURPRISE to be -1. The following
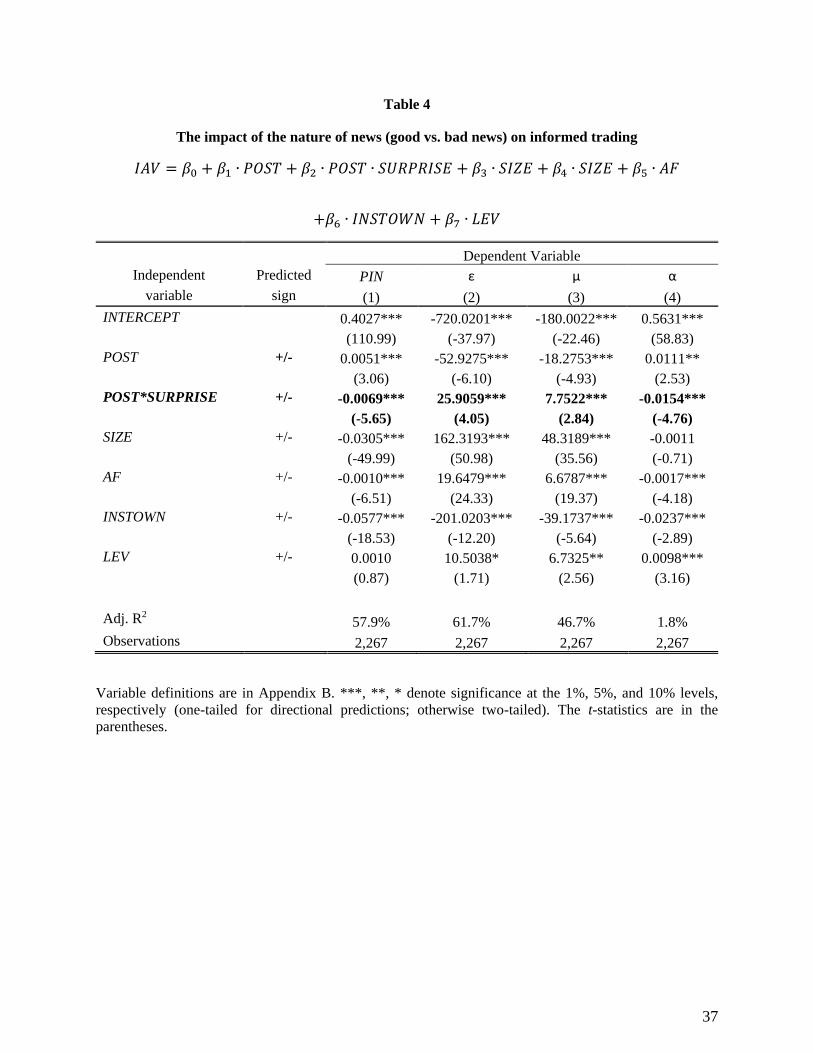
regression model is then applied:
𝐼𝐴𝑉 = 𝛽0 + 𝛽1 ∙ 𝑃𝑂𝑆𝑇 + 𝛽2 ∙ 𝑃𝑂𝑆𝑇 ∙ 𝑆𝑈𝑅𝑃𝑅𝐼𝑆𝐸 + 𝛽3 ∙ 𝑆𝐼𝑍𝐸 + 𝛽4 ∙ 𝑆𝐼𝑍𝐸 + 𝛽5 ∙ 𝐴𝐹
+𝛽6 ∙ 𝐼𝑁𝑆𝑇𝑂𝑊𝑁 + 𝛽7 ∙ 𝐿𝐸𝑉
(4)
where POST is 1 for observations after guidance initiation and 0 otherwise. My focus is the sign
of the coefficient on POST*SURPRISE, which is predicted to be negative.
Table 4 summarizes the results. Again, four different dependent variables (PIN, , , and
, respectively) are included in the table (Columns 1 to 4). In Column (1), the coefficient on the
interaction term (POST*SURPRISE) is negative and significant at the level of 1 percent (-0.0069,
t = -5.65). This means that informed trading decreases when the news is good and increases
when the news is bad, which agrees with my prediction. The results in Columns (2) to (4) further
corroborate my prediction. The reaction from uninformed investors is greater than that from
informed investors; comparing with informed trader, uninformed traders trade relatively more
when there is good news and trade relatively less when there is bad news. In addition, the
probability of private information event increases after bad news.
In sum, the results suggest that the nature of guidance affects the level of informed
trading in the market in such a way that informed trading increases after bad news and decreases
after good news.
16 Because control firms do not necessarily issue guidance, I cannot include them in the regression.
21
6.2.Guidance precision
The precision of earnings guidance can also affect the level of informed trading as well.
However, whether the information advantage of sophisticated investors increases or decrease
with the precision of guidance is unclear. Disclosure model by Indjejikian (1991) suggests that
less sophisticated investors can benefit from better quality disclosure (more precise earnings
guidance). Gow et al. (2012), however, argue that sophisticated investors should benefit more
from greater earnings precision as they trade heavily on earnings information. Experimental
study (Han and Tan, 2007) provides more support to the model prediction that unsophisticated
investors are better in processing precise information. Thus, my next prediction based on model
implication and experimental observation is:
P2: For firms initiating quarterly earnings guidance, the increase in informed trading is
greater when earnings guidance is the precision of earnings guidance is lower.
Again, I test this prediction using the actually guidance initiation firms. If the guidance is
a point estimate, it has the highest precision (PRECISION=3). If it is a closed range estimate,
PRECISION equals to 2. If it is an open range estimate, PRECISION equals to 1. Finally,
PRECISION is assigned to be zero if the guidance is only qualitative. I use the following
regression model:
𝐼𝐴𝑉 = 𝛽0 + 𝛽1 ∙ 𝑃𝑂𝑆𝑇 + 𝛽2 ∙ 𝑃𝑂𝑆𝑇 ∙ 𝑃𝑅𝐸𝐶𝐼𝑆𝐼𝑂𝑁 + 𝛽3 ∙ 𝑆𝐼𝑍𝐸 + 𝛽4 ∙ 𝑆𝐼𝑍𝐸 + 𝛽5 ∙ 𝐴𝐹
+𝛽6 ∙ 𝐼𝑁𝑆𝑇𝑂𝑊𝑁 + 𝛽7 ∙ 𝐿𝐸𝑉
(5)
The results are shown in Table 5. Again, four different dependent variables (PIN, , ,
and , respectively) are included in the table (Columns 1 to 4). The coefficient on the interaction
term (POST*PRECISION) is negative and significant at the level of 1 percent (-0.0051, t = -

22
3.15). This suggests that informed trading increases after more precise earnings guidance, which
supports Gow et al.’s (2012) argument that sophisticated investors benefit more from precision
disclosure so that informed trading increases. The results in Column (2) and (3) show that both
uninformed and informed trading decrease with guidance precision. The probability of private
information events, however, does not change with guidance precision.
To summarize, I find that the level of informed trading increases when earnings guidance
is more precise, which suggests that sophisticated investors benefit more from the precision of
disclosure.
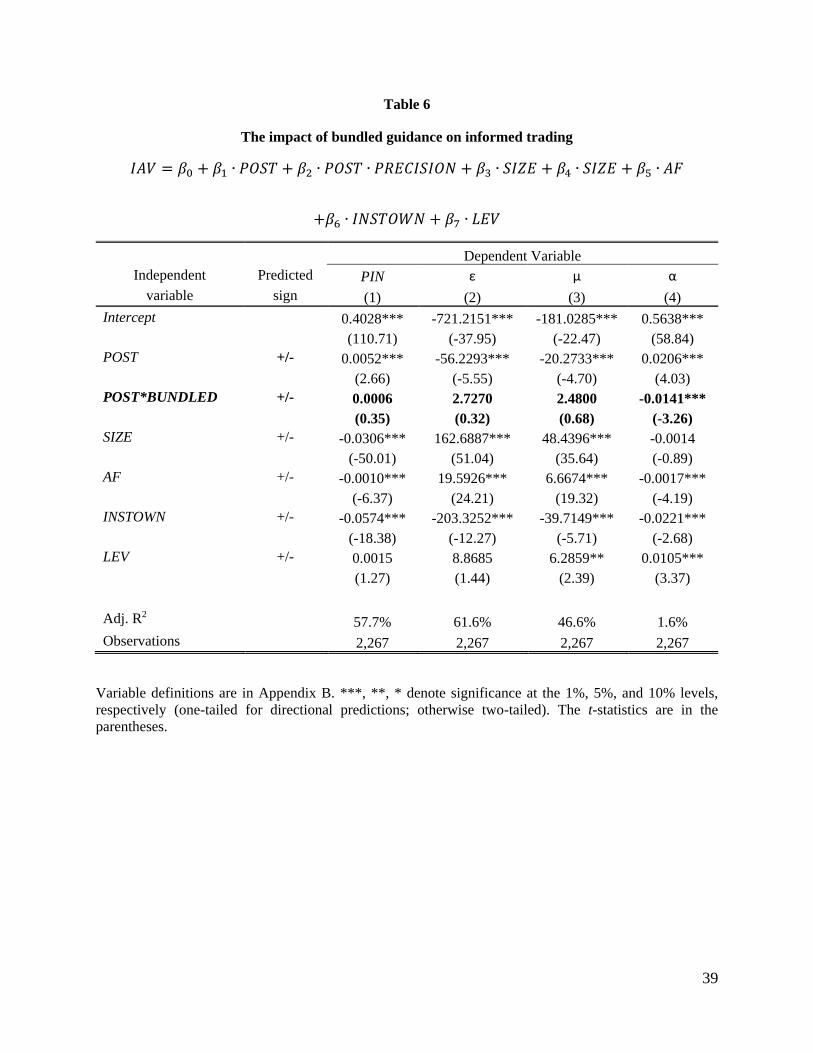
6.3.Bundled versus unbundled
Firms can choose to bundle their earnings guidance with earnings announcements (bundled) or
give stand-alone earnings guidance. Ex ante, the impact on informed trading is difficult to
determine. On the one hand, investors’ attention is limited (Hirshleifer and Teoh, 2003). When
firms bundle guidance with earnings announcement, limited attention makes unsophisticated
investors more likely to process bundled information inefficiently. Sophisticated investors,
however, are less impacted by the bundled disclosure so that the level of informed trading can
increase. On the other hand, firms are more likely to bundle when they have more favorable
earnings guidance (Atiase et al., 2005), which can potential benefit unsophisticated investors
more as discussed earlier. Therefore, my last prediction is (stated in alternative form):
P3: For firms initiating quarterly earnings guidance, the increase in informed trading
when earnings guidance is bundled is different from that when earnings guidance is
unbundled.
23
If the guidance is bundled with earnings announcement, I let BUNDLED equal to 1.
Otherwise, BUNDLED is 0. The following regression model is applied:
𝐼𝐴𝑉 = 𝛽0 + 𝛽1 ∙ 𝑃𝑂𝑆𝑇 + 𝛽2 ∙ 𝑃𝑂𝑆𝑇 ∙ 𝐵𝑈𝑁𝐷𝐿𝐸𝐷 + 𝛽3 ∙ 𝑆𝐼𝑍𝐸 + 𝛽4 ∙ 𝑆𝐼𝑍𝐸 + 𝛽5 ∙ 𝐴𝐹
+𝛽6 ∙ 𝐼𝑁𝑆𝑇𝑂𝑊𝑁 + 𝛽7 ∙ 𝐿𝐸𝑉
(6)
Table 6 summarized the results. In Columns (1) to (3), the coefficient on the interaction
term (POST*BUNDLED) are not significant, which suggests that the bundling of guidance with
earnings announcement has no impact of informed trading. The only thing worth noting is that
column (4) shows that bundling significantly reduces the probability of private information event
afterward (-0.0141, t= -3.26).
6.4.The dynamics
Finally, I examine the dynamics of the change in informed trading. Table 7 shows how
PIN scores change after the initiation of quarterly earnings guidance. Columns (1) to (4) are for
quarter 0, 1, 2, and 3 (after initiation), respectively. The results suggest that the increase in
informed trading mainly happen in the first two quarter as the coefficients are significantly
positive (Column (1) and (2)). In the next two quarter, the level of informed trading still
increases, but it is not significant any more. Thus, the increase in informed trading is
concentrated in the period immediately following the initiation of quarterly earnings guidance.
7. Summary and conclusions
Disclosure model incorporating investor heterogeneity suggests that sophisticated investors can
benefit from disclosure more than unsophisticated investors (e.g., Indjejikian, 1991). This
suggests that informed trading may increase after voluntary disclosure. Using PIN score to
measure the level of informed trading, this paper examines the change of informed trading after

24
firms’ initiation of quarterly earnings guidance. Controlling for firms’ self-selection, I find that
informed trading increases after guidance initiation. Further analyses using PIN parameters show
it is due to the reduction of trading by uninformed investor.
I then study how the characteristics of earnings guidance affect the level of informed
trading. The results suggest that the increase in informed trading is driven by bad news guidance,
consistent with bad news is generally complex and unsophisticated investors are less capable of
processing bad news. The increase in informed trading is also driven by precise earnings
guidance, consistent with Gow et al.’s (2012) argument that sophisticated investors benefit more
from precise disclosure. Finally, whether earnings guidance is bundled with earnings
announcement or not does not affect the level to informed trading in the market.
25
References
Admati, A., Pfleiderer, P., 1988. A theory of intraday patterns: volume and price variability.
Review of Financial Studies 1, 3-40.
Ajinkya, B., Bhojraj, S., Sengupta, P., 2005. The association between outside directors,
institutional investors and the properties of management earnings forecasts. Journal of
accounting Research 43, 343-376.
Amihud, Y., 2002. Illiquidity and stock Returns: cross-section and time-series effects. Journal of
Financial Markets 5, 31-56.
Atiase, R. K., 1985. Predisclosure information, firm capitalization, and security price behavior
around earnings announcements. Journal of Accounting Research 23, 21-36.
Atiase, R. K., Li, H., Supattarakul, S., Tse, S., 2005. Market reaction to multiple contemporaneous
earnings signals: Earnings announcements and future earnings guidance. Review of
Accounting Studies, 10, 497-525.
Ayers, B.C., Freeman, R.N., 2003. Evidence that analyst following and institutional ownership
accelerate the pricing of future earnings. Review of Accounting Studies 8, 47-67.
Ball, R., Shivakumar, L., 2008. How much new information is there in earnings? Journal of
Accounting Research 46, 975-1016.
Barber, B., Odean, T., 2008. All that glitters: the effect of attention and news on the buying
behavior of individual and institutional investors, Review of Financial Studies 21, 786-818
Beyer, A., Cohen, D.A., Lys, T.Z., Walther, B.R., 2010. The financial reporting environment:
Review of the recent literature. Journal of Accounting and Economics 50, 296-343.
Bloomfield, R. 2008. Discussion of “Annual report readability, current earnings, and earnings
persistence”. Journal of Accounting and Economics 45, 248-252.
Boot, A.W.A., Thakor, A.V., 1993. Security design. Journal of Finance 48, 1349–1378.
Brown, S., Hillegeist, S.A., 2007. How disclosure quality affects the level of information
asymmetry. Review of Accounting Studies 12, 443-477.
Brown, S., Hillegeist, S.A., Lo, K., 2004. Conference calls and information asymmetry. Journal of
Accounting and Economics 37, 343-366.
Brown, S., Hillegeist, S.A., Lo, K., 2009. The effect of earnings surprises on information
asymmetry. Journal of Accounting and Economics 47, 208-225.
Bushman, R.M., Gigler, F., Indjejikian, R.J., 1996. A model of two-tiered financial reporting.
Journal of Accounting Research 34, 51–73.
Chen, S., Matsumoto, D., Rajgopal, S., 2011. Is silence golden? An empirical analysis of firms
that stop giving quarterly earnings guidance. Journal of Accounting and Economics 51,
134-150.
Chowdhry, B., Nanda, V., 1991, Multimarket trading and market liquidity. Review of Financial
Studies 4, 483-511

26
Ciconte, W., Kirk, M., Tucker, J.W., 2012. Does the midpoint of range earnings forecasts represent
managers’ expectations? Working paper, University of Florida.
Coller, M., Yohn, T., 1997. Management forecasts and information asymmetry: an examination of
bid-ask spreads. Journal of Accounting Research 35, 181-191.
Diamond, D.W., 1985. Optimal release of information by firms. Journal of Finance 40, 1071-1094.
Diamond, D.W., Verrecchia, R.E., 1991. Disclosure, liquidity, and the cost of capital. Journal of
Finance 46, 1325-1359.
Duru, A., Reeb, D.M., 2002. International diversification and analysts’ forecast accuracy and bias.
The Accounting Review 77, 415–433.
Easley, D., O’Hara. M., 1992. Time and the process of security price adjustment. Journal of
Finance 47, 577-605.
Easley, D., Kiefer, N.M., O’Hara. M., 1997. One day in the life of a very common stock. The
Review of Financial Studies 10, 805-835.
Easley, D., O’Hara, M., Paperman, J.B., 1998. Financial analysts and information-based trade.
Journal of Financial Markets 1, 175–201.
Fischer, P.E, Verrecchia, R.E., 1999, Public information and heuristic trade, Journal of Accounting
and Economics 27, 89–124.
Gow, I.D., Taylor, D.J., Verrecchia, R.E., 2012. Persistence of the complementary relation
between earnings and private information. Working paper. University of Pennsylvania.
Graham, J.R., Harvey, C.R., Rajgopal, S., 2005. The economic implications of corporate financial
reporting. Journal of Accounting and Economics 40, 3-73.
Han. J., Tan, H.-T., 2010. Investors’ reactions to management earnings guidance: The influence
of multiple benchmarks. The Accounting Review 82, 521-543.
Hirshleifer, D., Teoh, S. H., 2003. Limited attention, information disclosure, and financial
reporting. Journal of Accounting and Economics, 36, 337-386.
Hirst, D.E., Koonce, L., Venkataraman, S., 2008. Management earnings forecasts: A review and
framework. Accounting Horizons 22, 315-338.
Houston, J.F., Lev, B., Tucker, J.W., 2010. To guide or not to guide? Causes and consequences of
stopping quarterly earnings guidance. Contemporary Accounting Research 27, 143-185.
Hutton, A. P., 2005. Determinants of Managerial Earnings Guidance Prior to Regulation Fair
Disclosure and Bias in Analysts' Earnings Forecasts. Contemporary Accounting
Research 22, 867-914.
Indjejikian, R.J., 1991. The impact of costly information interpretation on firm disclosure decisions.
Journal of Accounting Research 29, 277-301.
Kalay, A., 2012. Investor sophistication and disclosure clientele. Working paper. Columbia
University.
Ke, B., Petroni, K., 2004. How informed are actively trading institutional investors? Evidence from
their trading behavior before a break in a string of consecutive earnings increases. Journal
of Accounting Research 42, 895-927.

27
Kim, O., Verrecchia, R.E., 1994. Market liquidity and volume around earnings announcements.
Journal of Accounting and Economics 17, 41-67.
Kim, O., Verrecchia, R.E., 1997, Pre-announcement and event-period private information, Journal
of Accounting and Economics 24, 395–419.
King, R., Pownall, G., Waymire, G., 1990. Expectations adjustment via timely management
forecasts review, synthesis, and suggestions for future research. Journal of Accounting
Literature 9, 113-144.
Kyle, A. S., 1985. Continuous auctions and insider trading. Econometrica: Journal of the
Econometric Society, 1315-1335.
Lakhal, F., 2004. Stock market liquidity and information asymmetry around voluntary earnings
announcements: New evidence from France. Working paper, University of Paris XII.
Lee, Y. J., 2012. The Effect of Quarterly Report Readability on Information Efficiency of Stock
Prices. Contemporary Accounting Research, 29, 1137-1170.
Lehavy, R., Li, F., Merkley, K., 2011. The effect of annual report readability on analyst following
and the properties of their earnings forecasts, The Accounting Review 86, 1087-1115.
Li, F., 2008. Annual report readability, current earnings, and earnings persistence. Journal of
Accounting and Economics 45, 221-247.
Li, K., Prabhala, N.R., 2005. Self-selection models in corporate finance, in Handbook of Empirical
Corporate Finance, Eckbo, B.E., Ed., North Holland.
Miller, B.P., 2010. The effects of reporting complexity on small and large investor trading. The
Accounting Review 85, 2107-2143.
Miller, G.S., 2002. Earnings performance and discretionary disclosure. Journal of Accounting
Research 40, 173–204.
Miller, G.S., 2009. Should managers provide forecasts of earnings? A review of the empirical
literature and normative policy recommendations.
Peng, L., Xiong, W., 2006, Investor attention, overconfidence, and category learning, Journal of
Financial Economics 80, 563–602
Pevzner, M., 2007. Management earnings forecasts, information asymmetry, and liquidity: An
empirical investigation. Working paper. George Mason University.
Piotroski, J., Roulstone, D., 2005. The influence of analysts, institutional investors, and insiders
on the incorporation of market, industry, and firm-specific information into stock prices.
The Accounting Review 79, 1119–1151.
Plumlee, M.A., 2003. The effect of information complexity on analysts’ use of that information.
The Accounting Review 78, 275-296.
Rogers, J.L., Skinner, D.J., Van Buskirk, A., 2009. Earnings guidance and market uncertainty.
Journal of Accounting and Economics 48, 90-109.
Tayor, D.J., 2010. Individual investors and corporate earnings. Working paper. University of
Pennsylvania.

28
Tucker, J.W. 2011. Selection bias and econometric remedies in accounting and finance research,
Journal of Accounting Literature 29, 31-57.
Venter, J.H., de Jongh, D., 2006. Extending the EKOP model to estimate the probability of
informed trading. Studies in Economics and Econometrics 30, 25–39.
You, H., Zhang, X., 2009. Financial reporting complexity and investor underreaction to 10-K
information. Review of Accounting Studies 14, 559–586.
29
Appendix A
Example of S&P Capital IQ (CIQ) Corporate Guidance Screening Report
Key
Developments
By Date
Key Developments by
Type Company Name(s) Key Development Headline
Key
Development
Sources
Excel
Company
ID17
CIK
Dec-28-2007 Executive/Board Changes
- Other; Corporate
Guidance - Raised
Ultra Petroleum Corp.
(NYSE:UPL)
Ultra Petroleum Corp. Revised Production Guidance for the
Fourth Quarter and Full Year 2007 ; Announces Executive
Changes
SEC Form 8k IQ610837 0001022646
Dec-28-2007 Corporate Guidance -
Lowered
Cache Inc. (NasdaqGS:CACH) Cache Inc. Lowers Earning Guidance for Fourth Quarter of
2007
The Associated
Press
IQ171869 0000350199
Dec-27-2007 Corporate Guidance -
Lowered
United Community Banks, Inc.
(NasdaqGS:UCBI)
United Community Banks Inc. Lowers Earnings Guidance
for the Fourth Quarter of 2007
Market Wire IQ667035 0000857855
Dec-27-2007 Corporate Guidance -
New/Confirmed
Sterling Financial Corp.
(NasdaqCM:STSA)
Sterling Financial Corp. Provides Earnings Guidance for the
Fourth Quarter and Year Ending December 31, 2007
PR Newswire IQ322217 0000891106
Dec-27-2007 Announcements of
Earnings; Corporate
Guidance -
New/Confirmed
Christopher & Banks
Corporation (NYSE:CBK)
Christopher & Banks Corp. Reports Earnings Results for
the Third Quarter of 2007 ; Provides Earnings Guidance for
the Fourth Quarter and Full Year 2007
MarketWatch IQ317486 0000883943
Dec-26-2007 Corporate Guidance -
Lowered
Target Corp. (NYSE:TGT) Target Corp. Revised Sales Guidance for the Month Ending
Jan. 5, 2008
Other IQ174438 0000027419
Dec-26-2007 Corporate Guidance -
New/Confirmed
The Sherwin-Williams
Company (NYSE:SHW)
Sherwin-Williams Co. Provides Earnings Guidance for the
Year 2007
WALL STREET
JOURNAL
ABSTRACTS
IQ303104 0000089800
Dec-25-2007 Corporate Guidance -
New/Confirmed
Target Corp. (NYSE:TGT) Target Corp. Provides Sales Guidance for the Five Weeks
Ending Jan. 5, 2008
Other IQ174438 0000027419
Dec-21-2007 Corporate Guidance -
New/Confirmed
Rick's Cabaret International
Inc. (NasdaqGM:RICK)
Rick's Cabaret International Inc. Provides Earnings
Guidance for the Fiscal Year Ending September 30, 2008
Business Wire IQ351071 0000935419
Dec-21-2007 Corporate Guidance -
Raised; Corporate
Guidance -
New/Confirmed
PG&E Corp. (NYSE:PCG) PG & E Corp. Reiterates Earnings Guidance for 2007 and
2008; Provides Earnings Guidance for 2009
The Associated
Newspapers of
Ceylon Limited
IQ139813 0001004980
Dec-21-2007 Corporate Guidance -
New/Confirmed;
Impairments/Write Offs
Popular, Inc.
(NasdaqGS:BPOP)
Popular Provides Earnings Guidance for the Fourth Quarter
2007 ; Announces Impairment Charges
The Associated
Press
IQ253660 0000763901
17Although Capital IQ is now a S&P company, it does not use GVKEY as the unique company ID. Instead, it has its own Excel company ID.

30
Appendix B
Variable Definition
Measure Variable Description and Data Source
Guidance Initiation INIT Indicator variable coded as 1 if a firm initiates quarterly
earnings guidance, and 0 otherwise. Guidance data are from
S&P Capital IQ database.
Probability of Informed
Trade
PIN From Professor Stephen Brown
Intensity of uninformed
trading
From Professor Stephen Brown
Intensity of informed
trading
From Professor Stephen Brown
Probability of private
information event
From Professor Stephen Brown
Firm Size SIZE The market capitalization (natural logarithm) at the
beginning of each quarter. Price and shares outstanding data
are from CRSP.
Leverage LEV The leverage at the beginning of each quarter. Debt data are
from COMPUSTAT.
𝐿𝑒𝑣𝑒𝑟𝑎𝑔𝑒 =(Long term Debt + Short term Debt)
Market Capitalization.
Number of Analysts
Following the Firm
AF The number of analysts following a firm in each quarter.
Data are from IBES summary file. If a firm is not covered, it
is zero.
Change of Number of
Analysts Following the
Firm
AF The average change of analyst following from quarters (-8,-
5) to quarters (-4,-1).
Institutional Ownership INSTOWN The institutional ownership of a firm in each quarter. Data
are from Thomson-Reuters Institutional Holding (13F)
Database. If a firm is not covered, it is zero.
Change of Institutional
Ownership
INSTOWN The average change of institutional ownership from quarters
(-8,-5) to quarters (-4,-1).
Past Earnings Change EPS The average change in diluted earnings per share (split-
adjusted) from quarters (-8,-5) to quarters (-4,-1) and

31
deflated by the stock price at the beginning of one-year
period before the event quarter.
Pre-event Stock
Performance
BHAR Buy-and-hold abnormal return in the one-year period before
the event quarter (adjusted by value-weighted market
return).
Volatility VOLAT Standard deviation of daily return in the one-year period
before the event quarter adjusted by the standard deviation
of the value-weighted market return in the same period.
Good or Bad News SURPRISE Equals to 1 if raising forecast, 0 if confirming forecast, and -
1 if lowering forecast.
Guidance Precision PRECISION Equals to 3 if point estimate, 2 is close range estimate, 1 if
open range estimate, and 0 if qualitative guidance.
Bundles or not BUNDLED Equals to 1 if bundled with earnings announcement, and 0
otherwise.
32
Appendix C
Parameter estimated from guidance initiation probit regression model
𝐼𝑁𝐼𝑇 = 𝛽0 + 𝛽1 ∙ 𝑆𝐼𝑍𝐸 + 𝛽2 ∙ 𝐵𝐻𝐴𝑅 + 𝛽3 ∙ 𝐴𝐹 + 𝛽4 ∙ ∆𝐴𝐹 + 𝛽5 ∙ 𝐼𝑁𝑆𝑇𝑂𝑊𝑁
+𝛽6 ∙ ∆𝐼𝑁𝑆𝑇𝑂𝑊𝑁 + 𝛽7 ∙ ∆𝐸𝑃𝑆 + 𝛽8 ∙ 𝑉𝑂𝐿𝐴𝑇
Independent variables Logit
INTERCEPT 6.5739***
(41.90)
SIZE -0.0237
(-0.86)
BHAR -0.0357*
(-1.71)
AF -0.0455***
(-6.51)
AF -0.0152
(-1.12)
INSTOWN -1.5674***
(-11.86)
INSTOWN -2.1395***
(-9.86)
EPS -0.0001
(-0.87)
VOLAT -5.6303***
(-7.18)
Pseudo R2 11.20%
Observations 145,862
Coefficients are displayed as odds ratios. Absolute values of z statistics are in parentheses. ***,
**, * denote significance at the 1%, 5%, and 10% levels, respectively.

33
Figure 1
Tree diagram of the trading process for EKO model
No Private
Information Event
Prob=(1-α)
Private
Information Event
Prob=α
“Bad News”
Prob=δ
“Good News”
Prob=(1-δ)
Buy arrival rate=Wtε
Sell arrival rate=Wtε
Buy arrival rate=Wtε
Sell arrival rate=Wt(ε+µ)
Sell arrival rate=Wtε
Buy arrival rate=Wt(ε+µ)
Prior to
the Trading Day
During
the Trading Day
Notes: α is the probability of a private information event. δ is the probability of “Bad News,” μ is the daily rate of informed trade arrival. ε is the
daily rate of uninformed (both buy and sell) trade arrival. The realization of whether there is an information event happens only once before the
trading day, while trade occurs continuously throughout the trading day.
34
Table 1
Distributions of guidance initiations
Panel A: Calendar year distribution
Year Initiations Percentage
2004 71 26.5%
2005 35 13.1%
2006 63 23.5%
2007 34 12.7%
2008 22 8.2%
2009 43 16.0%
Total 268 100%
Panel B: Fiscal quarter distribution
Fiscal Quarter Initiations Percentage
1 85 31.7%
2 75 28.0%
3 53 19.8%
4 55 20.5%
Total 268 100%
Panel C: Top 10 industries (48 Fama-French industry classification)
Observations Percentage Industry
32 12% Business Services
19 7% Electronic Equipment
16 6% Petroleum and Natural Gas
13 5% Medical Equipment
13 5% Wholesale
13 5% Pharmaceutical Products
11 4% Utilities
11 4% Machinery
11 4% Trading
8 3% Communication
35
Table 2
Panel A: Descriptive statistics for guidance initiation firms
Variable N Mean 25th Pct. Median 75th Pct. Std.
PIN 4,122 0.158 0.098 0.139 0.198 0.086
ε 4,122 356.944 65.260 186.057 482.933 438.739
μ 4,122 160.362 58.853 117.645 210.286 160.378
α 4,122 0.530 0.450 0.526 0.606 0.150
SIZE 4,122 6.551 5.446 6.394 7.572 1.660
AF 4,122 7.018 3 6 10 5.589
INSTOWN 4,122 0.645 0.426 0.695 0.895 0.290
LEV 4,122 0.412 0.000 0.113 0.411 0.882
Panel B: Correlation matrix for guidance initiation -- Pearson correlation coefficients above the
diagonal and Spearman rank correlation coefficients below the diagonal levels
Variables PIN ε μ α SIZE AF INSTOWN LEV
PIN -0.83 -0.68 0.24 -0.74 -0.62 -0.45 -0.07
ε -0.59 0.95 -0.01 0.88 0.73 0.51 0.13
μ -0.48 0.86 -0.09 0.81 0.68 0.49 0.12
α 0.35 -0.16 -0.27 0.04 -0.02 -0.05 0.10
SIZE -0.69 0.79 0.69 -0.10 0.70 0.47 0.18
AF -0.55 0.64 0.56 -0.09 0.68 0.44 0.04
INSTOWN -0.46 0.31 0.31 -0.11 0.44 0.41 0.01
LEV 0.16 -0.02 0.03 0.10 -0.08 -0.10 -0.14
All correlations significant at the 10% level (two-tailed) are highlighted in bold. Variables are defined in
Appendix B.

36
Table 3
OLS regression estimates of H1 and H2
𝐼𝐴𝑉 = 𝛽0 + 𝛽1 ∙ 𝐼𝑁𝐼𝑇 + 𝛽2 ∙ 𝑃𝑂𝑆𝑇 + 𝛽3 ∙ 𝑃𝑂𝑆𝑇 ∙ 𝐼𝑁𝐼𝑇 + 𝛽4 ∙ 𝑆𝐼𝑍𝐸 + 𝛽5 ∙ 𝐴𝐹
+𝛽6 ∙ 𝐼𝑁𝑆𝑇𝑂𝑊𝑁 + 𝛽7 ∙ 𝐿𝐸𝑉
Dependent Variable
Independent Predicted PIN ε μ α
variable sign (1) (2) (3) (4)
INTERCEPT 0.3862*** -910.0011*** -260.0032*** 0.5848***
(83.07) (-44.93) (-29.79) (50.78)
INIT +/- -0.0022 31.6990 14.7439 -0.0048
(-0.82) (0.75) (0.94) (-0.73)
POST +/- -0.0088*** 34.7212*** 10.2441** -0.0187***
(-3.34) (3.02) (2.04) (-2.85)
POST*INIT +/- 0.0037** -11.8205* -5.4614* 0.0057
(2.06) (-1.73) (-1.77) (0.62)
SIZE +/- -0.0279*** 179.7460*** 56.8808*** -0.0035*
(-35.11) (52.00) (37.82) (-1.78)
AF +/- -0.0016*** 16.3145*** 4.7416*** -0.0008
(-6.83) (16.18) (10.81) (-1.43)
INSTOWN - -0.0504*** -100.0002*** -3.1681 -0.0339***
(-13.75) (-6.59) (-0.46) (-3.74)
LEV +/- 0.0075*** 27.1443*** 18.1993*** 0.0137***
(6.96) (5.75) (8.86) (5.10)
Adj. R2 51.8% 64.8% 50.2% 2.3%
Observations 4,122 4,122 4,122 4,122
Variable definitions are in Appendix B. ***, **, * denote significance at the 1%, 5%, and 10% levels,
respectively (one-tailed for directional predictions; otherwise two-tailed). The t-statistics are in the
parentheses.
37
Table 4
The impact of the nature of news (good vs. bad news) on informed trading
𝐼𝐴𝑉 = 𝛽0 + 𝛽1 ∙ 𝑃𝑂𝑆𝑇 + 𝛽2 ∙ 𝑃𝑂𝑆𝑇 ∙ 𝑆𝑈𝑅𝑃𝑅𝐼𝑆𝐸 + 𝛽3 ∙ 𝑆𝐼𝑍𝐸 + 𝛽4 ∙ 𝑆𝐼𝑍𝐸 + 𝛽5 ∙ 𝐴𝐹
+𝛽6 ∙ 𝐼𝑁𝑆𝑇𝑂𝑊𝑁 + 𝛽7 ∙ 𝐿𝐸𝑉
Dependent Variable
Independent Predicted PIN ε μ α
variable sign (1) (2) (3) (4)
INTERCEPT 0.4027*** -720.0201*** -180.0022*** 0.5631***
(110.99) (-37.97) (-22.46) (58.83)
POST +/- 0.0051*** -52.9275*** -18.2753*** 0.0111**
(3.06) (-6.10) (-4.93) (2.53)
POST*SURPRISE +/- -0.0069*** 25.9059*** 7.7522*** -0.0154***
(-5.65) (4.05) (2.84) (-4.76)
SIZE +/- -0.0305*** 162.3193*** 48.3189*** -0.0011
(-49.99) (50.98) (35.56) (-0.71)
AF +/- -0.0010*** 19.6479*** 6.6787*** -0.0017***
(-6.51) (24.33) (19.37) (-4.18)
INSTOWN +/- -0.0577*** -201.0203*** -39.1737*** -0.0237***
(-18.53) (-12.20) (-5.64) (-2.89)
LEV +/- 0.0010 10.5038* 6.7325** 0.0098***
(0.87) (1.71) (2.56) (3.16)
Adj. R2 57.9% 61.7% 46.7% 1.8%
Observations 2,267 2,267 2,267 2,267
Variable definitions are in Appendix B. ***, **, * denote significance at the 1%, 5%, and 10% levels,
respectively (one-tailed for directional predictions; otherwise two-tailed). The t-statistics are in the
parentheses.

38
Table 5
The impact of guidance precision on informed trading
𝐼𝐴𝑉 = 𝛽0 + 𝛽1 ∙ 𝑃𝑂𝑆𝑇 + 𝛽2 ∙ 𝑃𝑂𝑆𝑇 ∙ 𝑃𝑅𝐸𝐶𝐼𝑆𝐼𝑂𝑁 + 𝛽3 ∙ 𝑆𝐼𝑍𝐸 + 𝛽4 ∙ 𝑆𝐼𝑍𝐸 + 𝛽5 ∙ 𝐴𝐹
+𝛽6 ∙ 𝐼𝑁𝑆𝑇𝑂𝑊𝑁 + 𝛽7 ∙ 𝐿𝐸𝑉
Dependent Variable
Independent Predicted PIN ε μ α
variable sign (1) (2) (3) (4)
INTERCEPT 0.4025*** -721.2043*** -181.0213*** 0.5638***
(110.69) (-37.88) (-22.41) (58.78)
POST +/- 0.0162*** -1.3e+02*** -34.1217*** -0.0024
(4.30) (-6.80) (-4.08) (-0.24)
POST*PRECISION +/- -0.0051*** 37.3927*** 7.3087** 0.0069
(-3.15) (4.47) (2.05) (1.63)
SIZE +/- -0.0305*** 162.2470*** 48.3414*** -0.0014
(-49.95) (50.97) (35.56) (-0.89)
AF +/- -0.0010*** 19.3716*** 6.6180*** -0.0017***
(-6.19) (23.95) (19.16) (-4.17)
INSTOWN +/- -0.0578*** -203.2021*** -38.9249*** -0.0224***
(-18.51) (-12.08) (-5.60) (-2.72)
LEV +/- 0.0015 8.6365 6.1905** 0.0108***
(1.28) (1.41) (2.36) (3.48)
Adj. R2 57.7% 61.7% 46.6% 1.4%
Observations 2,267 2,267 2,267 2,267
Variable definitions are in Appendix B. ***, **, * denote significance at the 1%, 5%, and 10% levels,
respectively (one-tailed for directional predictions; otherwise two-tailed). The t-statistics are in the
parentheses.
39
Table 6
The impact of bundled guidance on informed trading
𝐼𝐴𝑉 = 𝛽0 + 𝛽1 ∙ 𝑃𝑂𝑆𝑇 + 𝛽2 ∙ 𝑃𝑂𝑆𝑇 ∙ 𝑃𝑅𝐸𝐶𝐼𝑆𝐼𝑂𝑁 + 𝛽3 ∙ 𝑆𝐼𝑍𝐸 + 𝛽4 ∙ 𝑆𝐼𝑍𝐸 + 𝛽5 ∙ 𝐴𝐹
+𝛽6 ∙ 𝐼𝑁𝑆𝑇𝑂𝑊𝑁 + 𝛽7 ∙ 𝐿𝐸𝑉
Dependent Variable
Independent Predicted PIN ε μ α
variable sign (1) (2) (3) (4)
Intercept 0.4028*** -721.2151*** -181.0285*** 0.5638***
(110.71) (-37.95) (-22.47) (58.84)
POST +/- 0.0052*** -56.2293*** -20.2733*** 0.0206***
(2.66) (-5.55) (-4.70) (4.03)
POST*BUNDLED +/- 0.0006 2.7270 2.4800 -0.0141***
(0.35) (0.32) (0.68) (-3.26)
SIZE +/- -0.0306*** 162.6887*** 48.4396*** -0.0014
(-50.01) (51.04) (35.64) (-0.89)
AF +/- -0.0010*** 19.5926*** 6.6674*** -0.0017***
(-6.37) (24.21) (19.32) (-4.19)
INSTOWN +/- -0.0574*** -203.3252*** -39.7149*** -0.0221***
(-18.38) (-12.27) (-5.71) (-2.68)
LEV +/- 0.0015 8.8685 6.2859** 0.0105***
(1.27) (1.44) (2.39) (3.37)
Adj. R2 57.7% 61.6% 46.6% 1.6%
Observations 2,267 2,267 2,267 2,267
Variable definitions are in Appendix B. ***, **, * denote significance at the 1%, 5%, and 10% levels,
respectively (one-tailed for directional predictions; otherwise two-tailed). The t-statistics are in the
parentheses.

40
Table 7
The dynamics of the change in informed trading after guidance initiation
Dependent Variable
Independent Predicted T=0 T=1 T=2 T=3
variable sign (1) (2) (3) (4)
Intercept 0.3814*** 0.3854*** 0.3851*** 0.3833***
(65.60) (66.11) (66.50) (66.89)
INIT +/- -0.0019 -0.0021 -0.0023 -0.0025
(-0.71) (-0.79) (-0.86) (-0.95)
POST +/- -0.0059 -0.0117*** -0.0090** -0.0091**
(-1.40) (-2.74) (-2.12) (-2.13)
POST*INIT +/- 0.0082** 0.0037* 0.0027 0.0002
(2.13) (1.72) (0.46) (0.03)
SIZE +/- -0.0273*** -0.0276*** -0.0277*** -0.0278***
(-26.21) (-26.49) (-26.94) (-27.26)
AF +/- -0.0018*** -0.0016*** -0.0016*** -0.0016***
(-5.84) (-5.32) (-5.26) (-5.38)
INSTOWN +/- -0.0480*** -0.0519*** -0.0501*** -0.0465***
(-10.20) (-11.02) (-10.77) (-10.06)
LEV +/- 0.0086*** 0.0075*** 0.0071*** 0.0069***
(5.93) (5.19) (4.97) (4.93)
Adj. R2 50.2% 50.6% 51.0% 51.3%
Observations 2,601 2,583 2,572 2,561
Variable definitions are in Appendix B. ***, **, * denote significance at the 1%, 5%, and 10% levels, respectively
(one-tailed for directional predictions; otherwise two-tailed). The t-statistics are in the parentheses.