
Unilever Full Year 2017 Results HARBOUR STATEMENT This announcement may contain forward-looking...
22
Unilever Full Year 2017 Results Paul Polman / Graeme Pitkethly 1 st February 2018
Transcript of Unilever Full Year 2017 Results HARBOUR STATEMENT This announcement may contain forward-looking...

Unilever Full Year 2017 Results Paul Polman / Graeme Pitkethly
1st February 2018
SAFE HARBOUR STATEMENT
This announcement may contain forward-looking statements, including ‘forward-looking statements’ within the meaning of the United States Private Securities Litigation Reform Act of 1995, including statements related to underlying sales growth and underlying operating margin. Words such as ‘will’, ‘aim’, ‘expects’, ‘anticipates’, ‘intends’, ‘looks’, ‘believes’, ‘vision’, or the negative of these terms and other similar expressions of future performance or results, and their negatives, are intended to identify such forward-looking statements. These forward-looking statements are based upon current expectations and assumptions regarding anticipated developments and other factors affecting the Unilever Group (the “Group”). They are not historical facts, nor are they guarantees of future performance.
Because these forward-looking statements involve risks and uncertainties, there are important factors that could cause actual results to differ materially from those expressed or implied by these forward-looking statements. Among other risks and uncertainties, the material or principal factors which could cause actual results to differ materially are: Unilever's global brands not meeting consumer preferences; Unilever's ability to innovate and remain competitive; Unilever's investment choices in its portfolio management; inability to find sustainable solutions to support long-term growth; customer relationships; the recruitment and retention of talented employees; disruptions in our supply chain; the cost of raw materials and commodities; the production of safe and high quality products; secure and reliable IT infrastructure; successful execution of acquisitions, divestitures and business transformation projects; economic and political risks and natural disasters; the effect of climate change on Unilever's business; financial risks; failure to meet high and ethical standards; and managing regulatory, tax and legal matters. These forward-looking statements speak only as of the date of this announcement. Except as required by any applicable law or regulation, the Group expressly disclaims any obligation or undertaking to release publicly any updates or revisions to any forward-looking statementscontained herein to reflect any change in the Group's expectations with regard thereto or any change in events, conditions orcircumstances on which any such statement is based. Further details of potential risks and uncertainties affecting the Group aredescribed in the Group's filings with the London Stock Exchange, Euronext Amsterdam and the US Securities and Exchange Commission, including in the Annual Report on Form 20-F 2016 and the Unilever Annual Report and Accounts 2016.

Paul Polman
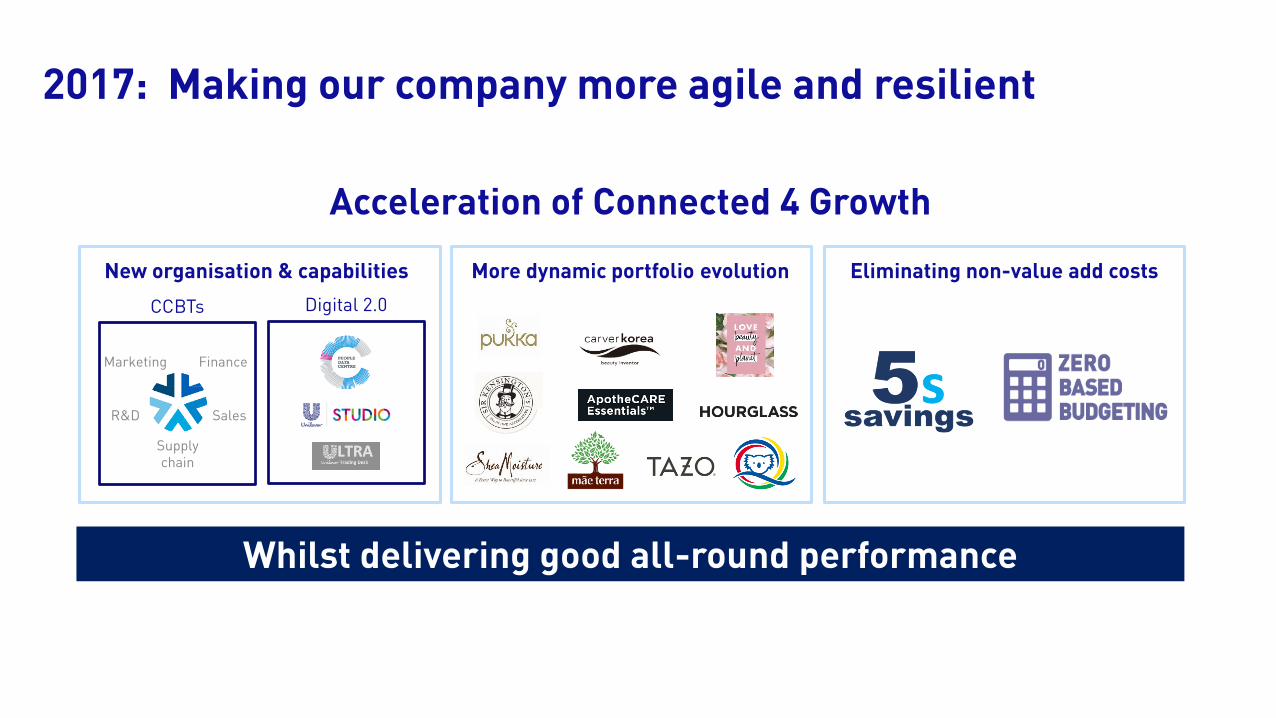
2017: Making our company more agile and resilient
Whilst delivering good all-round performance
New organisation & capabilities Eliminating non-value add costsMore dynamic portfolio evolution
Acceleration of Connected 4 Growth
Digital 2.0CCBTs
Supply chain
Finance
Sales
Marketing
R&D
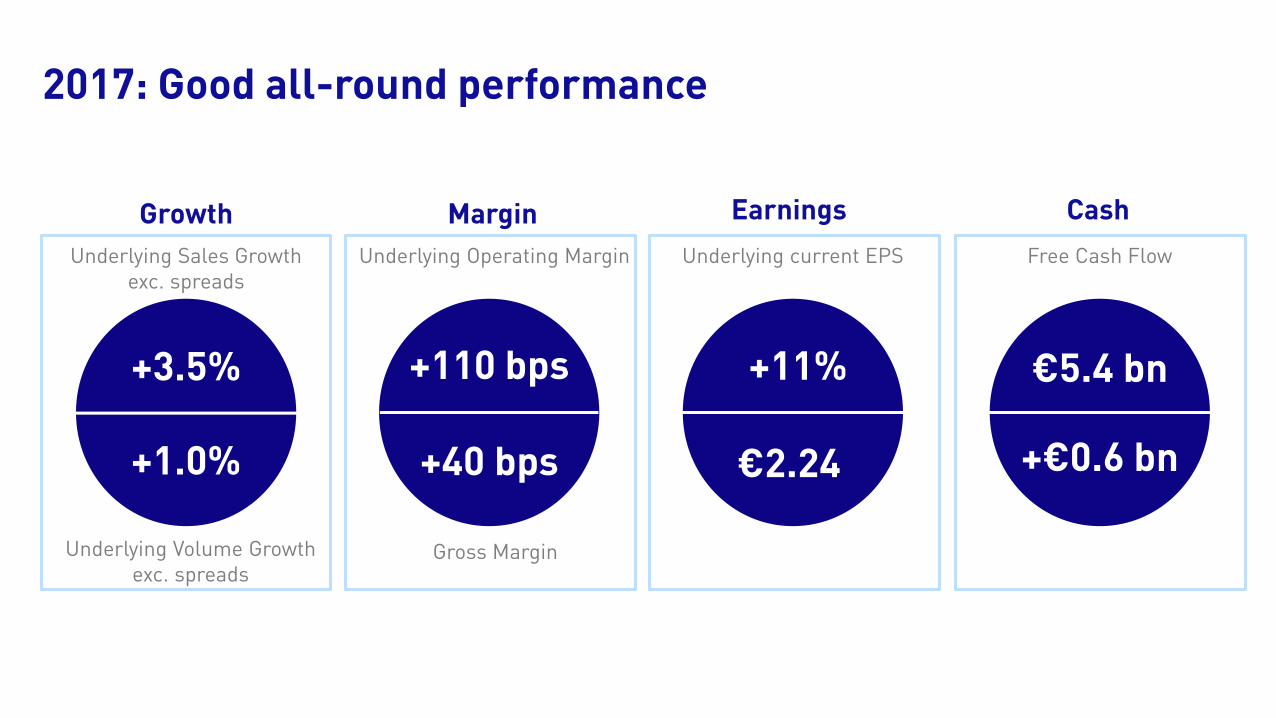
+11%
€2.24
Margin Cash
Free Cash Flow
+€0.6 bn
€5.4 bn
Underlying Operating Margin
+40 bps
+110 bps
Gross Margin
Growth
Underlying Sales Growth exc. spreads
Underlying Volume Growth exc. spreads
+3.5%
+1.0%
Earnings
Underlying current EPS
2017: Good all-round performance

Weak consumer demand Uncertainties remain
Market volume growth
Improving consumer confidence
Jan-16 Jul-16 Jan-17 Jul-17
Source: ENBPP Emerging Market Monitor Source: Nielsen, adjusted for e-commerce
<1%
Emerging market monitor
Elections
Unemployment Interest rates
Currencies
Commodities
Inflation
…?
Markets weak in 2017 but early signs of improvement

New consumer trends New channels New markets
Plenty of opportunity
E-commerce
Experience storesHealth & Beauty
Direct to consumerPurpose-led consumers
Changing demographics
Authentic, natural & free-from
Digital
Cuba
Ethiopia
Iran
Myanmar
New sources of growth

More benefits More relevant More channel focus
Pure-leaf pop-up
Magnum pints
Lifebuoy silver CIF duo
Lever Ayush Amazon bundles
Connected 4 Growth: delivering bigger, better, faster innovation
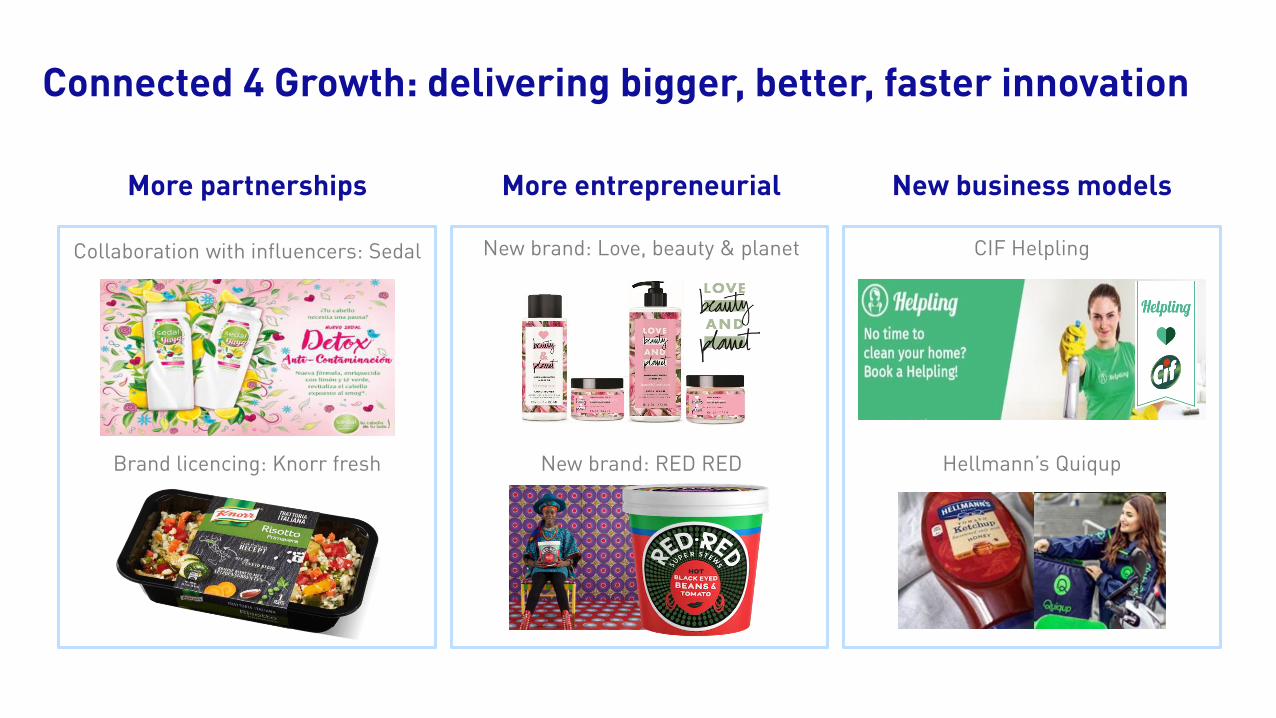
More partnerships More entrepreneurial New business models
Brand licencing: Knorr fresh New brand: RED RED
CIF HelplingCollaboration with influencers: Sedal New brand: Love, beauty & planet
Hellmann’s Quiqup
Connected 4 Growth: delivering bigger, better, faster innovation
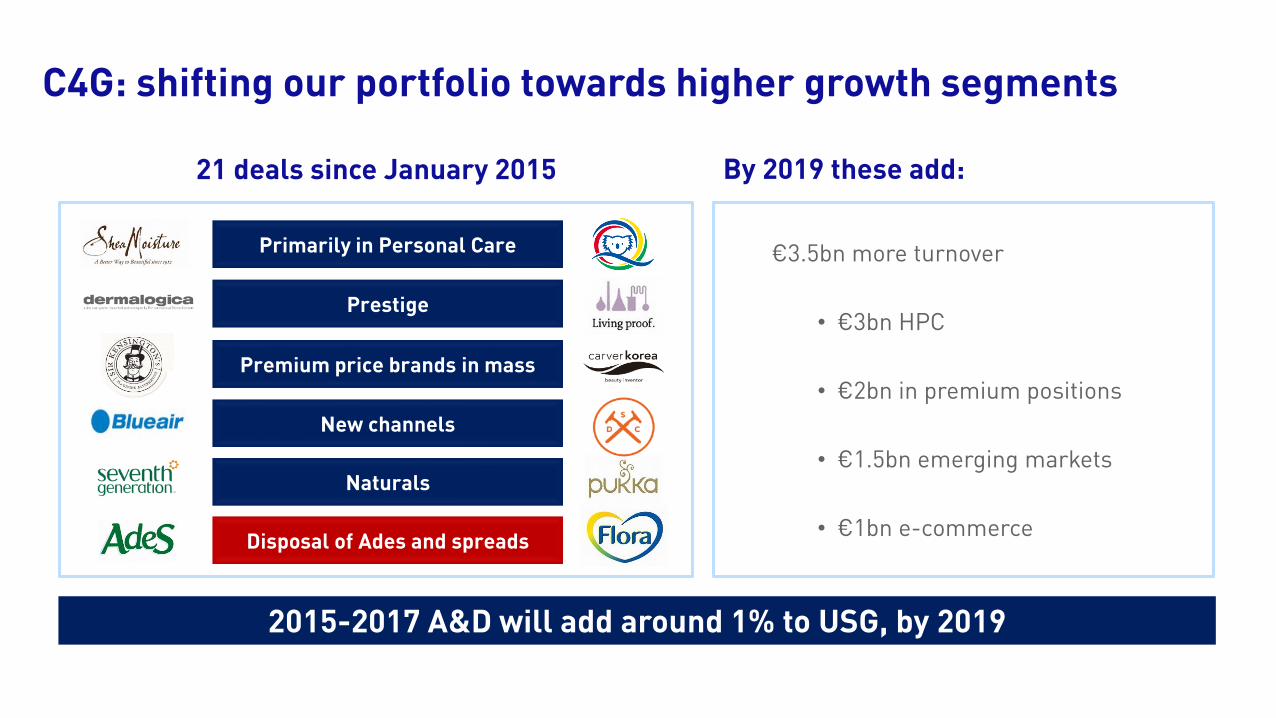
€3.5bn more turnover
• €3bn HPC
• €2bn in premium positions
• €1.5bn emerging markets
• €1bn e-commerce
2015-2017 A&D will add around 1% to USG, by 2019
By 2019 these add: 21 deals since January 2015
New channels
Naturals
Primarily in Personal Care
Premium price brands in mass
Prestige
Disposal of Ades and spreads
C4G: shifting our portfolio towards higher growth segments

Graeme Pitkethly

Personal Care Home Care Food Refreshment
USG
USG
2.9% 4.4% 2.2%4.9%
(2.4)%
UOM
USG USGUSG exc. spreads
UOM UOM inc. spreads UOM
+160bps+110bps + +130bps +60bps
Spreads
2017: Broad-based category growth & margin improvement

Improving volume momentum
Benefits of C4G organisation
More innovation
Increasing reinvestment
Weak comparator in India and UK
Volume contribution to quarterly growth
Emerging Markets picking up
25 year average
2015 2016 20170%
4%
2%
Q1 Q2 Q3 Q4
UVG(0.1)%
2.6%
3.0%
4.0%
USG 2.9%
0.0% 0.2%
3.2%
EM underlying volume growth
C4G led volume recovery in Q4, amplified by soft comparator
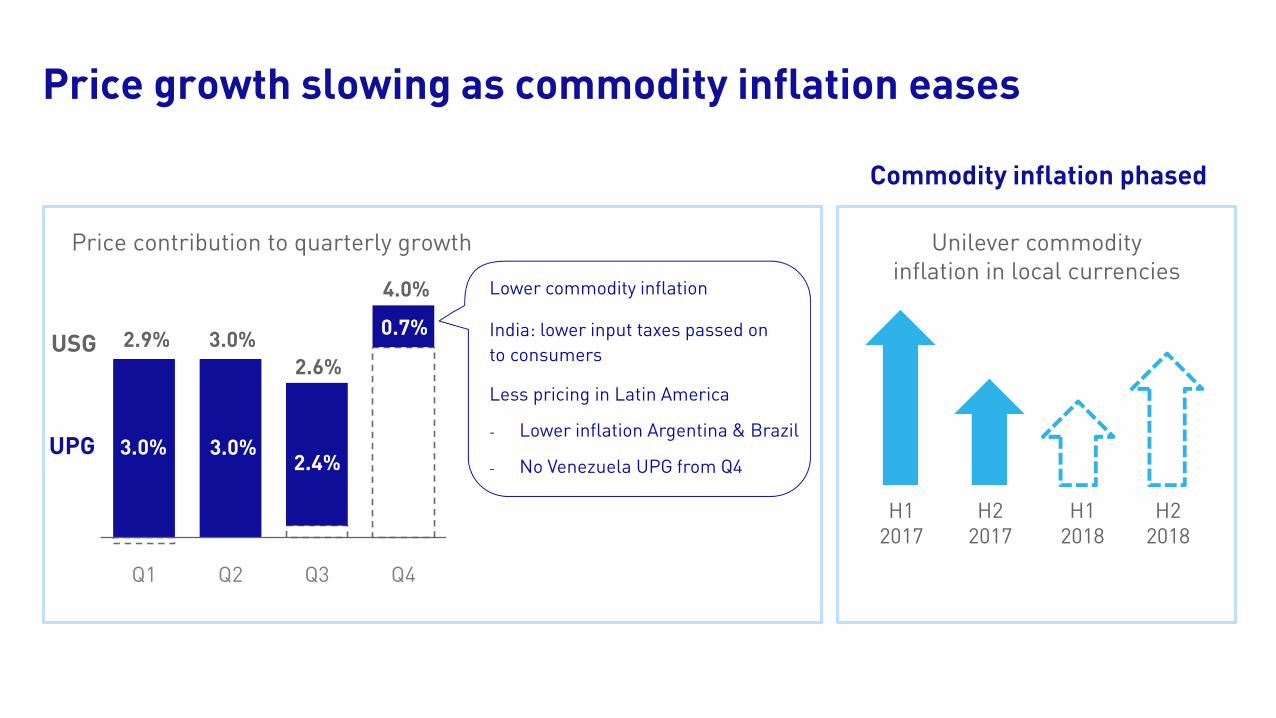
Lower commodity inflation
India: lower input taxes passed on
to consumers
Less pricing in Latin America
- Lower inflation Argentina & Brazil
- No Venezuela UPG from Q4
Price contribution to quarterly growth
Commodity inflation phased
Q1 Q2 Q3 Q4
UPG 3.0%
2.6%
3.0%
4.0%
USG 2.9%
3.0%2.4%
0.7%
Unilever commodity inflation in local currencies
H1 2017
H2 2017
H1 2018
H2 2018
Price growth slowing as commodity inflation eases

2016
Turnover
UVG
exc. Spreads
UPG
exc. Spreads
Spreads M&A FX 2017
Turnover
€52.7bn
USG +3.1%
€53.7bn
1.0%
2.4%
0.9%
(2.1)%(0.4)%
Full year 2017 turnover
• Reinvesting in capability
• Reinvesting in competitiveness
• Reinvesting in brand awareness
• Spend maintained in local currency
• C4G organisation fully in place
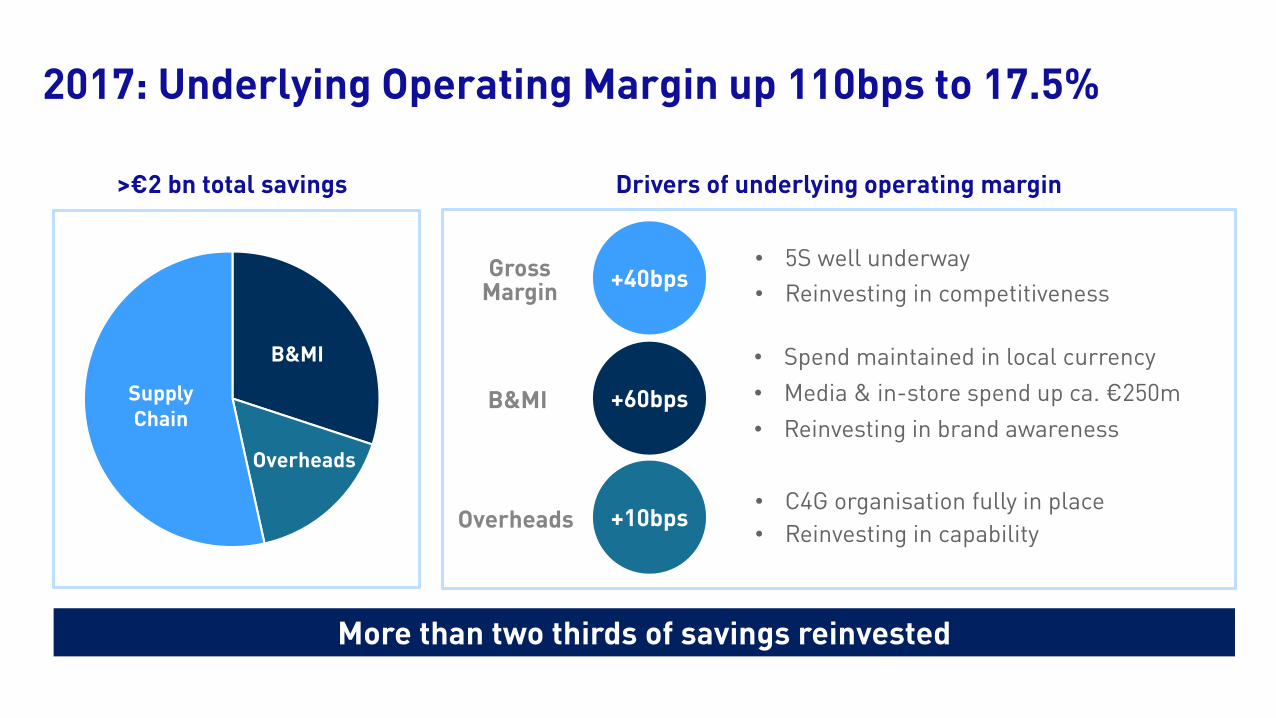
More than two thirds of savings reinvested
>€2 bn total savings
Supply Chain
B&MI
Overheads
Gross Margin
B&MI
Overheads
+60bps
+10bps
Drivers of underlying operating margin
+40bps• 5S well underway
• Media & in-store spend up ca. €250m
2017: Underlying Operating Margin up 110bps to 17.5%
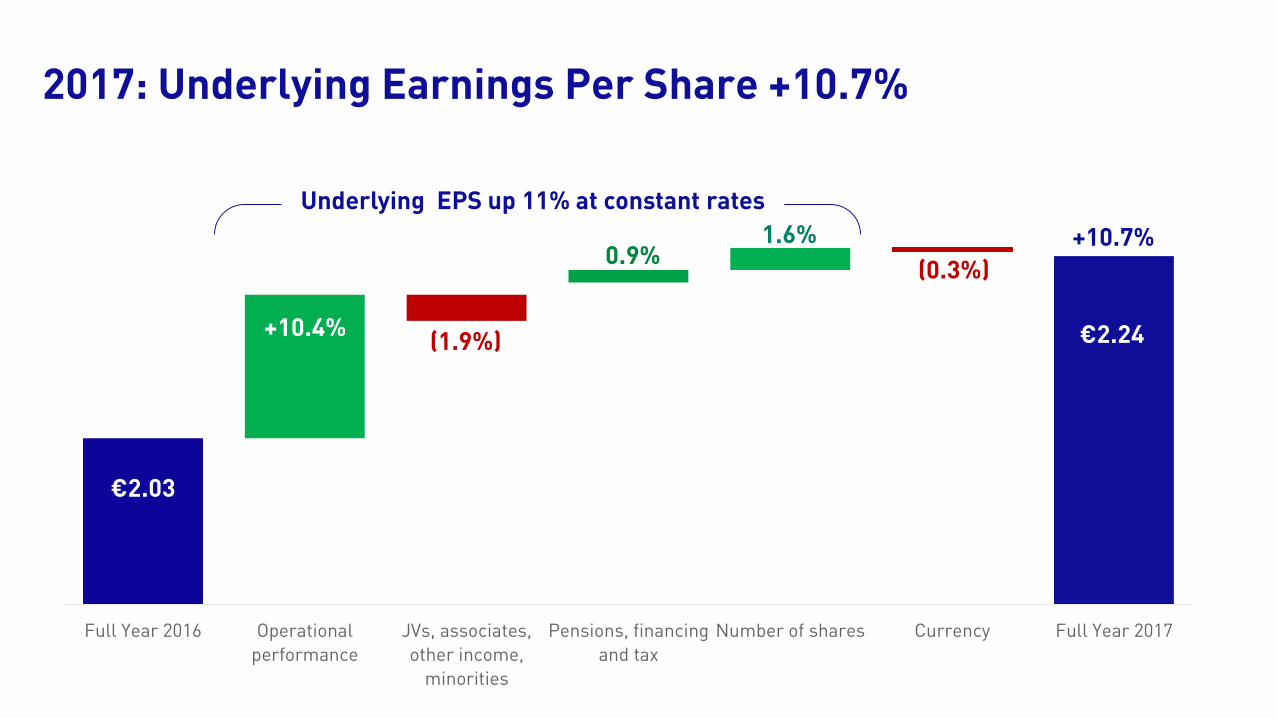
Full Year 2016 Operational
performance
JVs, associates,
other income,
minorities
Pensions, financing
and tax
Number of shares Currency Full Year 2017
+10.4%
€2.03
(1.7%)
(1.5%)
2.6%
€2.24
1.6%
Underlying EPS up 11% at constant rates
+10.7%
(1.9%)
0.9%(0.3%)
2017: Underlying Earnings Per Share +10.7%
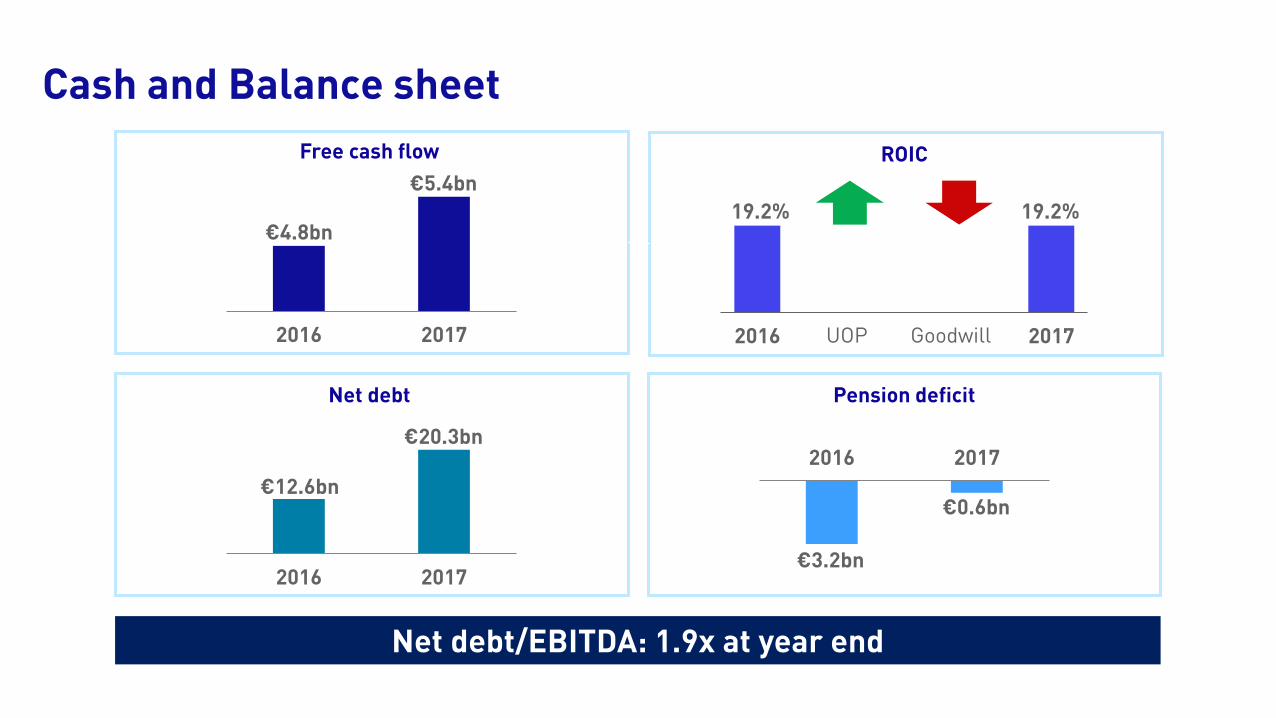
2016 2017
€12.6bn
€20.3bn
Pension deficit
Free cash flow
Net debt
2016 2017
€4.8bn
€5.4bn
2016 2017
€3.2bn
€0.6bn
Net debt/EBITDA: 1.9x at year end
ROIC
2016 2017
19.2% 19.2%
UOP Goodwill
Cash and Balance sheet

Paul Polman
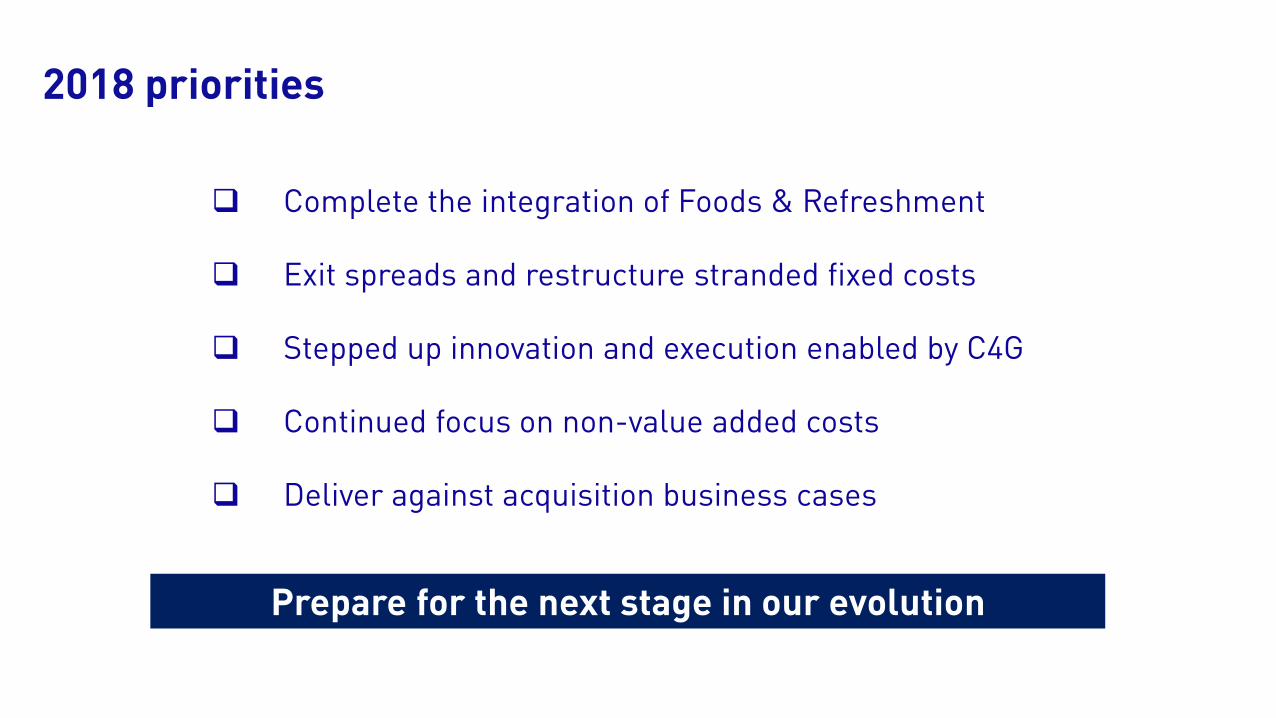
Prepare for the next stage in our evolution
Complete the integration of Foods & Refreshment
Exit spreads and restructure stranded fixed costs
Stepped up innovation and execution enabled by C4G
Continued focus on non-value added costs
Deliver against acquisition business cases
2018 priorities
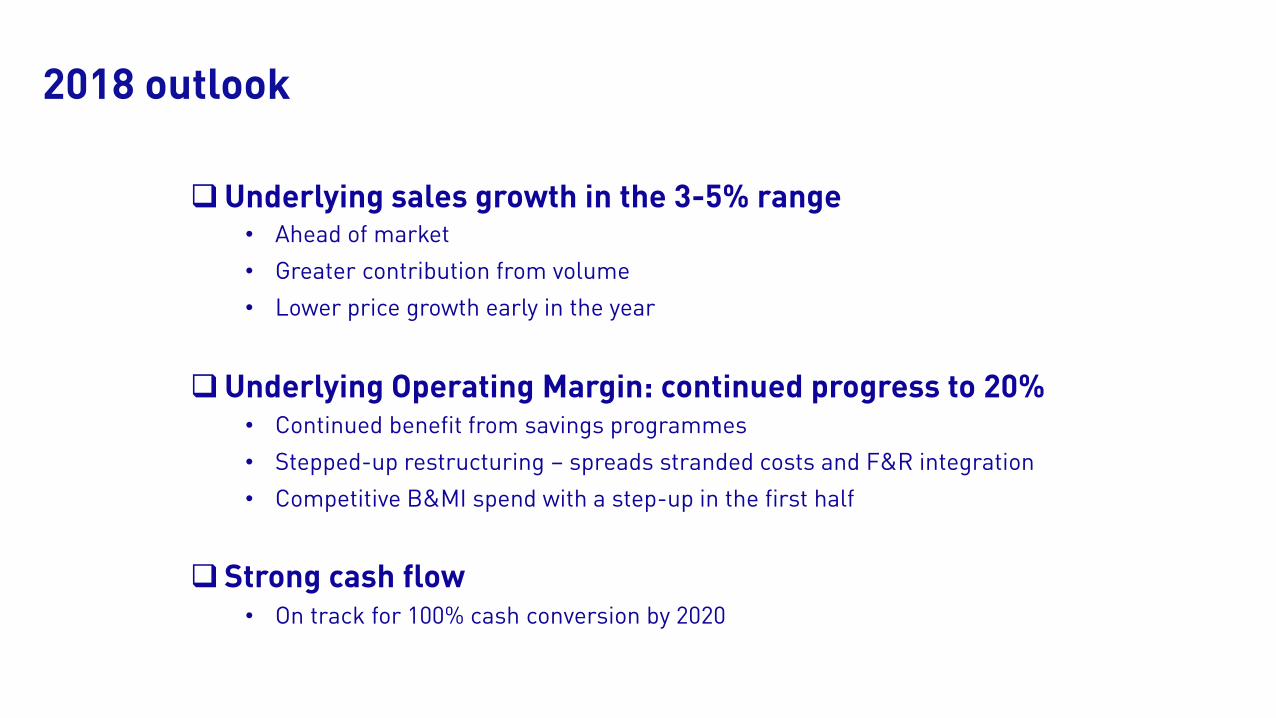
Underlying sales growth in the 3-5% range
Underlying Operating Margin: continued progress to 20%
Strong cash flow
• Ahead of market
• Greater contribution from volume
• Lower price growth early in the year
• Continued benefit from savings programmes
• Stepped-up restructuring – spreads stranded costs and F&R integration
• Competitive B&MI spend with a step-up in the first half
• On track for 100% cash conversion by 2020
2018 outlook

Unilever Full Year 2017 Results Paul Polman / Graeme Pitkethly
1st February 2018


