Unilever Directors’ Remuneration Report 2019€¦ · When assessing all incentive outcomes in the...
19
Disclaimer This is a PDF version of the Unilever Annual Report and Accounts 2019 and is an exact copy of the printed document provided to Unilever’s shareholders. Certain sections of the Unilever Annual Report and Accounts 2019 have been audited. These are on pages 87 to 152, and those parts noted as audited within the Directors’ Remuneration Report on pages 66 to 72. The maintenance and integrity of the Unilever website is the responsibility of the Directors; the work carried out by the auditors does not involve consideration of these matters. Accordingly, the auditors accept no responsibility for any changes that may have occurred to the financial statements since they were initially placed on the website. Legislation in the United Kingdom and the Netherlands governing the preparation and dissemination of financial statements may differ from legislation in other jurisdictions. Except where you are a shareholder, this material is provided for information purposes only and is not, in particular, intended to confer any legal rights on you. This Annual Report and Accounts does not constitute an invitation to invest in Unilever shares. Any decisions you make in reliance on this information are solely your responsibility. The information is given as of the dates specified, is not updated, and any forward-looking statements are made subject to the reservations specified in the cautionary statement on the inside back cover of this PDF. Unilever accepts no responsibility for any information on other websites that may be accessed from this site by hyperlinks.
Transcript of Unilever Directors’ Remuneration Report 2019€¦ · When assessing all incentive outcomes in the...

Disclaimer
This is a PDF version of the Unilever Annual Report and Accounts 2019 and is an exact copy of the printed document provided to Unilever’s shareholders.
Certain sections of the Unilever Annual Report and Accounts 2019 have been audited. These are on pages 87 to 152, and those parts noted as audited within the Directors’ Remuneration Report on pages 66 to 72.
The maintenance and integrity of the Unilever website is the responsibility of the Directors; the work carried out by the auditors does not involve consideration of these matters. Accordingly, the auditors accept no responsibility for any changes that may have occurred to the financial statements since they were initially placed on the website.
Legislation in the United Kingdom and the Netherlands governing the preparation and dissemination of financial statements may differ from legislation in other jurisdictions.
Except where you are a shareholder, this material is provided for information purposes only and is not, in particular, intended to confer any legal rights on you.
This Annual Report and Accounts does not constitute an invitation to invest in Unilever shares. Any decisions you make in reliance on this information are solely your responsibility.
The information is given as of the dates specified, is not updated, and any forward-looking statements are made subject to the reservations specified in the cautionary statement on the inside back cover of this PDF.
Unilever accepts no responsibility for any information on other websites that may be accessed from this site by hyperlinks.
Letter from the ChairDear shareholders,As the Compensation Committee Chair, I am pleased to present Unilever’s Directors’ Remuneration Report (DRR) 2019. In the sections below, I set out remuneration outcomes for 2019 and describe the Committee’s activities in the year.
Business performance and remuneration 2019 has been another year of continuing balance of growth, improved profitability and strong cash generation. This was a solid set of full year results, although the results on growth and margin were short of the mid-point targets set at the start of the year, due to the marked slowdown in some of Unilever’s high growth markets.
The Committee has made various technical adjustments to the way we assess business performance outcomes for the purpose of determining incentive awards as described below. The Committee has carefully assessed these adjustments, to ensure that they make the targets set for incentives not materially easier or more difficult to achieve (see page 62).
Outcomes for 2019 annual bonus Underlying Sales Growth (USG) in the year was 2.9%, below our par bonus target of 3.3%. This was the result of various challenges including the rapid economic slowdown in South Asia and distributor stock resets and slowing market conditions in West Africa.
Developed markets declined with a volume decrease in Europe due to a strong comparator from hot weather in the previous year. Finally, while there are early signs of improving performance in North America, a full recovery there will take time.
Underlying Operating Margin (UOM) improved by 50bps to 19.1%, delivered through continued cost discipline and robust savings programmes. However, in the fourth quarter price growth decelerated driven by price reductions in India, significantly lower inflation in Turkey and increased promotional spend in Europe. This resulted in a headwind to our margin delivery for the year, resulting in a UOM improvement below our stretching target of 70bps. Strong Free Cash Flow (FCF) excluding taxes paid on disposal of €6.3 billion was achieved in the year driven primarily by underlying profit.
As a result, the final overall outcome for 2019 Annual Bonus was 82% of target. The Committee reviewed this formulaic outcome against the quality of results and determined that it was in line with overall business performance and consequently made no discretionary adjustments. Accordingly, the Committee confirmed a bonus of 82% of target opportunity for both the CEO Alan Jope (resulting in a bonus of 123% of Fixed Pay against a target of 150%), and the CFO Graeme Pitkethly (resulting in a bonus of 98% of Fixed Pay against a target of 120%). Both Directors elected to invest the maximum of 67% of their gross bonus into Unilever shares through the Management Co-Investment Plans (MCIP) (meaning they invested their entire net bonus plus additional personal funds), to be held for a minimum period of four years. Further details are on page 64.
Looking ahead a key focus for 2020 is on growth and in particular delivering ambitious USG aspirations. As a result the bonus for 2020 has a higher weighting of 50% on the USG measure, as disclosed in more detail on page 64.
Outcomes for 2017-2019 GSIP and MCIP Over the past three years Unilever has delivered consistent top and bottom line growth with USG CAGR of 3.0% and margin improvement at an average of +83 bps per year. Unilever also generated exceptional cumulative operating cash flow of €22.2 billion in the same period and finished 7th out of 19 in our peer group for total shareholder return (TSR). This ranking is based on average share prices over December and so incorporates the impact on Unilever’s share price of the December 2019 sales update announcement. This performance against 2017-2019 targets resulted in an outcome for the Global Share Incentive Plan (GSIP) of 119%. Having confirmed that this outcome reflected the underlying performance of the business over the plan cycle, the Committee confirmed a vesting ratio of 119% (corresponding to 60% of a maximum of 200% for the Executive Directors), as detailed on page 67.
When assessing all incentive outcomes in the round, the Committee considered the disappointing sales performance in the second half of 2019, including the factors behind it and concluded that the pay outcomes reflected this appropriately.
In 2017 we extended the performance period of our MCIP plan from three years to four years. Consequently, there is no MCIP award vesting at the end of 2019.
Directors' Remuneration Report
Committee members and attendance
Attendance Vittorio Colao Chair 5/5
Nils Andersen (Member as from 13 November 2019)
1/1
Marijn Dekkers 5/5
Andrea Jung 4/5
Mary Ma (Member until 31 August 2019)
3/4
This table shows the membership of the Committee together with their attendance at meetings during 2019. If Directors are unable to attend a meeting, they have the opportunity beforehand to discuss any agenda items with the Committee Chair. Attendance is expressed as the number of meetings attended out of the number eligible to be attended.
Engaging with shareholdersAt the beginning of the year I spoke with investors to hear their views on the implementation of our remuneration policy, as set out in the DRR 2018, which was received with high levels of support at our AGMs. We subsequently undertook extensive consultation with our investors and their representative bodies to discuss our proposals for the pay of our Executive and Non-Executive Directors (as detailed on page 64), our approach to the Dutch implementation of the European Shareholder Rights Directive (SRD), the adjustments to the targets for our inflight incentive schemes as set out on page 62 and target setting for the 2020 incentives.
I was encouraged that shareholders endorse our approach towards Executive Pay by which we make changes that are aligned with the wider workforce and aim to move the CEO gradually towards the pay level of the market median benchmark, subject to continued good performance. Investors also appreciated our strict approach to target setting and our alignment between pay and strategy, which resulted in a change in weightings for the 2020 annual bonus to reflect management’s focus on delivering growth as a key priority (further detail on page 64). Investors also expressed a wide range of preferences for the performance measures to be used for incentive plans, which the Committee will review in further detail in the context of the upcoming remuneration policy renewal in 2021.
Executive Director Fixed Pay increasesThe Committee has approved Fixed Pay increases of 4% for the CEO and 3% for the CFO, effective from 1 January 2020. This is in line with the average increase awarded to the wider Unilever workforce in 2019 of 3.6%. These increases were awarded to recognise the strong leadership of both individuals in 2019, which was Alan Jope’s first year in the CEO role and a year of transformation for Unilever generally. We also wanted to recognise Graeme Pitkethly’s seniority in his role, coming into his 5th year as CFO.
When our CEO Alan Jope was appointed on 1 January 2019 he was appointed with Fixed Pay 14% below that of what the Committee proposed for his predecessor and at the lower quartile of our remuneration benchmarking peer group, despite Unilever being one of the largest companies in this peer group. This positioning was intentional, given Alan’s internal promotion on appointment. However, subject to Alan’s continuing good performance the Committee will, over time, continue to review his Fixed Pay positioning and progress this towards the market median benchmark.
Unilever Annual Report and Accounts 201960

Governance Report
CEO and CFO Target Total Pay p.a.
Alan Jope CEO €'000 p.a. Graeme Pitkethly CFO €'000 p.a.
2019 2020 2019 2020
Fixed Pay 1,450 1,508 1,103 1,136
Annual Bonus 2,175 2,262 1,323 1,363
MCIP* Match share award 2,186 2,273 1,330 1,370
Target Total Pay 5,811 6,043 3,756 3,869
Personal MCIP* Investment in Unilever shares
67% 67% 67% 67%1,457 1,516 886 913
CEO and CFO Maximum Total Pay p.a.
Alan Jope CEO €'000 p.a. Graeme Pitkethly CFO €'000 p.a.
2019 2020 2019 2020
Fixed Pay 1,450 1,508 1,103 1,136
Annual Bonus 3,263 3,393 1,985 2,045
MCIP* Match share award 6,558 6,820 3,990 4,110
Maximum Total Pay 11,271 11,721 7,078 7,291
Personal MCIP* Investment in Unilever shares
67% 67% 67% 67%2,186 2,273 1,330 1,370
75% Safeguard Test ('Handbrake')**
8,816 9,168 5,584 5,752
The figures in these tables are calculated pursuant to UK requirements. * MCIP at maximum (67%) investment of bonus.** If the result of combined annual bonus and MCIP performance outcomes exceeds 75% of the maximum total
opportunity (excluding the effect of share price change and dividends on share awards) the Committee will review the quality and sustainability of underlying performance and may apply its discretion to reduce or cap the MCIP performance outcome applicable to the Executive Directors.
Fees for Non-Executive Director roles During the year Chairman and Non-Executive Director fees were reviewed. No Director was involved in deciding their own pay. Independent benchmarking shows that some of the roles are paid below market median rates, despite Unilever’s scale and complexity significantly exceeding the median for the peer group. In addition, the time commitments of certain roles have increased due to further expansion of tasks and the constantly evolving regulatory framework. Following this review an increase was approved of GBP 25,000 for the Chairman’s all inclusive fee, and an increase of GBP 3,000 for the members of the Audit Committee and the Compensation Committee. The basic Non- Executive Director fee remains unchanged. Further details can be found on page 71.
Unilever’s remuneration policy The Netherlands has implemented the SRD with effect from 2020. Unilever is pleased to see these new reporting requirements which more closely align the Dutch regulations with what we already report under the UK regulations and the UK Corporate Governance Code. Key provisions of the SRD were already in place at Unilever including an annual advisory vote on the implementation of our remuneration policy for NV shareholders. Earlier in the year we were pleased to see the high levels of support we received from investors at our 2019 AGMs: PLC 95.62% and NV 96.92% in favour of the remuneration report.
During 2019 the Committee assessed our remuneration policy for compliance to the SRD. We believe that our policy already complies with the SRD’s requirements. As such, we will next put the policy to a vote at both the PLC and NV AGMs in 2021. This enables us to maintain the
three-year cycle for renewal of the remuneration policy, as required under UK regulations and permitted under Dutch regulations and ensures there is continuous alignment between PLC and NV shareholder approval in the same year. I’d like to take this opportunity to provide more details than previously with reference to the SRD requirement implemented in the Netherlands to state how we have taken into account the views of employees and the level of support in society. See page 62.
In the forthcoming financial year we will continue to implement the approved remuneration policy. We will also continue to embed our executive remuneration arrangements across our entire management population worldwide in line with the New Reward Framework, adopted in 2018 for our Executive Directors. This implementation has been working successfully and has resulted in strong levels of participation in MCIP through which long-term personal commitment through share ownership drives reward at Unilever. The Committee will further review progress ahead of the remuneration policy renewal at the 2021 AGMs to ensure the new policy continues to align the interests of our wide range of stakeholders and supports the delivery of the new Compass (see page 9), including short and long-term performance and value creation (see 'How we take into account the views of employees and the level of support in society' in this letter).
Engaging with employees As announced last year the Boards decided to share the responsibility for workforce engagement among all Non-Executive Directors to ensure that all Directors have a collective responsibility for bringing employee views into relevant board discussion. See page 48 for a summary of the discussions that took place in 2019. I also communicated to all employees to provide an update of Unilever’s Executive Directors’ remuneration, highlighting how this aligns with employees’ remuneration and with our medium and long-term purpose and strategy.
Implementation report The annual report on remuneration overleaf describes the 2019 remuneration as well as the planned implementation of the remuneration policy in 2020 and our remuneration decisions for 2020. Both PLC and NV shareholders will have an advisory vote on the implementation of our remuneration policy at the 2020 AGMs.
On behalf of the Committee and the entire Board, I thank all shareholders and their representatives for the constructive engagement in 2019.
Vittorio ColaoChair of the Compensation Committee
61Unilever Annual Report and Accounts 2019

Directors' remuneration report continued
How we take into account the views of employees and the level of support in society Through the Unilever Sustainable Living Plan (USLP), and our values of integrity, respect, responsibility and pioneering, Unilever has already established a strong multi-stakeholder model and a track record of taking societal considerations into account in everything we do. Unilever is committed to demonstrating that our purpose-led, future-fit business model drives superior performance, which protects our consumers, customers, employees, society, planet and shareholders.
Fairness in the workplace is a core pillar of the USLP and incorporates our Framework for Fair Compensation. As part of our Framework's living wage element, we are committed to pay a living wage to all our direct employees. We are already paying at or above a certified living wage in most places and are actively working through the small number of remaining issues which are in areas with complex pay arrangements. Further detail can be found on page 17. The living wage principle is also endorsed as good practice in Unilever’s Responsible Sourcing Policy. The Committee already upholds its obligation
under Section 172 of the UK Companies Act 2006 (see page 12) to consider the impact of what we do on our multiple stakeholders. These considerations shape the way the Committee looks at pay and sets pay rates for our Executive and Non-Executive Directors relative to our wider workforce.
In establishing the New Reward Framework, Unilever took into account feedback on reward from employees, both through formal surveys and in focus groups. Having been introduced to the principles driving the New Reward Framework, employees consulted said they felt more aligned with Unilever’s strategy and the owner’s mentality than with previous frameworks. Through this exercise we also learned that more junior employees would appreciate a softening of the current hard link between bonus and MCIP to allow them to invest some of their Fixed Pay into MCIP rather being able to invest only from bonus. The Committee will take this feedback into account for the remuneration policy renewal at the 2021 AGMs.
Also, in 2019 the Committee followed up with two sessions on Workforce Pay to understand the remuneration structures and policies in place for the broader employee population. The Committee takes this context, together with the external climate, into account when making decisions on executive pay. The Committee was also pleased to see an uplift in response to the UniVoice employee engagement survey, which gives employees the opportunity to provide feedback and express their views on a variety of topics, including pay.
Finally, with the introduction of the Sustainability Progress Index as a 25% performance metric in our MCIP in 2017, we have further strengthened the linkage between our remuneration policy and Unilever’s identity, values, mission and contribution made to society. These considerations have been integrated further in our new Unilever Compass: Purpose-Led, Future-Fit (to be released in 2020). You can find the remuneration policy at the link below and more on the Unilever Compass on page 9.
www.unilever.com/remuneration-policy
Technical adjustmentsUnderlying sales growth methodologyDuring 2019 Unilever updated its definition of USG to change the way we take into account hyperinflationary economies.
Previously our definition of USG excluded the impact of all price growth from countries where the impact of consumer price inflation rates had escalated to extreme levels (currently Argentina, Venezuela and Zimbabwe). After a full year of hyperinflationary conditions in Argentina, one of our larger markets, it became clear that these conditions would persist for some time. As a result, the definition has been updated so that a normalised level of price growth will be included in USG for hyperinflationary countries, which will be capped at an annual rate that is equivalent to approximately 2% per month compounded. This cap is derived from one of the indicators of hyperinflation cited in IAS 29 and ensures that any price growth above this level will be excluded from USG. The new USG definition better reflects Unilever’s normal pricing actions, distinct from those taken to respond to hyperinflationary conditions.
The Committee determined to make the same change to USG for incentive purposes so that the incentive outcomes align fully with our reported results. As a result, the USG target in our 2019 annual bonus was increased from 3.0% to 3.3%. Prior year numbers have also been restated as per our announcement in September 2019, when calculating the multi-year USG growth in our inflight long-term incentive plans.
IFRS 16 ‘leases’: adjustments to inflight incentive plans The Committee has made a formulaic, technical adjustment to reflect the implementation of IFRS 16 ‘Leases’. In 2019 the Group adopted IFRS 16, a new accounting standard which replaced the existing accounting standard for leases. The standard changes the recognition,
measurement, presentation and disclosure of leases. The standard has no impact on the cash flows of the Group. However, the standard requires lease payments to be split between capital repayments and interest and therefore impacts various cash flow subtotals. The result of adopting IFRS 16 has benefited our measure of FCF as well as Cumulative Operating Cash flow as defined for the GSIP. As such, the Committee has reflected the benefit of IFRS 16 in the 2019 Annual Bonus target originally set for FCF by increasing the target range from €4.2 billion-€6.2 billion to €4.7 billion-€6.7 billion.
The Committee has also reflected the benefit for the year 2019 in the 2017-2019 GSIP target for Cumulative Operating Cash flow which has resulted in an increase in the target range from €16.5 billion-€21.5 billion to €17.1 billion-€22.1 billion. For the 2018-2020 GSIP this resulted in an increase in the target range from €19 billion-€24 billion to €20.2 billion-€25.2 billion. In addition, upon adoption of IFRS 16 the Group recognised leases on the balance sheet with a right-of-use asset and related lease liability. This has resulted in an increase to property, plant and equipment, and thus invested capital, which is used to calculate Return on Invested Capital (ROIC). To reflect the impact of the new accounting standard, the Committee has adjusted the ROIC target ranges set for the 2017-2020 and 2018-2021 MCIP to include the dilutive effect of IFRS 16.
These are all formulaic adjustments which fully reflect the change in accounting standard.
Impact of Horlicks acquisition on inflight MCIP awardsThe Committee set long-term incentive plan targets assuming there will be a certain level of M&A each year. However, the acquisition of the Health Food Drinks portfolio from GlaxoSmithKline, including the Horlicks and Boost brands, is significantly larger than the 'bolt-on' M&A investment strategy included in the original target assumptions. Therefore, the
Committee reviewed the estimated impact of the Horlicks acquisition across all performance measures for all inflight long-term incentive plans to ensure they remain appropriate.
The Horlicks acquisition is expected to have a positive impact on underlying Earnings per Share (EPS) growth and a negative impact on ROIC. The Committee determined to adjust relevant inflight targets to adjust for the estimated positive and negative impacts of this acquisition to ensure that management are not unfairly penalised or rewarded for this acquisition. The like-for-like adjustment has the effect of reducing the ROIC targets and increasing the EPS targets. The Committee also wanted to ensure that management are incentivised for the successful implementation of this acquisition and therefore determined that adjusting targets at this stage is a more effective approach than adjusting outcomes to remove the impact of the acquisition at the time the awards vest.
The Committee took into account the estimated impact of the Horlicks acquisition in setting performance targets for 2019-2022 MCIP. However, the consideration for the acquisition is predominantly in shares in Hindustan Unilever Limited (HUL) and the share price movement of HUL since the announcement of the acquisition will have a significant impact on ROIC in 2019-2022. Accordingly, the Committee reduced the ROIC target for MCIP 2019-2022 to reflect this impact as per the share price of HUL on 20 February 2020. The adjusted targets for all inflight long-term incentive plans are set out below. The committee will review again the impact of the share price of HUL at deal completion and will evaluate if any re-alignment of targets will be necessary. Disclosure of the final targets will be posted at:
www.unilever.com/investor-relations/agm-and-corporate-governance/other-governance-information/remuneration
Unilever Annual Report and Accounts 201962

Governance Report
2018 – 2020 GSIP
Underlying Sales Growth (CAGR)
2.0% 6.0%25%
25% 200%
Average annual Underlying Operating Margin improvement (bps vs PY, Current FX)
50bps 140bps25%
25% 200%
Cumulative Operating Cashflow (€bn)
€20.2bn €25.2bn25%
25% 200%
Total Shareholder Return10th position 3rd position
25%50% 200%
2017-2020 MCIPWeighting Threshold Max
Underlying Sales Growth (CAGR)
2.0% 6.0%25%
0% 200%
Underlying Earnings per Share Growth (CAGR, Current FX)
7.0% 13.0%25%
0% 200%
Return on Invested Capital (Exit year %)
15.4% 18.4%25%
0% 200%
Sustainability Progress Index (Committee assessment of USLP progress)
0% 200%25%
0% 200%
2018-2021 MCIP
Underlying Sales Growth (CAGR)
1.5% 5.5%25%
0% 200%
Underlying Earnings per Share Growth (CAGR, Current FX)
6.1% 11.1%25%
0% 200%
Return on Invested Capital (Exit year %)
14.4% 18.4%25%
0% 200%
Sustainability Progress Index (Committee assessment of USLP progress)
0% 200%25%
0% 200%
Adjusted performance ranges for inflight MCIP/GSIP plans, following the adjustments explained on page 62 (see page 68 for the changes for MCIP 2019-2022).
63Unilever Annual Report and Accounts 2019

Annual report on remunerationThis section sets out how Unilever’s remuneration policy (which was approved by shareholders at the May 2018 AGMs and is available on our website) was implemented in 2019, and how it will be implemented in 2020.
www.unilever.com/remuneration-policy
Implementation of the remuneration policy for Executive Directors The remuneration of our Executive Directors was set in line with the principles for remuneration of the Group. Reward should support our business strategy and should be sufficient to attract and retain high-performing individuals without paying more than necessary. Being able to share in the success of Unilever is important across the workforce. The Executive Directors, other members of the ULE and most Unilever employees are rewarded on the basis of the same performance measures for the annual bonus. This helps drive a shared culture and alignment with Unilever’s purpose, strategy and values and allows employees to share in the same success as the most senior employees in Unilever. In addition, all of our management are invited to participate in the MCIP on similar terms to the conditions that apply to the Executive Directors. Further, all our other employees can participate in our ‘buy three, get one for free’ SHARES plan to drive an owner’s mentality throughout the organisation.
The CEO and CFO have the highest proportion of variable pay as they have the highest levels of responsibility. In addition, other employees’ bonuses are also determined by their individual performance whilst the CEO and CFO have no personal performance multiplier, thus making Unilever and Executive Director performance intrinsically connected.
Elements of remuneration
Fixed Pay
Purpose and link to strategy
Supports the recruitment and retention of Executive Directors of the calibre required to implement our strategy. Reflects the individual’s skills, experience, performance and role within the Group. Provides a simple competitive alternative to the separate provision of salary, fixed allowance and pension.
At a glance Details of the rationale for our Executive Directors' Fixed Pay amounts can be found on page 60.
Implementation in 2019
Effective from January 2019:• CEO: €1,450,000• CFO: €1,102,874
Planned for 2020 Effective from January 2020:• CEO: 4% increase to €1,508,000• CFO: 3% increase to €1,135,960
The Fixed Pay increase for Alan is slightly higher than the 3.6% increase for the wider workforce to reflect his performance and progression in role and conservative positioning against market on appointment. The Fixed Pay increase for Graeme is slightly below that provided to the wider workforce
Annual Bonus
Purpose and link to strategy
Incentivises year-on-year delivery of rigorous short-term financial, strategic and operational objectives selected to support our annual business strategy and the ongoing enhancement of shareholder value.
The ability to recognise performance through an annual bonus enables us to manage our cost base flexibly and react to events and market circumstances.
At a glance • Target annual bonus of 150% of Fixed Pay for the CEO and 120% of Fixed Pay for the CFO.• Business Performance Multiplier of between 0% and 150% based on achievement against business targets over the year.• Performance target ranges are considered to be commercially sensitive and will be disclosed in full with the corresponding
performance outcomes retrospectively following the end of the relevant performance year.• Maximum annual bonus is 225% of Fixed Pay for the CEO and 180% for the CFO.• Subject to ultimate remedy/malus and claw-back provisions.
Implementation in 2019
Implemented in line with the 2018 remuneration policy, with performance measures weighted as follows:• Underlying Sales Growth: 1/3• Underlying Operating Margin Improvement: 1/3• Free Cash Flow Growth: 1/3
Planned for 2020 The performance measures for 2020 will remain the same; however, the weight attached to each performance measure will change to reflect management's focus on delivering growth as a key priority for 2020:• Underlying Sales Growth: 50%• Underlying Operating Margin Improvement: 25%• Free Cash Flow Growth: 25%
Long-term Incentive (MCIP)
Purpose and link to strategy
The MCIP encourages senior management to invest their own money into Unilever shares, aligning their interests with shareholders by focusing on the sustained delivery of high performance results over the long term.
At a glance • Executive Directors are required to invest a minimum of 33% and a maximum of 67% of their bonus into MCIP. Investment is made out of after tax income, so investing 67% of gross bonus would require an investment of more than the total net bonus received.
• Matching shares are awarded based on performance up to a maximum of 3 x matching shares.• MCIP award to be made on 24 April 2020, vesting 15 February 2024 (with a requirement to hold vested matching shares for a
further one-year retention period).• Alan Jope and Graeme Pitkethly both elected to invest the maximum value of their 2019 bonus into MCIP investment shares,
giving a maximum value from the matching shares for the CEO of €3,584,835 and for the CFO of €2,181,308.• Subject to ultimate remedy/malus and claw-back provisions.
Directors' remuneration report continued
Unilever Annual Report and Accounts 201964

Governance Report
Elements of remuneration
Implementation in 2019
No vesting of MCIP shares due to the extension in performance period following the approval of the remuneration policy. Details of the 2019 MCIP awards can be found on page 68.
Performance update on Sustainability Progress Index (SPI) for MCIP year 2019 (based on 2018 USLP performance): The SPI is a two-fold assessment by the Corporate Responsibility Committee and the Compensation Committee that captures quantitative and qualitative elements (see page 57). For 2019, the Corporate Responsibility Committee and Compensation Committee agreed a framework for SPI assessment for the 2018 performance year that captures the breadth and depth of the USLP in relation to a number of key performance indicators (KPIs). These KPIs illustrate how Unilever aims to address a number of its principal risks such as brand preference, climate change, supply chain and ethics (see Our risks on page 35).
The Committees reviewed qualitative and quantitative progress across each category and delivery against the KPIs. The Committees agreed on a SPI achievement level against the KPI taking into account performance across the entire SPI Category.
The assessment of the Committees is summarised in the following table:
USLP Big Goal (see page 22)/ SPI Category
KPIs SPI Category Assessment
1) Health & Wellbeing Dove: Help young people build up positive body confidence and self-esteem through educational programmes.
Over-achieved
2) Environmental Impact CO2: Reduce emissions from energy from factories per tonne of production. Over-achieved
3) Enhancing Livelihoods Responsible Sourcing Policy (RSP): Source our procurement spend from suppliers meeting the mandatory requirements of the RSP.
Achieved
Accident Rate: Reduce the total recordable frequency rate (TRFR) for accidents in factories and offices.
Achieved
4) Transformational Change
Sustainable Palm Oil: Purchase crude palm oil from physically certified sustainable sources by 2019.
Over-achieved
5) Ratings & Rankings Achieve top ratings in a range of leading sustainability rankings and indices. Achieved
Overall SPI Outcome 125%
The Committee's annual SPI ratings will be tallied as an average SPI index for each four-year MCIP performance period.
Planned for 2020 Performance conditions are assessed over a four-year period. The performance conditions and target ranges for 2020 awards under MCIP will be as follows:
MCIP 2020 – 2023 awardsWeighting Threshold Max
Underlying Sales Growth (CAGR)
2.0% 6.0%25%
0% 200%
Underlying EPS growth (CAGR, Current FX)
2.0% 8.0%25%
0% 200%
Return on Invested Capital (Exit year %)
15.0% 20.0%25%
0% 200%
Sustainability Progress Index* (Committee assessment of USLP progress)
0% 200%25%
0% 200%
* SPI for MCIP year 2020: Plastic packaging will be an additional KPI for the 2019 performance on USLP (2020 SPI).
Performance at threshold results in no matching shares being awarded, target performance results in an award of 1.5 x matching shares, up to a maximum award of 3 x matching shares, with straight-line vesting between threshold and maximum. Participants are required to hold all their own investment shares and remain employed by Unilever for the duration of the relevant performance period.
The USG targets have increased by +50bps p.a. which reflect our continued top line growth ambitions.
The ROIC targets are set taking into account both IFRS 16 and the Horlicks acquisition, as disclosed elsewhere on page 62.
The target range for Underlying Earnings Per Share Growth has been reduced by 2% at the top end from the MCIP 2019-2022 cycle. When setting this target, the Committee believe that delivering 8% CAGR in EPS over the next four years would be an exceptional achievement and is a suitable stretch target. This target assumes a stronger Underlying Sales Growth performance, a more moderate benefit from operating leverage than seen in prior years as we reach our strategic margin ambition, and continues to reflect the increasing effect of exchange rate volatility in delivering current currency Underlying EPS growth over a four-year plan cycle. Historically FX has been a headwind on EPS, and unlike some peers our EPS targets are not adjusted to remove FX impacts. We also wish to reiterate that our MCIP plan pays out at 0% for threshold performance, with a straight-line vesting schedule up to maximum. Considering these factors in the round the Committee believe a target of 5% CAGR and a stretch of 8% CAGR to be appropriate.
In addition to the three elements mentioned above, our Executive Directors are provided with non-monetary benefits to aid attraction and retention. These include medical insurance cover, actual tax return preparation costs and provision of death-in-service benefits and administration.
65Unilever Annual Report and Accounts 2019
Ultimate remedy/malus and claw-backGrants under MCIP and the legacy GSIP are subject to ultimate remedy as explained in the remuneration policy. Malus and claw-back apply to all performance-related payments as explained in the remuneration policy.
In 2019, the Committee did not reclaim or claw back any of the value of awards of performance-related payments to current or former Executive Directors.
Single figure of remuneration and implementation of the remuneration policy in 2019 for Executive Directors (Audited)The table below shows a single figure of remuneration for each of our Executive Directors for the years 2018 and 2019.
Alan Jope CEO(a) (€’000) Graeme Pitkethly CFO (€’000)
2019
Proportion of Fixed
and Variable
Rem 2018
Proportion of Fixed
and Variable
Rem 2019
Proportion of Fixed
and Variable
Rem 2018
Proportion of Fixed
and Variable
Rem
(A) Fixed Pay (b) 1,450 N/A 1,103 1,058Total Fixed Pay 1,450 N/A 1,103 1,058(B) Other Benefits 41 N/A 27 26Fixed Pay & Benefits sub total 1,491 30.5% N/A N/A 1,130 26.0% 1,084 21.5%(C) STI: Annual Bonus 1,784 N/A 1,085 1,006(D) LTI: GSIP Performance Shares 1,619(d) N/A 2,132 2,267LTI: MCIP Match Shares(c) N/A N/A N/A 683Variable Remuneration sub total 3,403 69.5% N/A N/A 3,217 74.0% 3,956 78.5%LTI Sub total 1,619 N/A 2,132 2,950Total Remuneration - (Required by UK Law) (A+B+C+D) 4,894 N/A 4,347 5,040
(E) Share awards (required by Dutch law) 1,244 N/A 1,522 1,774
Total Remuneration - (Required by Dutch Law) (A+B+C+E) 4,519 N/A 3,737 3,864
(a) Alan Jope was appointed CEO as from 1 January 2019, but only became an Executive Director on 2 May 2019 at the close of the AGMs. However, for comparison purposes going forward, we disclose his remuneration for the full 2019 year.
(b) From May 2018 Fixed Pay replaces salary, fixed allowance and pensions following the implementation of our new Reward Framework for our Executive Directors.(c) In 2017 we extended the performance period of our MCIP plan from 3 years to 4 years, as such there was no MCIP vesting at the end of 2019. (d) Alan Jope's GSIP values in the above single figure table include GSIP performance shares previously granted to him in 2017 before his appointment as an Executive Director,
and include tax and social security.
Where relevant, amounts for 2019 have been translated into euros using the average exchange rate over 2019 (€1 = £0.8799), excluding amounts in respect of GSIP calculated for UK purposes, which have been translated into euros using the exchange rate at vesting date of 13 February 2020 (€1 = £0.8390). Amounts for 2018 have been translated into euros using the average exchange rate over 2018 (€1 = £0.8835), excluding amounts in respect of MCIP and GSIP calculated for UK purposes, which have been translated into euros using the exchange rate at vesting date of 11 February 2019 (€1 = £0.8784).
We do not grant our Executive Directors any personal loans or guarantees.
Elements of single figure remuneration 2019(A) Fixed Pay (Audited)Fixed Pay set in euros and paid in 2019: CEO – €1,450,000 CFO – €1,102,874
(B) Other benefits (Audited)For 2019 this comprises:
Alan Jope CEO (€)(a)
Graeme Pitkethly CFO (€)(a)
2019 2019
Medical insurance cover and actual tax return preparation costs 25,816 17,754
Provision of death-in-service benefits and administration 14,941 9,493Total 40,757 27,247
(a) The numbers in this table are translated where necessary using the average exchange rate over 2019 of €1 = £0.8799.
(C) Annual bonus (Audited)Annual bonus 2019 actual outcomes: CEO – €1,783,500 (which is 55% of maximum, 123% of Fixed Pay). CFO – €1,085,228 (which is 55% of maximum, 98% of Fixed Pay).
Alan Jope Graeme Pitkethly
Bonus @ target = 150%
(€2,175,000)
Businessperformance
82%€1,783,500 = Bonus @ target
= 120% (€1,323,449)
Businessperformance
82%€1,085,228 =
Annual bonus measures are not impacted by share price growth.
Directors' remuneration report continued
Unilever Annual Report and Accounts 201966

Governance Report
(C) Annual bonus (Audited) continuedThe annual bonus includes cash and the portion of annual bonus that Executive Directors have indicated will be re-invested in shares under the MCIP (satisfying the requirement to invest at least 33%). See below for details. Performance measure ranges have been adjusted to reflect the adjustments made by the Committee highlighted on page 62 in the Committee's Chair letter. Performance against targets:
Underlying sales growth (1/3)
Performance metrics (weighting)
Performance: Annual bonusThreshold
0%Target100%
Maximum150%
Result vesting
(% of target)
Free cash flow (€bn) (1/3)
Underlying operating margin improvement compared to prior year (1/3)
Overall performance ratio (based onactual performance bonus formula) and endorsed by the Committee after quality of results assessment
1.3%
€4.7bn
+30bps
percentagepoints
0%
2.9%
€6.3bn
+50bps
82%
4.3%
€6.7bn
+90bps
percentagepoints
150%
80%
117%
50%
82%
Further details of the annual bonus outcomes are described in the Committee's Chair letter on page 60. The calculated pay-out for Unilever’s 2019 performance ratio of 82% was endorsed by the Committee as representing a balanced assessment of underlying performance of the business.
(D) GSIP – UK law requirement (Audited)2019 OutcomesThis includes GSIP performance shares (operated under the Unilever Share Plan 2017) granted on 13 February 2017, based on performance in the three-year period to 31 December 2019, which vested on 13 February 2020.
The values included in the single figure table for 2019 are calculated by multiplying the number of shares granted on 13 February 2017 (including additional shares in respect of accrued dividends through to 31 December 2019) by the level of vesting (119% of target award) and the share price on the date of vesting (NV €54.70 and PLC £46.12, NV NY $59.45 and PLC ADR $60.53). These have been translated into euros using the exchange rate on the date of vesting (€1 = £0.8390 and €1 = $1.0877).
Performance measure ranges have been adjusted to reflect the adjustments made by the Committee highlighted on page 62 of the Committee's Chair letter. Performance against targets:
Underlying sales growth (CAGR) (25%)
Performance metrics (weighting)Performance: GSIP
Threshold0%
Maximum200%
Result vesting(% of target)
Average underlying operating margin improvement (25%)
Cumulative operating cash flow (25%)
Total shareholder return (25%)(a)
Overall vesting
2.0%
+40bps
€17.1bn
10th position
3.0%
+83bps
€22.2bn
119%
6.0%
€22.1bn
+130bps
3rd position
67%
109%
200%
100%
119%
percentagepoints
percentagepoints
7th
(a) For the relative TSR measure, Unilever’s TSR is measured against a comparator group of other consumer goods companies. TSR measures the return received by a shareholder, capturing both the increase in share price and the value of dividend income (assuming dividends are reinvested). The TSR results are measured on a common currency basis to better reflect the shareholder experience. The current TSR peer group consists of 18 companies (19 including Unilever) as follows: Avon, Beiersdorf, Campbell Soup, Coca-Cola, Colgate-Palmolive, Danone, General Mills, Estée Lauder, Henkel, Kao, Kellog's, Kimberly-Clark, L'Oréal, Nestlé, PepsiCo, Procter & Gamble, Reckitt Benckiser, Shiseido. The Committee may change the TSR vesting levels set out above if the number of companies in the TSR comparator group changes (eg via M&A activity etc).
Further details of the GSIP outcomes are described in the Committee's Chair letter on page 60.
On the basis of this performance, the Committee determined that the GSIP awards to the end of 2019 will vest at 119% of initial target award levels (i.e. 60% of maximum for GSIP).
67Unilever Annual Report and Accounts 2019

(D) GSIP – UK law requirement (Audited) continued
0 100,000 200,000 300,000 400,000 500,000 600,000 700,000 800,000 900,000 1,000,000 1,100,000
Alan Jope
NV NY Shares 11,674 shares €430,692 €802,062(e)
Graeme Pitkethly
15,414 shares €600,066 €1,084,252(e)
Original(a) Performance(b) Dividends(c) Share Price Growth(d)
15,485 shares €580,594 €1,047,834(e)
11,674 shares €435,903 €817,249(e)
30.5%
30.9%
28.8%
28.5%
NV Shares
PLC Shares
PLC ADR Shares
(a) The conditional number of shares awarded (including decimals) at the share price on the award date.(b) The business performance ratio applied to the original conditional share award (including decimals) at the share price on the award date.(c) The dividends accrued on the original conditional share award (including decimals) at the share price on the award date.(d) The nominal movement in share price between the award date and the vesting date applied to the original conditional share award plus accrued dividends (including
decimals) multiplied by the business performance ratio.(e) The final value of the award on the vesting date using the average exchange rate over 2019 of €1 = £0.8799 and €1= $1.1203. The actual number of vested shares can be found
on page 69. The share values for Alan Jope are grossed up for tax and social security.
(E) Share Awards- Dutch law requirement (Audited)As per the Dutch requirements, these costs are non-cash costs and relate to the expenses recognised for the period following IFRS 2. This is based on share prices on grant dates and a 98% adjustment factor for GSIP shares awarded in 2018, 2017 and 2016. For MCIP shares awarded in 2019, 2018 and 2017, there has been no adjustment factor applied.
Scheme interests awarded in the year (Audited)
MCIP Plan Conditional matching share award made on 23 April 2019
Basis of award Based on the level of 2018 annual bonus paid in 2019 invested by the CEO and CFO. The following numbers of matching shares were awarded on 23 April 2019 (vesting on 9 February 2023)(a):
CEO:• PLC – 0• NV – 16,668
CFO:• PLC – 19,196 • NV – 0Maximum vesting results in 200% of the above awards vesting.
Maximum face value of awards
• CEO: €1,748,991(b)
• CFO: €1,975,705(b)
Threshold vesting (% of target award)
Four equally weighted long-term performance measures. 0% of the target award vests for threshold performance.
Performance period 1 January 2019 – 31 December 2022 (with a requirement to hold vested matching shares for a further one-year retention period).
Details of performance measures
Performance measure ranges have been adjusted to reflect the adjustments made by the Committee highlighted on page 62 of the Committee's Chair letter:
MCIP 2019 – 2022 awardsWeighting Threshold Max
Underlying Sales Growth (CAGR)
1.5% 5.5%25%
0% 200%
Underlying EPS growth (CAGR, Current FX)
2.0% 10.0%25%
0% 200%
Return on Invested Capital (Exit year %)
16.0% 20.0%25%
0% 200%
Sustainability Progress Index (Committee assessment of USLP progress)
0% 200%25%
0% 200%
(a) Under MCIP, Executive Directors invest in NV or PLC shares, and receive a corresponding number of performance-related matching shares. On 23 April 2019, the CEO and the CFO invested the maximum value of their 2018 annual bonus in MCIP investment shares (Alan Jope elected to receive NV shares only and Graeme Pitkethly elected to receive PLC shares only, in line with the share choice provisions in operation at the time).
(b) Face values are calculated by multiplying the number of shares granted on 23 April 2019 (including decimals) by the share price on that day of PLC £45.28 and NV €52.47 respectively, assuming maximum performance and therefore maximum vesting of 200% for MCIP and then translating into euros using an average exchange rate over 2019 of €1 = £0.8799.
Directors' remuneration report continued
Unilever Annual Report and Accounts 201968

Governance Report
Minimum shareholding requirement and Executive Director share interests (Unaudited)The remuneration arrangements applicable to our Executive Directors require them to build and retain a personal shareholding in Unilever within five years of their date of appointment to align their interests with those of Unilever’s shareholders. Incoming Executive Directors will be required to retain all shares vesting from any share awards made since their appointment until their minimum shareholding requirements have been met in full.
The table below shows the Executive Directors’ share ownership against the minimum shareholding requirements as at 31 December 2019 and the interest in NV and PLC ordinary shares of the Executive Directors and their connected persons as at 31 December 2019.
When calculating an Executive Director’s personal shareholding the following methodology is used:• Fixed Pay at the date of measurement.• Shares in either PLC or NV (or a combination of both) will qualify provided they are personally owned by the Executive Director, by a member of his
(immediate) family or by certain corporate bodies, trusts or partnerships as required by law from time to time (each a ‘connected person’).• Shares purchased under the MCIP, whether from the annual bonus or otherwise, will qualify as from the moment of purchase as these are held in the
individual’s name and are not subject to further restrictions.• Shares or entitlements to shares that are subject only to the Director remaining in employment will qualify on a net of tax basis.• Shares awarded on a conditional basis by way of the GSIP or MCIP will not qualify until the moment of vesting (i.e. once the precise number of shares is
fixed after the three-year vesting period for the GSIP, or a four-year vesting period for the MCIP, has elapsed).• The shares will be valued on the date of measurement or, if that outcome fails the personal shareholding test, on the date of acquisition.
The share price for the relevant measurement date will be based on the average closing share prices and the euro/sterling/US dollar exchange rates from the 60 calendar days prior to the measurement date.
Executive Directors are required to hold shares to the value of 100% of their shareholding requirement for 12 months post cessation of employment at Unilever, and 50% of these shares for 24 months post cessation of employment with Unilever. ULE members are required to build a shareholding of 400% of Fixed Pay (500% for the CEO). This requirement is 150% of Fixed Pay for the ‘Top 75’ management layer below ULE.
Executive Directors’ and their connected persons’ interests in shares and share ownership (Audited)
Share ownership
guideline as % of Fixed
Pay (as at 31 December
2019)
Have guidelines
been met (as at 31
December 2019)
Actual share ownership as
a % of Fixed Pay (as at 31
December 2019)(a)
Shares held as at 1 January 2019(b)
Shares held as at 31 December 2019(b)
NV PLC NV NY PLC ADR NV PLC NV NY PLC ADR
CEO: Alan Jope 500% Yes 775% 0 0 129,561 44,534 11,112 0 151,141 49,197CFO: Graeme Pitkethly 400% Yes 740% 35,340 73,495 0 0 39,535 114,355 0 0
(a) Calculated based on the minimum shareholding requirements and methodology set out above and the headline Fixed Pay for the CEO and CFO as at 31 December 2019 (€1,450,000 for the CEO and €1,102,874 for the CFO).
(b) NVsharesareordinary€0.16sharesandPLCsharesareordinary31/9pshares.
During the period between 31 December 2019 and 20 February 2020, the following changes in interests have occurred:
• Graeme Pitkethly purchased 5 PLC shares under the PLC ShareBuy Plan: 3 on 9 January 2020 at a share price of £42.74, and a further 2 on 10 February 2020 at a share price of £46.61; and
• as detailed under headings (D) on page 67, on 13 February 2020:• Alan Jope acquired 13,988 NV NY shares following the vesting of his 2017 GSIP award; and• Graeme Pitkethly acquired 36,988 PLC shares following the vesting of his 2017 GSIP award.
The voting rights of the Directors (Executive and Non-Executive) and members of the ULE who hold interests in the share capital of NV and PLC are the same as for other holders of the class of shares indicated. As at 20 February 2020 none of the Directors’ (Executive and Non-Executive) or other ULE members’ shareholdings amounted to more than 1% of the issued shares in that class of share. All shareholdings in the table above are beneficial. On page 51 the full share capital of NV and PLC has been described. Page 103 and 104 set out how many shares Unilever held to satisfy the awards under the share plans.
Information in relation to outstanding share incentive awardsAs at 31 December 2019, Alan Jope held awards over a total of 53,314 shares which are subject to performance conditions, and Graeme Pitkethly held awards over a total of 115,708 shares which are subject to performance conditions. There are no awards of shares without performance conditions and no awards in the form of options.
69Unilever Annual Report and Accounts 2019

Management Co-Investment Plan (Audited)The following conditional shares vested during 2019 or were outstanding at 31 December 2019 under the MCIP:
Balance of conditional
shares at January 2019
Conditional shares
awarded in 2019(a)
Balance of conditional shares
at 31 December 2019
Share type
No. of shares
Performance period 1 January
2019 to 31 December
2022Price
award
Dividend shares
accrued during the
year (d)Vested in
2019(e)Price at vesting
Additional shares
earned in 2019(f)
No. of shares
NV 0 16,668 €52.47 382 0 0 17,050NV NY 27,241(b) 0 735 4,489 $54.73 1,088 24,575
Alan Jope PLC ADR 3,403(b) 0 0 4,492 $54.00 1,089 0
NV 23,739(c) 0 566 7,057 €48.55 1,711 18,959Graeme Pitkethly PLC 23,819(c) 19,196 £45.28 1,005 7,118 £42.06 1,726 38,628
(a) On 23 April 2019, Alan Jope and Graeme Pitkethly each invested in MCIP the maximum value of their annual bonus earned during 2018 and paid in 2019, and received a corresponding award of 1.5 x matching shares (which will vest, subject to performance, on 9 February 2023). Alan Jope chose to receive NV shares, and Graeme Pitkethly chose to receive PLC shares.
(b) This includes grants that were made to Alan Jope before his appointment as CEO as per 1 January 2019, being a grant of 3,123 of each NV NY and PLC ADR shares made on 11 February 2016 (which vested on 11 February 2019), a grant of 8,607 NV NY shares made on 17 May 2017 (vesting on 16 February 2021), a grant of 14,454 NV NY shares made on 23 April 2018 (vesting on 16 February 2022), and 1,057 NV NY shares and 280 PLC ADR shares from reinvested dividends accrued in prior years in respect of awards.
(c) This includes a grant of 4,912 of each NV and PLC shares made on 11 February 2016 (which vested on 11 February 2019), a grant of 5,423 of each NV and PLC shares made on 17 May 2017 (vesting on 16 February 2021), a grant of 12,408 of each NV and PLC shares made on 3 May 2018 (vesting on 16 February 2022), and 996 NV shares and 1,076 PLC shares from reinvested dividends accrued in prior years in respect of awards.
(d) Reflects reinvested dividend equivalents accrued during 2019 and subject to the same performance conditions as the underlying matching shares.(e) The 11 February 2016 grant vested on 11 February 2019 at 132% for both Alan Jope and Graeme Pitkethly. (f) This includes the additional shares earned and accrued dividends as result of a business performance multiplier on vesting above 100%.
Global Share Incentive Plan (Audited)The following conditional shares vested during 2019 or were outstanding at 31 December 2019 under the GSIP:
Balance of conditional
shares at January 2019 (a)
Balance of conditional shares
at 31 December 2019
Share type
No. of shares
Dividend shares accrued
during the year (d)
Vested in 2019(e)
Price at vesting
Additional shares earned
in 2019(f) No. of
shares
NV NY 12,038(b) 175 8,409 $54.73 2,038 5,842Alan Jope PLC ADR 12,048(b) 174 8,416 $54.00 2,041 5,847
NV 45,883(c) 866 23,413 €48.55 5,675 29,011
Graeme Pitkethly PLC 46,130(c) 870 23,615 £42.06 5,725 29,110
(a) In accordance with the remuneration policy adopted by shareholders in May 2018 no GSIP award has been granted after 2018.(b) This includes grants that were made to Alan Jope before his appointment as CEO as per 1 January 2019, being a grant of 5,851 of each NV NY and PLC ADR shares made on 11
February 2016 (which vested on 11 February 2019), a grant of 5,370 of each NV NY and PLC ADR shares made on 13 February 2017 (which vested on 13 February 2020), and 817 NV NY and 827 PLC ADR shares from reinvested dividends accrued in prior years in respect of awards.
(c) This includes a grant of 16,297 of each NV and PLC shares made on 11 February 2016 (which vested on 11 February 2019), a grant of 14,171 of each NV and PLC shares made on 13 February 2017 (which vested on 13 February 2020), a grant of 12,772 of each NV and PLC shares made on 16 February 2018 (vesting 17 February 2021), and 2,643 NV shares and 2,890 PLC shares from reinvested dividends accrued in prior years in respect of awards.
(d) Reflects reinvested dividend equivalents accrued during 2019, subject to the same performance conditions as the underlying GSIP shares.(e) The 11 February 2016 grant vested on 11 February 2019 at 132% for both Alan Jope and Graeme Pitkethly. In accordance with Unilever’s existing remuneration policy, Executive
Directors are able to choose whether they receive any shares due to vest under GSIP in PLC or NV shares or an equal number of shares in each. Alan Jope chose to receive NV shares. Therefore, upon vesting, his 11 February 2016 PLC ADR award was cancelled and converted and delivered to him as 8,511 NV NY shares (resulting in a total vesting for the 11 February grant of 16,920 NV NY shares). Graeme Pitkethly chose to receive PLC shares. Therefore, upon vesting, his 11 February 2016 NV award was cancelled and converted and delivered to him as 23,114 PLC shares, (resulting in a total vesting for the 11 February grant of 46,729 PLC shares).
(f) This includes the additional shares earned and accrued dividends as result of a business performance multiplier on vesting above 100%.
Executive Directors’ service contractsStarting dates of our Executive Directors’ service contracts:• Alan Jope: 1 January 2019 (signed on 5 March 2019); and• Graeme Pitkethly: 1 October 2015 (signed on 16 December 2015).
Service contracts are available to shareholders to view at the AGMs or on request from the Group Secretary, and can be terminated with 12 months’ notice from Unilever or six months’ notice from the Executive Director. A payment in lieu of notice can be made of no more than one year’s Fixed Pay and other benefits. Other payments that can be made to Executive Directors in the event of loss of office are disclosed in our remuneration policy which is available on our website.
www.unilever.com/remuneration-policy
Directors' remuneration report continued
Unilever Annual Report and Accounts 201970

Governance Report
Payments to former Directors (Audited)The table below shows the 2019 payments to Paul Polman in accordance with arrangements made with him upon his stepping down as CEO on 31 December 2018 and his retirement from employment with Unilever effective 2 July 2019. These arrangements were disclosed in the Director's remuneration report in the Unilever Annual Report and Accounts 2018.
Paul Polman (€’000)
Fixed Pay 859Other Benefits(a) 337Pension(b) 2,255GSIP 2017-2019 (pro-rated)(c) 3,368Total Remuneration(d) 6,819
(a) This includes tax preparation fees, medical, death & disability cover and social security.(b) Distribution of monies paid into a supplemental pension plan during 2010-2018 and associated investment return. The annual contributions were previously reported in the
2010-2018 DRRs.(c) Actual time pro-rated GSIP vesting (79%) on 13 February 2020 of 62,571 NV shares at a closing share price of €54.70.(d) The value of the GSIP 2017-2019 (pro-rated) awards calculated pursuant to Dutch law is €1,526 thousand. Total remuneration in accordance with Dutch law is €4,977 thousand.
These costs are non-cash costs and relate to the expenses recognised for the period following IFRS 2. This is based on share prices on grant dates and a 98% adjustment factor for these respective GSIP shares.
There have been no other payments to former Directors nor have there been any payments for loss of office during the year.
Implementation of the remuneration policy for Non-Executive DirectorsThe current Non-Executive Director fee levels will be changed for 2020, with an increase of £25,000 for the Chairman fee (4%) and an increase of £3,000 for the fee of the members of the Audit Committee (15%) and for the members of the Compensation Committee (20%). The basic Non-Executive Director fee remains unchanged. We will further review fee levels in the context of the remuneration policy renewal in 2021. The table below outlines the current fee structure with fees set in euros and paid 50% by each of NV (in euros) and PLC (in sterling) shown using an exchange rate of £1 = €1.2817 (rounded) for both years:
Roles and responsibilities 2020 Annual Fee € 2019 Annual Fee €
Basic Non-Executive Director Fee 108,949 108,949Chairman (all inclusive) 833,105 801,092Vice Chairman (modular) 51,270 51,270Member of Nominating and Corporate Governance Committee 19,226 19,226Member of Compensation Committee 23,071 19,226Member of Corporate Responsibility Committee 19,226 19,226Member of Audit Committee 29,479 25,635Chair of Nominating and Corporate Governance Committee 38,452 38,452Chair of Compensation Committee 38,452 38,452Chair of Corporate Responsibility Committee 38,452 38,452Chair of Audit Committee 51,270 51,270
All reasonable travel and other expenses incurred by Non-Executive Directors in the course of performing their duties are considered to be business expenses. Non-Executive Directors also receive expenses relating to the attendance of their spouse or partner, when they are invited by Unilever.
Single figure of remuneration in 2019 for Non-Executive Directors (Audited)The table below shows a single figure of remuneration for each of our Non-Executive Directors, for the years 2018 and 2019.
2019 2018
Non-Executive DirectorFees(a)
€’000Benefits(b)
€’000
Total remuneration
€’000Fees(a) €’000
Benefits(b) €’000
Total remuneration
€’000
Nils Andersen(c) 211 10 220 121 9 130 Laura Cha 121 – 121 115 – 115 Vittorio Colao(d) 139 33 172 127 – 127 Marijn Dekkers 673 35 708 744 13 757Ann Fudge(e) – – – 50 – 50 Judith Hartmann 127 19 146 121 7 128 Andrea Jung 121 – 121 80 – 80 Susan Kilsby(f) 53 – 53 – – – Mary Ma(g) 81 – 81 115 – 115 Strive Masiyiwa(h) 139 – 139 131 – 131 Youngme Moon(i) 169 – 169 147 – 147John Rishton(j) 151 16 168 143 – 143 Feike Sijbesma 139 – 139 135 – 135Total 2,124 113 2,237 2,029 29 2,058 (a) This includes fees received from NV in euros and PLC in sterling for 2018 and 2019 respectively. Includes basic Non-Executive Director fee and Committee chairmanship and/
or membership. Where relevant, amounts for 2018 have been translated into euros using the average exchange rate over 2018 (€1 = £0.8835). Amounts for 2019 have been translated into euros using the average exchange rate over 2019 (€1 = £0.8799).
(b) The only benefit received relates to travel by spouses or partners where they are invited by Unilever.(c) Chairman and Chair of the Nominating and Corporate Governance Committee as per November 2019.(d) Chair of the Compensation Committee.(e) Retired from the Boards at the May 2018 AGMs.(f) Appointed at the May 2019 AGMs, with appointment taking effect from 1 August 2019.(g) Passed away on 31 August 2019.(h) Chair of the Corporate Responsibility Committee.(i) Vice Chair and Senior Independent Director.(j) Chair of the Audit Committee.
We do not grant our Non-Executive Directors any personal loans or guarantees or any variable remuneration, nor are they entitled to any severance payments.
71Unilever Annual Report and Accounts 2019

Percentage change in remuneration of Non-Executive DirectorsThe table below shows the five-year history year-on-year percentage change for fees and other benefits for the current Non-Executive Directors.
Total Remuneration(a)
Non-Executive Director% change
from 2018 to 2019% change
from 2017 to 2018% change
from 2016 to 2017% change
from 2015 to 2016% change
from 2014 to 2015% change
from 2013 to 2014Nils Andersen 69.2% 16.1% -12.5% 62.0% – – Laura Cha 5.2% 7.5% -10.1% -2.5% 20.8% 62.9%Vittorio Colao 35.4% 23.3% -3.7% 87.7% – – Marijn Dekkers -6.5% 2.3% 42.6% – – – Judith Hartmann 14.1% 14.3% -8.2% 52.5% – – Andrea Jung 51.3% – – – – – Susan Kilsby – – – – – – Strive Masiyiwa 6.1% 18.0% 56.3% – – – Youngme Moon 15.0% 42.7% 45.1% – – – John Rishton 17.5% 12.6% -9.3% 5.3% 24.3% 62.1%Feike Sijbesma 3.0% 6.3% -3.8% 3.9% 693.8% – (a) Non-Executive Directors receive an annual fixed fee and do not receive any Company performance related payment. Therefore, the year-on-year % changes are mainly due
to changes in committee chair or memberships, mid-year appointments of Non-Executive Directors, fee increases as disclosed in earlier directors’ remuneration reports and changes in the average sterling: euro exchange rates. Marijn Dekkers stepped down as Chairman in November 2019, and was succeeded by Nils Andersen. Feike Sijbesma joined Unilever in November 2014 and therefore his change from 2014 to 2015 shows a larger % change than for a usual mid-year joiner.
Non-Executive Directors’ interests in shares (Audited)Non-Executive Directors are encouraged to build up a personal shareholding of at least 100% of their annual fees over the five years from appointment. The table shows the interests in NV and PLC ordinary shares of Non-Executive Directors and their connected persons as at 31 December 2019 against the minimum shareholding recommendation. There has been no change in these interests between 31 December 2019 and 20 February 2020 (other than Susan Kilsby, who bought 1,250 PLC shares on 20 February 2020 at a share price of £45.67).
Non-Executive Director Share typeShares held at
31 December 2019Actual share ownership as a % of NED fees
(as at 31 December 2019)
Nils Andersen(a) NV 21,014 134%
NV 2,660Laura Cha PLC 858 149%Vittorio Colao NV 5,600 206%Marijn Dekkers NV NY 20,000 152%Judith Hartmann NV 2,500 101%Andrea Jung NV 4,576 194%Susan Kilsby - - -
NV 860Mary Ma(b) PLC 1,860 173%Strive Masiyiwa PLC 1,130 42%Youngme Moon NV NY 3,500 106%
NV 3,340John Rishton PLC 2,000 181%Feike Sijbesma NV 10,000 369%
(a) The shareholding percentage has been measured against the annual all-inclusive Chairman fee for 2019, although Nils Andersen only became Chairman on 13 November 2019.(b) Shares held at 31 August 2019.
Non-Executive Directors’ letters of appointmentAll Non-Executive Directors were reappointed to the Boards at the 2019 AGMs, with the exception of Susan Kilsby (who was appointed for the first time, with her appointment taking effect on 1 August 2019).
Non-Executive DirectorDate first appointed
to the BoardsEffective date of
current appointment(a)
Nils Andersen 30 April 2015 2 May 2019Laura Cha 15 May 2013 2 May 2019Vittorio Colao 1 July 2015 2 May 2019Marijn Dekkers 21 April 2016 2 May 2019Judith Hartmann 30 April 2015 2 May 2019Andrea Jung 3 May 2018 2 May 2019Susan Kilsby 1 August 2019 1 August 2019Strive Masiyiwa 21 April 2016 2 May 2019Youngme Moon 21 April 2016 2 May 2019John Rishton 15 May 2013 2 May 2019Feike Sijbesma 1 November 2014 2 May 2019
(a) The unexpired term for all Non-Executive Directors’ letters of appointment is the period up to the 2020 AGMs, as they all, unless they are retiring, submit themselves for annual reappointment.
Directors' remuneration report continued
Unilever Annual Report and Accounts 201972

Governance Report
Other disclosures related to Directors’ remuneration (Unaudited)CEO single figure ten-year historyThe table below shows the ten-year history of the CEO single figure of total remuneration for UK purposes:
2010 2011 2012 2013 2014 2015 2016 2017 2018 2019
CEO Single figure of total remuneration (€‘000) 6,292 6,010 7,852 7,740 9,561 10,296 8,370 11,661 11,726 4,894
Annual bonus award rates against maximum opportunity 80% 68% 100% 78% 66% 92% 92% 100% 51% 55%
GSIP performance shares vesting rates against maximum opportunity 47% 44% 55% 64% 61% 49% 35% 74% 66% 60%
MCIP matching shares vesting rates against maximum opportunity n/a n/a n/a n/a 81% 65% 47% 99% 88% n/a
Share Matching Plan shares vesting rates against maximum opportunity(a) 100% n/a n/a n/a n/a n/a n/a n/a n/a n/a
(a) Shown in year of award.
Unilever regularly looks at pay ratios throughout the company, and the pay ratio between each work level, and we have disclosed this for a number of years. The table below provides a detailed breakdown of the fixed and variable pay elements for each of our UK and Dutch work levels, showing how each work level compares to the CEO and CFO in 2019 (with equivalent figures from 2018 included for comparison purposes).
WL1
WL2
WL3
€0m €2m €4m €12m
2019 Fixed 2019 Variable
CEO = 100.2 x WL1 | CFO = 88.0 x WL1
CEO/CFO Pay Ratio Comparison (split by fixed/variable pay)
€8m€7m€6m€5m€3m€1m
WL4
WL5
CFO
CEO
€9m €11m€10m
2018 Fixed 2018 Variable
CEO = 142.0 x WL2 | CFO = 61.0 x WL2CEO = 58.4 x WL2 | CFO = 51.3 x WL2
CEO = 48.5 WL3 | CFO = 20.8 x WL3CEO = 23.0 x WL3 | CFO = 20.2 x WL3
WL6
CEO = 22.8 x WL4 | CFO = 9.8 x WL4CEO = 10.9 x WL4 | CFO = 9.6 x WL4
CEO = 7.5 x WL5 | CFO = 3.2 x WL5CEO = 3.9 x WL5 | CFO = 3.5 x WL5
CEO = 3.8 x WL6 | CFO = 1.6 x WL6CEO = 2.0 x WL6 | CFO = 1.7 x WL6
CEO = 2.3 x CFO CEO = 1.1 x CFO
CEO = 264.8 x WL1 | CFO = 113.8 x WL1
Figures for the CEO and CFO are calculated using the data for UK purposes from the Executive Directors’ single figure table on page 66. Accordingly, the year-on-year comparison reflects the appointment of Alan Jope as CEO in 2019 following Paul Polman’s retirement at the end of 2018. The 2019 numbers reflect that Alan Jope's Fixed Pay was set at a lower level than Paul Polman's. The numbers are further impacted by fluctuation in the exchange rates used to convert pay elements denominated in pounds sterling to euros for reporting purposes in 2018. From 2019 the CEO and CFO pay elements are paid in euros. Where relevant, amounts for 2018 have been translated using the average exchange rate over 2018 (€1 = £0.8835), and amounts for 2019 have been translated using the average exchange rate over 2019 (€1 = £0.8799).
Annual bonus and long-term incentives (GSIP and MCIP) for the UK and Dutch employees were not calculated following the statutory method for single-figure pay. Instead, variable pay figures were calculated using:• target annual bonus values for the respective year (so disregarding personal performance multipliers, which equal out across the population as a whole);• target GSIP values for the respective year; and• MCIP values calculated at an appropriate average for the relevant Work Level of employees, i.e. an average 45% investment of bonus for WL3
employees; 60% for WL4-5 employees; and 100% for WL6 employees.Fixed pay figures reflect all elements of pay (including allowances) and benefits paid in cash.
73Unilever Annual Report and Accounts 2019

CEO pay ratio comparisonThe table below is included to meet UK requirements and shows how pay for the CEO compares to our UK employees at the 25th percentile, median and 75th percentile.
Year 25th PercentileMedian
Percentile 75th Percentile Mean Pay Ratio
Year ended 31 December 2019 Salary: £38,510 £45,154 £59,988Pay and benefits: £50,689 £61,086 £87,982Pay ratio (Option A): 83 69 48 51
Year ended 31 December 2018 Salary: £28,804 £37,000 £50,021Pay and benefits (excluding pension): £34,400 £41,443 £57,800Pay ratio (Option A): 301 250 179 147
Figures for the CEO are calculated using the data from the Executive Directors’ single figure table on page 66 translated into sterling using the average exchange rate over 2019 (€1 = £0.8799).
Option A was used to calculate the pay and benefits (including pension) of the 25th percentile, median and 75th percentile UK employees because the data was readily available for all UK employees of the group and Option A is the most accurate method (as it is based on total full-time equivalent total reward for all UK employees for the relevant financial year). Figures are calculated by reference to 31 December 2019, and the respective salary and pay and benefits figures for each quartile are set out in the table above. Full-time equivalent figures are calculated on a pro-rated basis.
Variable pay figures for the UK employees are calculated on the basis set out in the paragraph for other work levels below the ‘CEO/CFO Pay Ratio Comparison’ table. The reason for this is it would be unduly onerous to recalculate these figures when, based on a sample, the impact of such recalculation is expected to be minimal.
Year-on-year comparisons reflects the appointment of Alan Jope as CEO in 2019 following Paul Polman’s retirement at the end of 2018 and as a result the CEO pay ratio has decreased from 2018 to 2019 since Alan Jope’s Fixed Pay was set at a level lower than Paul Polman’s. For the overall UK employee calculation pay and benefit values have increased by approximately 20% due to inclusion of the pension in 2019. Salary for the UK employees has increased minimally because of the change in the New Reward Framework for the WL3s, despite the fact that the workforce in numbers decreased by 3.8% from 2018 to 2019.
Additionally, in the UK and The Netherlands we are now required to show additional disclosures on the rates of change in pay year on year. The pay ratios set out above are more meaningful as they compare to the pay of all of our UK employees. By contrast, the UK regulations require us to show the percentages below based on employees of our PLC top company only, which forms a relatively small proportion of our total UK workforce. So, whilst operationally we may pay greater attention to our internal pay ratios (included above in the 'CEO/CFO pay ratio comparison' table), these new required figures are as follows:
Percentage change in remuneration of Executive Directors (CEO/CFO) for UK purposes The table below shows the five-year history year-on-year percentage change for Fixed Pay, other benefits (excluding pension) and bonus for the CEO, CFO and PLC’s employees (based on total full-time equivalent total reward for the relevant financial year) pursuant to UK requirements. The respective changes in percentages in fees for our Non-Executive Directors are included in the table 'Percentage change in remuneration of Non-Executive Directors' on page 72.
Fixed Pay Other benefits (not including pension)
Bonus
% change from 2018 to 2019CEO(a)(b) -9.5% -92.3% -7.4%CFO(a) 4.2% 4.8% 7.9%PLC employees(d) 15.0% -5.2% 9.7%% change from 2017 to 2018CEO(a) 11.3% -19.2% -16.5%CFO(a) 8.2% 8.3% -10.5%PLC employees(d) 8.4% -5.0% -3.9%% change from 2016 to 2017CEO(a) -6.9% 5.0% 0.8%CFO(a) -2.2% -5.5% 21.1%PLC employees(d) -6.8% -7.0% 14.5%% change from 2015 to 2016CEO(a) -11.0% -5.1% -11.0%CFO(a)(c) -30.8% -32.2% 14.3%PLC employees(d) 10.1% 19.1% 16.6%% change from 2014 to 2015CEO(a) 11.3% 14.5% 55.8%CFO(a) -16.6% -27.6% 4.4%PLC employees(d) 0.3% 20.7% 79.0%% change from 2013 to 2014CEO(a) 5.2% 12.4% -11.4%CFO(a)(c) 5.2% -36.5% -11.5%PLC employees(d) - - -(a) Calculated using the data for UK purposes from the Executive Directors’ single figure table on page 66 (for information on exchange rates please see the footnotes in that table). (b) As at 1 January 2019 Alan Jope succeeded Paul Polman as CEO and therefore the CEO remuneration from 2018 to 2019 decreased compared to prior years as Alan Jope's Fixed
Pay was set at a level lower than Paul Polman's. (c) As at October 2015 Jean-Marc Huet stepped down as CFO and therefore the figures only include ten months for 2015. Graeme Pitkethly succeeded Jean-Marc Huet as an
Executive Director as per 21 April 2016, although he assumed the role of CFO as from October 2015. As a result the figure for 2016 include payments from May 2016 onwards. The CFO remuneration from 2015 to 2016 therefore decreased, which was also due to Graeme Pitkethly's Fixed Pay being set at a level lower than Jean-Marc Huet's. In 2013 the CFO received a one-off payment for the loss and costs on the sale of his house, as agreed upon his recruitment. Consequently, ‘other benefits' decreased from 2014 to 2013.
(d) For the PLC employees, Fixed Pay numbers have been restated to include cash-related benefits employees receive as part of their total compensation, to ensure we can accurately compare Fixed Pay for them against that of the CEO and CFO. Figures are also affected by changes in the average sterling: euro exchange rates. For this group of people no figures are available for the years prior to 2014.
Directors' remuneration report continued
Unilever Annual Report and Accounts 201974

Governance Report
Percentage change in remuneration of Executive Directors (CEO/CFO), average total compensation for an employee, CEO and CFO pay ratios and performance of the company for Dutch purposesThe table below shows the five-year history year-on-year percentage change in remuneration for the CEO, CFO and the average total compensation for an employee of the Group (based on total staff costs for the relevant financial year) pursuant to Dutch requirements. The respective change in percentages in fees for our Non-Executive Directors are included in the table 'Percentage change in remuneration of Non-Executive Directors' on page 72.
Average total compensation for an employee
per FTE(c)% change vs
previous year
% change vs previous year for the CEO(a)
% change vs previous year for the CFO(b)
CEO/Average compensation per employee
mean pay ratio(d)
CFO/Average compensation per employee
mean pay ratio(d)
Underlying Sales Growth
(USG)(e)
Underlying Earnings
per Share (EPS)(e)
Underlying Operating
Margin (UOM)(e)
2019 -48% -3% €41,711 1% 108 90 2.9% 2.55 19.1%2018 -26% -10% €41,389 2% 209 93 3.2% 2.35 18.6%2017 51%(f) 88%(f) €40,582 5% 287 106 2.8% 2.23 17.7%2016 -7% -4% €38,538 1% 200 60 3.6% 2.03 16.4%2015 3% -44% €38,271 10% 217 63 4.1% 1.93 15.6%2014 1% -14% €34,923 -2% 230 123 2.9% 1.73 15.5%(a) Calculated using the data for Dutch purposes from the Executive Directors’ single figure table on page 66 (for information on exchange rates please see the footnotes in that
table). As at 1 January 2019 Alan Jope succeeded Paul Polman as CEO and therefore the CEO remuneration from 2018 to 2019 decreased compared to prior years as Alan Jope's Fixed Pay was set at a level lower than Paul Polman's. The change from 2017 to 2018 is due to a lower MCIP and GSIP performance ratio comparing to the previous year.
(b) Calculated using the data for Dutch purposes from the Executive Directors’ single figure table on page 66 (for information on exchange rates please see the footnotes in that table). As at October 2015 Jean-Marc Huet stepped down as CFO and therefore the figures only include ten months for 2015. Graeme Pitkethly succeeded Jean-Marc Huet as an Executive Director as per 21 April 2016, although he assumed the role of CFO as from October 2015. As a result the figure for 2016 include payments from May 2016 onwards. The CFO remuneration from 2015 to 2016 therefore decreased, which was also due to Graeme Pitkethly's Fixed Pay being set at a level lower than Jean-Marc Huet's.
(c) Calculated using the total staff costs (minus the CEO and CFO remuneration pursuant to Dutch requirements as included in the Executive Directors’ single figure tables) divided by the average number of employees during the year, using the data from Staff and Management costs from note 4A on page 97.
(d) Calculated using the data for Dutch purposes from the Executive Directors’ single figure table on page 66 divided by the average total compensation per FTE number in this table for the respective year.
(e) USG and UOM are relevant performance measures for both our bonus and long-term incentive plans and Underlying EPS is a relevant performance measure since 2017 when we introduced it for MCIP. In 2019 the definition of USG has changed and currently includes a normalised level of price growth, which will be capped at an annual rate that is equivalent to approximately 2% per month compounded. As result of this new definition USG figures for 2016, 2017 and 2018 have been restated compared to previous disclosures.
(f) The CEO and CFO % change from 2016 to 2017 is due to a higher MCIP and GSIP performance ratio compared to the previous years. The year-on-year changes in pay for the average compensation for an employee (FTE) are proportionally smaller than for the CEO and CFO. The CEO and CFO have the highest proportion of variable pay as they have the highest levels of responsibility. The key difference in pay between colleagues at different work levels is quantum; the higher the work level, the greater the value of each element. Also, with successive work levels, the greater the proportion of the total package that is performance related, rather than fixed.
Relative importance of spend on pay The chart below shows the relative spend on pay compared with dividends paid to Unilever shareholders and underlying earnings. Underlying earnings represent the underlying profit attributable to Unilever shareholders and provides a good reference point to compare spend on pay. The chart below shows the percentage of movement in underlying earnings, dividends and total staff costs versus the previous year.
Underlying earnings
€0m €1,000m €2,000m €3,000m €4,000m €5,000m €7,000m
2019 2018 Restated
5.4%
-2.5%
3.5%
Relative importance of spend on pay
€6,000m
Dividends recognised
during the year
Totalstaff costs
0.8%
-2.4%
4.2%
In calculating underlying profit attributable to shareholders, net profit attributable to shareholders is adjusted to eliminate the post-tax impact of non-underlying items in operating profit and any other significant unusual terms within net profit but not operating profit (see note 7 on page 107 for details). Restated 2018 data has been used following the adoption of IFRS 16, see note 1 and note 24 (on pages 92 and 138 respectively) for further details.
75Unilever Annual Report and Accounts 2019
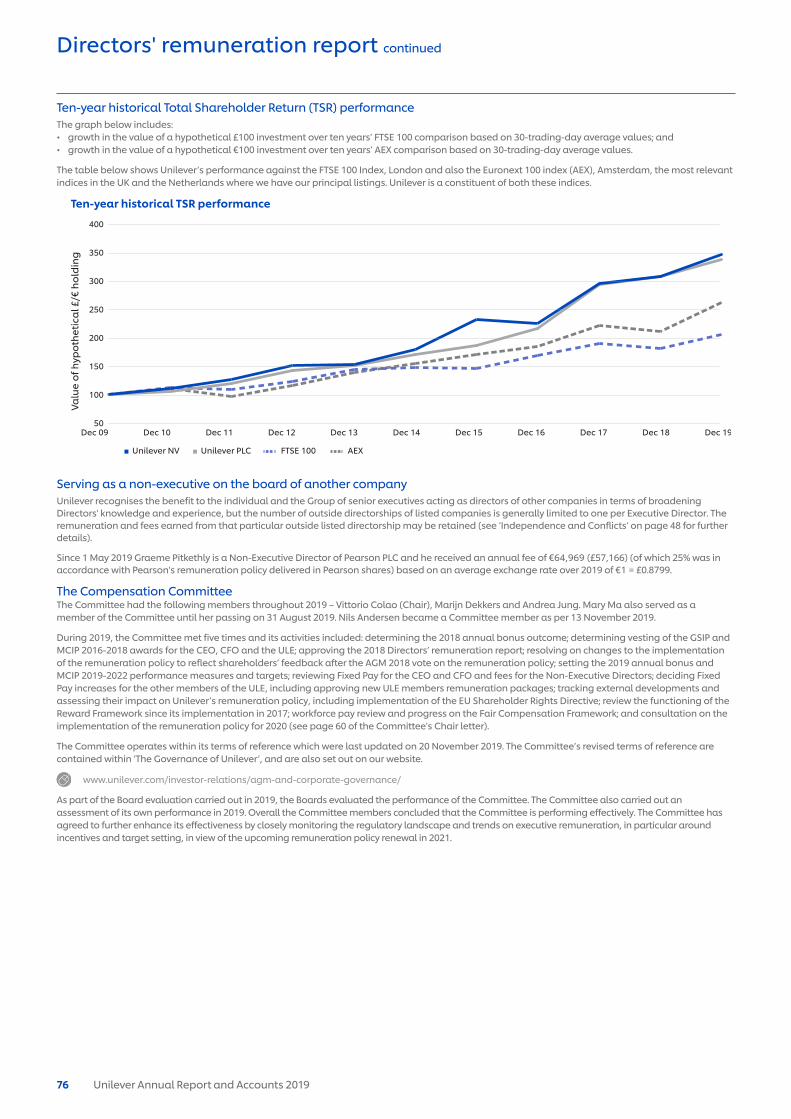
Ten-year historical Total Shareholder Return (TSR) performanceThe graph below includes:• growth in the value of a hypothetical £100 investment over ten years’ FTSE 100 comparison based on 30-trading-day average values; and• growth in the value of a hypothetical €100 investment over ten years’ AEX comparison based on 30-trading-day average values.
The table below shows Unilever’s performance against the FTSE 100 Index, London and also the Euronext 100 index (AEX), Amsterdam, the most relevant indices in the UK and the Netherlands where we have our principal listings. Unilever is a constituent of both these indices.
Valu
e of
hyp
othe
tica
l £/€
hol
din
g
Dec 09 Dec 10 Dec 11 Dec 12 Dec 13 Dec 14 Dec 16
Ten-year historical TSR performance
Dec 15 Dec 17
Unilever NV Unilever PLC FTSE 100 AEX
Dec 19
400
250
200
150
100
50
300
350
Dec 18
Serving as a non-executive on the board of another companyUnilever recognises the benefit to the individual and the Group of senior executives acting as directors of other companies in terms of broadening Directors' knowledge and experience, but the number of outside directorships of listed companies is generally limited to one per Executive Director. The remuneration and fees earned from that particular outside listed directorship may be retained (see ‘Independence and Conflicts’ on page 48 for further details).
Since 1 May 2019 Graeme Pitkethly is a Non-Executive Director of Pearson PLC and he received an annual fee of €64,969 (£57,166) (of which 25% was in accordance with Pearson's remuneration policy delivered in Pearson shares) based on an average exchange rate over 2019 of €1 = £0.8799.
The Compensation CommitteeThe Committee had the following members throughout 2019 – Vittorio Colao (Chair), Marijn Dekkers and Andrea Jung. Mary Ma also served as a member of the Committee until her passing on 31 August 2019. Nils Andersen became a Committee member as per 13 November 2019.
During 2019, the Committee met five times and its activities included: determining the 2018 annual bonus outcome; determining vesting of the GSIP and MCIP 2016-2018 awards for the CEO, CFO and the ULE; approving the 2018 Directors’ remuneration report; resolving on changes to the implementation of the remuneration policy to reflect shareholders’ feedback after the AGM 2018 vote on the remuneration policy; setting the 2019 annual bonus and MCIP 2019-2022 performance measures and targets; reviewing Fixed Pay for the CEO and CFO and fees for the Non-Executive Directors; deciding Fixed Pay increases for the other members of the ULE, including approving new ULE members remuneration packages; tracking external developments and assessing their impact on Unilever’s remuneration policy, including implementation of the EU Shareholder Rights Directive; review the functioning of the Reward Framework since its implementation in 2017; workforce pay review and progress on the Fair Compensation Framework; and consultation on the implementation of the remuneration policy for 2020 (see page 60 of the Committee's Chair letter).
The Committee operates within its terms of reference which were last updated on 20 November 2019. The Committee’s revised terms of reference are contained within ‘The Governance of Unilever’, and are also set out on our website.
www.unilever.com/investor-relations/agm-and-corporate-governance/
As part of the Board evaluation carried out in 2019, the Boards evaluated the performance of the Committee. The Committee also carried out an assessment of its own performance in 2019. Overall the Committee members concluded that the Committee is performing effectively. The Committee has agreed to further enhance its effectiveness by closely monitoring the regulatory landscape and trends on executive remuneration, in particular around incentives and target setting, in view of the upcoming remuneration policy renewal in 2021.
Directors' remuneration report continued
Unilever Annual Report and Accounts 201976

Governance Report
AdvisersWhile it is the Committee’s responsibility to exercise independent judgement, the Committee does request advice from management and professional advisers, as appropriate, to ensure that its decisions are fully informed given the internal and external environment.
Tom Gosling of PricewaterhouseCoopers (PwC) provided the Committee with independent advice on various matters it considered. During 2019, the wider PwC firm has also provided tax and consultancy services to Unilever including tax compliance, transfer pricing, other tax related services, managed legal services, internal audit advice and secondees, third-party risk and compliance advice, cyber security advice, sustainability assurance and consulting and merger and acquisition support. PwC is a member of the Remuneration Consultants Group and, as such, voluntarily operates under the code of conduct in relation to executive remuneration consulting in the UK, which is available online.
www.remunerationconsultantsgroup.com (Code of Conduct: Executive Remuneration Consulting)
The Committee is satisfied that the PwC engagement partner and team, which provide remuneration advice to the Committee, do not have connections with NV or PLC that might impair their independence. The Committee reviewed the potential for conflicts of interest and judged that there were appropriate safeguards against such conflicts. The fees paid to PwC in relation to advice provided to the Committee in the year to 31 December 2019 were £112,700. This figure is calculated based on time spent and expenses incurred for the majority of advice provided, but on occasion for specific projects a fixed fee may be agreed.
During the year, the Committee also sought input from the CEO (Alan Jope), the Chief Human Resources Officer (Leena Nair) and the EVP Global Head of Reward (Peter Newhouse) on various subjects including the remuneration of senior management. No individual Executive Director was present when their own remuneration was being determined to ensure a conflict of interest did not arise, although the Committee has separately sought and obtained Executive Directors’ own views when determining the amount and structure of their remuneration before recommending individual packages to the Boards for approval. The Committee also received legal and governance advice from the Chief Legal Officer and Group Secretary (Ritva Sotamaa) and the Chief Counsel Employment & Remuneration (Margot Fransen).
Shareholder votingUnilever remains committed to ongoing shareholder dialogue and takes an active interest in voting outcomes. In the event of a substantial vote against a resolution in relation to Directors’ remuneration, Unilever would seek to understand the reasons for any such vote and would set out in the following Annual Report and Accounts any actions in response to it. The following table sets out actual voting in respect of our previous report:
Voting outcome (% of votes) For Against Withheld
2018 Directors’ remuneration report (2019 AGM) (excluding the Directors’ remuneration policy) PLC 95.62% 4.38% 10,581,9222018 Directors’ remuneration report (2019 AGM) (excluding the Directors’ remuneration policy) NV 96.92% 3.08% 1,316,4552017 Directors’ remuneration policy (2018 AGM) PLC 64.19% 35.81% 38,734,8682017 Directors’ remuneration policy (2018 AGM) NV 73.06% 26.94% 15,018,135
The Directors’ remuneration report has been approved by the Boards, and signed on their behalf by Ritva Sotamaa, Chief Legal Officer and Group Secretary.
77Unilever Annual Report and Accounts 2019