Unifying Phenotypes to Support Semantic...
12
Unifying Phenotypes to Support Semantic Descriptions Eduardo Miranda 1 , Andr´ e Santanch` e 1 1 Institute of Computing – State University of Campinas Av. Albert Einstein, 1251 – Cidade Universit´ aria, Campinas, Brazil [email protected], [email protected] Abstract. In life sciences, there are several biological datasets shared through the web. All this abundance of data carries a great opportunity to explore com- plex relationships among the diversity of species. However, their physical for- mat varies from independent data files to databases, which are heterogeneous in model and representation, hampering their integration. Ontologies are one of the promising choices to address this challenge. However, the existing dig- ital phenotypic descriptions are stored in semi-structured formats, making ex- tensive use of natural language. If on one hand, this patrimony is highly rel- evant, on the other hand, converting it in ontologies is not a straightforward task. The present article addresses this problem adding an intermediate step between semi-structured phenotypic descriptions and ontologies. It remodels semi-structured descriptions to a graph abstraction in which the data are linked. Graph transformations subsidize the transition from semi-structured data rep- resentation to a more formalized representation through ontologies. 1. Introduction Bioinformatics is the science of integrating, managing, mining and interpreting informa- tion from biological data [Gibas and Jambeck 2001]. In the life science field, there are a large number of distributed biological datasets freely available and ready to use. However, this wealth of information has hardly been tapped even today due its distributed nature, heterogeneity and complex data types and representation [Parr et al. 2012]. In this sce- nario, their combination and interconnection are barely feasible [Quan 2007]. A massive amount of relevant information is hidden in the potential connection of unrelated files. In this work we are interested in a specific biology context, in which biologists apply computational tools to build and share digital descriptions of living beings as phe- notypes. These descriptions are a fundamental starting point for several biology tasks, like living beings identification and tools for phylogenetic tree analysis. Even though the last generation of these tools is based on open standards (e.g., XML), the descriptions are still based on textual sentences in natural language [Balhoff et al. 2010]. Semantic integration in this context is one of the main challenges. Besides on- tologies to support phenotype description, there are tools to annotate descriptions by as- sociating ontology concepts to textual descriptions [Balhoff et al. 2010]. This distinction between description and their annotations based on ontologies does not consider that de- scriptions can conversely contribute to ontology expansion and revision. The challenge in this work is to establish a model to represent a common denominator among phenotipical description standards, which will support findings in the latent semantics implicit in re- lations in a strategy inspired by folksonomies. These semantics can guide the interaction between textual descriptions and ontologies. 154
Transcript of Unifying Phenotypes to Support Semantic...

Unifying Phenotypes to Support Semantic DescriptionsEduardo Miranda 1, Andre Santanche 1
1Institute of Computing – State University of CampinasAv. Albert Einstein, 1251 – Cidade Universitaria, Campinas, Brazil
[email protected], [email protected]
Abstract. In life sciences, there are several biological datasets shared throughthe web. All this abundance of data carries a great opportunity to explore com-plex relationships among the diversity of species. However, their physical for-mat varies from independent data files to databases, which are heterogeneousin model and representation, hampering their integration. Ontologies are oneof the promising choices to address this challenge. However, the existing dig-ital phenotypic descriptions are stored in semi-structured formats, making ex-tensive use of natural language. If on one hand, this patrimony is highly rel-evant, on the other hand, converting it in ontologies is not a straightforwardtask. The present article addresses this problem adding an intermediate stepbetween semi-structured phenotypic descriptions and ontologies. It remodelssemi-structured descriptions to a graph abstraction in which the data are linked.Graph transformations subsidize the transition from semi-structured data rep-resentation to a more formalized representation through ontologies.
1. IntroductionBioinformatics is the science of integrating, managing, mining and interpreting informa-tion from biological data [Gibas and Jambeck 2001]. In the life science field, there are alarge number of distributed biological datasets freely available and ready to use. However,this wealth of information has hardly been tapped even today due its distributed nature,heterogeneity and complex data types and representation [Parr et al. 2012]. In this sce-nario, their combination and interconnection are barely feasible [Quan 2007]. A massiveamount of relevant information is hidden in the potential connection of unrelated files.
In this work we are interested in a specific biology context, in which biologistsapply computational tools to build and share digital descriptions of living beings as phe-notypes. These descriptions are a fundamental starting point for several biology tasks,like living beings identification and tools for phylogenetic tree analysis. Even though thelast generation of these tools is based on open standards (e.g., XML), the descriptions arestill based on textual sentences in natural language [Balhoff et al. 2010].
Semantic integration in this context is one of the main challenges. Besides on-tologies to support phenotype description, there are tools to annotate descriptions by as-sociating ontology concepts to textual descriptions [Balhoff et al. 2010]. This distinctionbetween description and their annotations based on ontologies does not consider that de-scriptions can conversely contribute to ontology expansion and revision. The challenge inthis work is to establish a model to represent a common denominator among phenotipicaldescription standards, which will support findings in the latent semantics implicit in re-lations in a strategy inspired by folksonomies. These semantics can guide the interactionbetween textual descriptions and ontologies.
154

In a previous work [Alves and Santanche 2013], we showed that the latent seman-tics presented in tags and their correlations, as a product of an organic work collectivelyproduced by a community on the web (the folksonomies), can be exploited to expand andreview ontologies. While the model behind folksonomies is based on the correlation ofthree elements – tags, resources and users – descriptions in the biological context presenta more complex and specialized structures. Co-occurrence is a strong principle we con-sidered to extract latent semantics. The main idea is that the set of tags put together in agiven resource can provide a “context” to interpret each tag. Consider a tag cell, whichcan have a distinct interpretation according to the context. The co-occurrence with thetags cytoplasm or organelle will put it in the biology context. Moreover, the compilationof data concerning the occurrence and co-occurrence of millions of tags can support theanalysis of similarity among terms – see more details in [Alves and Santanche 2013]. Weconsider that we can apply an equivalent technique to put terms of phenotype descriptionsin a context, to improve their interpretation and correlation.
The present paper addresses this problem in exploiting existing biology assetsrelated to phenotypic descriptions, and the latent semantics resulting from their intercon-nection, to support their development towards a richer semantical representation, as partof ontologies. It implies promoting relations among concepts to first class citizens. Ac-cordingly, we designed a three layered method illustrated in Figure 1, in which graphdatabases intermediate this evolvement process from fragmentary data sources to accom-plish full integration descriptions as ontologies.
Our approach remodels semi-structured descriptions to a graph abstraction, inwhich the data can be integrated more easily. Graph transformations are applied for thetransition from a semi-structured data representation to a more formalized representa-tion through ontologies. As we will further explain, this graph representation will alsosupport an analytical tool to compare data across studies, wherein it will help evolution-ary biologists to answer evolutionary questions. This paper presents a work in progressconcerning the first step of this method, focusing in the integration of data from the semi-structured data layer and their transition to the graph data abstraction layer. Our proposedgraph-based model is derived from a comparative analysis among four standards relatedto phenotype description, plus a practical experiment.
Ontology concepts
Semi-structured data
Graph data abstraction
Figure 1. Three layers method diagram.
155

This paper is organized as follows: Section 2 summarizes the related work; Sec-tion 3 presents the comparative analysis which subsidizes our minimal common denom-inator model; Section 4 presents out graph-based model; Section 5 shows a practicalexperiment of unifying phenotypes; Section 6 presents concluding remarks.
2. Related WorkIntegration is a key point as humans are progressively unable of handling the sheer volumeof data presented [Bell et al. 2009]. It is an important step towards knowledge discovery[Lenzerini 2002]. The integration of digital phenotype descriptions is a relevant challengein this context since they support fundamental biology tasks as the building of identifica-tion keys for living beings and can support the creation of a complete evolutionary Tree ofLife [Parr et al. 2012] assembling genomic and morphological data so as to congregate thephylogenetic relationships among all living or extinct organisms [Ciccarelli et al. 2006].Likewise, integrating these data may contribute to better understanding of how a morpho-logical trait became organized and evolved over time [Mabee 2006].
Recent approaches enrich descriptions via ontology annotations, using theEntity-Quality (EQ) formalism for phenotype modeling. EQ is a representation[Balhoff et al. 2010] which associates ontology entity terms (E) – e.g., bone or vertebrafrom Teleost Anatomy Ontology (TAO) – with quality terms (Q) – e.g., triangular, hori-zontal, smooth from the Phenotype and Trait Ontology (PATO) [Dahdul et al. 2010]. On-tologies have gained wide acceptance in biology due to their ability of representing knowl-edge and also the advantage of querying and reasoning information [Gkoutos et al. 2004].Furthermore, semantic web standards to represent ontology concepts with unique identi-fiers facilitates interoperability across databases [Mabee et al. 2007]. Recently, severaltools have emerged to support annotation of biological phenotypes using ontologies,e.g., Phenex (http://phenoscape.org/wiki/Phenex) and Phenote (http://www.phenote.org/ ),both curation tools designed for annotation of phenotypic characters with ontology con-cepts using EQ formalism [Balhoff et al. 2010].
[Dahdul et al. 2010] developed a workflow for curation of phenotypic charactersextracted from scientific publications. It is important to note the limitations of this cura-tion process, considering that it is very time-consuming since it is manually carried outby domain experts.
3. Common DenominatorThere is a wide variety of representation formats for phenotype description, adopted byinformation systems and open standards, which represent differently the same informa-tion. In this section, we analyze four of them – Xper2, SDD, Nexus and NeXML – lookingfor a minimal common denominator, which is the foundation for our graph-based model,to be used to link related information.
SDD, Nexus and NeXML are widely adopted open standards further detailed.Xper2 (http://lis-upmc.snv.jussieu.fr/lis/ ) is a management system adopted by the system-atist community, for the storing, editing and analyzing of phenotype descriptive data. Itfocuses mainly on taxonomic descriptions, allowing creation, sharing and comparisonof identification keys [Ung et al. 2010a, Ung et al. 2010b]. Xper2 was developed in theLaboratoire Informatique & Systematique of the University Pierre et Marie Curie and
156

this work is part of a bigger project in collaboration with this lab. Therefore, Xper2 wasadopted for our practical experiments.
In order to illustrate our analysis, let us consider a practical case, in which a biol-ogist is building a phenotype description of monitor lizards (genus Varanus). The processstarts with the biologist collecting observations of lizards, organized as characters andcharacter states (C, CS). [Pimentcl and Riggins 1987] defined character as “a feature oforganisms that can be evaluated as a variable with two or more mutually exclusive andordered states”. The observations involved the species Varanus albiguralis and Varanusbrevicauda. The final result is the character-by-taxon matrix illustrated in Figure 2.
nost
rils
' for
m
tran
sver
sal
sect
ion
of th
e ta
il
nuch
al s
cale
s
Varanus albiguralis 2 1 2
Varanus brevicauda 1 2 1
Nostrils' form 1 – well round 2 – oval or split-like Transversal section of the tail 1 – laterally compressed 2 – roundish Nuchal scales 1 – same size than head scales 2 – bigger than head scales
Figure 2. Character-by-taxon matrix
In order to transform these observations to digital records and generalize them –e.g., devising general characters and states observed in a genre of monitor lizards – thebiologist will use a tool like Xper2. Phenotypes descriptions can be stored in the Xper2
native format or can be exported to the SDD open format. The Structure Descriptive Data(SDD) (http://wiki.tdwg.org/SDD) is a platform and application-independent XML-basedstandard developed by the Biodiversity Information Standards (historic acronym: TDWG)for recording and exchanging descriptions of biological and biodiversity data of any type[Hagedorn 2007]. SDD is adopted by several other phenotype description tools – e.g.,Lucid Central (http://www.lucidcentral.org) and Linnaeus II (http://www.eti.uva.nl/ ).
We further introduce some key elements of the SDD format, which are recurrentin the formats confronted in this section. A SDD description comprises, in a single file,a domain schema and its instances. Figure 3 shows a diagram with a fragment of a SDDfile containing the description of a varanus lizard. A (C,CS) description in SDD has twomain blocks: (i) defines the characters involved and their possible states – Figure 3 top;(ii) describes an Operational Taxonomic Unit (OTU) using the characters defined in (i) –Figure 3 bottom. OTU is a biology term which refers to a given entity in sampling leveladopted to the study – e.g., a specimen, a gender etc.
<CategoricalCharacter>s and their <States> (shown in Figure 3 top) are prim-itives to describe an OTU [Hagedorn 2007]. Each <CategoricalCharacter> has its<Representation> – comprising a label and a description as plain texts – and a set of<StateDefinition> elements with their possible states. <CategoricalCharacter> and<StateDefinition> elements defined here will be referred throughout the XML documentby their ids.
The <CodedDescription> (Figure 3 bottom) links the OTU being describedto States of each <CategoricalCharacter>. It has two essential items: (i) the OTU
157

CategoricalCharacter id=“c6”
States StateDefinition id=“s12”
“well round”
“Nostrils look like a quite per...”
Label
Detail
StateDefinition id=“s13”
“oval or split-like”
“Nostrils are not perfectly rou...”
Label
Detail
“nostrils' form”
“Monitors' nostrils may have different forms...”
Label
Detail Representation
Dataset
Datasets
“V. albiguralis”
“White-throated monitor. Distribution: Africa (West...”
Label
Detail Representation
CodedDescription id=“D1”
SummaryData Categorical
ref=“c6”
State ref=“s13”
Figure 3. Fragment of SDD Schema with Instances 1
being described, where its name and description are listed in natural language under<Representation>; (ii) a set of character and values (<Categorical> and <State>),which address the characters defined in the previous section through the ref attribute.It is possible and usual to define multiple states for a character of a given OTU. A firstintegration, problem observed here is that each character or OTU described does not havea global unique identification among documents. Therefore, the description can only beused by the document where it was declared and it is not possible to guarantee the equiv-alence of two or more <CategoricalCharacters>.
In Figure 5 we expand our analysis to the Xper2 native format, Nexus and NeXML.Our study addresses mainly morphological character descriptions. Figure 5 provides sim-plified diagrams focusing on the elements to record descriptions, which will be confrontedhere. Figure 4 presents the symbols adopted in the diagram. All the formats adopt XMLand the symbols represent the relations among elements and their respective cardinality.Five types of elements, which are focus of our analysis, receive special symbols: theEntity being described, which can be a taxon or a specimen; the Character defini-tion and its respective association with entities (Character instance); the Statedefinition and its respective association with entities (State instance).
Nexus [Maddison et al. 1997] is an extensively used file format developed for stor-age and exchange of phylogenetic data, including morphological and molecular charac-ters, taxa distances, genetic codes, phylogenetic trees etc. It was designed in 1987 and it isstill used by many popular software as Xper2 (http://lis-upmc.snv.jussieu.fr/lis/ ), Mesquite(http://mesquiteproject.org/ ), MrBayes (http://mrbayes.sourceforge.net/ ) and data repos-itories, like TreeBASE(http://treebase.org/ ) and Dryad (http://datadryad.org/ ). Nexusgathers together (C,CS) based descriptions and related trees [Vos et al. 2012].
1Knowledge base of the genus Varanus from http://lis-upmc.snv.jussieu.fr/xper2/infosXper2Bases/liste-bases-recherche.php
158

one to one one to one (zero or one)
one to many (zero or more)
one to many (one or more)
exclusive option
structural element
Relationship types Element types
Character State Character Instance Entity State Instance
Structural element specializations
Figure 4. Symbols and semantic used in the diagrams
NeXML (http://www.nexml.org) [Vos et al. 2012] is a standard inspired by theNexus. It supports and extends Nexus functionalities and addresses some Nexus limi-tations – e.g., connects objects with ontology concepts, supports citations and annotations[Vos et al. 2012]. In order to accomplish full compatibility and interoperability amongdifferent environments, NeXML defines a formalized XSD grammar and enables seman-tic annotations of any element in a NeXML document, which goes towards to a “Mini-mum Information About a Phylogenetic Analysis” (MIAPA) standard.
These comparative diagrams show that even if the structures are arranged dif-ferently, they address the same key elements. All formats organize data in accordancewith the (C,CS) data model that, in practice, is an entity-attribute-value (EAV) model,in which entities are OTUs, attributes are characters and values are character-states[Vos et al. 2012]. Nexus and NeXML formats define a matrix, in which OTUs are listed inrows, characters are columns and the cells contain a numeric code for a specific character-state (see Figure 2). Although Xper2 and SDD do not define a matrix, both formats havea similar structure to describe OTUs with their (C, CS) records.
4. From XML Structures to GraphsThe next step in our Three Tier Method is designing a graph model. In a previouswork [Alves and Santanche 2013], we have compared several approaches to capture la-tent relations+semantics among tags produced collaboratively. Graph models to representand analyze data were a common denominator. The role of the graph is not to reflect alldetails of the original model. The central challenge is how to abstract key elements, forwhich we are looking for potential relations to be discovered. It is a movement from thelatent semantics to an explicit semantics expressed as links.
On one hand, we devised in the previous section the common denominator weare looking for: OTUs, character and character states. On the other hand, a second im-portant ingredient is devising what is our target in ontologies. As mentioned in Sec-tion 2, a predominant ontology model for phenotype descriptions is the Entity-Quality(EQ) [Balhoff et al. 2010]. An Entity refers to the “part” of the OTU being described,which is related to one or more Qualities. In a comparison with the (C, CS) approach,a Character comprises an Entity plus the Quality involved in the description in a singletextual sentence. A State is a complementary part of the Quality. Even though it is not atrivial task to split Characters into their components of Entity and Quality, a first step will
159

entry
index
Nexus
Characters
matrix
row
charLabels
stateLabels
character-‐number
charStateLabel
taxon-‐name
character-‐name
state-‐name
character-‐name
state-‐name
index
index
index
index
(a) Nexus
NeXML
OTUs
Format
matrix
row
OTU
cell
OTU
state
char
State
States
(b) NeXML
SDD
Representation
SummaryData
Representation
States
CodedDescription
State
Categorical
CategoricalCharacter
StateDe7inition
(c) SDD
Variables
name
Individuals
name
Xper2
Individual
description_element
mode
Variable
description_list
(d) Xper2
Figure 5. Formats for representing phylogenetic data
be linking disperse elements referring to the same semantic concept.
Departing from the key elements identified in the previous section, we can devisethe following linking discovery challenges:
• Which OTUs in the graph refer to the same real world OTU (link OTU-OTU)?• Which characters can be applied to each OTU (link OTU-character)?• Which states for each character can be observed in each OTU (link OTU-
character-state)? Conversely, which OTUs have a given character+state?
The answer to these questions will enable to integrate, summarize and comparedata concerning each OTU and each character. Therefore, it becomes possible to answerqueries like:
160
• What are the possible colors of a Varanus tongue?• Which animals present an oval nostrils form?
The discovery process is carried by graph transformations. As graphs are crucialfor our modeling approach, our method was built over graph databases. These databasesreduce the gap between how data is modeled (as graphs) and how it is stored. It is capableof representing data structures with high abidance. Compared with relational databases,graph databases do not require join operations because it is done implicitly traversing thegraph from node to node. Graph databases are less schema-dependent and for this reason,they can scale more easily in size and complexity as the application evolves.
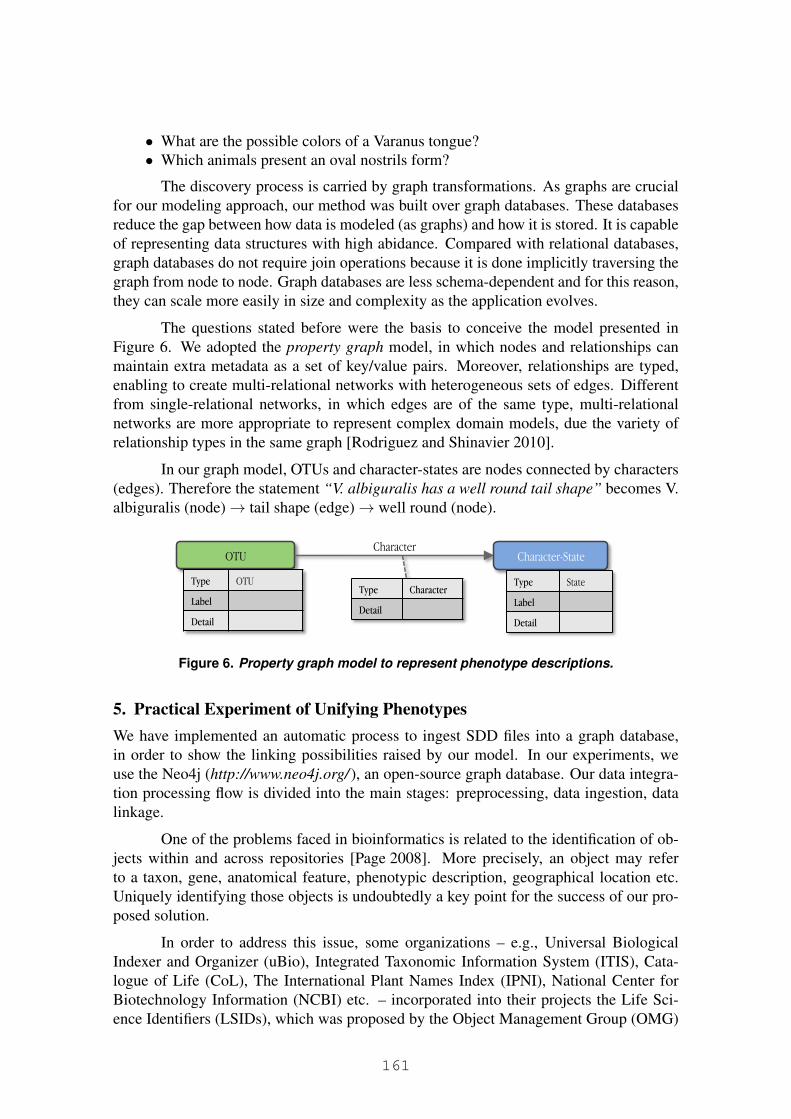
The questions stated before were the basis to conceive the model presented inFigure 6. We adopted the property graph model, in which nodes and relationships canmaintain extra metadata as a set of key/value pairs. Moreover, relationships are typed,enabling to create multi-relational networks with heterogeneous sets of edges. Differentfrom single-relational networks, in which edges are of the same type, multi-relationalnetworks are more appropriate to represent complex domain models, due the variety ofrelationship types in the same graph [Rodriguez and Shinavier 2010].
In our graph model, OTUs and character-states are nodes connected by characters(edges). Therefore the statement “V. albiguralis has a well round tail shape” becomes V.albiguralis (node)→ tail shape (edge)→ well round (node).
OTU
Type OTU
Label
Detail
Character-State
Type State
Label
Detail
Type Character
Detail
Character
Figure 6. Property graph model to represent phenotype descriptions.
5. Practical Experiment of Unifying PhenotypesWe have implemented an automatic process to ingest SDD files into a graph database,in order to show the linking possibilities raised by our model. In our experiments, weuse the Neo4j (http://www.neo4j.org/ ), an open-source graph database. Our data integra-tion processing flow is divided into the main stages: preprocessing, data ingestion, datalinkage.
One of the problems faced in bioinformatics is related to the identification of ob-jects within and across repositories [Page 2008]. More precisely, an object may referto a taxon, gene, anatomical feature, phenotypic description, geographical location etc.Uniquely identifying those objects is undoubtedly a key point for the success of our pro-posed solution.
In order to address this issue, some organizations – e.g., Universal BiologicalIndexer and Organizer (uBio), Integrated Taxonomic Information System (ITIS), Cata-logue of Life (CoL), The International Plant Names Index (IPNI), National Center forBiotechnology Information (NCBI) etc. – incorporated into their projects the Life Sci-ence Identifiers (LSIDs), which was proposed by the Object Management Group (OMG)
161

(http://www.omg.org/ ). LSID is a persistent, location-independent resource identifier,whose purpose is to uniquely identify biological resources [Clark et al. 2004]. The per-sistent property refers to the fact that LSID identifiers are unique, can be assigned to onlyone object forever and they never expire. The location-independent property specifiesthat each authority locally creates LSIDs and they are the responsible to guaranteeing theuniqueness of LSIDs.
We applied LSIDs to unify OTUs in the graph referring to the same real worldobject. In order to find a valid LSID, we adopted the Global Names Resolver (GNR) webservice (http://resolver.globalnames.org/ ) that executes exact or fuzzy matching againstcanonical forms of scientific names in 170 distinct data sources. The Canonical form (cf)is the simplest, most complete and unambiguous form of a name. The Canonical form ofscientific names consists of the genus and species – when applied – with no authorship,rank, nomenclatural annotation or subgenus.
Our system used three of the six types of matching offered by the GNR resolver:(i) exact matching; (ii) exact matching of canonical forms – this process reduce a givenname to its canonical form and checks it with an exact match; (iii) fuzzy matching ofcanonical forms – uses a modified version of the TaxaMatch algorithm [Rees 2008] and itintends to work around misspellings errors. It does a fuzzy match of the canonical formof a given name – even with mistakes – against spellings considered correct. The GNRresolver reports the matching quality (“confidence score”) for each match.
The matching module of the system is still a work in progress, but we alreadyhave obtained some relevant results to show the viability of our approach. From theLIS knowledge base we collected 7 distinct morphological descriptions: genus Varanus;species Varanus gouldii, Varanus timorensis, Varanus auffenbergi and Varanus scalaris;species groups Varanus indicus, Varanus prasinus, Varanus salvator; and Autralian spiny-tailed monitor lizards. Through Xper2 those morphological descriptions were exported tothe SDD format and imported into the graph database, with no preprocessing. Figure 7(a)shows an overview of the resulting graph without labels. We can note the disconnect-edness of the graph (7-partite graph). On the other hand, Figure 7(b) shows the sameknowledge after employing the LSID unification. The graphs became connected. Beforeapplying the LSID unification the graph had 74 distinct taxonomic units (TUs). After per-forming the LSID unification its total reduced to 44 TUs, i.e., 30 taxonomic units (40%)were recurring and were integrated in a single node.
The next step is to link equivalent characters of the same OTU, enabling integra-tion of states of the same character. In the present stage of this research we apply a simplematching algorithm. One example of our preliminary results is presented in the diagramof Figure 8. As can be seen, our algorithm was able to unify all “nuchal scales” charac-ters, by defining the same type to the edges. Moreover, we unified and congregated thepossible states observed for this character across different description files.
6. ConclusionSeveral initiatives propose to relate phenotype descriptions with ontologies to enable a se-mantic integration. The challenge is how to expand and revise the ontology while new de-scriptions were created. Tools which annotate descriptions with ontologies address themas an external artifact crafted apart, disregarding the synergy between building an ontol-
162

(a) Graph 7-partite (b) Connected graph
Figure 7. Varanus knowledge base
Varanus prasinus
smooth, unkeeled
granular to slightly keeled
triangular keeled, hull-shaped
strongly keeled
same size than head scales
bigger than head scales
Varanus beccarii
Varanus bogerti
Varanus komodoensis
nuchal scales
nuchal scales
nuchal scales
nuchal scales
nuchal scales
nuchal scales
nuchal scales
Prasinus.sdd
Varanus.sdd
Figure 8. Graph Diagram
ogy and using it. [Shirky 2005] emphasizes the importance of the semantics organicallybuilt by a community, where a binary categorization approach – in which a concept A “is”or “is not” part of a category B – to a probabilistic approach – in which a percentage ofpeople relates A to B. This work contributes in this direction. Inspired by previous work,which explores latent semantics in folksonomies, this work analyzes standards to describephenotypes to find a common denominator, which is the bases to link descriptions.
The main contribution of this work is to create the basis to exploit the latent se-mantics in the descriptions. The viability and the potential of our approach were tested byexperiments. These experiments are the first steps to exploit a bigger latent semantics sce-nario. Moreover, having the capability of integrating knowledge around taxonomic units
163

will enable, for instance, evolutionary biologists to generate new research questions, gainpredictive insight or confront evolutionary hypotheses. More complete answers might beprovided as new data sources are integrated.
Our representation in a graph database is aligned with theRDF [Manola and Miller 2004] graph-based representation, which will be the nextstep to achieve the third layer. The challenge will be to map labels of character/character-states in RDF properties/values. The unification of characters and states, as shown onthis preliminary work, is a first and high relevant step for this mapping. Since severalontologies related to phenotype descriptions are in OWL, the relations discovered inour graph can subsidize a better matching of labels and concepts in OWL ontologies byconfronting relations. For example, to enhance the match of a character label (in thegraph database) with an OWL property, it is possible to consider the states allowed bythe character, confronting them with the property range (values allowed by the property).
There are several possible ways to extend this work. One possible way is to in-corporate morphological descriptions stored in other knowledge bases, e.g., MorphoBank(http://morphobank.org/ ) or Dryad (http://datadryad.org/ ). Another direction is to inves-tigate correlations between State nodes and ontology terms.
AcknowledgmentWork partially financed by (CNPq 138197/2011-3), the Microsoft Research FAPESPVirtual Institute (NavScales project), CNPq (MuZOO Project and PRONEX-FAPESP),INCT in Web Science(CNPq 557.128/2009-9) and CAPES, as well as individual grantsfrom CNPq.
ReferencesAlves, H. and Santanche, A. (2013). Folksonomized Ontology and the 3E Steps Tech-
nique to Support Ontology Evolvement. Journal of Web Semantics, 18(1):19–30.
Balhoff, J. P., Dahdul, W. M., Kothari, C. R., Lapp, H., Lundberg, J. G., Mabee, P., Mid-ford, P. E., Westerfield, M., and Vision, T. J. (2010). Phenex: Ontological annotationof phenotypic diversity. PLoS ONE, 5(5):e10500.
Bell, G., Hey, T., and Szalay, A. (2009). Beyond the data deluge. Science,323(5919):1297–1298.
Ciccarelli, F. D., Doerks, T., Von Mering, C., Creevey, C. J., Snel, B., and Bork, P.(2006). Toward automatic reconstruction of a highly resolved tree of life. Science,311(5765):1283–1287.
Clark, T., Martin, S., and Liefeld, T. (2004). Globally distributed object identification forbiological knowledgebases. Briefings in bioinformatics, 5(1):59–70.
Dahdul, W. M., Balhoff, J. P., Engeman, J., Grande, T., Hilton, E. J., Kothari, C., Lapp,H., Lundberg, J. G., Midford, P. E., Vision, T. J., Westerfield, M., and Mabee, P. M.(2010). Evolutionary characters, phenotypes and ontologies: Curating data from thesystematic biology literature. PLoS ONE, 5(5):e10708.
Gibas, C. and Jambeck, P. (2001). Developing bioinformatics computer skills. O’ReillyMedia, Inc.
164

Gkoutos, G., Green, E., Mallon, A.-M., Hancock, J., and Davidson, D. (2004). Usingontologies to describe mouse phenotypes. Genome Biology, 6(1):R8.
Hagedorn, G. (2007). Structuring Descriptive Data of Organisms – Requirement Anal-ysis and Information Models. PhD thesis, Universitat Bayreuth,Fakultat fur Biologie,Chemie und Geowissenschaften.
Lenzerini, M. (2002). Data integration: A theoretical perspective. In Proceedings of thetwenty-first ACM SIGMOD-SIGACT-SIGART symposium on Principles of databasesystems, pages 233–246. ACM.
Mabee, P. M. (2006). Integrating evolution and development: the need for bioinformaticsin evo-devo. BioScience, 56(4):301–309.
Mabee, P. M., Ashburner, M., Cronk, Q., Gkoutos, G. V., Haendel, M., Segerdell, E.,Mungall, C., and Westerfield, M. (2007). Phenotype ontologies: the bridge betweengenomics and evolution. Trends in ecology & evolution, 22(7):345–350.
Maddison, D. R., Swofford, D. L., and Maddison, W. P. (1997). Nexus: An extensible fileformat for systematic information. Systematic Biology, 46(4):590–621.
Manola, F. and Miller, E. (2004). RDF Primer – W3C Recommendation. Technical report,W3C.
Page, R. (2008). Biodiversity informatics: the challenge of linking data and the role ofshared identifiers. Briefings in Bioinformatics, 9(5):345–354.
Parr, C. S., Guralnick, R., Cellinese, N., and Page, R. D. (2012). Evolutionary informat-ics: unifying knowledge about the diversity of life. Trends in ecology & evolution,27(2):94–103.
Pimentcl, R. A. and Riggins, R. (1987). The nature of cladistic data. Cladistics, 3(3):201–209.
Quan, D. (2007). Improving life sciences information retrieval using semantic web tech-nology. Briefings in bioinformatics, 8(3):172–182.
Rees, T. (2008). Taxamatch, a ”fuzzy” matching algorithm for taxon names, and potentialapplications in taxonomic databases. In Weitzman, A. and Belbin, L., editors, Pro-visional Abstracts of the 2008 Annual Conference of the Taxonomic Databases Work-ing Group, Fremantle, Australia. Biodiversity Information Standards (TDWG) and theMissouri Botanical Garden.
Rodriguez, M. A. and Shinavier, J. (2010). Exposing multi-relational networks to single-relational network analysis algorithms. Journal of Informetrics, 4(1):29 – 41.
Ung, V., Causse, F., and Vignes Lebbe, R. (2010a). Xper2: managing descriptive datafrom their collection to e-monographs.
Ung, V., Dubus, G., Zaragueta-Bagils, R., and Vignes-Lebbe, R. (2010b). Xper2: intro-ducing e-taxonomy. Bioinformatics, 26(5):703–704.
Vos, R. A., Balhoff, J. P., Caravas, J. A., Holder, M. T., Lapp, H., Maddison, W. P., Mid-ford, P. E., Priyam, A., Sukumaran, J., Xia, X., et al. (2012). Nexml: rich, extensible,and verifiable representation of comparative data and metadata. Systematic Biology,61(4):675–689.
165