UNIFIED REPORTER SERVER - Broadcom Inc. · 2019-06-26 · Introduction to JasperReports Server 9...
250
UNIFIED REPORTER SERVER USER GUIDE
Transcript of UNIFIED REPORTER SERVER - Broadcom Inc. · 2019-06-26 · Introduction to JasperReports Server 9...
UNIFIED REPORTER SERVER
USER GUIDE

JasperReports Server User Guide
2
Copyright © 2012 Jaspersoft Corporation. All rights reserved. Printed in the U.S.A. Jaspersoft, the Jaspersoft logo, Jaspersoft iReport Designer, JasperReports Library, JasperReports Server, Jaspersoft OLAP, and Jaspersoft ETL are trademarks and/or registered trademarks of Jaspersoft Corporation in the United States and in jurisdictions throughout the world. All other company and product names are or may be trade names or trademarks of their respective owners.
This is version 1112-JSP50-18 of the JasperReports Server User Guide.

Table of Contents
TABLE OF CONTENTS
Chapter 1 Introduction to JasperReports Server . . . . . . . . . . . . . . . . . . . . . . . . . . . . . . . . . . . . . . 91.1 Logging In . . . . . . . . . . . . . . . . . . . . . . . . . . . . . . . . . . . . . . . . . . . . . . . . . . . . . . . . . . . . . . . . . . . . . . 10
1.1.1 Logging into a Server with Multiple Organizations . . . . . . . . . . . . . . . . . . . . . . . . . . . . . . . . 111.2 The Getting Started Page . . . . . . . . . . . . . . . . . . . . . . . . . . . . . . . . . . . . . . . . . . . . . . . . . . . . . . . . . . 121.3 The Library Page . . . . . . . . . . . . . . . . . . . . . . . . . . . . . . . . . . . . . . . . . . . . . . . . . . . . . . . . . . . . . . . . . 13
1.3.1 Created vs. Modified Dates . . . . . . . . . . . . . . . . . . . . . . . . . . . . . . . . . . . . . . . . . . . . . . . . . 141.4 Browsing the Repository . . . . . . . . . . . . . . . . . . . . . . . . . . . . . . . . . . . . . . . . . . . . . . . . . . . . . . . . . . . 141.5 Searching the Repository . . . . . . . . . . . . . . . . . . . . . . . . . . . . . . . . . . . . . . . . . . . . . . . . . . . . . . . . . . . 14
1.5.1 Searching the Entire Repository . . . . . . . . . . . . . . . . . . . . . . . . . . . . . . . . . . . . . . . . . . . . . . 141.5.2 Filtering Search Results . . . . . . . . . . . . . . . . . . . . . . . . . . . . . . . . . . . . . . . . . . . . . . . . . . . . 15
1.6 Using Repository Resources . . . . . . . . . . . . . . . . . . . . . . . . . . . . . . . . . . . . . . . . . . . . . . . . . . . . . . . . 171.7 Moving Folders . . . . . . . . . . . . . . . . . . . . . . . . . . . . . . . . . . . . . . . . . . . . . . . . . . . . . . . . . . . . . . . . . . . 181.8 Sorting the Repository List . . . . . . . . . . . . . . . . . . . . . . . . . . . . . . . . . . . . . . . . . . . . . . . . . . . . . . . . . . 181.9 Mastering Report Design . . . . . . . . . . . . . . . . . . . . . . . . . . . . . . . . . . . . . . . . . . . . . . . . . . . . . . . . . . . 19
1.9.1 Locating JasperReports Samples . . . . . . . . . . . . . . . . . . . . . . . . . . . . . . . . . . . . . . . . . . . . . 191.9.2 Learning about the Samples . . . . . . . . . . . . . . . . . . . . . . . . . . . . . . . . . . . . . . . . . . . . . . . . . 19
Chapter 2 Working with Jaspersoft Dashboards . . . . . . . . . . . . . . . . . . . . . . . . . . . . . . . . . . . . . 212.1 Viewing a Dashboard . . . . . . . . . . . . . . . . . . . . . . . . . . . . . . . . . . . . . . . . . . . . . . . . . . . . . . . . . . . . . . 222.2 Creating a Dashboard . . . . . . . . . . . . . . . . . . . . . . . . . . . . . . . . . . . . . . . . . . . . . . . . . . . . . . . . . . . . . 23
2.2.1 Dashboard Overview . . . . . . . . . . . . . . . . . . . . . . . . . . . . . . . . . . . . . . . . . . . . . . . . . . . . . . 232.2.2 Creating a Simple Dashboard . . . . . . . . . . . . . . . . . . . . . . . . . . . . . . . . . . . . . . . . . . . . . . . 242.2.3 Adding Controls to a Dashboard . . . . . . . . . . . . . . . . . . . . . . . . . . . . . . . . . . . . . . . . . . . . . 252.2.4 Localizing Controls . . . . . . . . . . . . . . . . . . . . . . . . . . . . . . . . . . . . . . . . . . . . . . . . . . . . . . . . 262.2.5 Adding a Custom URL to a Dashboard . . . . . . . . . . . . . . . . . . . . . . . . . . . . . . . . . . . . . . . . 262.2.6 Refining a Dashboard’s Layout . . . . . . . . . . . . . . . . . . . . . . . . . . . . . . . . . . . . . . . . . . . . . . 282.2.7 About Screen Sizes . . . . . . . . . . . . . . . . . . . . . . . . . . . . . . . . . . . . . . . . . . . . . . . . . . . . . . . 29
2.3 Editing a Dashboard . . . . . . . . . . . . . . . . . . . . . . . . . . . . . . . . . . . . . . . . . . . . . . . . . . . . . . . . . . . . . . . 292.4 Tips for Designing Dashboards . . . . . . . . . . . . . . . . . . . . . . . . . . . . . . . . . . . . . . . . . . . . . . . . . . . . . . 29
2.4.1 Input Control Tips . . . . . . . . . . . . . . . . . . . . . . . . . . . . . . . . . . . . . . . . . . . . . . . . . . . . . . . . . 30
3

JasperReports Server User Guide
2.4.2 Miscellaneous Tips . . . . . . . . . . . . . . . . . . . . . . . . . . . . . . . . . . . . . . . . . . . . . . . . . . . . . . . . 30
Chapter 3 Running Reports and the Report Viewer . . . . . . . . . . . . . . . . . . . . . . . . . . . . . . . . . . . 333.1 Overview of The Report Viewer . . . . . . . . . . . . . . . . . . . . . . . . . . . . . . . . . . . . . . . . . . . . . . . . . . . . . . 33
3.1.1 The Report Viewer Tool bar . . . . . . . . . . . . . . . . . . . . . . . . . . . . . . . . . . . . . . . . . . . . . . . . . 343.1.2 Column Menu . . . . . . . . . . . . . . . . . . . . . . . . . . . . . . . . . . . . . . . . . . . . . . . . . . . . . . . . . . . . 353.1.3 Data Snapshots . . . . . . . . . . . . . . . . . . . . . . . . . . . . . . . . . . . . . . . . . . . . . . . . . . . . . . . . . . 35
3.2 Running or Creating a Simple Report . . . . . . . . . . . . . . . . . . . . . . . . . . . . . . . . . . . . . . . . . . . . . . . . . 353.2.1 Running a Simple Report . . . . . . . . . . . . . . . . . . . . . . . . . . . . . . . . . . . . . . . . . . . . . . . . . . . 353.2.2 Creating a Report . . . . . . . . . . . . . . . . . . . . . . . . . . . . . . . . . . . . . . . . . . . . . . . . . . . . . . . . . 36
3.3 Getting New Perspectives on Data . . . . . . . . . . . . . . . . . . . . . . . . . . . . . . . . . . . . . . . . . . . . . . . . . . . 373.3.1 Column Formatting . . . . . . . . . . . . . . . . . . . . . . . . . . . . . . . . . . . . . . . . . . . . . . . . . . . . . . . . 373.3.2 Conditional Formatting . . . . . . . . . . . . . . . . . . . . . . . . . . . . . . . . . . . . . . . . . . . . . . . . . . . . . 383.3.3 Interactively Filtering Report Output . . . . . . . . . . . . . . . . . . . . . . . . . . . . . . . . . . . . . . . . . . . 413.3.4 Interactively Sorting a Report . . . . . . . . . . . . . . . . . . . . . . . . . . . . . . . . . . . . . . . . . . . . . . . . 423.3.5 Moving, Resizing, and Hiding Columns . . . . . . . . . . . . . . . . . . . . . . . . . . . . . . . . . . . . . . . . 42
3.4 Navigating the Report . . . . . . . . . . . . . . . . . . . . . . . . . . . . . . . . . . . . . . . . . . . . . . . . . . . . . . . . . . . . . 433.5 Exporting the Report . . . . . . . . . . . . . . . . . . . . . . . . . . . . . . . . . . . . . . . . . . . . . . . . . . . . . . . . . . . . . . 433.6 Running an HTML5 Chart . . . . . . . . . . . . . . . . . . . . . . . . . . . . . . . . . . . . . . . . . . . . . . . . . . . . . . . . . . 443.7 Running a Flash Chart . . . . . . . . . . . . . . . . . . . . . . . . . . . . . . . . . . . . . . . . . . . . . . . . . . . . . . . . . . . . . 443.8 Running a Report with Input Controls or Filters . . . . . . . . . . . . . . . . . . . . . . . . . . . . . . . . . . . . . . . . . . 46
3.8.1 Simple Input Controls . . . . . . . . . . . . . . . . . . . . . . . . . . . . . . . . . . . . . . . . . . . . . . . . . . . . . . 473.8.2 Cascading Input Controls . . . . . . . . . . . . . . . . . . . . . . . . . . . . . . . . . . . . . . . . . . . . . . . . . . . 49
3.9 Scheduling Reports . . . . . . . . . . . . . . . . . . . . . . . . . . . . . . . . . . . . . . . . . . . . . . . . . . . . . . . . . . . . . . . 503.9.1 Setting Up a Job . . . . . . . . . . . . . . . . . . . . . . . . . . . . . . . . . . . . . . . . . . . . . . . . . . . . . . . . . . 513.9.2 Setting Output Options . . . . . . . . . . . . . . . . . . . . . . . . . . . . . . . . . . . . . . . . . . . . . . . . . . . . . 533.9.3 Viewing the List of Scheduled Jobs . . . . . . . . . . . . . . . . . . . . . . . . . . . . . . . . . . . . . . . . . . . 553.9.4 Changing Job Schedules . . . . . . . . . . . . . . . . . . . . . . . . . . . . . . . . . . . . . . . . . . . . . . . . . . . 553.9.5 Stopping a Job from Running . . . . . . . . . . . . . . . . . . . . . . . . . . . . . . . . . . . . . . . . . . . . . . . . 563.9.6 Running a Job Repeatedly . . . . . . . . . . . . . . . . . . . . . . . . . . . . . . . . . . . . . . . . . . . . . . . . . . 563.9.7 Running a Job in the Background . . . . . . . . . . . . . . . . . . . . . . . . . . . . . . . . . . . . . . . . . . . . 583.9.8 Adding a Date/Time Stamp to Scheduled Output . . . . . . . . . . . . . . . . . . . . . . . . . . . . . . . . . 58
3.10 Event Messages . . . . . . . . . . . . . . . . . . . . . . . . . . . . . . . . . . . . . . . . . . . . . . . . . . . . . . . . . . . . . . . . . . 59
Chapter 4 Working with the Ad Hoc Editor . . . . . . . . . . . . . . . . . . . . . . . . . . . . . . . . . . . . . . . . . . 614.1 Overview of the Ad Hoc Editor . . . . . . . . . . . . . . . . . . . . . . . . . . . . . . . . . . . . . . . . . . . . . . . . . . . . . . . 61
4.1.1 Ad Hoc Sources: Topics, Domains, and OLAP Connections . . . . . . . . . . . . . . . . . . . . . . . . 624.1.2 Ad Hoc View Types . . . . . . . . . . . . . . . . . . . . . . . . . . . . . . . . . . . . . . . . . . . . . . . . . . . . . . . 654.1.3 The Data Source Selection Panel . . . . . . . . . . . . . . . . . . . . . . . . . . . . . . . . . . . . . . . . . . . . 674.1.4 The Ad Hoc View Panel . . . . . . . . . . . . . . . . . . . . . . . . . . . . . . . . . . . . . . . . . . . . . . . . . . . . 674.1.5 The Filters Panel . . . . . . . . . . . . . . . . . . . . . . . . . . . . . . . . . . . . . . . . . . . . . . . . . . . . . . . . . 694.1.6 Saving an Ad Hoc View, Previewing and Creating a Report . . . . . . . . . . . . . . . . . . . . . . . . 69
4.2 Working with Tables . . . . . . . . . . . . . . . . . . . . . . . . . . . . . . . . . . . . . . . . . . . . . . . . . . . . . . . . . . . . . . . 694.2.1 Using Fields in Tables . . . . . . . . . . . . . . . . . . . . . . . . . . . . . . . . . . . . . . . . . . . . . . . . . . . . . 69
4.3 Working with Charts . . . . . . . . . . . . . . . . . . . . . . . . . . . . . . . . . . . . . . . . . . . . . . . . . . . . . . . . . . . . . . . 73
4

Table of Contents
4.3.1 Using Fields and Measures in Charts . . . . . . . . . . . . . . . . . . . . . . . . . . . . . . . . . . . . . . . . . . 744.3.2 Selecting a Chart Type . . . . . . . . . . . . . . . . . . . . . . . . . . . . . . . . . . . . . . . . . . . . . . . . . . . . . 764.3.3 Interacting with Charts . . . . . . . . . . . . . . . . . . . . . . . . . . . . . . . . . . . . . . . . . . . . . . . . . . . . . 78
4.4 Working with Standard Crosstabs . . . . . . . . . . . . . . . . . . . . . . . . . . . . . . . . . . . . . . . . . . . . . . . . . . . . 804.4.1 Using Fields in Crosstabs . . . . . . . . . . . . . . . . . . . . . . . . . . . . . . . . . . . . . . . . . . . . . . . . . . . 80
4.5 Working with OLAP Connection-based Crosstabs . . . . . . . . . . . . . . . . . . . . . . . . . . . . . . . . . . . . . . . . 824.5.1 Dimensions and Measures . . . . . . . . . . . . . . . . . . . . . . . . . . . . . . . . . . . . . . . . . . . . . . . . . . 834.5.2 Drilling Through Data . . . . . . . . . . . . . . . . . . . . . . . . . . . . . . . . . . . . . . . . . . . . . . . . . . . . . . 834.5.3 Viewing the MDX Query . . . . . . . . . . . . . . . . . . . . . . . . . . . . . . . . . . . . . . . . . . . . . . . . . . . . 844.5.4 Working with Microsoft SSAS . . . . . . . . . . . . . . . . . . . . . . . . . . . . . . . . . . . . . . . . . . . . . . . . 85
4.6 Creating Custom Fields . . . . . . . . . . . . . . . . . . . . . . . . . . . . . . . . . . . . . . . . . . . . . . . . . . . . . . . . . . . . 854.7 Using Filters and Input Controls . . . . . . . . . . . . . . . . . . . . . . . . . . . . . . . . . . . . . . . . . . . . . . . . . . . . . . 87
4.7.1 Using Filters . . . . . . . . . . . . . . . . . . . . . . . . . . . . . . . . . . . . . . . . . . . . . . . . . . . . . . . . . . . . . 884.7.2 Using Input Controls . . . . . . . . . . . . . . . . . . . . . . . . . . . . . . . . . . . . . . . . . . . . . . . . . . . . . . . 914.7.3 Input Controls and Filters Availability . . . . . . . . . . . . . . . . . . . . . . . . . . . . . . . . . . . . . . . . . . 92
4.8 Creating a View from a Domain . . . . . . . . . . . . . . . . . . . . . . . . . . . . . . . . . . . . . . . . . . . . . . . . . . . . . . 934.8.1 Using the Data Chooser Wizard . . . . . . . . . . . . . . . . . . . . . . . . . . . . . . . . . . . . . . . . . . . . . . 94
4.9 Creating Topics . . . . . . . . . . . . . . . . . . . . . . . . . . . . . . . . . . . . . . . . . . . . . . . . . . . . . . . . . . . . . . . . . . 974.9.1 Creating and Uploading a Topic . . . . . . . . . . . . . . . . . . . . . . . . . . . . . . . . . . . . . . . . . . . . . . 974.9.2 Creating Topics from Domains . . . . . . . . . . . . . . . . . . . . . . . . . . . . . . . . . . . . . . . . . . . . . . . 99
Chapter 5 Adding Reports Directly to the Repository . . . . . . . . . . . . . . . . . . . . . . . . . . . . . . . . 1015.1 Overview of a Report Unit . . . . . . . . . . . . . . . . . . . . . . . . . . . . . . . . . . . . . . . . . . . . . . . . . . . . . . . . . 1015.2 Adding a Simple Report Unit to the Server . . . . . . . . . . . . . . . . . . . . . . . . . . . . . . . . . . . . . . . . . . . . 102
5.2.1 Uploading the Main JRXML . . . . . . . . . . . . . . . . . . . . . . . . . . . . . . . . . . . . . . . . . . . . . . . . 1025.2.2 Uploading Suggested File Resources . . . . . . . . . . . . . . . . . . . . . . . . . . . . . . . . . . . . . . . . 1045.2.3 Defining the Data Source . . . . . . . . . . . . . . . . . . . . . . . . . . . . . . . . . . . . . . . . . . . . . . . . . . 1065.2.4 Defining the Query . . . . . . . . . . . . . . . . . . . . . . . . . . . . . . . . . . . . . . . . . . . . . . . . . . . . . . . 1075.2.5 Saving the New Report Unit . . . . . . . . . . . . . . . . . . . . . . . . . . . . . . . . . . . . . . . . . . . . . . . . 109
5.3 Adding a Complex Report Unit to the Server . . . . . . . . . . . . . . . . . . . . . . . . . . . . . . . . . . . . . . . . . . . 1105.3.1 Uploading Undetected File Resources . . . . . . . . . . . . . . . . . . . . . . . . . . . . . . . . . . . . . . . . 1125.3.2 Adding Input Controls . . . . . . . . . . . . . . . . . . . . . . . . . . . . . . . . . . . . . . . . . . . . . . . . . . . . . 1145.3.3 Selecting a Data Source for Running the Complex Report . . . . . . . . . . . . . . . . . . . . . . . . 124
5.4 Adding Cascading Input Controls to a Report . . . . . . . . . . . . . . . . . . . . . . . . . . . . . . . . . . . . . . . . . . 1265.5 Editing JRXML Report Units . . . . . . . . . . . . . . . . . . . . . . . . . . . . . . . . . . . . . . . . . . . . . . . . . . . . . . . 1275.6 Localizing Reports . . . . . . . . . . . . . . . . . . . . . . . . . . . . . . . . . . . . . . . . . . . . . . . . . . . . . . . . . . . . . . . 128
5.6.1 Running a Localized Report . . . . . . . . . . . . . . . . . . . . . . . . . . . . . . . . . . . . . . . . . . . . . . . . 1285.6.2 Adding Multi-lingual Prompts to Input Controls . . . . . . . . . . . . . . . . . . . . . . . . . . . . . . . . . . 1295.6.3 Adding a Multi-Lingual Static List to an Input Control . . . . . . . . . . . . . . . . . . . . . . . . . . . . . 1365.6.4 Reusing Resource Bundles . . . . . . . . . . . . . . . . . . . . . . . . . . . . . . . . . . . . . . . . . . . . . . . . 1455.6.5 Using Default Fonts in JasperReports Server . . . . . . . . . . . . . . . . . . . . . . . . . . . . . . . . . . 145
Chapter 6 Creating Domains . . . . . . . . . . . . . . . . . . . . . . . . . . . . . . . . . . . . . . . . . . . . . . . . . . . . . 1476.1 Introduction to Domains . . . . . . . . . . . . . . . . . . . . . . . . . . . . . . . . . . . . . . . . . . . . . . . . . . . . . . . . . . . 147
6.1.1 Domain Use Cases . . . . . . . . . . . . . . . . . . . . . . . . . . . . . . . . . . . . . . . . . . . . . . . . . . . . . . . 148
5

JasperReports Server User Guide
6.1.2 Terminology . . . . . . . . . . . . . . . . . . . . . . . . . . . . . . . . . . . . . . . . . . . . . . . . . . . . . . . . . . . . 1486.1.3 Components of a Domain . . . . . . . . . . . . . . . . . . . . . . . . . . . . . . . . . . . . . . . . . . . . . . . . . . 1496.1.4 Sample Domains . . . . . . . . . . . . . . . . . . . . . . . . . . . . . . . . . . . . . . . . . . . . . . . . . . . . . . . . 1496.1.5 Overview of Creating a Domain . . . . . . . . . . . . . . . . . . . . . . . . . . . . . . . . . . . . . . . . . . . . . 149
6.2 Example of Creating a Domain . . . . . . . . . . . . . . . . . . . . . . . . . . . . . . . . . . . . . . . . . . . . . . . . . . . . . 1506.3 Example of Creating a Domain Using a Virtual Data Source . . . . . . . . . . . . . . . . . . . . . . . . . . . . . . . 1586.4 Using the Add New Domain Page . . . . . . . . . . . . . . . . . . . . . . . . . . . . . . . . . . . . . . . . . . . . . . . . . . . 165
6.4.1 Add Security File and Add Locale Bundle Options . . . . . . . . . . . . . . . . . . . . . . . . . . . . . . . 1666.4.2 Selecting a Schema . . . . . . . . . . . . . . . . . . . . . . . . . . . . . . . . . . . . . . . . . . . . . . . . . . . . . . 167
6.5 Using the Domain Designer . . . . . . . . . . . . . . . . . . . . . . . . . . . . . . . . . . . . . . . . . . . . . . . . . . . . . . . . 1676.5.1 Tables Tab . . . . . . . . . . . . . . . . . . . . . . . . . . . . . . . . . . . . . . . . . . . . . . . . . . . . . . . . . . . . . 1686.5.2 Manage Data Source Dialog Box . . . . . . . . . . . . . . . . . . . . . . . . . . . . . . . . . . . . . . . . . . . . 1696.5.3 Derived Tables Tab . . . . . . . . . . . . . . . . . . . . . . . . . . . . . . . . . . . . . . . . . . . . . . . . . . . . . . 1696.5.4 Joins Tab . . . . . . . . . . . . . . . . . . . . . . . . . . . . . . . . . . . . . . . . . . . . . . . . . . . . . . . . . . . . . . 1706.5.5 Calculated Fields Tab . . . . . . . . . . . . . . . . . . . . . . . . . . . . . . . . . . . . . . . . . . . . . . . . . . . . . 1716.5.6 Pre-filters Tab . . . . . . . . . . . . . . . . . . . . . . . . . . . . . . . . . . . . . . . . . . . . . . . . . . . . . . . . . . . 1726.5.7 Display Tab . . . . . . . . . . . . . . . . . . . . . . . . . . . . . . . . . . . . . . . . . . . . . . . . . . . . . . . . . . . . . 1736.5.8 The Properties Panel . . . . . . . . . . . . . . . . . . . . . . . . . . . . . . . . . . . . . . . . . . . . . . . . . . . . . 1756.5.9 Designer Tool Bar . . . . . . . . . . . . . . . . . . . . . . . . . . . . . . . . . . . . . . . . . . . . . . . . . . . . . . . . 1776.5.10 Domain Validation . . . . . . . . . . . . . . . . . . . . . . . . . . . . . . . . . . . . . . . . . . . . . . . . . . . . . . . 177
6.6 Editing a Domain . . . . . . . . . . . . . . . . . . . . . . . . . . . . . . . . . . . . . . . . . . . . . . . . . . . . . . . . . . . . . . . . 1786.6.1 Maintaining Referential Integrity . . . . . . . . . . . . . . . . . . . . . . . . . . . . . . . . . . . . . . . . . . . . . 1806.6.2 Fixing Referential Integrity Problems . . . . . . . . . . . . . . . . . . . . . . . . . . . . . . . . . . . . . . . . . 180
Chapter 7 Accessing Reports and Domains from iReport . . . . . . . . . . . . . . . . . . . . . . . . . . . . . 1857.1 Plug-in Requirements . . . . . . . . . . . . . . . . . . . . . . . . . . . . . . . . . . . . . . . . . . . . . . . . . . . . . . . . . . . . . 1867.2 Connecting to the Server from iReport . . . . . . . . . . . . . . . . . . . . . . . . . . . . . . . . . . . . . . . . . . . . . . . . 1867.3 Creating a Report Unit in the Repository from iReport . . . . . . . . . . . . . . . . . . . . . . . . . . . . . . . . . . . . 187
7.3.1 Adding an Image and Subreport to the Report Unit . . . . . . . . . . . . . . . . . . . . . . . . . . . . . . 1897.4 Managing Resources in the Repository from iReport . . . . . . . . . . . . . . . . . . . . . . . . . . . . . . . . . . . . 1927.5 Editing a Report in the Repository from iReport . . . . . . . . . . . . . . . . . . . . . . . . . . . . . . . . . . . . . . . . . 1937.6 Running a Report from iReport . . . . . . . . . . . . . . . . . . . . . . . . . . . . . . . . . . . . . . . . . . . . . . . . . . . . . 1947.7 Using the Domain Plug-in . . . . . . . . . . . . . . . . . . . . . . . . . . . . . . . . . . . . . . . . . . . . . . . . . . . . . . . . . 1957.8 Creating and Uploading Chart Themes to the Server . . . . . . . . . . . . . . . . . . . . . . . . . . . . . . . . . . . . 197
Chapter 8 Advanced Domain Features . . . . . . . . . . . . . . . . . . . . . . . . . . . . . . . . . . . . . . . . . . . . 2018.1 The Domain Design File . . . . . . . . . . . . . . . . . . . . . . . . . . . . . . . . . . . . . . . . . . . . . . . . . . . . . . . . . . . 201
8.1.1 Exporting the Design File from a Domain . . . . . . . . . . . . . . . . . . . . . . . . . . . . . . . . . . . . . . 2028.1.2 Working With a Design File . . . . . . . . . . . . . . . . . . . . . . . . . . . . . . . . . . . . . . . . . . . . . . . . 2028.1.3 Structure of the Design File . . . . . . . . . . . . . . . . . . . . . . . . . . . . . . . . . . . . . . . . . . . . . . . . 2038.1.4 Uploading a Design File to a Domain . . . . . . . . . . . . . . . . . . . . . . . . . . . . . . . . . . . . . . . . . 213
8.2 The DomEL Syntax . . . . . . . . . . . . . . . . . . . . . . . . . . . . . . . . . . . . . . . . . . . . . . . . . . . . . . . . . . . . . . 2148.2.1 Datatypes . . . . . . . . . . . . . . . . . . . . . . . . . . . . . . . . . . . . . . . . . . . . . . . . . . . . . . . . . . . . . . 2148.2.2 Field References . . . . . . . . . . . . . . . . . . . . . . . . . . . . . . . . . . . . . . . . . . . . . . . . . . . . . . . . 2158.2.3 Operators and Functions . . . . . . . . . . . . . . . . . . . . . . . . . . . . . . . . . . . . . . . . . . . . . . . . . . 216
6

Table of Contents
8.2.4 Profile Attributes . . . . . . . . . . . . . . . . . . . . . . . . . . . . . . . . . . . . . . . . . . . . . . . . . . . . . . . . . 2168.2.5 SQL Functions . . . . . . . . . . . . . . . . . . . . . . . . . . . . . . . . . . . . . . . . . . . . . . . . . . . . . . . . . . 2178.2.6 Complex Expressions . . . . . . . . . . . . . . . . . . . . . . . . . . . . . . . . . . . . . . . . . . . . . . . . . . . . . 2178.2.7 Return Value . . . . . . . . . . . . . . . . . . . . . . . . . . . . . . . . . . . . . . . . . . . . . . . . . . . . . . . . . . . . 218
8.3 Security and Locale Information for a Domain . . . . . . . . . . . . . . . . . . . . . . . . . . . . . . . . . . . . . . . . . . 2188.4 The Domain Security File . . . . . . . . . . . . . . . . . . . . . . . . . . . . . . . . . . . . . . . . . . . . . . . . . . . . . . . . . . 220
8.4.1 Row-Level Security . . . . . . . . . . . . . . . . . . . . . . . . . . . . . . . . . . . . . . . . . . . . . . . . . . . . . . . 2238.4.2 Column-Level Security . . . . . . . . . . . . . . . . . . . . . . . . . . . . . . . . . . . . . . . . . . . . . . . . . . . . 225
8.5 Locale Bundles . . . . . . . . . . . . . . . . . . . . . . . . . . . . . . . . . . . . . . . . . . . . . . . . . . . . . . . . . . . . . . . . . . 2288.5.1 Defining the Internationalization Keys . . . . . . . . . . . . . . . . . . . . . . . . . . . . . . . . . . . . . . . . 2298.5.2 Creating Locale Bundle Files . . . . . . . . . . . . . . . . . . . . . . . . . . . . . . . . . . . . . . . . . . . . . . . 230
8.6 Internationalized Databases . . . . . . . . . . . . . . . . . . . . . . . . . . . . . . . . . . . . . . . . . . . . . . . . . . . . . . . . 2318.7 Copying a Domain . . . . . . . . . . . . . . . . . . . . . . . . . . . . . . . . . . . . . . . . . . . . . . . . . . . . . . . . . . . . . . . 2328.8 Switching the Data Source of a Domain . . . . . . . . . . . . . . . . . . . . . . . . . . . . . . . . . . . . . . . . . . . . . . 232
Glossary . . . . . . . . . . . . . . . . . . . . . . . . . . . . . . . . . . . . . . . . . . . . . . . . . . . . . . . . . . . . . . . . . . . . . . 235
Index . . . . . . . . . . . . . . . . . . . . . . . . . . . . . . . . . . . . . . . . . . . . . . . . . . . . . . . . . . . . . . . . . . . . . . . . . 243
7

JasperReports Server User Guide
8

Introduction to JasperReports Server
CHAPTER 1 INTRODUCTION TO JASPERREPORTS SERVER
JasperReports Server builds on JasperReports as a comprehensive family of Business Intelligence (BI) products, providing robust static and interactive reporting, report server, and data analysis capabilities. These capabilities are available as either stand-alone products, or as part of an integrated end-to-end BI suite utilizing common metadata and provide shared services, such as security, a repository, and scheduling. The server exposes comprehensive public interfaces enabling seamless integration with other applications and the capability to easily add custom functionality.
The heart of the Jaspersoft BI Suite is the server, which provides the ability to:Easily create new reports based on views designed in an intuitive, web-based, drag and drop Ad Hoc Editor.Efficiently and securely manage many reports.Interact with reports, including sorting, changing formatting, entering parameters, and drilling on data.Schedule reports for distribution through email and storage in the repository.Arrange reports and web content to create appealing, data-rich Jaspersoft Dashboards that quickly convey business trends.
For business intelligence users, Jaspersoft offers Jaspersoft OLAP, which runs on the server.
While the Ad Hoc Editor lets users create simple reports, more complex reports can be created outside of the server. You can either use iReport Designer or manually write JRXML code to create a report that can be run in the server. Jaspersoft recommends that you use iReport unless you have a thorough understanding of the JasperReports file structure. See Chapter 5, “Adding Reports Directly to the Repository,” on page 101 and section 7.1, “Plug-in Requirements,” on page 186.
Jaspersoft provides several other sources of information to help extend your knowledge of JasperReports Server:Our Ultimate Guides document advanced features and configuration. They also include best practice recommendations and numerous examples. The guides are available as downloadable PDFs. Community project users can purchase individual guides or bundled documentation packs from the Jaspersoft online store. Commercial customers can download them freely from the support portal.Our Online Learning Portal lets you learn at your own pace, and covers topics for developers, system administrators, business users, and data integration users. The Portal is available online from Professional Services section of our website.Our free samples, which are installed with JasperReports, iReport, and JasperReports Server, are documented online. For more information about the samples, see section 1.9, “Mastering Report Design,” on page 19.
JasperReports Server is a component of both a community project and commercial offerings. Each integrates the standard features such as security, scheduling, a web services interface, and much more for running and sharing reports. Commercial
This section describes functionality that can be restricted by the software license for JasperReports Server. If you don’t see some of the options described in this section, your license may prohibit you from using them. To find out what you're licensed to use, or to upgrade your license, contact Jaspersoft.
9

JasperReports Server User Guide
editions provide additional features, including Ad Hoc charts, flash charts, dashboards, Domains, auditing, and a multi-organization architecture for hosting large BI deployments.
This chapter contains the following sections:Logging InThe Getting Started PageThe Library PageBrowsing the RepositorySearching the RepositoryUsing Repository ResourcesSorting the Repository ListMastering Report Design
1.1 Logging InTo protect the data that you can access through the server, all users are required to log in with a password.
To login to the server:1. Enter http://<hostname>:8080/jasperserver-pro in a web browser, where <hostname> is the name of the
computer that hosts JasperReports Server. The Login page appears:
2. Before logging in, review the information on the login page. There are links to the online help and additional resources.3. To log in, enter your user ID and password.
Figure 1-1 Jaspersoft Login Page
If you installed an evaluation server with the sample data, you can log in with the sample user IDs and passwords. For more information, click Need help logging in?The default administrator login credentials are superuser/superuser and jasperadmin/jasperadmin.
10
Introduction to JasperReports Server
4. If the Organization field appears in the Login panel, enter the ID or alias of your organization. If you don’t know it, contact your administrator. For more information, see section 1.1.1, “Logging into a Server with Multiple Organizations,” on page 11.
5. If you want to use a different locale and time zone than the server uses, click Show locale & time zone.The Locale and Time Zone fields appear in the Login panel. Select your locale and time zone from the drop-down menus.
6. Click Login.If you entered a valid user ID and password, the server displays the Getting Started page, as shown in Figure 1-3.
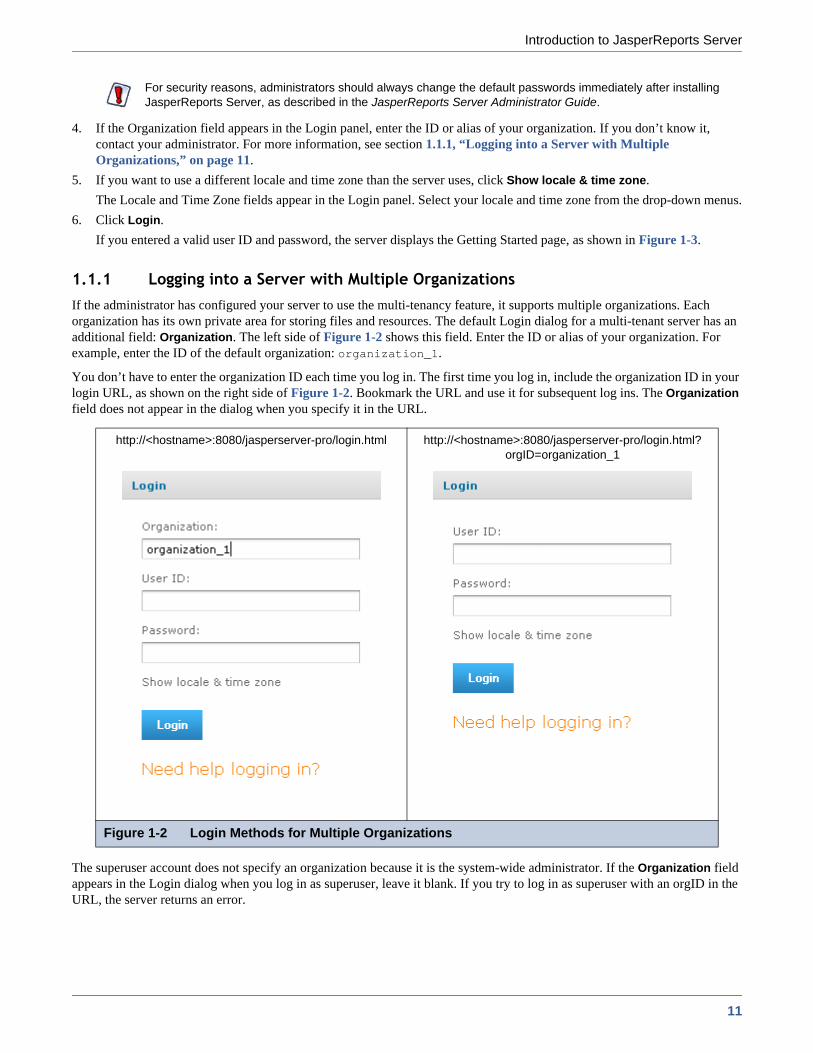
1.1.1 Logging into a Server with Multiple OrganizationsIf the administrator has configured your server to use the multi-tenancy feature, it supports multiple organizations. Each organization has its own private area for storing files and resources. The default Login dialog for a multi-tenant server has an additional field: Organization. The left side of Figure 1-2 shows this field. Enter the ID or alias of your organization. For example, enter the ID of the default organization: organization_1.
You don’t have to enter the organization ID each time you log in. The first time you log in, include the organization ID in your login URL, as shown on the right side of Figure 1-2. Bookmark the URL and use it for subsequent log ins. The Organization field does not appear in the dialog when you specify it in the URL.
The superuser account does not specify an organization because it is the system-wide administrator. If the Organization field appears in the Login dialog when you log in as superuser, leave it blank. If you try to log in as superuser with an orgID in the URL, the server returns an error.
For security reasons, administrators should always change the default passwords immediately after installing JasperReports Server, as described in the JasperReports Server Administrator Guide.
http://<hostname>:8080/jasperserver-pro/login.html http://<hostname>:8080/jasperserver-pro/login.html?orgID=organization_1
Figure 1-2 Login Methods for Multiple Organizations
11

JasperReports Server User Guide
1.2 The Getting Started PageFrom the Getting Started page, you quickly access the most frequently used features of the server
.
The Getting Started page for standard users can have three icons that link to the basic functions of the server:View Reports – Displays a list of the reports that you can view and run.Create Ad Hoc View– Launches the Data Chooser wizard followed by the Ad Hoc Editor for designing Ad Hoc views –the basis for creating reports on the server – interactively.Create Report – Launches the Create Report wizard, which allows you to select an existing Ad Hoc view and generate a report.Manage Server – Opens the Server Settings page. This option is often only available to administrators.
and the Library, View, Manage, and Create menus offer these options:
Figure 1-3 Getting Started Page
Menu Description
Returns to the Getting Started page.
Library Displays a pared-down repository page that contains the Ad Hoc views, reports, and dashboards the currently logged-in user has rights to
View Search Results – Displays the repository of resources filtered by criteria selected in the Filters panel. Same as clicking View Your Reports on the Getting Started page.Repository – Displays the repository of files and folders containing resources, such as reports, report output, data sources, and images. Messages – Lists system messages, such as an error in a scheduled report.UI Samples – Presents galleries of UI components that you redesign using Themes. Available only to administrators.
12
Introduction to JasperReports Server
If you log in as an administrator, the Home page has additional options and menu items for managing users, roles, organizations, and settings, such as repository folder names. Administrator functions are documented in the JasperReports Server Administrator Guide. The links to the Online Help, Log Out, and a search field appear on all JasperReports Server pages. For more information about searching, see section 1.5.2, “Filtering Search Results,” on page 15.
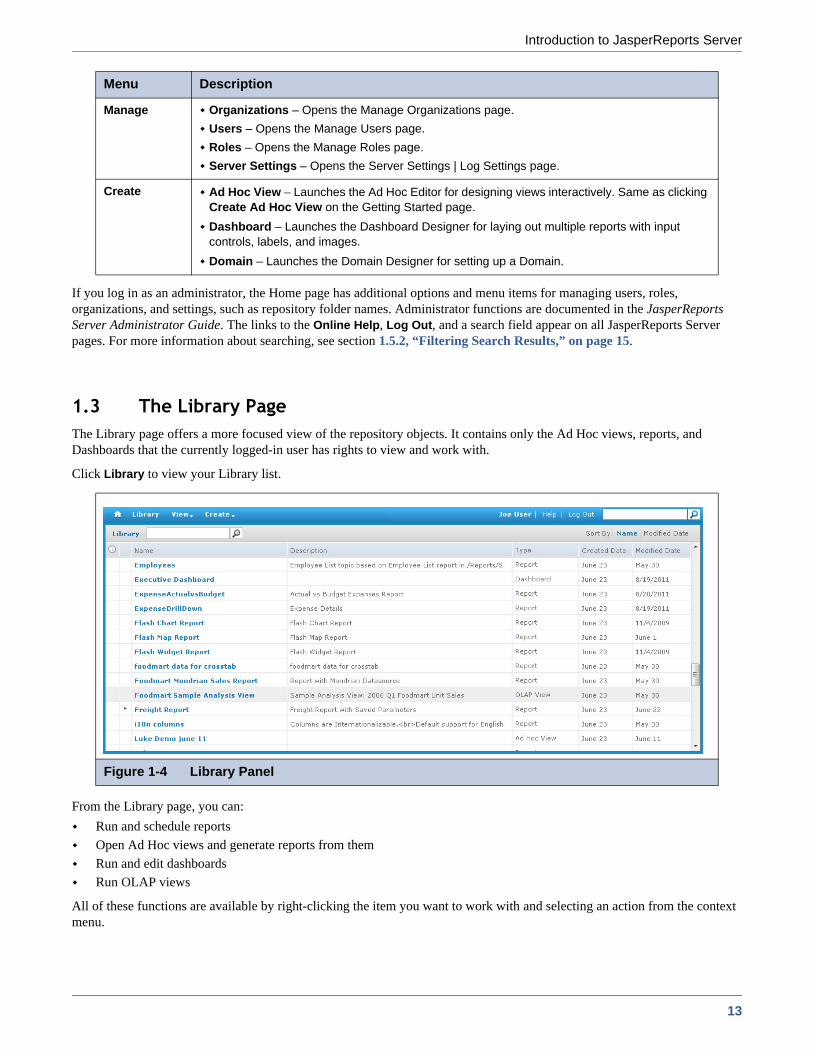
1.3 The Library PageThe Library page offers a more focused view of the repository objects. It contains only the Ad Hoc views, reports, and Dashboards that the currently logged-in user has rights to view and work with.
Click Library to view your Library list.
From the Library page, you can:Run and schedule reportsOpen Ad Hoc views and generate reports from themRun and edit dashboardsRun OLAP views
All of these functions are available by right-clicking the item you want to work with and selecting an action from the context menu.
Manage Organizations – Opens the Manage Organizations page.Users – Opens the Manage Users page.Roles – Opens the Manage Roles page.Server Settings – Opens the Server Settings | Log Settings page.
Create Ad Hoc View – Launches the Ad Hoc Editor for designing views interactively. Same as clicking Create Ad Hoc View on the Getting Started page.Dashboard – Launches the Dashboard Designer for laying out multiple reports with input controls, labels, and images.Domain – Launches the Domain Designer for setting up a Domain.
Figure 1-4 Library Panel
Menu Description
13

JasperReports Server User Guide
1.3.1 Created vs. Modified DatesThe Library table has two columns that refer to when the repository items were created or last updated.
The Created Date column displays when resource was created.The Modified Date column displays when the resource was last modified.
Generally, the created date will be earlier than the modified date. In some situations, however, the created date may be after the modified date. This can happen in two situations:
When an existing report (A) is modified, then subsequently copied into a new report (B). In the Library list, report B’s created date is the day it was created, but its modified date reflects the last time report A was changed.An existing report is exported from one system and imported into another. In the Library list, the reports created date is the date it was imported into the new system, and the modified date is the date it was last modified in the original system.
1.4 Browsing the RepositoryThe repository is the server’s internal storage for reports, analysis views, and related files. The repository is organized as a structure of folders containing resources, much like a file system. However, unlike a file system, the repository is stored as a private database that only JasperReports Server can access directly.
To browse the repository, select View > Repository. From the repository page, you access the reports, themes, and other files stored on the server. You can browse the repository contents that you have permission to view by expanding icons in Folders. Click a folder name to view its contents. Figure 1-5 shows the Repository page.
1.5 Searching the RepositoryYou can search the entire repository, subject to permissions, or narrow the search using filters. Filters restrict a search by name, who changed the resource, type of resource, date of the resource, and schedule.
1.5.1 Searching the Entire RepositoryTo search the repository, select View > Search Results. The search results page appears. Instead of only viewing resources by folder, use intuitive search criteria, such as who modified the resource and when, to find pinpoint resources.
Figure 1-5 Repository Folders Panel
14

Introduction to JasperReports Server
On the search results page, use either the Filters panel or Search field to find resources. The search results page displays results of searches and filters.
To search all resources in the repository:1. Select one of these filters: All available, Modified by me, or Viewed by me.
2. Click the icon in the search field to clear the search term if there is one.
3. Select All types, as shown in Figure 1-6.
4. Click . The search results appear, listing files that your user account has permission to view. Click a resource in the list to view it or right-click a resource to see what functions are available from the context menu.
The server remembers your settings on the Search Results page, making the most commonly needed resources remain visible when you return to the page.
1.5.2 Filtering Search Results
If you enter a search term and click at the top of any server page, the server doesn’t use filters. The search uses these default settings:
Include subfoldersStart at the top-most folder visible to the userSearch for reports, report outputs, OLAP views, or other resourcesSort alphabetically by name
If you click View > Search Results and click on the search results page, the server uses the filters you set in the Filters panel.
Figure 1-6 Search Results Page
15

JasperReports Server User Guide
Figure 1-7 shows the results of a search for the term “account” using the filters All available and All types.
You refine a search using filters. For example, filters can help you find your most recently viewed reports. You can set each filter independently of the others. You can set the following types of filters:
UserResourceAccess timeScheduled report
The user filter has the following settings:
The resource type filter has the following settings:
Figure 1-7 Search Field and Search Results
The search term you enter in the search field isn’t cleared automatically. To clear the search term, click the icon in the search field.
Filter Setting Description
All Available (default) All resources.
Modified by me Selects only resources that were last modified by the user who’s logged in.
Viewed by me Selects only resources that were run and viewed by the user who’s logged in. This filter not only applies to visualization types, but also to resources that are included in reports such as images.
Filter Setting Description
All types (default) All resources.
Reports Displays only reports, both JRXML reports and Ad Hoc reports.
Report outputs Displays only the output from reports that were scheduled or run in the background. Report output can be any of the supported export types, such as HTML and PDF.
Dashboards Displays only dashboards.
OLAP views Displays only analysis views (if you implement Jaspersoft OLAP).
Domains Displays only Domains.
Data sources Displays only data sources.
16
Introduction to JasperReports Server
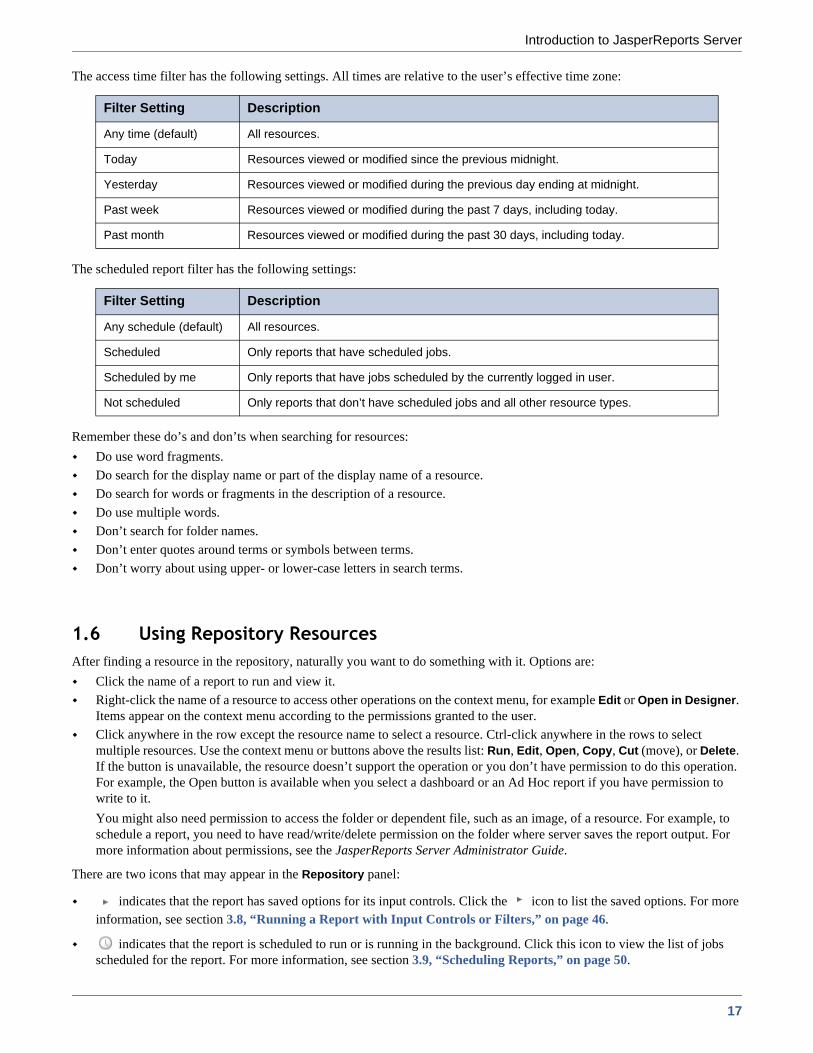
The access time filter has the following settings. All times are relative to the user’s effective time zone:
The scheduled report filter has the following settings:
Remember these do’s and don’ts when searching for resources:Do use word fragments. Do search for the display name or part of the display name of a resource.Do search for words or fragments in the description of a resource.Do use multiple words.Don’t search for folder names.Don’t enter quotes around terms or symbols between terms.Don’t worry about using upper- or lower-case letters in search terms.
1.6 Using Repository ResourcesAfter finding a resource in the repository, naturally you want to do something with it. Options are:
Click the name of a report to run and view it.Right-click the name of a resource to access other operations on the context menu, for example Edit or Open in Designer. Items appear on the context menu according to the permissions granted to the user.Click anywhere in the row except the resource name to select a resource. Ctrl-click anywhere in the rows to select multiple resources. Use the context menu or buttons above the results list: Run, Edit, Open, Copy, Cut (move), or Delete. If the button is unavailable, the resource doesn’t support the operation or you don’t have permission to do this operation. For example, the Open button is available when you select a dashboard or an Ad Hoc report if you have permission to write to it.You might also need permission to access the folder or dependent file, such as an image, of a resource. For example, to schedule a report, you need to have read/write/delete permission on the folder where server saves the report output. For more information about permissions, see the JasperReports Server Administrator Guide.
There are two icons that may appear in the Repository panel:
indicates that the report has saved options for its input controls. Click the icon to list the saved options. For more information, see section 3.8, “Running a Report with Input Controls or Filters,” on page 46.
indicates that the report is scheduled to run or is running in the background. Click this icon to view the list of jobs scheduled for the report. For more information, see section 3.9, “Scheduling Reports,” on page 50.
Filter Setting Description
Any time (default) All resources.
Today Resources viewed or modified since the previous midnight.
Yesterday Resources viewed or modified during the previous day ending at midnight.
Past week Resources viewed or modified during the past 7 days, including today.
Past month Resources viewed or modified during the past 30 days, including today.
Filter Setting Description
Any schedule (default) All resources.
Scheduled Only reports that have scheduled jobs.
Scheduled by me Only reports that have jobs scheduled by the currently logged in user.
Not scheduled Only reports that don’t have scheduled jobs and all other resource types.
17

JasperReports Server User Guide
1.7 Moving FoldersIf you have read permission on folders and resources, you can copy and cut them from one folder and paste them to another if you have write permission on the destination folder. The server pastes all contents of the folder that you copy or cut into the new location.
You can drag-and-drop the objects instead of using the paste menu item. Move folders one at a time. You can move other resources in batches.
To move folders and resources by cutting and pasting:1. Log into the server as a user who has these permissions:
Read permission on the folder or resource to moveWrite permission on the destination folder
For example, log in as joeuser (use the password, joeuser).2. Click View > Repository.3. In the Folders panel, right-click Reports > Samples, and select Add Folder.4. In the Add Folder dialog, enter a name, such as Financial Reports, and click Add.
The Financial Reports folder appears as a subfolder of Samples and inherits Joe User’s default permissions (read-write-delete) on the parent folder.
5. The Financial Reports folder deserves a more prominent location. Move it up one level:a. In Folders, right-click Financial Reports, and select Cut.b. Right-click Reports, and select Paste.
The Financial Reports folder now appears in Reports at the same level as Samples.
1.8 Sorting the Repository ListTo change the order of the list of reports and other resources, use the Sort By controls:
Click Name to sort alphabetically (A at the top). This is the default sort order.Click Modified Date to sort by the latest modified time and date (most recent at the top).
Relocated objects inherit permissions from the destination folder, losing the permissions in place prior to the move. To change permissions on an object, set the permissions explicitly.
Figure 1-8 New Financial Reports Folder
You can relocate a folder, subject to permissions, anywhere in the repository with one exception: The server doesn’t support copying and pasting a folder to the same location. If the Paste command is disabled when you right-click a destination folder, you don’t have write permission on the folder.
18
Introduction to JasperReports Server
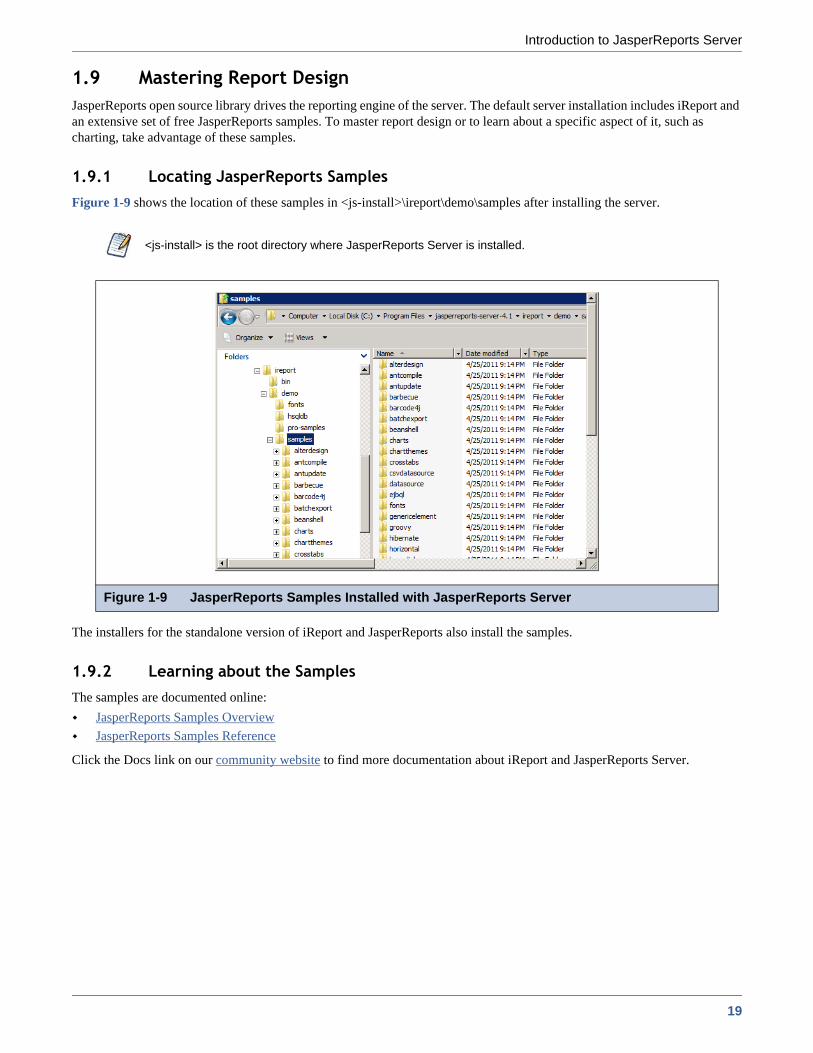
1.9 Mastering Report DesignJasperReports open source library drives the reporting engine of the server. The default server installation includes iReport and an extensive set of free JasperReports samples. To master report design or to learn about a specific aspect of it, such as charting, take advantage of these samples.
1.9.1 Locating JasperReports SamplesFigure 1-9 shows the location of these samples in <js-install>\ireport\demo\samples after installing the server.
The installers for the standalone version of iReport and JasperReports also install the samples.
1.9.2 Learning about the SamplesThe samples are documented online:
JasperReports Samples OverviewJasperReports Samples Reference
Click the Docs link on our community website to find more documentation about iReport and JasperReports Server.
<js-install> is the root directory where JasperReports Server is installed.
Figure 1-9 JasperReports Samples Installed with JasperReports Server
19

JasperReports Server User Guide
20

Working with Jaspersoft Dashboards
CHAPTER 2 WORKING WITH JASPERSOFT DASHBOARDS
A Jaspersoft Dashboard displays several reports in a single, integrated view. A dashboard can include other dashboards, input controls for choosing the data displayed in one or more frames, and custom frames that point to URLs for other content. By combining different types of related content, you can create appealing, data-rich dashboards that quickly convey trends.
This chapter contains the following sections:Viewing a DashboardCreating a Dashboard
This section describes functionality that can be restricted by the software license for JasperReports Server. If you don’t see some of the options described in this section, your license may prohibit you from using them. To find out what you're licensed to use, or to upgrade your license, contact Jaspersoft.
Figure 2-1 Dashboard with a Table, Chart, and Crosstab
21
JasperReports Server User Guide
Editing a DashboardTips for Designing Dashboards
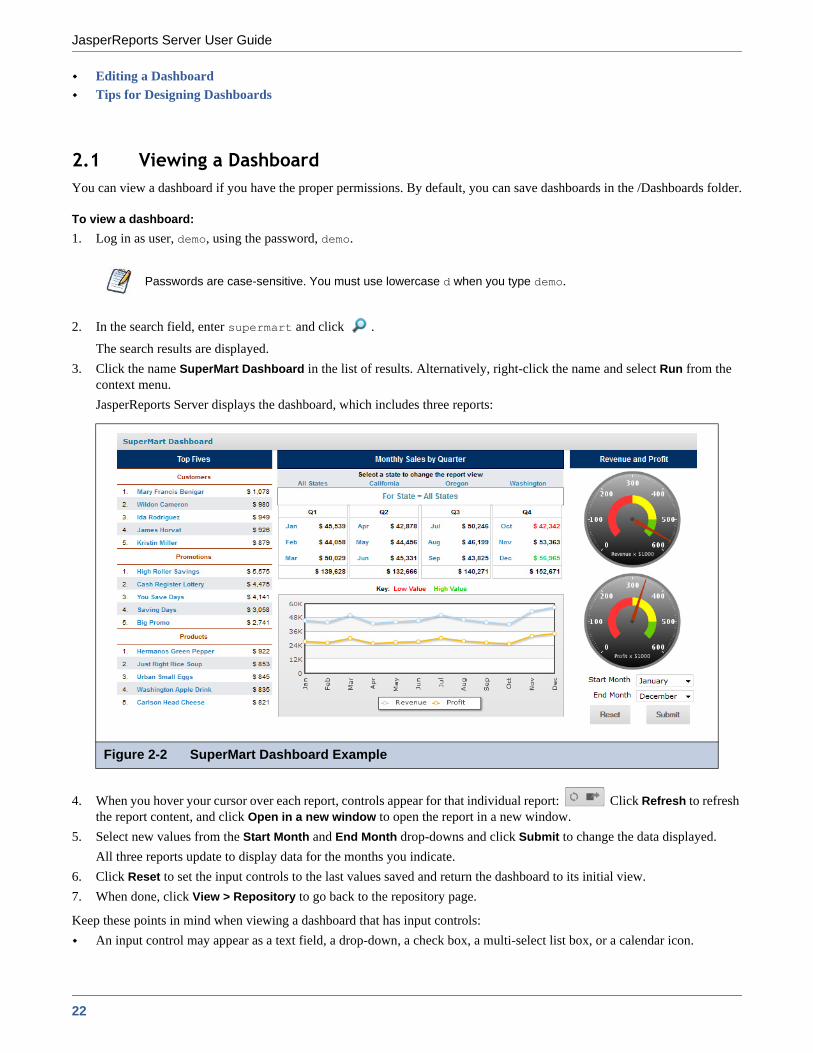
2.1 Viewing a DashboardYou can view a dashboard if you have the proper permissions. By default, you can save dashboards in the /Dashboards folder.
To view a dashboard:1. Log in as user, demo, using the password, demo.
2. In the search field, enter supermart and click .
The search results are displayed.3. Click the name SuperMart Dashboard in the list of results. Alternatively, right-click the name and select Run from the
context menu. JasperReports Server displays the dashboard, which includes three reports:
4. When you hover your cursor over each report, controls appear for that individual report: Click Refresh to refresh the report content, and click Open in a new window to open the report in a new window.
5. Select new values from the Start Month and End Month drop-downs and click Submit to change the data displayed. All three reports update to display data for the months you indicate.
6. Click Reset to set the input controls to the last values saved and return the dashboard to its initial view.7. When done, click View > Repository to go back to the repository page.
Keep these points in mind when viewing a dashboard that has input controls:An input control may appear as a text field, a drop-down, a check box, a multi-select list box, or a calendar icon.
Passwords are case-sensitive. You must use lowercase d when you type demo.
Figure 2-2 SuperMart Dashboard Example
22

Working with Jaspersoft Dashboards
If one of the frames in a dashboard does not refer to an input control, that frame does not update when you change that input control’s value. Only reports that refer to the input control reflect the change.
2.2 Creating a DashboardAs a user, you can create a dashboard, though your permissions to access the repository may limit the content you can add and the location where you can save the dashboard.
This section includes:Dashboard OverviewCreating a Simple DashboardAdding Controls to a DashboardLocalizing ControlsAdding a Custom URL to a DashboardRefining a Dashboard’s LayoutAbout Screen Sizes
2.2.1 Dashboard OverviewA dashboard can include the following content:
Reports in the repository.Special content:
Custom URL. Any URL-addressable web content. The dashboard can point to web content and include it in a frame in a web page. For example, you might include a frame that points to the logo on your corporate website; when that logo changes, the dashboard automatically updates to reflect the branding change. A complex example is described in “Adding a Custom URL to a Dashboard” on page 26.Free Text. A free-form text entry field. Resizing this type of item changes the size of the font in the label. Use free text items to add titles and instructional text to the dashboard.Single Controls and Multiple Controls. If a report you include on the dashboard is designed to use input controls or filters, you can add that capability to the dashboard. The server maps input controls to one or more frames. For example, if multiple reports include the same parameter, the server automatically maps the corresponding control to each of those reports when you add the input control to the dashboard. Controls can also be manually mapped to custom URL frames.
Dashboard Controls:Submit. Applies the values in the dashboard input controls to the reports that refer to each input control. The server refreshes these reports to display the new set of data. If the dashboard doesn’t include a Submit button, changes to input control values are reflected immediately.Reset. Resets the values of the input controls to the last value selected when the dashboard was saved. Print View. Displays the dashboard without buttons or the server’s header and footer, and (depending on the browser) opens the browser’s Print window.Text Label. Identifies an input control. When you add an input control to the dashboard, the server automatically adds a text label for it. Resizing this type of item only changes the size of the label itself; the font size in the label is fixed.
If a dashboard includes a Print View button, click it to display the dashboard without JasperReports Server's header and footer; depending on your web browser, this also opens your browser's Print window.
Multiple controls are those used by more than one report. Single controls are those used by a single report.
23

JasperReports Server User Guide
2.2.2 Creating a Simple DashboardThis section describes the creation of a dashboard.
To create a simple dashboard:1. Click Create > Dashboard.
The dashboard designer appears, displaying the list of available content and the canvas.2. In Available Content, navigate to the /Reports/Samples folder, right-click the Freight Report.3. Select Add to Dashboard:
The Freight Report appears in a frame in the upper left corner of the canvas. 4. In Available Content, double-click the Accounts Report.
The Accounts Report appears on the canvas. 5. Right-click the Accounts Report and click Size to Content.
The resized Accounts Report now exceeds the canvas area.
6. To ensure that a user with the selected resolution can view the entire dashboard without scrolling, resize the Accounts Report to fit within the canvas area:a. Hover the cursor over the handle at the bottom of right-hand edge of the frame containing the Accounts Report.
b. When the cursor changes to a resizing icon ( ) click and drag the edge of the frame to resize it.
c. Drag the edge of the frame of the Accounts Report upward until only seven accounts in Burnaby are shown.
7. Right-click the Accounts Report and click Show Scroll Bars. 8. Right-click the Freight Report, and click Hide Scroll Bars.
To add a report to a dashboard, you must have permission to view the report.
Figure 2-3 List of Available Content in the Dashboard Designer
You can save the dashboard even though its contents exceed the canvas area. In fixed sizing mode, if content exceeds the canvas area, the user may have to scroll to see the entire dashboard. For more information, see section 2.2.7, “About Screen Sizes,” on page 29.
Press the Ctrl key while dragging or resizing items and frames for smoother cursor movement. This disables the default snap-to-grid behavior.
Use Hide Scroll Bars for charts and small crosstabs to size the frame to match its content exactly.
24

Working with Jaspersoft Dashboards
Figure 2-4 shows how the dashboard looks at this point:
9. Click Preview. The end user view of the dashboard appears in a new tab or a new window, depending on the browser configuration.
10. Close the preview window or tab to return to the designer, and click Save Dashboard. You are prompted for the name and location for saving the dashboard.
11. Change the default name, New Dashboard to Freight Dashboard and locate a folder, such as the /Dashboards folder.
2.2.3 Adding Controls to a DashboardThe Freight Report was designed to be run with input controls. When you add a report that has input controls to a dashboard, the controls don’t appear on the dashboard until you explicitly add them, one-by-one. When the report runs, dashboard users provide input using the control. Data based on the user input appears in the dashboard. For example, using the input control, you select Mexico. The report on the dashboard shows orders from Mexican companies.
To add controls to the dashboard:1. If the Freight Dashboard created in section 2.2.2, “Creating a Simple Dashboard,” is not open, locate the /Dashboards
folder in the repository. Right-click the dashboard name and select Open in Designer from the context menu.
The Freight Dashboard appears in the designer, as shown in Figure 2-4, and the input controls for the report appear in the Special Content folder.
2. In the Available Content list, open the Special Content > Single Report Controls folder. The three input controls associated with the Freight Report appear.
3. Right-click Country and select Add to Dashboard.The Country input control and its label appear above the Freight Report on the canvas.
4. Select a new value from the Country input control. The data displayed in the Freight Report changes, but not in the Account report. The Account report does not refer to an input control named Country.
Figure 2-4 A Simple Dashboard with Sample Reports
The Open in Designer submenu opens a dashboard or an Ad Hoc report for editing in the Dashboard Designer or Ad Hoc Editor, respectively.
If you want to place the input control in a location other than above the report, drag it from the Available Content list to the desired location. You can delete, reposition, and resize the input control or its label independently.
25

JasperReports Server User Guide
5. Add the OrderID and RequestDate controls to the dashboard. In the Available Content list, right-click RequestDate, and select Add to Dashboard. Right-click OrderID, and select Add to Dashboard.
6. Ctrl-click to select the input controls and their labels.
7. Drag the controls below the Freight Report.8. Draw a selection rectangle to select the OrderID input control and its label, and drag them directly beneath the Country
input control.9. Draw a selection rectangle to select the RequestDate input control and its label, and drag them directly beneath the
OrderID input control.10. Click the OrderID label, and change it to Order.Change the RequestDate label to Date.11. In the Available Content list, navigate to Special Content > Dashboard Controls, and drag the Submit and Reset
buttons underneath the input controls on the canvas.
12. Click Save.The dashboard is saved to the repository.
2.2.4 Localizing ControlsYou can design dashboard controls to accommodate different languages. First, use the $R syntax to define prompts and static lists of values. Next, attach resource bundles to the report that contain translations of the prompts and lists of values. Finally, add the report to the dashboard. For more information about how to localize input controls, see section 5.6, “Localizing Reports,” on page 128.
Figure 2-5 shows an example of a dashboard that contains localized controls for the Freight Report. The Dashboard Viewer prompts for input in French when the user logs in using the French locale setting.
2.2.5 Adding a Custom URL to a DashboardYou can create a frame that displays URL-addressable content. Such mashups can help you leverage data from many sources in a single, integrated view. By default, the server assumes that you want to use the HTTP protocol for custom URL frames. However, you can specify that it use the FILE protocol by entering file:// at the beginning of the value in the URL. In this case, the server uses the FILE protocol, and looks for the file you specify in the server’s WEB-INF directory. This is helpful for including images.
You can use a selection rectangle or Ctrl-click to select multiple frames and items on the canvas.
By default, a dashboard automatically updates when you change the values in its input controls. When the dashboard includes the Submit button, the server doesn’t update the dashboard until you click the Submit button.
Figure 2-5 Multi-lingual Input Controls on a Dashboard
26
Working with Jaspersoft Dashboards
To add a custom URL:1. If the dashboard you saved in section 2.2.3 isn’t open, locate the Freight Dashboard, typically in the /Dashboards folder,
right-click Freight Dashboard, and select Open in Designer from the context menu.The Freight Dashboard appears in the designer, as shown in Figure 2-4.
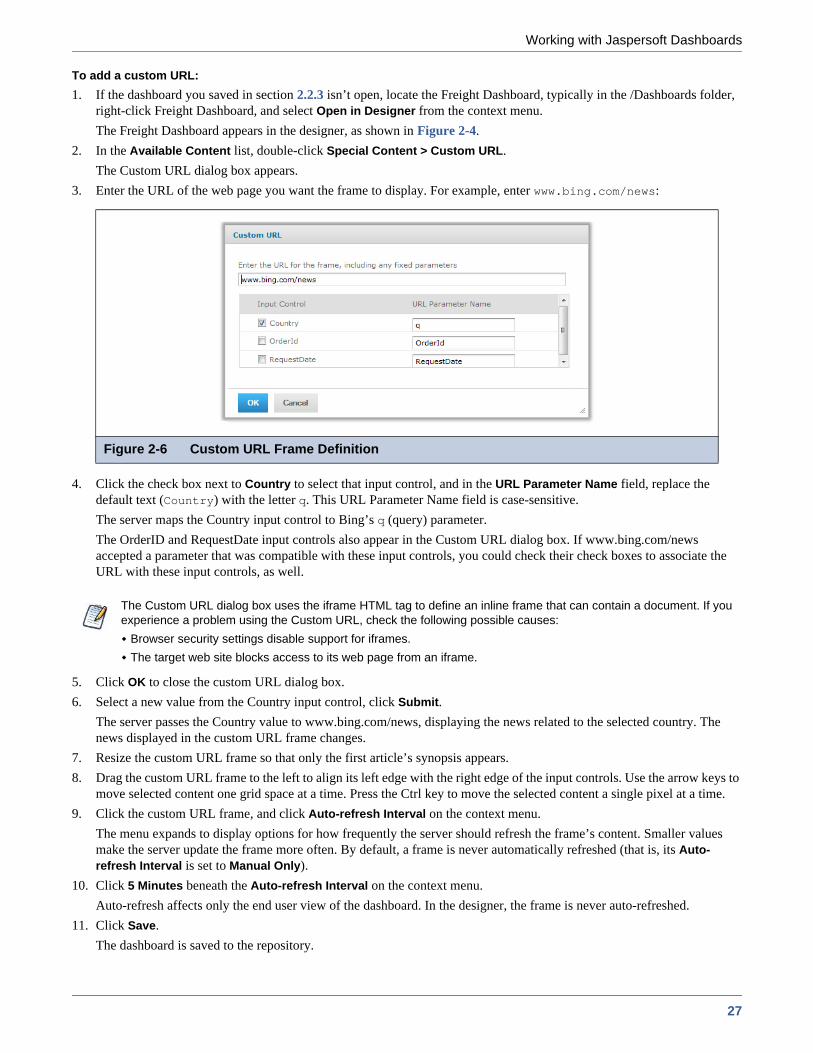
2. In the Available Content list, double-click Special Content > Custom URL.The Custom URL dialog box appears.
3. Enter the URL of the web page you want the frame to display. For example, enter www.bing.com/news:
4. Click the check box next to Country to select that input control, and in the URL Parameter Name field, replace the default text (Country) with the letter q. This URL Parameter Name field is case-sensitive. The server maps the Country input control to Bing’s q (query) parameter. The OrderID and RequestDate input controls also appear in the Custom URL dialog box. If www.bing.com/news accepted a parameter that was compatible with these input controls, you could check their check boxes to associate the URL with these input controls, as well.
5. Click OK to close the custom URL dialog box.6. Select a new value from the Country input control, click Submit.
The server passes the Country value to www.bing.com/news, displaying the news related to the selected country. The news displayed in the custom URL frame changes.
7. Resize the custom URL frame so that only the first article’s synopsis appears.8. Drag the custom URL frame to the left to align its left edge with the right edge of the input controls. Use the arrow keys to
move selected content one grid space at a time. Press the Ctrl key to move the selected content a single pixel at a time.9. Click the custom URL frame, and click Auto-refresh Interval on the context menu.
The menu expands to display options for how frequently the server should refresh the frame’s content. Smaller values make the server update the frame more often. By default, a frame is never automatically refreshed (that is, its Auto-refresh Interval is set to Manual Only).
10. Click 5 Minutes beneath the Auto-refresh Interval on the context menu.Auto-refresh affects only the end user view of the dashboard. In the designer, the frame is never auto-refreshed.
11. Click Save.The dashboard is saved to the repository.
Figure 2-6 Custom URL Frame Definition
The Custom URL dialog box uses the iframe HTML tag to define an inline frame that can contain a document. If you experience a problem using the Custom URL, check the following possible causes:
Browser security settings disable support for iframes.The target web site blocks access to its web page from an iframe.
27

JasperReports Server User Guide
2.2.6 Refining a Dashboard’s LayoutAfter completing the layout, refine the look and feel of the dashboard.
To refine the dashboard’s layout:1. If it isn’t open, locate the Freight Dashboard saved in section 2.2.5, typically in the /Dashboards folder.2. Right-click the dashboard name, select Open in Designer from the context menu, and click Preview.
The end user’s view of the dashboard appears. If the dashboard is already open in the browser, the server updates that page rather than opening a new window or tab.
3. In the Country field, select a new value. The Freight Report and custom URL frames do not update because the dashboard includes the Submit button.
4. Return to the dashboard designer and, on the canvas, hover the cursor over the Submit button. Click the hover border when it appears.
5. From the context menu, click Delete Item.The Submit button disappears.
6. Reposition the Reset button to center it in the available space, then click Click to add dashboard title.The title becomes editable.
7. Enter Orders and Current Events by Country.8. Click Preview.
The end user view of the dashboard appears.9. Change the value in the Country input control.
The dashboard reflects the change immediately:
10. Return to the dashboard designer and click Save. The dashboard is saved to the repository.
Figure 2-7 Dashboard with Sample Reports and Special Content
28

Working with Jaspersoft Dashboards
2.2.7 About Screen SizesWhen you create a dashboard, you can set the size of the canvas to match a particular screen resolution. For example, end users’ laptops display a screen resolution of 800 by 600 pixels, so you set the size of the canvas to 800 by 600 pixels to emulate the user environment.
By default, the dashboard designer supports five standard screen resolutions, which are available by clicking Options > Guide. When a dashboard uses fixed sizing, its frames do not resize automatically when the window size changes.
In addition to fixed screen resolutions, dashboards support proportional sizing. When a dashboard uses proportional sizing, its frames resize relative to the size of the browser window. Frames do not resize automatically in the designer; proportional sizing is only evident in the end user’s view of the dashboard, or when you select a new screen size in the designer.
If a dashboard that uses proportional sizing is larger than the specified screen size, when the dashboard is viewed, Jaspersoft resizes the frames to fit in the window. No scrolling is required. This may result in a change to the shape of the frames.
In proportional sizing, note that:You can resize free text items to a smaller size, but you can’t make them larger.The grid turns red when any content hangs over the edge of the canvas.
2.3 Editing a DashboardYou can edit a dashboard if you have the proper permissions.
To edit a dashboard:1. Select View > Repository and search or browse for the Dashboard you want to modify.
By default, the repository includes the /Dashboards folder where you can store dashboards. 2. Right-click the dashboard and select Open in Designer from the context menu.
The designer appears, displaying the dashboard.3. Edit the dashboard by adding, removing, resizing, or dragging content. Drag an item from the Available Content list and
drop it on an existing frame to replace the existing content.For more information about working with dashboard content, see section 2.2, “Creating a Dashboard,” on page 23.
4. When you are satisfied with the dashboard, click Save.5. To create a new version of the dashboard, select Save As from the Dashboard Selector context menu, and specify a new
name.
2.4 Tips for Designing DashboardsCharts and small crosstabs are best suited to dashboards. However, you can design table reports that work well in the dashboard. Such reports tend to be very narrow and are typically used with input controls to limit the number of rows they return.
Keep reports small because dashboards typically contain more than one. In particular, reports shouldn’t be too wide, as horizontal room is always at a premium in a dashboard. The server strips margins from an Ad Hoc report when displaying the report on a dashboard.
If you design for a screen size as large or larger than your own, try hiding the Available Content pane, or using a larger monitor to minimize horizontal scrolling.
Jaspersoft recommends that you design dashboards using fixed sizing mode, then switch to proportional sizing before you save.
29

JasperReports Server User Guide
2.4.1 Input Control TipsWhen designing input controls for a dashboard, keep these guidelines in mind:
If you want a single input control on the dashboard to control the data displayed in multiple reports, the reports themselves need parameters with the same name as the input control. For example, you might have a query-based list of employee names that can be used in both sales reports and human resources report. When defining a parameter in a report, give it a meaningful name that can be reused in other reports. Then, when two reports that include this parameter are added to the dashboard, their input controls appear as Special Content in the Available Content list. Storing such input controls in the repository encourages reuse in other reports as they are designed and added to the repository.Consider the ramifications of designing input controls to use radio buttons. A report’s input control that displays as a radio button set appears as drop-down on a dashboard. To pass a value to an external URL, the URL Parameter Name you give to the input control must match the name of a parameter that the URL can accept. The value of the input control must also be a value the URL can accept. The target URL is likely to have additional requirements and limitations. For example, the name of the parameter may be case-sensitive; in this case, the value you enter in the URL Parameter Name field is also case-sensitive. This is the case for Bing’s q parameter that is referenced in 2.2.5, “Adding a Custom URL to a Dashboard,” on page 26.
The input control must pass data that the URL can accept. Otherwise, the server may be unable to retrieve the correct data from the external URL.
2.4.2 Miscellaneous TipsWhen you create or edit a dashboard, keep these tips in mind:
Alignment of items: You can use the computer’s arrow keys to move selected content one grid space at a time. Press the Ctrl key to move the selected content a single pixel at a time.
Selection of items:The items on the context menu change depending on your selection. For example, the context menu might include the Delete Item or Delete Frame option, depending on whether you selected a button or a frame. If you select multiple items or frames, the context menu includes only options that apply to all selected items. For example, if you select a frame and a button, the context menu includes only the Delete Items option. When you select multiple frames, the context menu includes several options that can apply to the frames as a group, such as Hide All Scroll Bars and Delete Items.Select multiple frames to change their sizes all at once. When you drag the edge of one frame, the other frames resize as well.
Relocated or deleted reports in dashboards:When you delete a report with input controls from the dashboard, the controls are also deleted, but their labels remain. Delete labels manually. If a custom URL frame is mapped to a deleted input control, the server shows the default URL but does not pass the parameter.Keep track of reports used in dashboards to prevent inadvertent deletion. The server deletes a report from a dashboard when you delete it from the repository or move it to a new location.
Embedded dashboards:A dashboard can include other dashboards, unless this creates a circular dependency. Do not attempt to add a dashboard to itself.Multiple reports in a dashboard that refer to the same input control are controlled by that single input control. If you want users to set the input controls separately for each report, create two dashboards, both of which refer to the input control; then, create a third dashboard that includes the other two. Adding the same dashboard twice to a parent dashboard can create a compelling comparison, as shown in Figure 2-8:
30

Working with Jaspersoft Dashboards
Figure 2-8 A Dashboard Comparing Data from Two Countries
31

JasperReports Server User Guide
32

Running Reports and the Report Viewer
CHAPTER 3 RUNNING REPORTS AND THE REPORT VIEWER
JasperReports Server makes it easy to run reports. When you run a report, it opens in the interactive Report Viewer. With the Viewer, you can personalize and refine the displayed report data. If the report has input controls, you run the report with one set of data and then another. Using the report scheduler, you can run reports repeatedly and unattended during off hours or at other times.
This chapter contains the following sections:Overview of The Report ViewerRunning or Creating a Simple ReportRunning a Flash ChartRunning a Report with Input Controls or FiltersScheduling ReportsEvent Messages
The tutorials in this chapter and throughout this guide assume you’ve installed the sample data provided with the server.
3.1 Overview of The Report ViewerThe Report Viewer allows you to view a report, export content to various output formats, and apply formatting, sorting, and filters to control how the data is displayed.
This section describes the functions available in the Report Viewer. You can find more detailed information about using this functionality throughout this chapter.
To open a report in the Report Viewer:1. Locate your report in the library or repository.2. Click the report name, or right-click the report name and select Run. In the repository, you can also click the report row
and select Run from the tool bar.The report opens in the Report Viewer.
33

JasperReports Server User Guide
3.1.1 The Report Viewer Tool barThe Report Viewer toolbar contains a number of controls for working with your report. These controls are described in Table 3-1.
Table 3-1 Report Viewer Tool Bar Icons
Icon Name Description
Refresh report with latest data
Click this icon to refresh the report data against the data source.
First Click this icon to jump to the first page of the report.
Previous Click this icon to go to the previous page in the report
Current Page Pagination controls. Displays the page of the report currently displayed.
Next Click this icon to go to the next page in the report.
Last Click this icon to jump to the last page of the report.
Back Exits the Report Viewer and takes you to the previous screen.
Save Place the cursor over this icon to open a menu of save options.
Export Click this icon to export the View into one of the available formats.
Undo Click this icon to undo the most recent action.
Redo Click this icon to redo the most recently undone action.
Undo All Click this icon to revert the report to its state when you last saved.
Input Controls Click this icon to see the input controls applied to this report. For more information, refer to section 3.8.1, “Simple Input Controls,” on page 47.
34

Running Reports and the Report Viewer
3.1.2 Column MenuReports that contain table components are enabled for user interactivity. Table components are defined in iReport, Jaspersoft Studio, or tables from Ad Hoc Views. When a table is enabled for interactivity, then column formatting, filtering, and sorting is managed from a menu displayed by clicking on the column you want to apply changes to. These menu icons are described in Table 3-6.
3.1.3 Data SnapshotsSome reports have an optional Data Snapshot feature enabled. A Data Snapshot is a cached copy of the data included in a specific report. Data Snapshots allow you to access a report's data (including input control settings) without having to retrieve it from the data source, which in some cases can save a significant amount of time.
When a report is opened in the Report Viewer, data is retrieved from the Data Snapshot. If the Snapshot does not exist, then a live query is made to the data source. A Snapshot is created when a report is saved from the viewer, or via the scheduler. The Report Viewer UI displays a date and time stamp that indicates when the report data was last refreshed with live source data.
It should be noted that a report can have only one Snapshot. For instance, if you edit and save a report that already has a Snapshot associated with it, a new Snapshot is created. that Snapshot overwrites the existing, previously-created Snapshot.
3.2 Running or Creating a Simple ReportYou can view and work on a report in the Report Viewer in a number of ways:
Running an instance of an existing reportCreating a new report from an existing Ad Hoc view
3.2.1 Running a Simple ReportThis section describes how to run a tabular report that lists account data.
Table 3-2 Column Formatting Icons
Icon Name Description
Formatting/Show column/Hide column Select Formatting to open the Format Column box.Select Show column or Hide column to show or hide the column.
Column filters Click to open the Filter column box.
Sort ascending Click to sort fields on the selected column in ascending order.
Sort descending Click to sort fields on the selected column in ascending order.
Column size Click and drag this icon to make columns wider or narrower.
The system administrator can enable or disable the Data Snapshot feature.
35

JasperReports Server User Guide
To run a report:1. Log into the server as an administrator, such as jasperadmin.2. On the Home page, click View Reports.
The search results appear, listing your own files and other files that your user account has permission to view. If you log in as jasperadmin, the Accounts Report appears in the search results.
3. To run a report, click the name of a report in the repository. For example, click Accounts Report. The report appears, as shown in Figure 3-2.
3.2.2 Creating a ReportYou can create a report directly from the Jaspersoft Server Home page. This method allows you to select an existing Ad Hoc view and generate a report from it, without going through the Ad Hoc Editor.
Figure 3-1 Search Results Listing
Figure 3-2 Output of the Accounts Report
If you are running a report with multiple pages, the first page of the report appears before the entire report is loaded. You can begin scrolling through report pages as they load, as indicated in the pagination controls in the upper left corner of the Report Viewer. If you want to cancel loading the report before it is complete, click the Cancel Loading button that appears next to the pagination controls.
36

Running Reports and the Report Viewer
To create a report from the Home page:1. On the Home page, click Create Report.
The Create Report wizard opens.2. Select the Ad Hoc view you want to use as the basis for your report, and click OK.3. If asked, enter the input controls needed. See 4.7.2, “Using Input Controls,” on page 91.
You can now begin working with your report.
3.3 Getting New Perspectives on DataThe report shown in Figure 3-2 was created in iReport using the Table Component. As this type of report runs, you can interact with it in the Report Viewer to visualize the data in different ways. Column formatting allows you to highlight certain columns and fields, and filtering and sorting report output on-the-fly can provide timely views of the data that answer your questions. For example, suppose you’re running the Accounts Report and want to know how many accounts have offices nearby. Highlighting the phone number column with red text and filtering it to show only accounts in your area code would reveal this data.
3.3.1 Column FormattingYou can customize the basic formatting of column headings and fields, using the Format Column dialog. To launch this
window from the Report Viewer, Move your mouse over and click Formatting...
The Format column dialog appears, as shown in Figure 3-3.
From the Format Column dialog, you can format a column’s headings or values, or apply conditional formatting to a column.
This section discusses how to apply formatting to column headings and values. For information on conditional formatting, see section 3.3.2, “Conditional Formatting,” on page 38
Column formatting options include:Text Font type, size, and styleBackground colorFont color
Figure 3-3 Format Column Dialog
37
JasperReports Server User Guide
Text alignment
To customize your column formatting:1. Run your report, so it opens in the Report Viewer.2. Click the header or field of the column you want to format.
3. Move your mouse over and click Formatting...
4. To format a column’s heading, click the Headings tab, and change the following options if needed:Heading text – Type new heading text to replace the current text.Font – Scroll through the menu to select a font.Size – Scroll through the menu to select a font size.Style – Click to select Bold, Italic, or Underlined text.Background Color – Click to open the background color picker, then click to select the background color.Font Color – Click to open the font color picker, then click to select the text color.Alignment – Click to select Left, Center, or Right alignment.
5. To format the text in a column’s fields, click the Values tab, and change the following options if needed:Font – Scroll through the menu to select a font.Size – Scroll through the menu to select a font size.Background Color – Click to open the background color picker, then click to select the background color.Font Color – Click to open the font color picker, then click to select the text color.Alignment – Click to select Left, Center, or Right alignment.
6. Click OK.
3.3.2 Conditional FormattingThe Report Viewer allows you to format column headings and fields, to highlight data that meets specific criteria. For instance, if you want to call out fields for store sales above $100,000, you can do so by applying text and background formatting to those stores that meet those numbers.
With conditional formatting, you can apply the formatting options listed in section 3.3.1, “Column Formatting,” on page 37. However, it is a slightly more complex process than applying formatting options to entire columns. This section describes those complexities, including:
Condition hierarchyCondition button statesApplying conditional formatting
3.3.2.1 Condition Hierarchy
If you have multiple conditions applied to a single field, their order will affect how they function. Conditions are read and applied from bottom to top, and the topmost condition overrides the one(s) below.
For example, imagine you have more than one condition applied to the same format element: red text for all stores over 20,000 square feet, and blue text for all stores over 30,000 square feet. As shown in Figure 3-4, “Condition Hierarchy Example,” on page 39, placing the formatting rule for stores over 20,000 above the rule for stores over 30,000 causes the topmost rule to override the one below:
38

Running Reports and the Report Viewer
3.3.2.2 Condition Button States
Because conditions higher up in the hierarchy can affect those below, the font style selection buttons each have three states:Unchanged, which means it inherits the previous condition-based style, if any.Set, which means the style is applied to text that meets the condition.Not Set, which means the style is not applied to the text that meets the condition, and is removed if a conflicting condition lower in the conditional formatting hierarchy has marked that style as “Set”.
By default, the buttons are in the “Unchanged” state. Clicking the buttons toggles you through the three states.
See Table 3-3, “Style Button States,” for examples of the style button states.
Hierarchy Result
Figure 3-4 Condition Hierarchy Example
Table 3-3 Style Button States
Unchanged Set Not Set
Bold
Italic
Underline
39
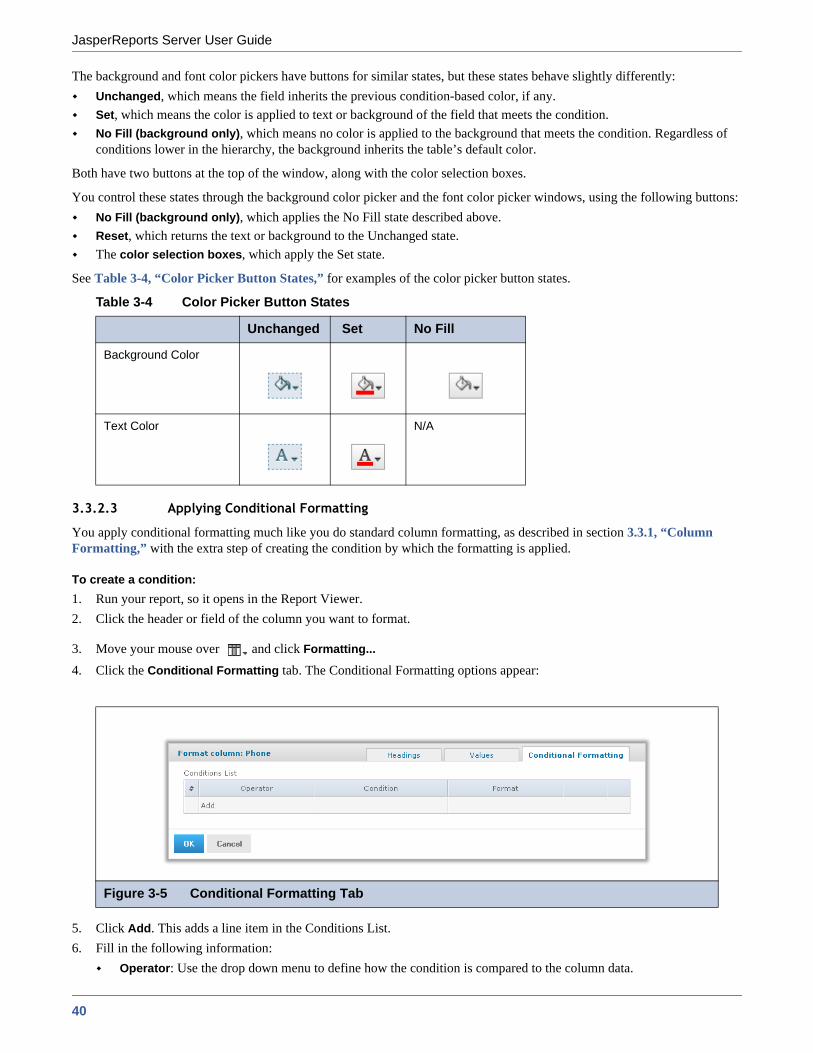
JasperReports Server User Guide
The background and font color pickers have buttons for similar states, but these states behave slightly differently:Unchanged, which means the field inherits the previous condition-based color, if any.Set, which means the color is applied to text or background of the field that meets the condition.No Fill (background only), which means no color is applied to the background that meets the condition. Regardless of conditions lower in the hierarchy, the background inherits the table’s default color.
Both have two buttons at the top of the window, along with the color selection boxes.
You control these states through the background color picker and the font color picker windows, using the following buttons:No Fill (background only), which applies the No Fill state described above.Reset, which returns the text or background to the Unchanged state.The color selection boxes, which apply the Set state.
See Table 3-4, “Color Picker Button States,” for examples of the color picker button states.
3.3.2.3 Applying Conditional Formatting
You apply conditional formatting much like you do standard column formatting, as described in section 3.3.1, “Column Formatting,” with the extra step of creating the condition by which the formatting is applied.
To create a condition:1. Run your report, so it opens in the Report Viewer.2. Click the header or field of the column you want to format.
3. Move your mouse over and click Formatting...
4. Click the Conditional Formatting tab. The Conditional Formatting options appear:
5. Click Add. This adds a line item in the Conditions List.6. Fill in the following information:
Operator: Use the drop down menu to define how the condition is compared to the column data.
Table 3-4 Color Picker Button States
Unchanged Set No Fill
Background Color
Text Color N/A
Figure 3-5 Conditional Formatting Tab
40

Running Reports and the Report Viewer
Condition: Enter the condition criteria.Format: Select the formatting applied to fields meeting the defined condition. Take care setting the button states, as described in section 3.3.2.2, “Condition Button States,” above.
7. Repeat if needed to add multiple conditions to a column.If you have multiple conditions, you may want to reorder them, to ensure they do not conflict with each other. Use the
and to move conditions in the hierarchy.8. Click OK. The condition is applied to the column.
3.3.3 Interactively Filtering Report OutputIf the report output contains more information than you want, interactively filter it to display just what you need. You conditionally filter report output by first selecting the column to use as a basis for filtering. Next, you enter a filter condition, then a value for comparison. The server compares each field of the column to the value that meets the condition. Table 3-5 lists the conditions you can select for each type of column: numeric, date, and text.
To interactively filter report data:1. As you run the type of report shown in Figure 3-2, click the column you want to use for filtering the report. Continuing
with the example in section 3.2, click the Phone column in the Accounts report.
2. Click the .The Filter column dialog appears, as shown in Figure 3-6. By default, Show all rows is selected.
3. To build your filter, click the radio button to select Show only rows where.the comparison operator drop-down and value entry box become active.
4. Select a comparison operator from the drop-down. For example, select Starts with to compare phone numbers starting with certain numbers.
5. Enter a value for comparison with the data in the column. For example, enter the area code: 408-
Table 3-5 Interactive Filtering Conditions
Numeric Date Text
Equals Equals Equals
Does not equal Is not equal to Is not equal to
Greater than Is between Contains
Greater than or equal to Is not between Does not contain
Less than Is on or before Starts with
Less than or equal to Is before Does not start with
Is between Is on or after Ends with
Is not between Is after Does not end with
Figure 3-6 Filter Column Dialog
41
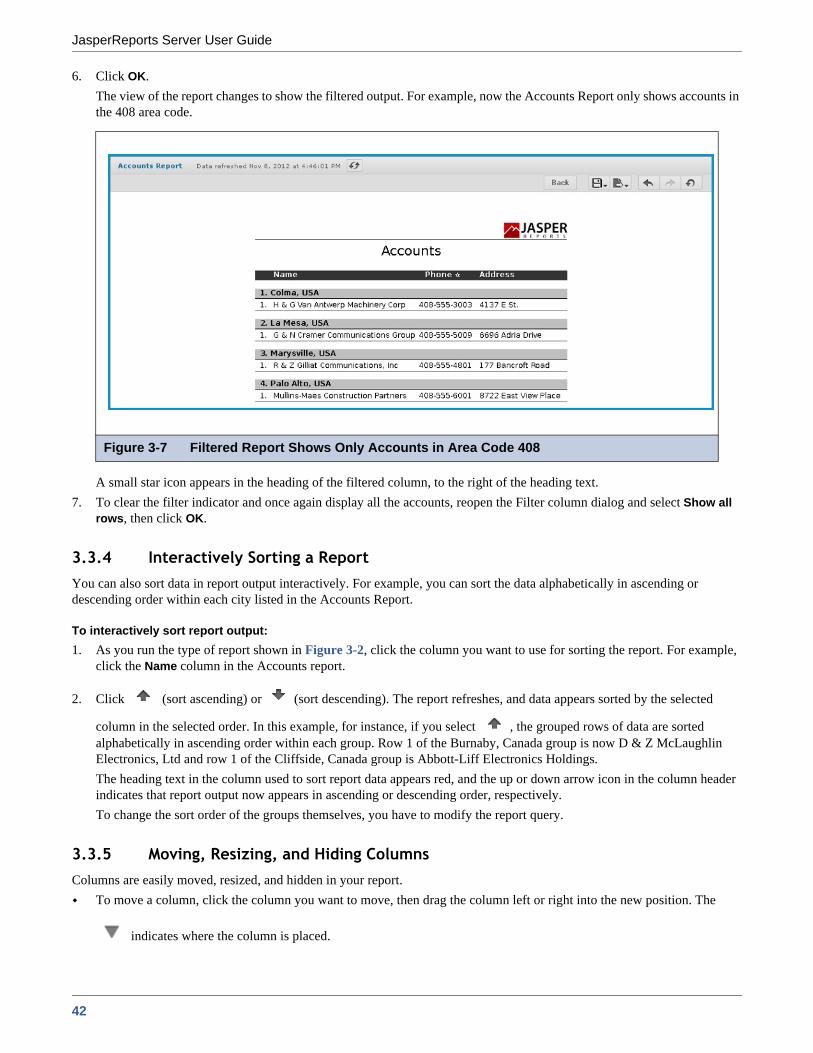
JasperReports Server User Guide
6. Click OK.The view of the report changes to show the filtered output. For example, now the Accounts Report only shows accounts in the 408 area code.
A small star icon appears in the heading of the filtered column, to the right of the heading text. 7. To clear the filter indicator and once again display all the accounts, reopen the Filter column dialog and select Show all
rows, then click OK.
3.3.4 Interactively Sorting a ReportYou can also sort data in report output interactively. For example, you can sort the data alphabetically in ascending or descending order within each city listed in the Accounts Report.
To interactively sort report output: 1. As you run the type of report shown in Figure 3-2, click the column you want to use for sorting the report. For example,
click the Name column in the Accounts report.
2. Click (sort ascending) or (sort descending). The report refreshes, and data appears sorted by the selected
column in the selected order. In this example, for instance, if you select , the grouped rows of data are sorted alphabetically in ascending order within each group. Row 1 of the Burnaby, Canada group is now D & Z McLaughlin Electronics, Ltd and row 1 of the Cliffside, Canada group is Abbott-Liff Electronics Holdings.The heading text in the column used to sort report data appears red, and the up or down arrow icon in the column header indicates that report output now appears in ascending or descending order, respectively.To change the sort order of the groups themselves, you have to modify the report query.
3.3.5 Moving, Resizing, and Hiding ColumnsColumns are easily moved, resized, and hidden in your report.
To move a column, click the column you want to move, then drag the column left or right into the new position. The
indicates where the column is placed.
Figure 3-7 Filtered Report Shows Only Accounts in Area Code 408
42

Running Reports and the Report Viewer
To resize a column, click the column you want to resize, then drag the until the column is the size you want.
To hide a column, click the column you want to hide, then move your mouse over the and select Hide column.
3.4 Navigating the ReportIf your report has multiple pages, you can use the pagination controls to move through the report quickly.
To navigate the published report:
Use at the top of the Report Viewer to navigate to the previous page.
Use to navigate to the next page.
Use to go to the end of the report.
Use to go to the beginning of the report.If you know the number of the page you want to view, enter the page number in the Current Page indicator box.
3.5 Exporting the Report
To export the report:1. To view and save the report in other formats, click the Export button.2. Select an export format from the drop-down. Table 3-6 lists the export options.
Table 3-6 Export File Types
Option Format Name Usage
PDF Adobe Acrobat To prevent horizontal truncation of an Ad Hoc report when exported, set the Actual Size option in the Ad Hoc Editor.
Excel (Paginated) XLS Not recommended for exporting most tables or crosstabs. Repeats headers and footers on each page.
Excel XLS Ignores page size and produces spreadsheet-like output.
CSV Comma Separated Values Characters outside the Latin 1 character set can cause the Excel spreadsheet to look unacceptable. Try saving the file and importing it using Excel's Import functionality.
DOCX Word Do not export reports having more than 63 columns. In Microsoft Word, you cannot create tables having more than 63 columns.
RTF Rich Text Format Creates a large output file and, therefore, takes longer to export than PDF, for example.
Flash Flash Viewer Exports the report to the Flash viewer. Does not output an SWF file.
ODT OpenDocument Text For best results, minimize the number of rows and columns and make sure they don’t overlap.
ODS OpenDocument Spreadsheet
Same as ODT.
43
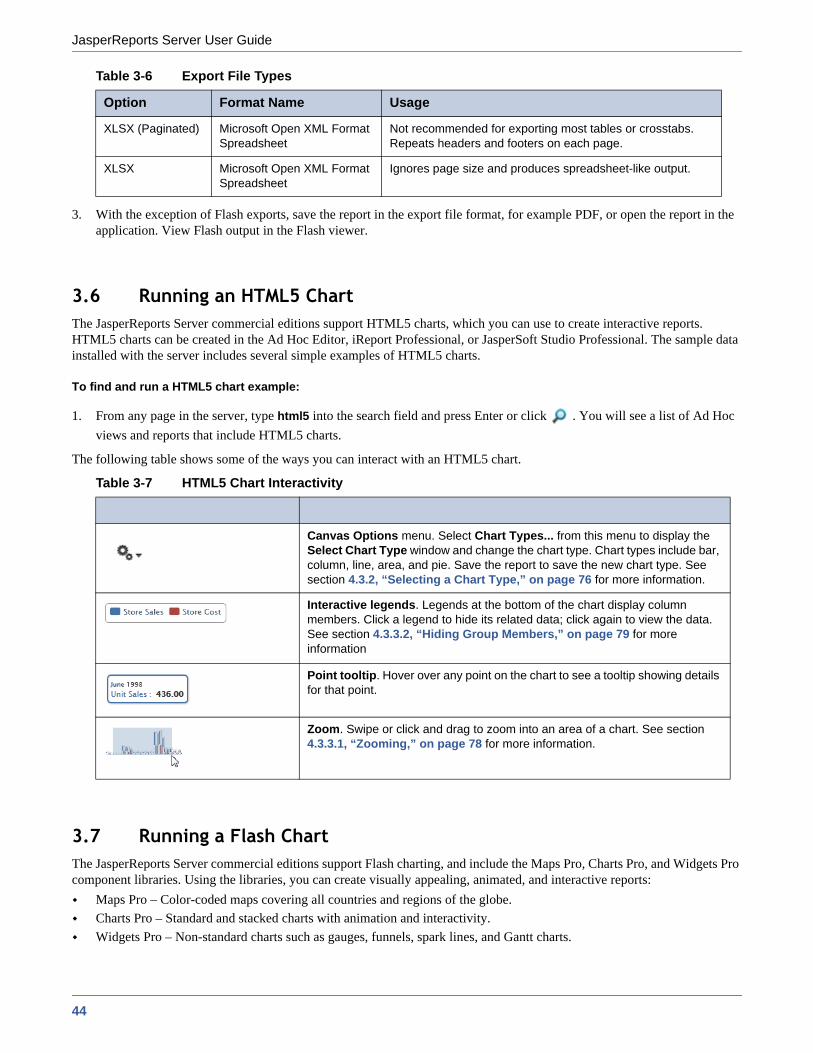
JasperReports Server User Guide
3. With the exception of Flash exports, save the report in the export file format, for example PDF, or open the report in the application. View Flash output in the Flash viewer.
3.6 Running an HTML5 ChartThe JasperReports Server commercial editions support HTML5 charts, which you can use to create interactive reports. HTML5 charts can be created in the Ad Hoc Editor, iReport Professional, or JasperSoft Studio Professional. The sample data installed with the server includes several simple examples of HTML5 charts.
To find and run a HTML5 chart example:
1. From any page in the server, type html5 into the search field and press Enter or click . You will see a list of Ad Hoc views and reports that include HTML5 charts.
The following table shows some of the ways you can interact with an HTML5 chart.
3.7 Running a Flash ChartThe JasperReports Server commercial editions support Flash charting, and include the Maps Pro, Charts Pro, and Widgets Pro component libraries. Using the libraries, you can create visually appealing, animated, and interactive reports:
Maps Pro – Color-coded maps covering all countries and regions of the globe.Charts Pro – Standard and stacked charts with animation and interactivity.Widgets Pro – Non-standard charts such as gauges, funnels, spark lines, and Gantt charts.
XLSX (Paginated) Microsoft Open XML Format Spreadsheet
Not recommended for exporting most tables or crosstabs. Repeats headers and footers on each page.
XLSX Microsoft Open XML Format Spreadsheet
Ignores page size and produces spreadsheet-like output.
Table 3-7 HTML5 Chart Interactivity
Canvas Options menu. Select Chart Types... from this menu to display the Select Chart Type window and change the chart type. Chart types include bar, column, line, area, and pie. Save the report to save the new chart type. See section 4.3.2, “Selecting a Chart Type,” on page 76 for more information.
Interactive legends. Legends at the bottom of the chart display column members. Click a legend to hide its related data; click again to view the data. See section 4.3.3.2, “Hiding Group Members,” on page 79 for more information
Point tooltip. Hover over any point on the chart to see a tooltip showing details for that point.
Zoom. Swipe or click and drag to zoom into an area of a chart. See section 4.3.3.1, “Zooming,” on page 78 for more information.
Table 3-6 Export File Types
Option Format Name Usage
44

Running Reports and the Report Viewer
These components are based on Fusion libraries and generate Flash output that is embedded in the HTML and PDF output. When a report containing a Maps, Charts, or Widgets Pro element is exported in a format other than HTML or PDF, the space used by the element remains blank.
To view a Maps, Charts, and Widgets Pro element in the server, install Flash Player. You might need to install plug-ins or enable Flash on the browser. To view Flash elements in PDF output, use a Flash-enabled PDF viewer such as Adobe Reader.
Flash charts are created in iReport Designer Professional as JRXML reports and uploaded to the repository as a report unit. JasperReports Server cannot create Flash charts. The sample data installed with the server includes several simple examples of Flash charts.
To find and run a Flash chart example:
1. From any page in the server, type flash into the search field and press Enter or click .
The search results include Flash Chart Report, Flash Map Report, Flash Widget Report, and the Open Flash Charts Report, an experimental report that uses a different Flash library from the Charts Pro, Maps Pro, and Widgets Pro components, which are fully supported by Jaspersoft.
2. Click a Flash report other than the Open Flash Charts Report. For example, open the Flash Map Report:
The color-shaded states correspond to value ranges defined by the legend.Flash reports launch in the Report Viewer, as do other types of reports. However, Flash charts can be animated as they are drawn, giving them greater visual appeal. Flash charts are also interactive.
3. To interact with the map, mouse-over any of the states on the map to see the full state name and, when data exists, the value for that state:
Figure 3-8 Output of the Sample Flash Map Report
45

JasperReports Server User Guide
4. Next, search for Flash reports again. This time, select the Flash Widget Report.
5. To edit the pyramid widget, click a segment to separate it from the others. These simple examples with arbitrary data show how Maps, Charts, or Widgets Pro components can present several layers of information in compelling ways.
Flash reports include the following features:Text, including labels in maps, charts, or widgets, that can be localized because the report is written in JRXML. For more information about uploading resource bundles for Maps, Charts, or Widgets Pro components, see the iReport Ultimate Guide.Chart elements, map regions, and widget segments can link to reports that provide details. Depending on the security settings in the Flash Player, you may need to enable links.
For information about creating Flash charts, see the iReport Ultimate Guide. To upload JRXML reports, see Chapter 5, “Adding Reports Directly to the Repository,” on page 101.
3.8 Running a Report with Input Controls or FiltersThe server filters the data in the report output when you run a report with an input control. The perfect input control limits the data to what you want to see—and nothing more. When you run a report based on a Domain Topic that defines a filter, the server can render the filter as an input control.
If your system administrator has enabled the Data Snapshot feature (described in section 3.1.3, “Data Snapshots,” on page 35), it is important to note that the default input controls - that is, the input controls as defined when the original iReport- or Ad Hoc View-based report is run - will overwrite any changes made to them the next time you run a report. For instance, suppose you run a report, update the input controls, then save the report. At a later date, you run a report from the iReport or Ad Hoc View source again. That new report will replace the report you ran earlier, and your input control changes will be lost.
To avoid this, save your updated reports with a different name than the default. That way, when subsequent reports are run from the same source, they will not overwrite your report (unless they are given an identical name when saved).
Figure 3-9 Output of the Sample Flash Widget Report
46

Running Reports and the Report Viewer
3.8.1 Simple Input ControlsThe Freight Report example has three input controls:
CountryRequest DateOrder ID
Using input controls, you run the report with one set of data and then another. When saved, an instance of the report with alternate input controls is called a Report Version, and is labeled as such in the repository.
To run a report with simple input controls:
1. In the search field, enter freight and click .2. In the list of search results, click the name, Freight Report.
The report shows data about orders numbered 10600 and above, shipped to Mexico after June 1, 1997.
3. To run the report with other input option values, click .
Figure 3-10 Freight Report Showing Mexican Data
47

JasperReports Server User Guide
The Input Controls dialog appears:
4. Select USA in the Country field, and click OK.
The report shows data for the USA instead of Mexico:
5. Click to display Input Controls again. Click Save.You are prompted to name the new set of values.
6. Enter USA as the new name.7. To save the set of input options, click Save.
Figure 3-11 Default Input Controls
The Apply button refreshes the report with the new data, but keeps the Input Controls dialog open.
Figure 3-12 Freight Report Showing USA Data
48

Running Reports and the Report Viewer
The Input Controls dialog box reappears.A drop-down list showing USA as a set of saved values appears in the Input Controls Used saved values menu.
8. In Input Controls, click OK.
9. In the Report Viewer, click the Back button to display the search results page.
10. In search results, click the icon next to Freight Report to display the link to the saved, USA version of the report:
11. Add a description to the saved version of the report: a. In the search results page, right-click the saved version, USA, and select Properties from the context menu.b. In the Properties dialog box, enter a description for the saved version of the report:
12. Click Submit.The new description appears below the report when you refresh the display.
3.8.2 Cascading Input ControlsCascading input controls in a report reduce a large number of choices to a manageable number. A single value chosen for a cascading input control determines which other values appear as choices for input. For example, the choice of a country
The Reset button in Input Controls restores the default input values, set during the report design.
Figure 3-13 Input Controls With a List of Saved Values
Figure 3-14 The New Version of the Report in the Search Results
You can click the name of the saved version, for example USA, to run the report using the saved input control values,
49

JasperReports Server User Guide
determines which states or regions are listed as choices. For more information, see section 5.3.3, “Selecting a Data Source for Running the Complex Report,” on page 124.
To run a report with cascading input controls:
1. In the Search field at the top of any JasperReports Server page, enter cascading and click .The search results are displayed in the repository.
2. In the search results, click the name Cascading multi select example report.The report runs, and appears with the Options panel open on the left side of the Report Viewer
3. In the Options panel’s Country multi select drop-down, select a different country, for example Mexico.The other drop-downs in the Input Controls dialog box are automatically updated with Mexican data.
4. In the Cascading state multi select control drop-down, select a different state, for example Guerrero.The Cascading name single select drop-down is updated to list accounts in Guerrero.
5. Click Apply to run the report with the chosen values.The report creates a list of all account names in the chosen states. The report lists the account name chosen in the Cascading name single select input control at the top.
As with simple input controls, you can save these Options settings as a new Report Version. To do this, click Save to open the Save Values dialog. Name the new version, then click Save.
3.9 Scheduling ReportsUsing the report scheduler wizard, you set up a job, report parameters, and output options:
Set up a job – A job name, when to run the job, and how oftenReport parameters – If the report was designed with input controls, which parameters the job will use
Cascading input controls are implemented as queries that access the database to retrieve the new values. The server displays an activity monitor while the query is running, and in the case of long queries, you can click Cancel and select different values.
Figure 3-15 Cascading Input Controls
The report design defines country and state input controls as multi-select; users can Ctrl-click to select multiple values in such lists.
50
Running Reports and the Report Viewer
Output options – Where to store the output, in which formats, the locale, and email options for sending the output as an attachment
Jobs that you schedule run the reports in the background so you can use the server while the report runs.
The permissions of the user who schedules a job determine the data that the report exposes. For example, Gloria only has access to inventory data from the Southeast US region. A report that she schedules only shows data from that region, even when the report is viewed by users in other regions. Other users schedule the report themselves to see the data for their own regions.
3.9.1 Setting Up a Job
To set up a job:1. On the Home page, click View Reports; or from any page, click View > Repository.2. Use the search field or browse the list of reports to find the report you want to schedule.
3. Right-click the report and select Schedule... from the context menu. The Scheduled Jobs page appears, as shown in Figure 3-19.
4. Click Schedule Job.The Set Up the Job page of the Scheduler wizard appears.
5. In the Job Name field, enter a name for the job, for example, Weekly Report. The description is optional.6. Set these schedule attributes:
Start: Immediately or in the future. Click to select a future start date and time. If you don’t specify recurrence, the start date and time determines when the report runs. If you specify recurrence, you may still want to delay the first report date, for example a weekday report that you want to start next week.Time Zone: Specify the time zone for the schedule. The default time zone is the time zone of the server, the time zone you entered at log in. If you’re in a different time zone, set this field accordingly.Recurrence: Choose one of the following settings:
None: Run the report once.Simple: Schedule the job to recur at an hourly, daily, or weekly interval.Calendar: Schedule the job to recur on days of the week or days of the month.
Sensitive data could be exposed to unauthorized users if you schedule a job as an administrative user with no data restrictions because the report will contain all requested data in the data source. Any user who receives the report can view all the data regardless of the user’s access restrictions.
If the report already has a schedule that you want to add, modify, or delete, click beside the report name.
51

JasperReports Server User Guide
Figure 3-16 shows a job set to run immediately, no recurrence:
7. Schedule the job to start at a specific time:a. In Start Job, select On.
b. Click . The calendar appears.
c. Click a date.d. To set the time for the job to run, at the bottom of the calendar, repeatedly click the hours and minutes. To close the
calendar, click a blank spot on the Scheduler page.The selected date for starting the job appears in the calendar field.
e. In Recurrence, accept the default setting, None to run the report only once.
8. Click Next.
Figure 3-16 Set Up the Job Page
If you select Simple or Calendar Recurrence, additional controls appear on the page. For details, see section 3.9.6, “Running a Job Repeatedly,” on page 56.
52

Running Reports and the Report Viewer
If the report you are scheduling has input controls that prompt for user input, the Set the Parameter Values page appears:
Saved values, if there are any, appear in a drop-down list at the top of the page, as shown in Figure 3-17. In the Use saved values drop-down, you can set the input controls defined for the report you’re scheduling. You can set the input values for the scheduled report, and click Save Current Values to save the input value as a named set of values. For more information about using saved values and saving input values, see section 3.8, “Running a Report with Input Controls or Filters,” on page 46.
9. Choose a set of saved values, or set the input controls. This example uses the saved values for USA.10. Click Next.
The Output Settings page, shown in Figure 3-18, appears.11. Set output options, as described in the next section, and click Submit to schedule the job.
3.9.2 Setting Output OptionsOn the Output Details page, you can change these settings:
Base Output File Name – The name of the file as it appears in the repository.Output Description – The optional description of the file that appears to users who view the repository.Output Format – The available output formats. Select one, or accept the default format, PDF. When you select more than one, each format is stored as a separate file in the repository and attached as a separate file to the email notification.Output Locale – The locale settings for generating the report. The report must support locales, for example a report based on a Domain with language bundles (see section 8.3, “Security and Locale Information for a Domain,” on page 218).To – One or more email addresses separated by commas for sending email notification.
Subject – The subject line of the notification email.
Figure 3-17 Set the Parameter Values Page for Scheduling a Report
By default, the mail server is not configured by the JasperReports Server installer. To send email notifications, the administrator must configure the mail server, as described in the JasperReports Server Installation Guide.
53

JasperReports Server User Guide
Message – Content of the notification email. Attach Files – A check box option that, if checked, sends the output of the report with the email notification.
Skip Empty Reports – A check box option that, if checked, prevents the server from attaching empty report output files to email notification when report execution fails. Output Location – The folder for saving the report output. This field is required and you must have write permission to the folder. Sequential File Names – Appends a timestamp to the names of files created by the job. Useful for the output of recurring jobs or for time-sensitive reports where the output must be dated. When the timestamp is used, the output filename is <basename>-<timestamp>.<extension>.Timestamp Pattern – An optional pattern for the timestamp, based on the java.text.SimpleDateFormat. Valid patterns for report output files can only contain letters, numbers, dashes, underscores, and periods. The default pattern is yyyyMMddHHmm, for example 200906150601.
For more information about the valid patterns for this field, refer to:http://download.oracle.com/javase/6/docs/api/java/text/SimpleDateFormat.html
Overwrite Files – A check box option that, if checked, overwrites old output files with newer ones of the same name. Useful when you do not have sequential filenames, or you specify a timestamp pattern that may lead to identical filenames.
When you click Submit, the job appears in the list of scheduled jobs.
Be careful when sending reports containing sensitive data by email.
Figure 3-18 Output Page for Scheduling a Report
54

Running Reports and the Report Viewer
3.9.3 Viewing the List of Scheduled Jobs
Scheduled jobs appear in the repository with a icon beside the report name. To view the list of scheduled jobs for a report, locate a report in the repository, right-click the report, and select Schedule from the context menu. The Scheduled Jobs page appears for the report.
Typical users only see the jobs that they have defined themselves; administrators see the jobs defined by all users. In Figure 3-19, Joe User has scheduled two jobs for the Employees Report.
The Scheduled Jobs page shows the internal ID number of the job, the user (owner) who created the job, and the state of the job. Job states are:
Normal – The job is scheduled. Running – The server is generating the report output. Complete – The server has finished running the job and placed output to the repository.Error – The scheduler encountered an error while scheduling or triggering the job. This doesn’t include cases where the job is successfully triggered, but an error occurs while it runs.
The Scheduled Jobs page includes two controls:Edit – Changes the schedule.Remove – Cancels the scheduled job. When the server receives a request to delete a job that is running, the server completes running the job before deleting it.
Buttons on the Scheduled Jobs page include:
3.9.4 Changing Job SchedulesWhen the start date for a job has passed, start a new job rather than changing the start date.
To edit a scheduled job:1. Open the Scheduled Jobs page for the report, as described in section 3.9.1, “Setting Up a Job,” on page 51.2. Click Edit in the row of the job you want to change.3. Make the changes on the Job Details, Schedule, Parameters, and Output pages.4. Click Save. The update occurs immediately.
Figure 3-19 The Scheduled Jobs Page for the Freight Report
Button Description
Back Returns to the list of reports.
Schedule Job Opens the Job Details page to define a new job.
Run Now Runs the report in the background, allowing you to continue working in the server. See section 3.9.7, “Running a Job in the Background,” on page 58.
Refresh List Refreshes the list of jobs, for example to see if a job has finished running.
55

JasperReports Server User Guide
3.9.5 Stopping a Job from RunningTo stop a job from running, delete it.
To delete a scheduled job:1. Open the Scheduled Jobs page for the report, as described in section 3.9.1, “Setting Up a Job,” on page 51.2. In the row of the job you want to delete, click Remove.
3.9.6 Running a Job RepeatedlyTo run reports automatically on a regular basis, select simple or calendar recurrence on the Set Up the Job page:
Simple recurrence repeatedly runs the job at an hourly, daily, or weekly interval, and is quick to set up. Calendar recurrence involves more settings: time of day, days of the week, or days of the month, and months of the year.
Figure 3-20 shows an example of how to set simple recurrence.
Simple recurrence options are:Repeat every – The interval between jobs, in minutes, hours, days, or weeks.Indefinitely – Runs until you delete the job.Times – Runs the specified number of times.Until – Runs until a calendar date is reached. Click the calendar icon, , to select the date.
Figure 3-20 Simple Recurrence Settings
If your server recognizes Daylight Savings Time (DST), jobs scheduled using simple recurrence may seem to occur one hour later (when DST ends) or one hour earlier (when DST begins). If you want jobs to recur at the same time of day and respect DST adjustments, use calendar recurrence.
56
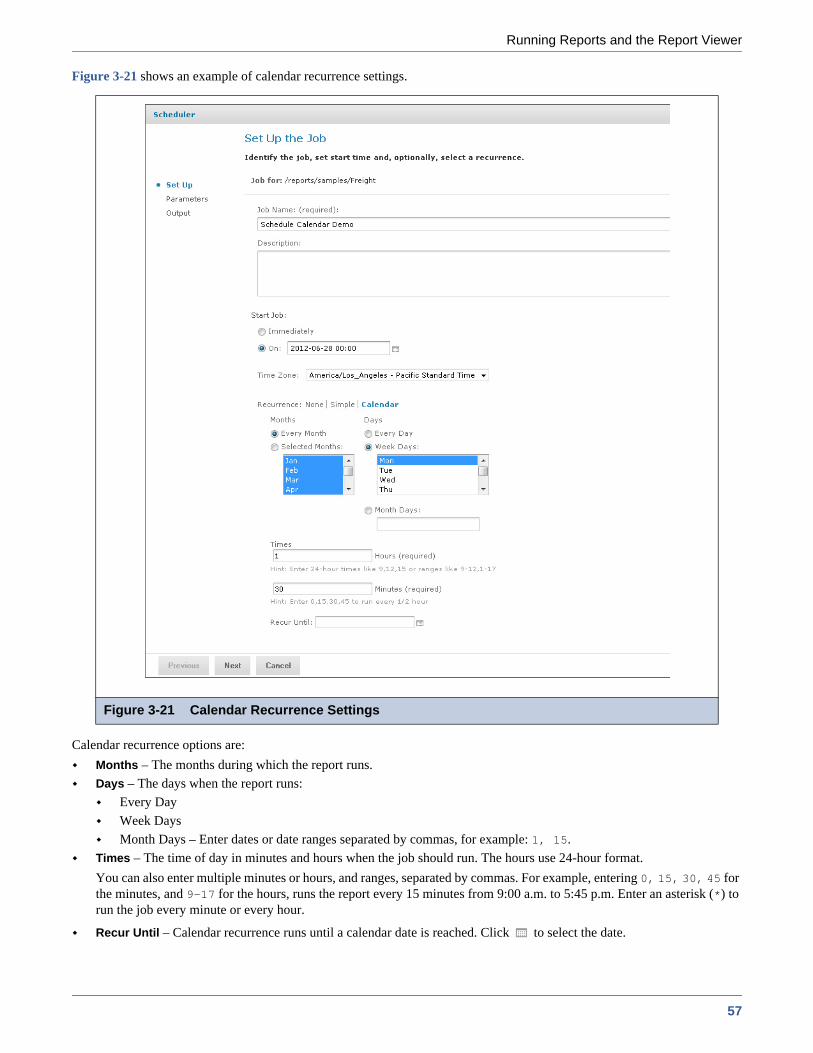
Running Reports and the Report Viewer
Figure 3-21 shows an example of calendar recurrence settings.
Calendar recurrence options are: Months – The months during which the report runs.Days – The days when the report runs:
Every DayWeek DaysMonth Days – Enter dates or date ranges separated by commas, for example: 1, 15.
Times – The time of day in minutes and hours when the job should run. The hours use 24-hour format.You can also enter multiple minutes or hours, and ranges, separated by commas. For example, entering 0, 15, 30, 45 for the minutes, and 9-17 for the hours, runs the report every 15 minutes from 9:00 a.m. to 5:45 p.m. Enter an asterisk (*) to run the job every minute or every hour.
Recur Until – Calendar recurrence runs until a calendar date is reached. Click to select the date.
Figure 3-21 Calendar Recurrence Settings
57

JasperReports Server User Guide
3.9.7 Running a Job in the BackgroundRunning a job in the background generates a report, potentially long-running, without affecting performance. You can keep working in the server as the job runs. When the job completes, you can export the report directly to any format and save it in the repository. You can share a report with others by sending the generated report by email.
Running a job in the background is equivalent to scheduling the report to run immediately without recurrence.
To run a job in the background:1. On the Home page, click View Your Reports; or from any page, click View > Reports.2. Use the search field or Filters to find the report you want to run.3. Right-click the report and select Run in Background from the context menu.
4. Choose a set of saved values, or set the fields one at a time.5. Click Next.
The Output page appears as shown in Figure 3-18, “Output Page for Scheduling a Report,” on page 54. 6. Enter the information as described in step in 3.9.2, "Setting Output Options," on page 54.7. Click Save.
The report begins to run immediately.
3.9.8 Adding a Date/Time Stamp to Scheduled OutputWhen you add a parameter named _ScheduledTime to a JRXML report design in iReport Designer, and then schedule the report to run in the server, the output includes a date/time stamp showing when the report ran. The following procedure describes how to set up and use this parameter:
To display the date/time that the report ran:1. Launch iReport, and open an existing report.2. In the Report Inspector, right-click Parameters, and select Add Parameter.3. Rename the parameter _ScheduledTime.
The new parameter appears in the report inspector:
4. Set the following parameter properties:Parameter Class = java.util.DateUse as a prompt = unchecked
If the report you’re running has input controls or filters that prompt for user input, a page appears for setting parameter values, as shown in Figure 3-17.
Figure 3-22 _ScheduledTime Parameter in the Report Inspector
58

Running Reports and the Report Viewer
5. Drag the _ScheduledTime element from the Report Inspector to a valid location, such as the header, in the Designer:
6. Now you can set other properties, such as the text color of the date/time stamp. In Properties, check Blank when Null to prevent the word null from appearing on the report when it runs unscheduled.
7. Compile the report, and add it to the server as a report unit. For more information about how to add the report unit to the server, see section 5.2, “Adding a Simple Report Unit to the Server,” on page 102.
8. In the server, schedule the report to run immediately.9. Open the output file:
The date and time the report actually ran appears in the output.
3.10 Event MessagesWhen an event occurs (for example, a scheduled report returns errors), JasperReports Server sends the owner of the report a notification message. You can browse these messages to troubleshoot report scheduling problems in the server. For example, you can determine that a report fails because its data source configuration uses incorrect credentials.
Figure 3-23 _ScheduledTime Parameter Properties
Figure 3-24 Report Design Includes the _ScheduledTime Parameter Element
Figure 3-25 Output Showing the Scheduled Time the Report Actually Ran
59
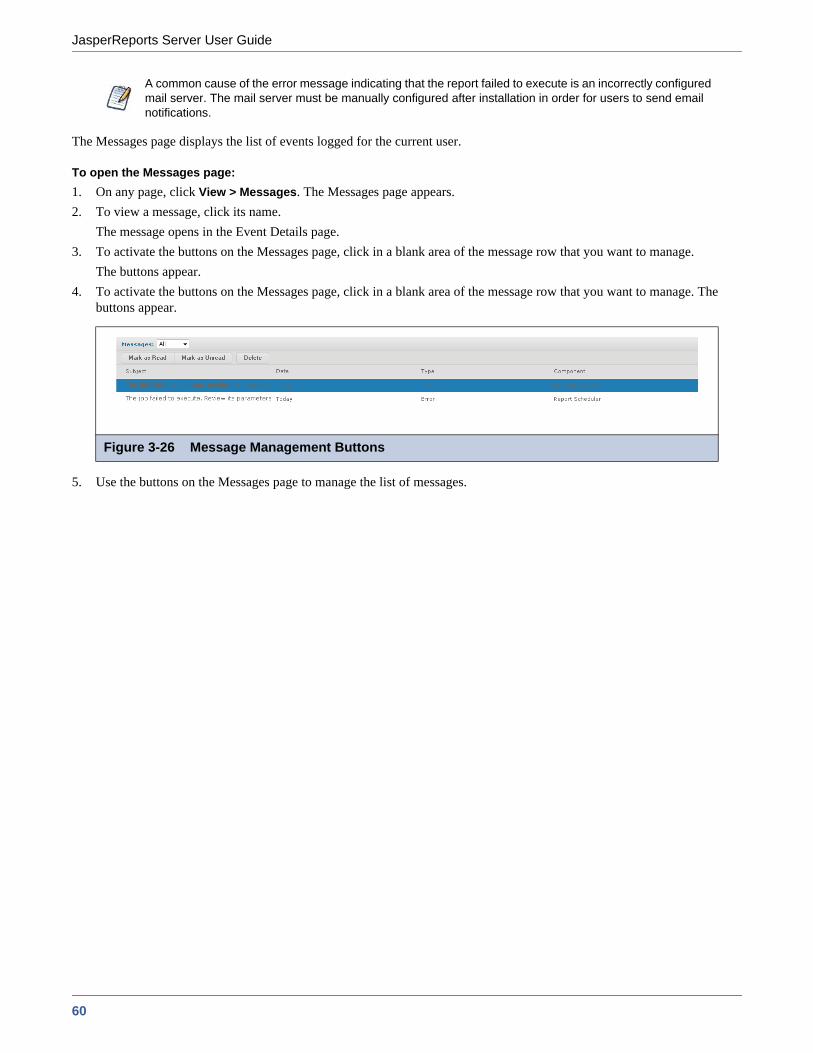
JasperReports Server User Guide
The Messages page displays the list of events logged for the current user.
To open the Messages page:1. On any page, click View > Messages. The Messages page appears.2. To view a message, click its name.
The message opens in the Event Details page.3. To activate the buttons on the Messages page, click in a blank area of the message row that you want to manage.
The buttons appear.4. To activate the buttons on the Messages page, click in a blank area of the message row that you want to manage. The
buttons appear.
5. Use the buttons on the Messages page to manage the list of messages.
A common cause of the error message indicating that the report failed to execute is an incorrectly configured mail server. The mail server must be manually configured after installation in order for users to send email notifications.
Figure 3-26 Message Management Buttons
60

Working with the Ad Hoc Editor
CHAPTER 4 WORKING WITH THE AD HOC EDITOR
The Ad Hoc Editor is the interactive designer for creating and editing an Ad Hoc view, where you can explore and analyze data from your Topic, Domain, or OLAP data source. Ad Hoc views can also be used to create content for reports.
This chapter discusses the Ad Hoc Editor and Ad Hoc views, and includes the following sections:Overview of the Ad Hoc EditorWorking with TablesWorking with Standard CrosstabsWorking with Standard CrosstabsWorking with OLAP Connection-based CrosstabsCreating Custom FieldsUsing Filters and Input ControlsCreating a View from a DomainCreating Topics
After you create an Ad Hoc view, you - and other users with the proper permissions - can run the report, then further refine the displayed information and personalize the look of the report in the report viewer. For more information on that process, see Chapter 3, “Running Reports and the Report Viewer,” on page 33.
4.1 Overview of the Ad Hoc EditorThe Ad Hoc Editor supports the creation of views for various types of reports: tables, crosstabs, and charts. You intuitively interact with the editor to create these views by simply dragging and dropping elements. You can add and summarize fields, define groups, label and title the report, and format data for each field. You can also use the editor to explore and analyze data interactively.
To open the Ad Hoc Editor:1. Click Create > Ad Hoc View. This opens the Data Chooser wizard.
This section describes functionality that can be restricted by the software license for JasperReports Server. If you don’t see some of the options described in this section, your license may prohibit you from using them. To find out what you're licensed to use, or to upgrade your license, contact Jaspersoft.
61

JasperReports Server User Guide
2. In the Data Chooser: Source dialog, select a data source type (from Topics, Domains, or OLAP Connections), then choose your data source and click a view type (Table, Chart, or Crosstab). Select the view that matches the type of report you want as your end result. You can change this later on while working with your view.
The Ad Hoc Editor contains the following panels, from left to right:Data Source Selection, which contains the fields, dimensions, and measures available in the source Domain, Topic, or OLAP connection.Ad Hoc View, the main view design panel.Filters, which defines a subset of data to retrieve from the data source.
We’ll discuss how to use these panels to create an Ad Hoc view later in this section.
4.1.1 Ad Hoc Sources: Topics, Domains, and OLAP ConnectionsThe following repository objects provide a prepared connection to a data source for Ad Hoc view creation:
Topics, JRMXL files created externally and uploaded to JasperReports Server as a basis for Ad Hoc views.Domains, virtual views of a data source that present the data in business terms, allow for localization, and provide data-level security.OLAP Connections, multi-dimensional views of data that allow users to analyze a large number of aggregate data levels.
You can also open and edit an existing Ad Hoc view to create a new Ad Hoc view.
Figure 4-1 List of Topics in the Ad Hoc Source Dialog
62
Working with the Ad Hoc Editor
4.1.1.1 Topics
Generally, an administrator or iReport user creates a Topic as a JRXML file. The JRXML topic is then associated with a data source in the server. A Topic can also be created from a Domain in the server. Both types of topics appear in the Data Chooser wizard when you create an Ad Hoc view.
Using a Topic as your source generates an empty view, which allows you to begin adding data to your view right away, without choosing, pre-filtering, or changing display names of the data (all of which are required steps when creating a Domain-based view).
To begin designing a Topic-based view:1. Launch the Ad Hoc Editor by clicking Create > Ad Hoc View.2. In the Data Chooser, select the Topics option at the top of the dialog window.3. Expand the Topics folder and select a topic.4. Select the type of view you intend to create: table, chart, or crosstab. For an overview of view types, see section 4.1.2,
“Ad Hoc View Types,” on page 65.
You can now begin working on your view in the Ad Hoc Editor.
4.1.1.2 Domains
Administrators create Domains that typically filter the data, create input controls, and manage the list of available fields and measures. A Domain specifies tables in the database, join clauses, calculated fields, display names, and default properties, all of which define items and sets of items for creating Ad Hoc views.
To begin designing a Domain-based view:1. Launch the Ad Hoc Editor by clicking Create > Ad Hoc View.2. In the Data Chooser, select the Domains option at the top of the dialog window.3. Expand the Domains folder and select a domain.4. Click Choose Data..., and click the options on the left of the window to perform the following tasks:
Click Fields to select fields of data to use in the view.Click Pre-filters to create filters to limit the data available in the Ad Hoc Editor.Click Display to change the fields’ display names.Click Save as Topic to save the customized topic for later use.
5. Select the type of view you want to create: table, chart, or crosstab. For an overview of view types, see section 4.1.2, “Ad Hoc View Types,” on page 65.
You can now begin working on your view in the Ad Hoc Editor.
4.1.1.3 OLAP Connections
Administrators create OLAP client connections that expose transactional data and define how the data can be seen as a multidimensional cube. An OLAP connection can expose multiple cubes in a single OLAP connection.
To begin designing an OLAP connection-based view:1. Launch the Ad Hoc Editor by clicking Create > Ad Hoc View.2. In the Data Chooser, select the OLAP Connections option at the top of the dialog window.3. Expand the Analysis Components | Analysis Connections folder and select a connection.4. Select Chart or Crosstab as the type of view you want to create.
You can now begin working on your view in the Ad Hoc Editor.
With OLAP connections, you can create chart and crosstab views only.
63
JasperReports Server User Guide
For more information about OLAP-based view functionality, refer to the following sections:4.5, “Working with OLAP Connection-based Crosstabs,” on page 824.9, “Creating Topics,” on page 97
64

Working with the Ad Hoc Editor
4.1.2 Ad Hoc View TypesThe Ad Hoc Editor allows you to select from three view types:
Tables, which are used to view values in the database and to summarize the values in columns.Charts, which compare one or more measures across multiple sets of related fields.Crosstabs, which aggregates data across multiple dimensions.
This section provides an overview of each view type. The design and content tasks for working with each type of view is discussed in more detail in the following sections:
For more information on table views, see section 4.2, “Working with Tables,” on page 69.For more information on chart views, see section 4.4, “Working with Standard Crosstabs,” on page 80.For more information on crosstab views, see section 4.4, “Working with Standard Crosstabs,” on page 80.
4.1.2.1 Tables
The architecture of a table view consists of columns, rows, and groups.
Columns in a table correspond to the columns in the data source. They are included by adding fields or measures to the table in the Ad Hoc view.
Rows correspond to rows in the database. The information in each row depends on what columns are included in the table.
Using groups, rows can be grouped by identical values in any field with intermediate summaries for each grouped value. For example, a table view of product orders might contain columns to show the dates and amounts of each order, and its rows might be grouped by city and product:
Date Placed Date Filled Payment Received
City A
Product 01
Date Date Amount
Date Date Amount
Product 01 totals: Count Sum
Product 02
Date Date Amount
Date Date Amount
Product 02 totals: Count Sum
Product 03
Date Date Amount
Date Date Amount
Product 03 totals: Count Sum
City A totals: Count Sum
City B
Product 01
Date Date Amount
Date Date Amount
Date Date Amount
... ... ...
65

JasperReports Server User Guide
For more information on working with tables, see section 4.2, “Working with Tables,” on page 69.
4.1.2.2 Charts
Charts summarize data graphically. Types of charts include bar chart, line chart, and pie chart, among others. With the exception of time series and scatter charts, each type of chart compares summarized values for a group. For example, the Chart tab might show the data in a bar chart that compared the sum of Payments Received for each of the products in each of the cities:
.
For more information on working with charts, see section 4.4, “Working with Standard Crosstabs,” on page 80.
4.1.2.3 Crosstabs
Crosstabs are more compact representations than tables; they show only computed values, rather than individual database values. Columns and rows specify the dimensions for grouping; cells contain the summarized measurements. For instance, the example above could be displayed in a crosstab with columns grouped by sales manager and year:
Total Payments Received
City A City B City C
Product 01 Product 02 Product 03
Tom Harriet Manager Totals
2007 2008 Year Totals 2007 2008 Year Totals
City A Product 01 Payment Received
Payment Received
Payment Received
Payment Received
Payment Received
Payment Received
Payment Received
Product 02 Payment Received
Payment Received
Payment Received
Payment Received
Payment Received
Payment Received
Payment Received
Product 03 Payment Received
Payment Received
Payment Received
Payment Received
Payment Received
Payment Received
Payment Received
Product Totals Payment Received
Payment Received
Payment Received
Payment Received
Payment Received
Payment Received
Payment Received
City B Product 01 Payment Received
Payment Received
Payment Received
Payment Received
Payment Received
Payment Received
Payment Received
... ... ... ... ... ... ... ...
City Totals Payment Received
Payment Received
Payment Received
Payment Received
Payment Received
Payment Received
Payment Received
66

Working with the Ad Hoc Editor
For more information on working with crosstabs, see section 4.4, “Working with Standard Crosstabs,” on page 80.
OLAP connection-based crosstabs behave differently than those created from Topics or Domains. See section 4.9, “Creating Topics,” on page 97.
4.1.3 The Data Source Selection PanelThe Data Source Selection panel contains a list of available fields in the chosen Topic or Domain. If you are using a Domain, fields may appear in nested sets. Use the arrow beside the set name to expand or collapse a set of fields.
Available fields may be divided into two sections in the panel, Fields and Measures.
To hide this panel, click the icon in the top left corner; this is helpful when arranging content in a large Ad Hoc view. Click the same icon on the minimized panel to expand it.
For more information on working with fields, see sections 4.2.1, “Using Fields in Tables,” on page 69, 4.3.1, “Using Fields and Measures in Charts,” on page 74, and 4.4.1, “Using Fields in Crosstabs,” on page 80.
4.1.4 The Ad Hoc View PanelThe Ad Hoc View panel provides tools that allow you to control what data is included in a view, and how it is organized.
Along the top of the panel, there is a tool bar and two drop-down menus.
The first drop-down menu allows you to reset the view type. Use this menu to select Table, Chart, or Crosstab. You can change the view type in the Ad Hoc Editor during the design or when you reopen the design for editing.
The next drop-down menu contains options for displaying a subset of the available data (Sample Data), or all available data (Full Data) in the view. Using the sample data can make the design process quicker by loading less data. Use the subset for initial design; use the full set for refining layout elements such as column width.
By default, the editor displays only a smaller, sample set of the data in the table. Use the drop-down menu to select Full Data to view the full set of data.
The tool bar at the top of the panel provides access to many functions of the Ad Hoc Editor. Table 4-1 describes the tool bar.
Depending on its configuration, JasperReports Server may load a Topic, Domain, or OLAP connection’s entire result set into memory when you edit the view, or run a report from it. If the data policies and other options that control JasperReports Server’s memory are disabled, ensure that each Topic, Domain, or OLAP connection returns a manageable amount of data, given the environment’s load capacity. Alternately, you can change the server’s configuration.
Table 4-1 Ad Hoc Editor Tool Bar Icons
Icon Name Description
Display Mode Click this icon to hide the editor interface. This mode provides a subset of the editor’s full feature set.
Save Place the cursor over this icon to open a menu of save options.
Export Place the cursor over this icon to open a menu of export options.
Undo Click this icon to undo the most recent action.
Redo Click this icon to redo the most recently undone action.
Undo All Click this icon to revert the view to its state when you last saved.
67

JasperReports Server User Guide
4.1.4.1 The Layout Band
Directly beneath the tool bar is the Layout Band. Here, there are two fields. These fields have different labels and functions, depending on the type of view you are creating:
For tables, these fields are Columns and Groups.For charts, these fields are Columns and Rows.For crosstabs, these fields are Columns and Rows.
You can drag and drop fields and measures into these boxes to populate your view.
4.1.4.2 Managing Grid Details
Below the Layout Band, to the left of the view title, is the Grid Detail selector. This tool allows you to control the level of
detail displayed in your table or chart. Click to display the following options:Detailed Data displays table detail only.Totals Data displays table totals only.Details and Totals displays both details and totals.
4.1.4.3 Viewing the SQL Query
You may want to look at the SQL query for your view, to verify what data users are hitting. If you have the proper permissions, you can do this in the Ad Hoc Editor with the View Query button.
The query is read-only, but can be copied onto a clipboard or other document for review.
To view the SQL query:
In the tool bar, click .
The View Query window opens, displaying the SQL query.
Switch Group Click this icon to change the way groups are displayed. For more information, refer to section 4.8, “Creating a View from a Domain,” on page 93.
Sort When working with tables, click this icon to view the current sorting and to select fields for sorting data. For more information, refer to section 4.2.1.6, “Sorting Tables,” on page 72
Input Controls Click this icon to see the input controls applied to this view. For more information, refer to section 4.7.2, “Using Input Controls,” on page 91.
Page Options Place the cursor over this icon to open a menu of page-level options. You can:Change whether to display the Layout Band.Change whether to display the title area.In tables, you can also hide or show the detail rows when the data is summarized. This option is available only if the table includes grouped columns.
View SQL/MDX Query
For more information on viewing SQL queries, see 4.1.4.3, “Viewing the SQL Query,” on page 68For more information viewing MDX queries, see 4.5.3, “Viewing the MDX Query,” on page 84
Table 4-1 Ad Hoc Editor Tool Bar Icons, continued
Icon Name Description
68

Working with the Ad Hoc Editor
4.1.5 The Filters PanelThe Filters panel displays any filters defined for the view. You can set the filter values and see the resulting change in the Ad Hoc View panel. To hide the Filters panel, click the icon in the top left corner of the panel. Click the same icon on the minimized panel to expand it again.
For more information on working with filters, see section 4.7, “Using Filters and Input Controls,” on page 87.
4.1.6 Saving an Ad Hoc View, Previewing and Creating a ReportAfter you create a compelling table, chart, or crosstab, you can save the view in the repository for future use.
To save an Ad Hoc view:
1. Hover your mouse over .2. Select Save Ad Hoc View or Save Ad Hoc View As.3. Name the view as needed, and click
The view is saved in the repository.
You can also save an Ad Hoc view as a report. Typically, a report is created when you want to:See data in the interactive report viewer.Perform additional formatting of the table data.Embed the data content into a dashboard.
Create a report from the view by selecting Save Ad Hoc View and Create Report; you can also create and run a report directly from the repository. For more information, see section 3.2, “Running or Creating a Simple Report,” on page 35. When you run the report, it is displayed as a JasperReport.
4.1.6.1 Dependent Reports
When you create a report from an Ad Hoc view, the report is considered “dependent” on that view.
When you save an Ad Hoc view its dependent reports are not updated. For example, if you open an Ad Hoc view in the Editor and add a column to it, that column will not show up in previous reports created from that view. In such a case, you may want to save the updated view with a different filename to avoid confusion.
4.2 Working with TablesThe following sections explain how to populate, edit, and format your table-type view.
4.2.1 Using Fields in Tables Insert data into your table by adding fields. All available fields are listed in the Data Source Selection panel, on the left side of the Ad Hoc Editor.
The available fields are divided into two sections in the panel:Fields, which can be added to the table as columns or groups.Measures, which are specialized fields that contain data values.
To add fields and measures as columns to a table:1. In the Data Source Selection panel, click to select the field or measure you want to add to the table. Use Ctrl-click to
select multiple items.2. Drag the selected item into the Columns box in the Layout Band.
The field is added to the view as a column in the table.
69
JasperReports Server User Guide
To remove a field or measure from a table:In the Layout Band, click the x next to the field or measure’s name.
4.2.1.1 Groups
Groups allow you to create detailed data rows. For example, if you have a table that lists the suppliers for a national restaurant chain, you can group the suppliers by the State field. The suppliers’ names are then rearranged so that all suppliers located in Maine, for instance, are located under a “Maine” header row; suppliers in Maryland are together under a “Maryland” header row, and so on.
You can use multiple fields to make more specific nested groups. By adding a group based on the “City” field to the table described above, the restaurant suppliers are arranged by City within the State groups. Under the “Maine” header row, new header rows for Augusta, Bangor, and Portland are added, and the names of the Maine-based suppliers appear under their respective cities. Under the “Maryland” header row, header rows for Annapolis, Baltimore, and Silver Spring are added, and the names of Maryland-based suppliers appear under those headers, and so on.
Only fields can be applied to a table as a group; measures cannot.
Data is grouped in the table according to the order they have defined. You can change the order by dragging the groups into position if needed.
To create a group:1. In the Data Source Selection panel, click to select the field you want to add to the table as a group.2. Drag the field to the Groups box in the Layout Band.
The Ad Hoc view refreshes and displays the data grouped under a new header row.
To remove a group:In the Layout Band, click the x next to the field’s name in the Groups box.
To move a the grouping order up or down in a table:In the Layout Band, drag the name of the group you want to move into its new position.
4.2.1.2 Summaries
You can display summary data for any column in your table.Summary data may be in the form of various functions, such as:SumCountDistinct CountAverage
For example, in a table with a list of stores, grouped by City and Country, you can display the number of stores in each City, and in each Country, using this function.
By default, the summary function for each field is defined by the data source, OLAP, or domain definition.
To add a summary to a specific column:In the table, right-click the column you want to calculate a summary for, and select Add Summary.The summary information is added to the group header, or is added to the bottom of a column if no groups are included in the table.
To remove a summary from a specific column:In the table, right-click the column with the summary you want to remove, and select Remove Summary.The summary information is removed from the table.
You can also add a group to the table by right-clicking a field and selecting Add as Group.
70

Working with the Ad Hoc Editor
To add or remove summaries from all columns:
Click and select Detailed Data.
4.2.1.3 Column and Header Labels
You can edit a column or header label directly in the Ad Hoc Editor.
To edit a column or header label:1. On the Ad Hoc view panel, right-click the column or group header you want to rename.2. Select Edit Label from the context menu.
The Edit Label window opens.3. In the text entry box, delete the existing name and enter the new name.4. Click Submit.
If space is at a premium, you can remove labels from the view. When you delete a label, it still appears when you look at the view in the Ad Hoc Editor, but does not appear when you run the report.
To delete a column or header label:1. On the Ad Hoc view, right-click the column or header label you want to remove.2. Select Delete Label from the context menu.
To re-apply a label:1. Right-click the column or header label you want to replace.2. Select Add Label from the context menu.
The Edit Label window opens.3. Enter the label name, if needed.4. Click Submit.
4.2.1.4 Managing Column Size and Spacing
You can change the size of, and spaces between, columns to manage the appearance of your table, to use space more efficiently.
Select the columns you want to adjust by clicking anywhere in the column.
To resize a column:1. In the Ad Hoc View panel, click to select the column you want to resize.2. Move the cursor to the right edge of the column.3. When the cursor changes to the resize icon ( ), click and drag the column edge right or left until the column is the
needed size.
Spacers can be added to a table to arrange columns farther apart, or add margins to a table.
To change the spacing between columns:1. In the Data Source Selection panel, in the Measures section, click Spacer.2. Drag the spacer into the Columns box in the Layout Band between names of the two columns you want to move apart.
A spacer column, labeled , appears in the table. 3. Repeat this action to add space between each of the columns.4. To remove a spacer, right-click the spacer column and select Remove from Table.
To use spacers to create table margins:1. In the Data Source Selection panel, click to select Spacer.2. Drag the spacer into the Columns box in the Layout Band.
71

JasperReports Server User Guide
3. Repeat as needed until the margins are as wide as needed.4. Repeat the steps above, adding the spacer to the right edge of the table.
4.2.1.5 Reordering Columns
You can move columns to the right or left to reorder data in your table.
To reorder a column:1. In the Ad Hoc View panel, right-click the column you want to move.2. Select Move Right or Move Left from the context menu.
4.2.1.6 Sorting Tables
In the Ad Hoc Editor, you can sort the rows of a table by any field, using a number of different methods.
To sort a table:
1. Click .The Sort window appears. If the table is already sorted, the window shows the fields that are used.
2. To add a field to sort on, double-click the field in Available Fields.The Available Fields panel now lists only fields that are not already in Sort On.
3. Select one or more fields to sort by. You can also use Ctrl-click to select multiple fields.
4. Click .5. To arrange the sorting precedence of the fields, select each field in the Sort window and click Move to top, Move up,
Move down, or Move to bottom: , , , and .
6. To remove a field, select it and click .7. Click OK. The table updates to display the rows sorted by the selected fields.
You can also sort a table using the following methods:Right-click a field in the Fields section of the Data Source Selection panel, and select Use for Sorting from the context menu. In this case, the table is sorted by a field that isn’t in the table; you may want to note the sorting fields in the title.Right-click a column header on the Canvas of the Ad Hoc View panel, and select Use for Sorting from the context menu.
4.2.1.7 Adding a Title1. Above the table, click the text Click to add a title.2. Enter the new table title in the text entry box.
4.2.1.8 Changing the Data Format
You can change the formatting for columns containing numeric data, such as dates and monetary amounts.
To change the data format for a column:1. In the Ad Hoc view, right-click the column for which you want to change the data format.2. Select Change Data Format from the context menu.3. Select the format you want to use. These options vary, depending on the type of numeric data contained in the column.
The data in the column now appears in the new format.
If a column is already being used and you want to stop using it or change the sorting, right-click the column and select Change Sorting from the context menu.
72

Working with the Ad Hoc Editor
4.2.1.9 Changing the Data Source
You may need to select a new data source for your table. This is a simple task, but you should keep in mind that all view data and formatting are lost when you select a new Topic, Domain, or OLAP connection. Any changes to the view are also lost if you navigate to another page using the browser navigation buttons, the main menu, or the Search field. To preserve changes, accept the current Topic or click Cancel.
To change the table’s data source:
1. At the top of the Data Source Selection panel, click and select Change Source.2. Select a different Topic, Domain, or OLAP connection.3. Click Table to apply the new data source.
Click Cancel to return to the editor without changing the Topic.
4.2.1.10 Showing and Hiding Detail Rows
You can simplify or expand the information in your table by hiding or showing detail rows.
To hide detail rows in a table:
1. Place the cursor over .2. Select Hide Detail Rows to show only the summarized totals for each group.
The Ad Hoc Editor applies a summary to each field depending on its datatype.
To show detail rows in a table:
1. Place the cursor over .2. Select Show Detail Rows to display the detailed information for each group.
The Ad Hoc Editor displays the complete information in each row.
4.2.1.11 Controlling the Data Set
You can control the data displayed in the grid by using the Grid Detail Selector. The Grid Detail Selector options are:Detailed Data, which displays table detail only. For instance, in a table listing sales in dollars for all stores in a region for a given month, the amount sold by each store that month is displayed.Totals Data, which displays the table totals only. In the table described above, the total amount of all sales at all regional stores that month is displayed.Details and Totals, which displays both the individual store sales numbers, as well as the total sales numbers at the bottom of the store sales column.
To change displayed table details:
1. Place your cursor over .2. Click to select the menu option, described above, you want applied to your table.
The Ad Hoc Editor displays the data as requested.
4.3 Working with ChartsAd Hoc charts are a flexible, interactive way to explore your data graphically. You can choose different levels of aggregation for rows and columns, change a field from a column to a row, pivot the entire chart, hide chart values, and zoom in to see chart details.
73

JasperReports Server User Guide
The following sections explain how to populate, edit, and format an Ad Hoc chart. Many tasks related to working with charts are identical (or very similar) to those for tables and crosstabs. For any tasks not discussed in this section, see the information in section 4.2, “Working with Tables,” on page 69.
4.3.1 Using Fields and Measures in ChartsYou must add at least one measure to view a chart. Before any measures are added to the chart, the Ad Hoc Editor displays a placeholder with the legend displaying a single entry: Add a measure to continue. As you add measures, the editor displays the grand total of each measure in the chart.
The initial display only reflects the measures you add; it does not change when you add fields or dimensions. For example, for each measure you add to a bar chart, you see a bar with the total value of the measure, regardless of how many fields you add. This means you can add, remove, and arrange measures and fields without waiting for the display to update. Once you have the fields and measures you want, you can use the sliders on the right to select the level of detail you want. See Figure 4-2, “Effect of the Slider on a Chart,” on page 75 for more information.
All available fields are listed in the Data Selection panel, as either standard fields or measures.Standard fields can be added to a column or a row.Measures contain summarized values. They are typically numeric fields that determine the length of bars, size of pie slices, location of points (in line charts), and height of areas. They can be added to rows or columns, but must all be in the same target — that is, you can add one or more measures to the chart as columns, or add one or more measures to the chart as rows, but you cannot have one measure as a column and another as a row in the same chart.
When creating a chart, keep in mind that row and column groups are arranged in hierarchies, with the highest member of the hierarchy on the left. For an Ad Hoc view based on an OLAP data source, you can change the order of distinct dimensions by dragging, but you cannot change the order of levels within a dimension. For an Ad Hoc view based on a non-OLAP data source, you can drag the field headings to rearrange the hierarchy; the highest level in a group should appear to the left; the lowest level in a group should appear to the right. For example, it doesn’t make sense to group first by postal code then by country, because each postal code belongs to only one country.
To add a field or measure to a row or column:1. In the Data Selection panel, select the field you want to add to the chart as a group. Use Ctrl-click to select multiple
items.2. Drag the selected item into the Columns or Rows box in the Layout Band.
4.3.1.1 Setting Levels
When you add a field or dimension to a column or row, a multi-level slider located at the top of the Filters pane allows you to set the level of aggregation to use for viewing the data. The number of fields or dimensions in the row or column determines the number of levels on the slider; measures are not reflected in the slider.
74
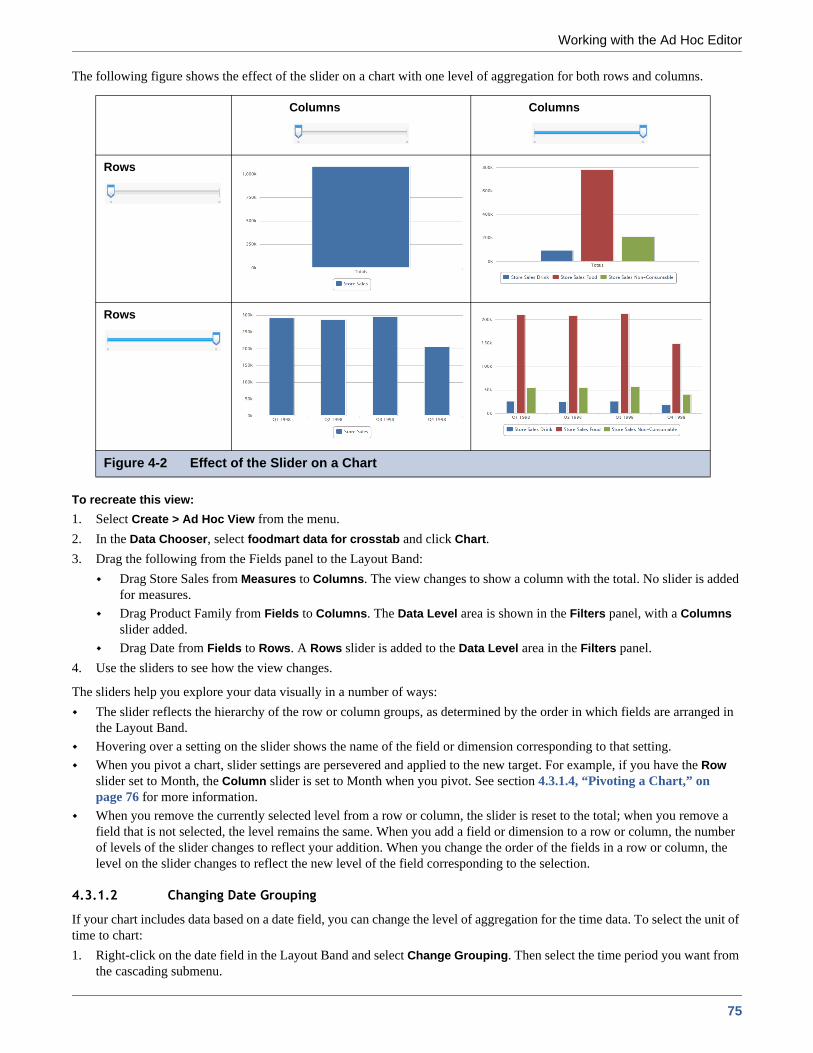
Working with the Ad Hoc Editor
The following figure shows the effect of the slider on a chart with one level of aggregation for both rows and columns.
To recreate this view:1. Select Create > Ad Hoc View from the menu.2. In the Data Chooser, select foodmart data for crosstab and click Chart.3. Drag the following from the Fields panel to the Layout Band:
Drag Store Sales from Measures to Columns. The view changes to show a column with the total. No slider is added for measures.Drag Product Family from Fields to Columns. The Data Level area is shown in the Filters panel, with a Columns slider added.Drag Date from Fields to Rows. A Rows slider is added to the Data Level area in the Filters panel.
4. Use the sliders to see how the view changes.
The sliders help you explore your data visually in a number of ways:The slider reflects the hierarchy of the row or column groups, as determined by the order in which fields are arranged in the Layout Band. Hovering over a setting on the slider shows the name of the field or dimension corresponding to that setting. When you pivot a chart, slider settings are persevered and applied to the new target. For example, if you have the Row slider set to Month, the Column slider is set to Month when you pivot. See section 4.3.1.4, “Pivoting a Chart,” on page 76 for more information.When you remove the currently selected level from a row or column, the slider is reset to the total; when you remove a field that is not selected, the level remains the same. When you add a field or dimension to a row or column, the number of levels of the slider changes to reflect your addition. When you change the order of the fields in a row or column, the level on the slider changes to reflect the new level of the field corresponding to the selection.
4.3.1.2 Changing Date Grouping
If your chart includes data based on a date field, you can change the level of aggregation for the time data. To select the unit of time to chart:1. Right-click on the date field in the Layout Band and select Change Grouping. Then select the time period you want from
the cascading submenu.
Columns Columns
Rows
Rows
Figure 4-2 Effect of the Slider on a Chart
75

JasperReports Server User Guide
The view updates to reflect the new date grouping.
4.3.1.3 Changing the Summary Function of a Measure
You can get a new view of your data by changing the summary function of a measure, for example, from sum to average. To select a new summary function for a measure:1. Right-click on the measure in the Layout Band and select Change Summary Function. Then select the function you want
from the cascading submenu.The view updates to reflect the new summary function.
4.3.1.4 Pivoting a Chart
You can pivot a chart in two ways:
Pivot the entire chart by clicking . The row and column groups switch places; slider levels are maintained.
The following figure shows the effect of pivoting a basic column chart.
Pivot a single group:To pivot a single row group, right-click it and select Switch To Column Group. You can also move any field or dimension by dragging. You cannot drag a measure to a different group.To pivot a single column group, right-click it and select Switch To Row Group. You can also move any field or dimension by dragging. You cannot drag a measure to a different group.
4.3.2 Selecting a Chart TypeThere are a number of chart types to choose from to best represent your information, including:
Column, which compares values displayed as columns.Bar, which compares values displayed as bars.Line, which compares values displayed as points connected by lines.Area, which compares values displayed as shaded areas.Pie, which compares values displayed as slices of a circular graph.
By default, the Ad Hoc Editor creates a column chart. You can select a different type of chart at any time.
Figure 4-3 Effect of Pivoting a Chart
76

Working with the Ad Hoc Editor
To select a new chart type:
1. In the Ad Hoc View panel, click the icon to show the Canvas Options menu.2. Select Chart Types... from the menu. The Select Chart Type window is displayed.
3. Click the type of chart you want to apply to your report. The selected chart type is outlined in blue.
4. Leave the Select Chart Type window open to rapidly switch between chart types, or click the icon at the top right to close it.
The following table describes the available chart types:
Figure 4-4 Select Chart Type Window
Table 4-2 HTML5 Chart Types
Icon Description
Column charts
Column. Multiple measures of a group are depicted as individual columns.
Stacked Column. Multiple measures of a group are depicted as portions of a single column whose size reflects the aggregate value of the group.
Percent Column. Multiple measures of a group are depicted as portions of a single column of fixed size.
Bar charts
Bar. Multiple measures of a group are depicted as individual bars.
Stacked Bar. Multiple measures of a group are depicted as portions of a single bar whose size reflects the aggregate value of the group.
Percent Bar. Multiple measures of a group are depicted as portions of a single bar of fixed size.
77
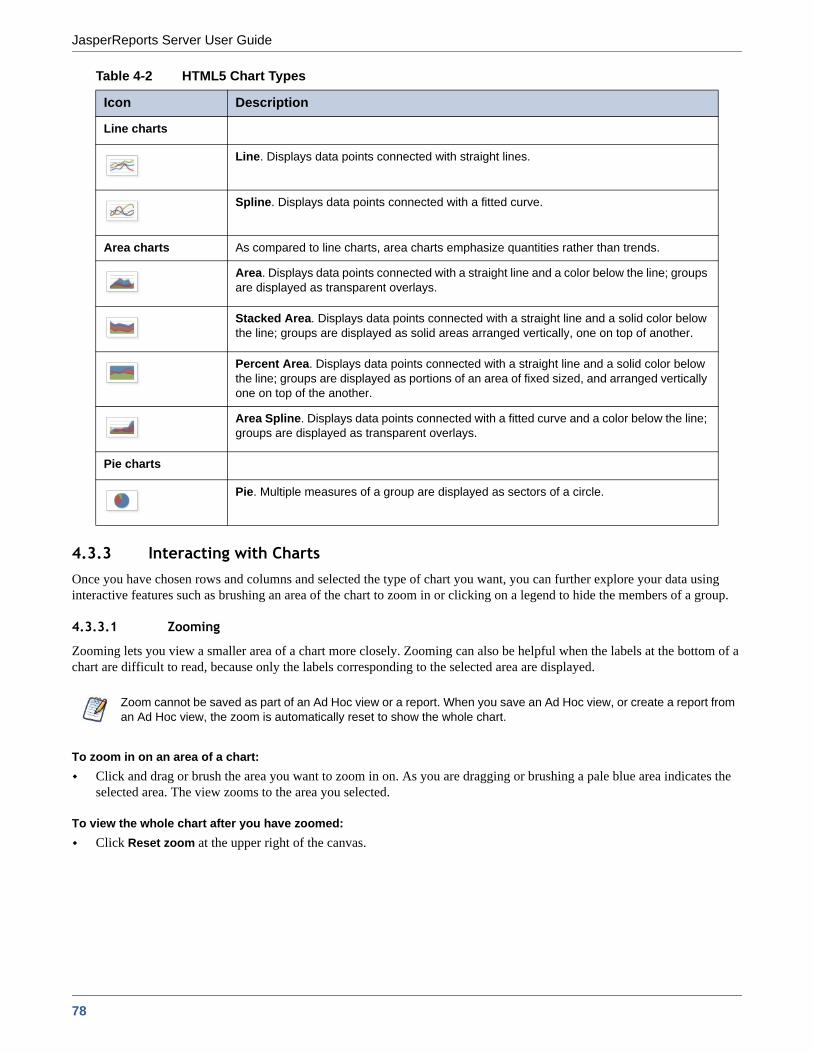
JasperReports Server User Guide
4.3.3 Interacting with ChartsOnce you have chosen rows and columns and selected the type of chart you want, you can further explore your data using interactive features such as brushing an area of the chart to zoom in or clicking on a legend to hide the members of a group.
4.3.3.1 Zooming
Zooming lets you view a smaller area of a chart more closely. Zooming can also be helpful when the labels at the bottom of a chart are difficult to read, because only the labels corresponding to the selected area are displayed.
To zoom in on an area of a chart:Click and drag or brush the area you want to zoom in on. As you are dragging or brushing a pale blue area indicates the selected area. The view zooms to the area you selected.
To view the whole chart after you have zoomed:Click Reset zoom at the upper right of the canvas.
Line charts
Line. Displays data points connected with straight lines.
Spline. Displays data points connected with a fitted curve.
Area charts As compared to line charts, area charts emphasize quantities rather than trends.
Area. Displays data points connected with a straight line and a color below the line; groups are displayed as transparent overlays.
Stacked Area. Displays data points connected with a straight line and a solid color below the line; groups are displayed as solid areas arranged vertically, one on top of another.
Percent Area. Displays data points connected with a straight line and a solid color below the line; groups are displayed as portions of an area of fixed sized, and arranged vertically one on top of the another.
Area Spline. Displays data points connected with a fitted curve and a color below the line; groups are displayed as transparent overlays.
Pie charts
Pie. Multiple measures of a group are displayed as sectors of a circle.
Zoom cannot be saved as part of an Ad Hoc view or a report. When you save an Ad Hoc view, or create a report from an Ad Hoc view, the zoom is automatically reset to show the whole chart.
Table 4-2 HTML5 Chart Types
Icon Description
78

Working with the Ad Hoc Editor
The following images show a bar chart before and after zooming:
4.3.3.2 Hiding Group Members
Use the legends below the chart to hide or show group members.1. To hide a group member, click on the member name in the legend below the chart. The member is removed from the chart
and the legend is grayed out.2. To unhide a group member that has been hidden, click on the grayed-out legend for the member.
Figure 4-5 Selecting a Zoom Area
Figure 4-6 Area After Zooming
Brush or click and drag to zoom
79
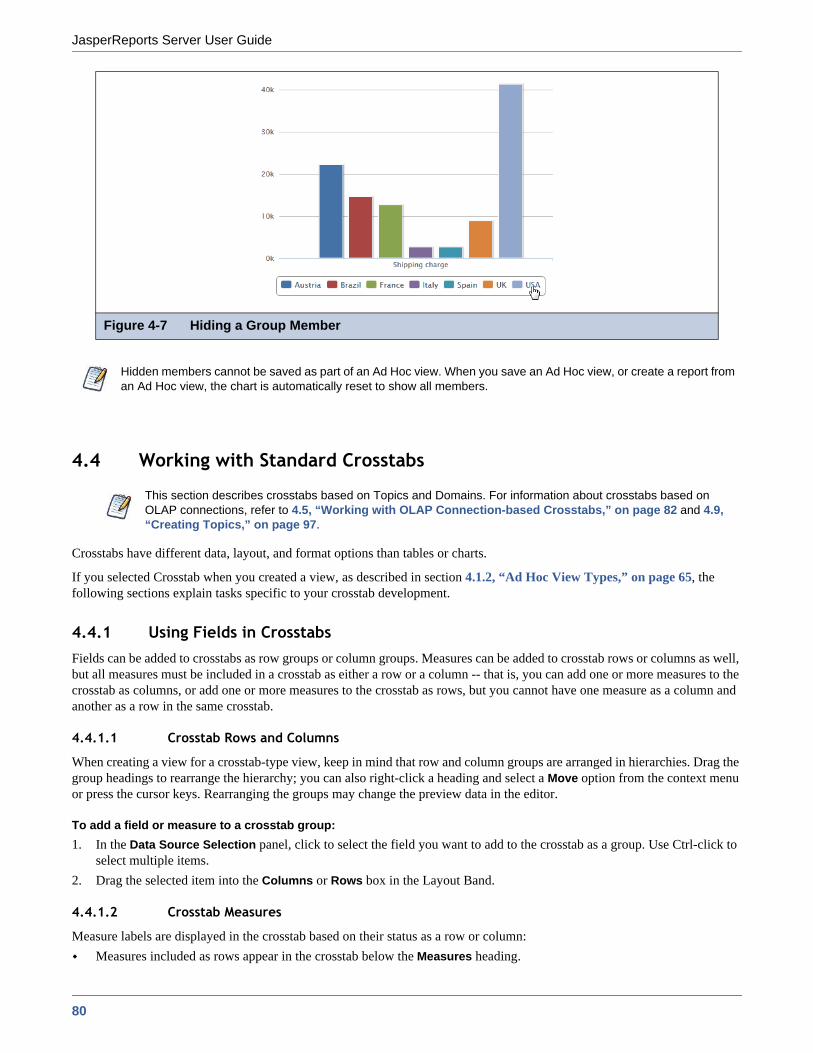
JasperReports Server User Guide
4.4 Working with Standard Crosstabs
Crosstabs have different data, layout, and format options than tables or charts.
If you selected Crosstab when you created a view, as described in section 4.1.2, “Ad Hoc View Types,” on page 65, the following sections explain tasks specific to your crosstab development.
4.4.1 Using Fields in CrosstabsFields can be added to crosstabs as row groups or column groups. Measures can be added to crosstab rows or columns as well, but all measures must be included in a crosstab as either a row or a column -- that is, you can add one or more measures to the crosstab as columns, or add one or more measures to the crosstab as rows, but you cannot have one measure as a column and another as a row in the same crosstab.
4.4.1.1 Crosstab Rows and Columns
When creating a view for a crosstab-type view, keep in mind that row and column groups are arranged in hierarchies. Drag the group headings to rearrange the hierarchy; you can also right-click a heading and select a Move option from the context menu or press the cursor keys. Rearranging the groups may change the preview data in the editor.
To add a field or measure to a crosstab group:1. In the Data Source Selection panel, click to select the field you want to add to the crosstab as a group. Use Ctrl-click to
select multiple items.2. Drag the selected item into the Columns or Rows box in the Layout Band.
4.4.1.2 Crosstab Measures
Measure labels are displayed in the crosstab based on their status as a row or column:Measures included as rows appear in the crosstab below the Measures heading.
Figure 4-7 Hiding a Group Member
Hidden members cannot be saved as part of an Ad Hoc view. When you save an Ad Hoc view, or create a report from an Ad Hoc view, the chart is automatically reset to show all members.
This section describes crosstabs based on Topics and Domains. For information about crosstabs based on OLAP connections, refer to 4.5, “Working with OLAP Connection-based Crosstabs,” on page 82 and 4.9, “Creating Topics,” on page 97.
80

Working with the Ad Hoc Editor
Measures included as columns appear in the crosstab to the right of the Measures heading.
You can right-click a measure in the crosstab to open a context menu that provides these options:Change Summary FunctionChange Data FormatRemove From CrosstabCreate FilterMove Up or Move Down
Measures are arranged in cells. You can add any number of measures. All the measures appear together in every cell. To rearrange the measures, drag them in the measure label area.
4.4.1.3 Pivoting
You can pivot a crosstab in two ways:
Pivot the entire crosstab by clicking . The row and column groups switch places. For more information, see section 4.8, “Creating a View from a Domain,” on page 93.Pivot a single group:
To pivot a single row group, right-click it and select Switch To Column Group.To pivot a single column group, right-click it and select Switch To Row Group.
4.4.1.4 Slicing
The slice feature lets you keep or exclude group members in a crosstab. To slice, right-click a group member and select:Keep Only to remove all groups except the selected one from the crosstab.Exclude to remove this group from the crosstab.
Use Ctrl-click and Shift-click to select multiple groups to keep or exclude.
For more information about filtering, see section 4.7, “Using Filters and Input Controls,” on page 87.
4.4.1.5 Summarizing
All row and column groups are summarized automatically:To turn off a group summary, right-click any heading in the group and select Delete Row Summary or Delete Column Summary from the context menu. To reapply the summary, right-click the heading and select Add Row Summary or Add Column Summary.
To select the summary function and data format for a measure, right-click the measure label and select from the context menu. Note that you can’t change the summary function on custom fields that calculate percents (Percent of Total, Percent of Column Group Parent, and Percent of Row Group Parent).The summary functions for numeric fields are Sum, Average, Maximum, Minimum, Distinct Count, and Count All. Distinct Count is the number of different items in the row or column; Count All is the total number of items. For instance, if there are 3 widgets of type A and 3 widgets of type B, Distinct Count is 2 and Count All is 6.
Pivoting removes any custom sorting applied to headings in your crosstab. It does not affect column or row sorts.
You can select multiple row groups or multiple column groups; you can't slice by both row groups and column groups at once. Compare slice to drill-through, drill to details, and filtering.
The Delete Summary option is available only for the outermost group on either axis (that is, either the outermost row group or the outermost column group)
81

JasperReports Server User Guide
4.4.1.6 Collapsing and Expanding Members
By default, the editor displays each row and column group of a crosstab in a collapsed state. This means that you can see the totals for the group, but not the measures for its individual members. To see measures for a group’s members, right-click the group label and select Expand Members.
When a group’s members are expanded, select Collapse Members from the same menu to hide the measures. Collapsing an outer group also collapses its inner groups. The Expand Members and Collapse Members options are only available for outermost groups, or for inner groups nested in an expanded outer group.
When you collapse a group, its summary is automatically displayed; this prevents invalid crosstab layouts in which there is nothing to display for some totals if the summary has been deleted previously.
4.4.1.7 Sorting
By default, the rows and columns of a crosstab are sorted in alphabetical order of the group names.
To change how your crosstab is sorted:1. Right-click the heading you want to use to sort your crosstab.2. In the context menu, select the sorting option to apply:
Sort AscendingSort Descending
The crosstab is updated to reflect your sorting option. A blue dot appears in the context menu next to the currently applied sort option.
When the crosstab includes more than one row group or more than one column group, the inner groups are also sorted according to your selection. Only one measure can be used for sorting at any one time; changing the sort order for another measure resets all others to the default.
4.4.1.8 Resizing and Layout
Many of the layout and formatting options that are set manually in tables are set automatically in crosstabs. In particular, row and column sizes are fixed and no spacer is available.
4.4.1.9 Drilling Through Data
Drill-through functionality is available for crosstab data. A drill-through table displays the supporting details for the selected roll-up value.
To view the drill-through table for a value in your crosstab:Click hyperlinked data to display additional columns from that specific fact data.
By default, the drill-through table opens in its own window or tab, depending on your browser settings.
4.5 Working with OLAP Connection-based CrosstabsAn OLAP connection is a definition for retrieving OLAP data for use in Ad Hoc views and reports. An OLAP connection is either a direct Java connection (Mondrian connection) or an XML-based API connection (XML/A connection). You must create OLAP client connections in order to use this functionality, which may be restricted by your license. For more information on creating OLAP client connections, as well as other administrative tasks regarding OLAP, refer to the Jaspersoft OLAP User Guide.
The Ad Hoc Editor displays a more focused tool bar when your Ad Hoc view is based on an OLAP connection. It contains a subset of the options available in the standard tool bar, including Display Mode, Redo, Undo All, Switch Group, Display Options, and View MDX Query. For a description of these options, see Table 4-1, “Ad Hoc Editor Tool Bar Icons,” on page 67.
82
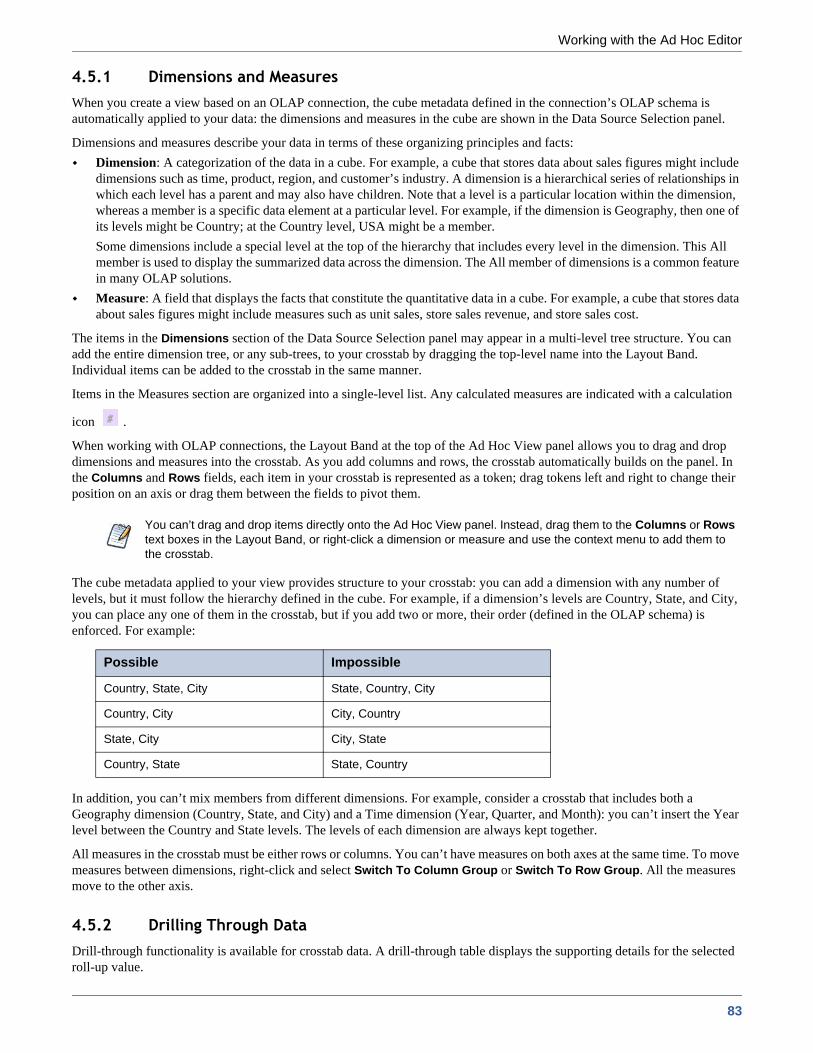
Working with the Ad Hoc Editor
4.5.1 Dimensions and MeasuresWhen you create a view based on an OLAP connection, the cube metadata defined in the connection’s OLAP schema is automatically applied to your data: the dimensions and measures in the cube are shown in the Data Source Selection panel.
Dimensions and measures describe your data in terms of these organizing principles and facts:Dimension: A categorization of the data in a cube. For example, a cube that stores data about sales figures might include dimensions such as time, product, region, and customer’s industry. A dimension is a hierarchical series of relationships in which each level has a parent and may also have children. Note that a level is a particular location within the dimension, whereas a member is a specific data element at a particular level. For example, if the dimension is Geography, then one of its levels might be Country; at the Country level, USA might be a member.Some dimensions include a special level at the top of the hierarchy that includes every level in the dimension. This All member is used to display the summarized data across the dimension. The All member of dimensions is a common feature in many OLAP solutions.Measure: A field that displays the facts that constitute the quantitative data in a cube. For example, a cube that stores data about sales figures might include measures such as unit sales, store sales revenue, and store sales cost.
The items in the Dimensions section of the Data Source Selection panel may appear in a multi-level tree structure. You can add the entire dimension tree, or any sub-trees, to your crosstab by dragging the top-level name into the Layout Band. Individual items can be added to the crosstab in the same manner.
Items in the Measures section are organized into a single-level list. Any calculated measures are indicated with a calculation
icon .
When working with OLAP connections, the Layout Band at the top of the Ad Hoc View panel allows you to drag and drop dimensions and measures into the crosstab. As you add columns and rows, the crosstab automatically builds on the panel. In the Columns and Rows fields, each item in your crosstab is represented as a token; drag tokens left and right to change their position on an axis or drag them between the fields to pivot them.
The cube metadata applied to your view provides structure to your crosstab: you can add a dimension with any number of levels, but it must follow the hierarchy defined in the cube. For example, if a dimension’s levels are Country, State, and City, you can place any one of them in the crosstab, but if you add two or more, their order (defined in the OLAP schema) is enforced. For example:
In addition, you can’t mix members from different dimensions. For example, consider a crosstab that includes both a Geography dimension (Country, State, and City) and a Time dimension (Year, Quarter, and Month): you can’t insert the Year level between the Country and State levels. The levels of each dimension are always kept together.
All measures in the crosstab must be either rows or columns. You can’t have measures on both axes at the same time. To move measures between dimensions, right-click and select Switch To Column Group or Switch To Row Group. All the measures move to the other axis.
4.5.2 Drilling Through DataDrill-through functionality is available for crosstab data. A drill-through table displays the supporting details for the selected roll-up value.
You can’t drag and drop items directly onto the Ad Hoc View panel. Instead, drag them to the Columns or Rows text boxes in the Layout Band, or right-click a dimension or measure and use the context menu to add them to the crosstab.
Possible Impossible
Country, State, City State, Country, City
Country, City City, Country
State, City City, State
Country, State State, Country
83

JasperReports Server User Guide
To view the drill-through table for a value in your crosstab:1. Click hyperlinked data to display additional columns related to that information.2. Use the page controls to navigate the table.
The drill-through table opens in its own window or tab, depending on your browser settings.
4.5.3 Viewing the MDX QueryYou may want to view the MDX query created for the OLAP connection used with your crosstab, to verify what data users are hitting. If this option is enabled, you can do this in the Ad Hoc Editor with the View Query button.
The query is read-only, but can be copied onto a clipboard or other document for review.
To view the MDX query:
In the tool bar, click . The View Query window opens, displaying the query.
84

Working with the Ad Hoc Editor
4.5.4 Working with Microsoft SSASThe Ad Hoc Editor allows you to view data from Microsoft SQL Server Analytical Services (SSAS) to populate views and reports with multi-dimensional OLAP data. XML/A connections that point to your SSAS data are listed with the other OLAP connections when you create an Ad Hoc view, as in the following crosstab example:
For details, refer to the Jaspersoft OLAP User Guide.
4.6 Creating Custom FieldsYou can create new fields in an Ad Hoc view by applying mathematical formulas to a view’s existing numeric fields. For example, consider a view that includes both a Cost and a Revenue field. You could calculate the profit for each record by creating a custom field that subtracts the Cost field from the Revenue field. Create a custom field by selecting an existing field in the Measures section of the Data Source Selection panel of a table-type view; the Create Custom Field menu item appears on the context menu when you right-click a numeric field.
The Ad Hoc Editor supports three types of functions:
Figure 4-8 Search Results Listing
85

JasperReports Server User Guide
Basic functions include addition, subtraction, multiplication, and division. You can use these functions with a constant (such as multiplying the cost by two to calculate a standard 50% markup), or you can use them with multiple fields. Select multiple fields using Ctrl-click; the columns’ borders change color to indicate that multiple fields are selected; right-click to open the context menu and create a custom field.Advanced functions include round, rank, percent of total, percent of row group, and percent of column group. These functions don’t take constants, nor do they support multiple fields.Date functions can calculate the difference between two dates in a number of intervals, such as years, weeks, days, and seconds.
A custom field can include only a single function. To use more than one function, create two custom fields, with one building on the other. In this case, pay special attention to the order in which you create the custom fields, as this may affect the results; for example, rounding then multiplying is different from multiplying then rounding.
Because custom fields can build upon one another, you can create complex calculations. For example, you can divide the Profit custom field in the previous example by the Revenue field to express each record’s margin as a percent. When a custom field is the basis of another field, you can’t delete it until you delete the one that builds on it.
When working with multiple fields:You can only select basic functions and date differences.You can multiply or add any number of fields, but ordered functions (subtract and divide) and date functions can only be used with two fields at a time. For ordered operations, the order in which you select fields matters. For example, to calculate profit in the example above, click Revenue first, then Ctrl-click Cost. When you right-click, select Create Custom Field and choose subtraction, the Ad Hoc Editor assumes you are subtracting the Cost field from the Revenue field. You can always change the order of fields by clicking Swap.
To create a custom field based on one field:1. In the Measures section of the Data Source Selection panel, right-click a numeric field and select Create Custom Field
from the context menu.2. Depending on the type of function you want to create, select options in Basic Functions or Advanced Functions.3. In Basic Functions, you can add, subtract, multiply, or divide the field values by a constant, which you enter as a number
in the selected field; this number is the constant to use in the formula.4. If you selected a basic function, click Swap to put the constant before the field in the formula; this is only useful in
conjunction with ordered operations. 5. Click Create Field.
The custom field appears in the list of available measures.
To create a custom field based on multiple numeric fields:1. In the Measures section of the Data Source Selection panel, Ctrl-click two or more numeric fields, right-click one of the
selected fields, and select Create Custom Field from the context menu.2. Select from the following options:
If you selected just two fields, choose +, -, *, or /.If you selected more than two fields, choose Add All or Multiply All.
3. Click Swap from the context menu to change the order of the fields in the formula; this is only useful in conjunction with ordered functions.
4. Click Create Field.The custom field appears in the list of available measures.
To create a custom field based on two date fields:1. In the Data Source Selection panel, Ctrl-click two date fields.2. Right-click, and select Create Custom Field from the context menu.3. Select one of the Date Difference intervals.
You can compare dates only when exactly two date fields are selected.
86

Working with the Ad Hoc Editor
4. Click Create Field.The custom field appears in the list of available measures.
Keep the following in mind when creating custom fields:To edit an existing custom field, right-click it and select Edit Formula from the context menu. You can then choose a different function, or enter a different value (if you are editing a basic function).When you create a custom field based on a field on the panel, the new field appears in the panel; when you create a custom field from a field in Data Selection, it appears at the bottom of the list.The percent of group functions are unique among the custom functions in that they calculate values based on the grouping defined in the view. Thus, the following limitations apply:
The percent of column group functions are meaningless in charts and tables. In these contexts, these functions always return 100.Custom fields using the special percent functions cannot be used as a group, as a filter, nor as the basis for other custom fields.The summary function for custom fields using the percent functions is always Sum; this cannot be modified. Furthermore, the percentage is always calculated on the sum of the original field, regardless of the summary function applied to the field in the table or crosstab, if any.
The Round function uses the standard method of rounding (arithmetic rounding), in which decimal values greater than 0.5 are rounded to the next largest whole number, and values less than 0.5 are rounded down.A custom field’s label is determined by the fields, constants, and functions it includes; for example, the default label for the Profit field in the example above is Store Sales - Store Cost. Right-click the column and select Edit Label to enter a more compelling name.By default, the Ad Hoc Editor supports only two decimal places. If the custom fields return data that are significant to the third decimal place, you can add new masking options by editing configuration files. For more information, refer to the JasperReports Server Administrator Guide.You can’t delete a custom field that is used in the Ad Hoc View panel. First, remove the custom field from the Ad Hoc View panel and then delete it from the Data Source Selection panel.
4.7 Using Filters and Input ControlsJRXML Topics, Domains, and OLAP connections use different mechanisms for screening the data they return:
JRXML Topics can contain Parameterized queries. The parameters can be mapped to input controls that allow users to select the data they want to include. Domains (and Domain Topics) can be filtered by selecting fields in the Domain and specifying comparison values. The filters can be configured for users to select the data to include.Within the Domain design, filters based on conditions can also be defined; these filters are not displayed in the report viewer when the report runs. OLAP connections rely on XML schemas to filter the data in an underlying transactional database. Input controls are never generated directly from the OLAP schema.
You can define filters in the Ad Hoc Editor regardless of whether you are working with data from a Domain, Topic, or OLAP connection. Such filters can be helpful in improving the view's initial performance by reducing the amount of data the view returns by default. For more information, see section 4.7.3, “Input Controls and Filters Availability,” on page 92. To prevent users from seeing the full dataset, you can also use input controls in a JRXML Topic or filters defined in the Domain design, which can be hidden from end users.
If you want to return different data to different users of the same view, define data-level security based on a user roles and profile attributes. This is available for reports based on a Domain, Domain Topic, or OLAP client connection. For more information, refer to the Jaspersoft OLAP User Guide. For more information, refer to section 8.4, “The Domain Security File,” on page 220 and to the Jaspersoft OLAP User Guide.
Input controls and filters interact seamlessly. For example, you can create filters in an Ad Hoc view that gets data from a JRXML Topic that includes input controls.
87
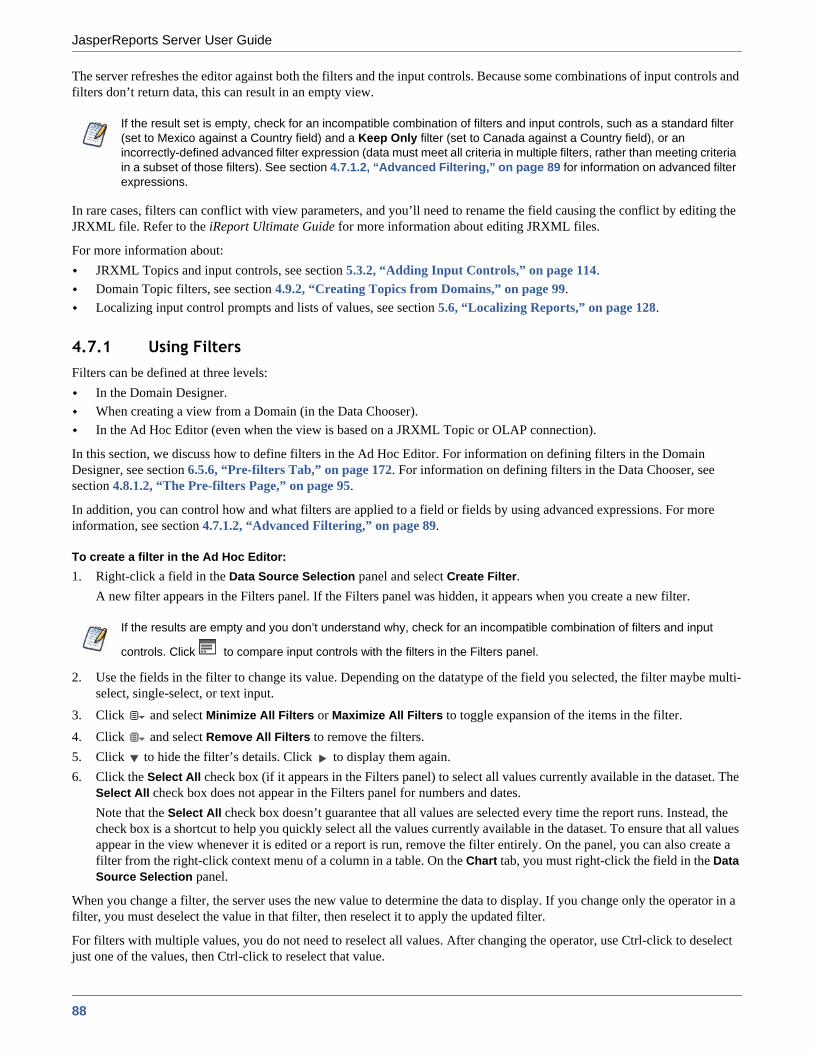
JasperReports Server User Guide
The server refreshes the editor against both the filters and the input controls. Because some combinations of input controls and filters don’t return data, this can result in an empty view.
In rare cases, filters can conflict with view parameters, and you’ll need to rename the field causing the conflict by editing the JRXML file. Refer to the iReport Ultimate Guide for more information about editing JRXML files.
For more information about:JRXML Topics and input controls, see section 5.3.2, “Adding Input Controls,” on page 114.Domain Topic filters, see section 4.9.2, “Creating Topics from Domains,” on page 99.Localizing input control prompts and lists of values, see section 5.6, “Localizing Reports,” on page 128.
4.7.1 Using FiltersFilters can be defined at three levels:
In the Domain Designer.When creating a view from a Domain (in the Data Chooser).In the Ad Hoc Editor (even when the view is based on a JRXML Topic or OLAP connection).
In this section, we discuss how to define filters in the Ad Hoc Editor. For information on defining filters in the Domain Designer, see section 6.5.6, “Pre-filters Tab,” on page 172. For information on defining filters in the Data Chooser, see section 4.8.1.2, “The Pre-filters Page,” on page 95.
In addition, you can control how and what filters are applied to a field or fields by using advanced expressions. For more information, see section 4.7.1.2, “Advanced Filtering,” on page 89.
To create a filter in the Ad Hoc Editor:1. Right-click a field in the Data Source Selection panel and select Create Filter.
A new filter appears in the Filters panel. If the Filters panel was hidden, it appears when you create a new filter.
2. Use the fields in the filter to change its value. Depending on the datatype of the field you selected, the filter maybe multi-select, single-select, or text input.
3. Click and select Minimize All Filters or Maximize All Filters to toggle expansion of the items in the filter. 4. Click and select Remove All Filters to remove the filters.5. Click to hide the filter’s details. Click to display them again.6. Click the Select All check box (if it appears in the Filters panel) to select all values currently available in the dataset. The
Select All check box does not appear in the Filters panel for numbers and dates.Note that the Select All check box doesn’t guarantee that all values are selected every time the report runs. Instead, the check box is a shortcut to help you quickly select all the values currently available in the dataset. To ensure that all values appear in the view whenever it is edited or a report is run, remove the filter entirely. On the panel, you can also create a filter from the right-click context menu of a column in a table. On the Chart tab, you must right-click the field in the Data Source Selection panel.
When you change a filter, the server uses the new value to determine the data to display. If you change only the operator in a filter, you must deselect the value in that filter, then reselect it to apply the updated filter.
For filters with multiple values, you do not need to reselect all values. After changing the operator, use Ctrl-click to deselect just one of the values, then Ctrl-click to reselect that value.
If the result set is empty, check for an incompatible combination of filters and input controls, such as a standard filter (set to Mexico against a Country field) and a Keep Only filter (set to Canada against a Country field), or an incorrectly-defined advanced filter expression (data must meet all criteria in multiple filters, rather than meeting criteria in a subset of those filters). See section 4.7.1.2, “Advanced Filtering,” on page 89 for information on advanced filter expressions.
If the results are empty and you don’t understand why, check for an incompatible combination of filters and input
controls. Click to compare input controls with the filters in the Filters panel.
88

Working with the Ad Hoc Editor
4.7.1.1 Relative Dates
You can filter information in your view based on a date range relative to the current system date. You can accomplish this using date-based filters, and entering a text expression describing the relative date or date span you want to display, using the format <Keyword>+/-<Number>.
Keyword indicates the time span you want to use. Options include: DAY, WEEK, QUARTER, SEMI, and YEAR.+ or - indicates whether the time span occurs before or after the chosen date.Number indicates the number of the above-mentioned time spans you want to include in the filter.
For example, if you want to look at all Sales for the prior week, your expression would be: WEEK-1.
To create a relative date filter:1. Following the instructions in 4.7.1, “Using Filters,” on page 88, create a filter based on a date field. The filter appears in
the Filters panel.2. In the filter’s first text entry box, enter an expression describing the relative date or date span you want to display.3. In the filter’s second text entry box, enter the date you want to base your filter on.
For instance, if you want to display all the sales numbers for the month prior to the current date, the expression in the first text entry box would say MONTH-1, and in the second box you would enter today’s date.
4.7.1.2 Advanced Filtering
When you create multiple filters, they are, by default, connected with an implicit AND operator; that is, the data displayed in your table, chart, or crosstab is what remains after all your filters are applied.
However, with the advanced filter functionality, you can exercise greater control over the displayed data by applying an advanced expression that includes more complex, nested AND, OR, and NOT operators, as well as by applying multiple filters to a single field.
Advanced filters are useful in a number of situations, including:When using the AND operator isn’t sufficient. Consider an international company that wants to view data for stores located on the Pacific Rim; they may create an advanced expression with the following criteria:
Country is USA ANDState is California OR Washington OR Oregon OR Hawaii OR Alaska.ORCountry is Japan OR Indonesia
Using the AND operator for all of these criteria returns an empty view, as no store is located in all of those areas.When you need to eliminate some results in a field. For example, if your food and beverage distribution company wants to view sales for all drinks except for high-price items, you might include the following criteria in an advanced expression:
Product Group is BeveragesNOTPrice is greater than 39.99
This filter displays all items in the Beverage Product Group, but filters out those with prices over $39.99
When you right-click a group member in a crosstab and select Keep Only or Exclude, you create complex filters. When you create a filter against an inner group, the filter that appears may be created as a complex filter; a complex filter can’t be edited but it can be removed. Complex filters also appear in the Ad Hoc Editor if a Data Chooser wizard filter was created and locked.
Advanced filters are not available for Ad Hoc views created from OLAP connections.
89

JasperReports Server User Guide
These are only two scenarios where advanced filters can hone your results and make your view more precise. There are, of course, many other situations where they can be applied.
In this section, we take you through these tasks:Creating an advanced expressionEditing an advanced expressionRemoving an advanced expressionApplying multiple filters to a single field
To create and apply an advanced filter:1. Create two or more filters for your data, as described in section 4.7.1, “Using Filters,” above. These can be standard
field-based filters, or Keep Only and Exclude filters.Note that, as you create the filters for use in an advanced expression, you may find that the data in your view disappears, since most (if not all) of the data won’t meet all of the filter criteria. When you create your advanced expression and change some of the ANDs to ORs and NOTs, data reappears in the panel.
2. At the top of the Filters panel, click in the upper right-corner and select Show Expression to display the Filter Expression, for pane. The Filter Expression, for pane is empty by default.
3. In the Filter Expression, for pane, click the Edit button. The Edit Advanced Filters dialog appears.4. In the Edit Advanced Filters dialog, use the filter preview window to locate the filters, and note the letter designations
they have been given.
5. Enter a filter expression using the letter designations, and including the following operators:AND narrows your results and includes only fields that meet the criteria of both filters before and after the operator.OR broadens your results and includes fields that meet the criteria of either filter before or after the operator.NOT excludes results that match the criteria.Parentheses combines multiple filters into a single item in the expression.
6. Check your expression by clicking the Validate button. If your expression works with the available filters, you receive a green “Success” validation message; an incorrect expression receives a red invalid message with a brief description of the problem.
7. When your expression is validated successfully, click Submit. Your view is updated to reflect the newly-applied filter criteria.
After creating an advanced filter, you may want to add another filter to the expression, or remove one already included in the expression.
To add a new filter to an existing advanced expression:1. If necessary, create the new filter in the Filter panel.2. In the Filter Expression, for pane, click Edit to open the Edit Advanced Filters dialog.3. In the Edit Advanced Filters dialog, add the new filter to the expression. Any unused filters appear in the filter preview
window highlighted in gray.4. Click Validate to check the integrity of the new expression.5. When your expression is validated successfully, click Submit.
Advanced filters are applied to views, but filter details don’t appear on previews, or on the report generated from that view.
Filter letter designations are case sensitive, and must be CAPITALIZED.
If the simple filter you wish to delete is part of an advanced filter, you must first remove it from the advanced filter expression; otherwise, deleting the filter deletes the advanced filter expression.
90

Working with the Ad Hoc Editor
To remove a filter from an advanced expression:1. In the Filter Expression, for pane, click Edit to open the Edit Advanced Filters dialog.2. In the Edit Advanced Filters dialog, remove the unwanted filter from the expression, and adjust the expression as needed.3. Click Validate to check the integrity of the new expression.4. When your expression is validated successfully, click Submit.
When working with advanced expressions, you may decide to delete an expression and create a new one.
To remove an advanced expression from a view:1. In the Filter Expression, for pane, click Edit to open the Edit Advanced Filters dialog.2. Clear the expression from the Filter Expression text box.3. Click Submit. The expression is removed, leaving the remaining filters intact.
When you refine your advanced expression, you may also want to delete unused filters from the Filters panel.
If the filter you want to remove isn’t part of the advanced filter, hover your mouse over in the filter’s title bar and select Remove Filter.
If you want to remove all existing filters, including the advanced expression, hover your mouse over in the upper right corner of the Filters panhandle select Remove All Filters.
You can apply multiple simple filters to a single field, if needed, to further refine your advanced filter results. For example, a user may want to view the data in the Shipping Cost field, but only when it meets certain criteria combinations:
When shipping costs to French cities with postal codes that begin with the number 5 are under five EurosWhen shipping costs to German cities with postal codes that begin with the number 1 are under five Euros
In the following example a user has a table including the following columns:CountryPostal CodeShipping Charge
To analyze the specific shipping costs described above, the user creates the following (simple) filters - including two filters each for the Country and Postal code fields:
A. Country equals FranceB. Postal code starts with 5C. Country equals GermanyD. Postal code starts with 1E. Shipping Charge is less than 5
Then, to display only the information she needs, she creates the following advanced expression:((A and B) or (C and D)) and E
This translates to:((FRANCE and POSTAL CODES THAT START WITH 5) or (GERMANY and POSTAL CODES THAT START WITH 1)) and SHIPPING CHARGES LESS THAN 5 EUROS.
4.7.2 Using Input ControlsIn the Ad Hoc Editor, you can display the input controls defined in the Topic as visible to users. You can accept the controls’
default values or enter other values. The Ad Hoc Editor indicates that the view has input controls by displaying as active on the tool bar. Click this icon to select new values or to save values as the new defaults for this view. The following procedure steps through these tasks.
You can recreate the scenario below using the demo for adhoc topic.
91

JasperReports Server User Guide
To add an input control to the view using a filter:1. Create a new filter, or use an existing one in the Filters panel.
2. In Filters, click beside the new filter, and select Show Operator.The filter’s operator appears in a drop-down.
3. Select an operator from the drop-down and enter the in the text box below the drop-down.The filter appears as an input control when the view is used to run the report.
4. Place your cursor over , select Save Ad Hoc View as....
5. Name the view, select a location, and click Save.
6. On the tool bar, click .
Only the input controls defined in the topic appear here. Again, if no input controls were defined in the topic, the button appears inactive. You can create a report and open it in the report viewer to see a filter listed as an input control.
To edit the values for a view’s input controls:
1. On the tool bar, click .A window listing the input controls defined in the Topic appears.
2. Select new values. For example, select USA from the Country drop-down.3. To change default values of input controls, select the check box, Set these values as defaults when saving your view.
The selected values become the default values when you save the view. 4. Click OK.
The Ad Hoc view shows USA data.
4.7.3 Input Controls and Filters AvailabilityInput controls and filters can appear in the Editor and when a report runs:
Input controls can be set to be visible or invisible when you edit a view:Input controls set to Always prompt are displayed in the editor and always appear before the report is run. Input controls that aren’t set to Always prompt are always hidden in the editor and hidden when the report is run.
Filters defined in the Domain design are always hidden in the editor and when the report is run. Filters created in the Data Chooser wizard can be locked or unlocked:
Filters that are unlocked display filter information in the editor and are available from the Options button when the report is run.
Filters that are locked display input controls in the editor when you click to see the view in display mode but are not available from the Options button when the report is run. Users can remove the filter while in the editor, allowing them to see all the data unfiltered when the report is run. You can’t change whether the filter is displayed after the report is created.
Filters defined in the editor are always available in the Filters panel of the editor and from the Options button when the report is run.
When setting up input controls for a huge view that takes a long time to run, consider setting the view to Always prompt. Before a report is run, the report viewer prompts you to provide the input options, preventing the report from running using the default input options.
Filters that are unlocked are available. When input controls or filters don’t appear in the report viewer, click the Options button to view them. You can learn more about how filters and input controls interact in the editor by walking through the data exploration tutorial with the Filters panel open.
The Parameterized Report Topic already includes three input controls, created when the report was uploaded: Country, RequestDate, and OrderId.
92

Working with the Ad Hoc Editor
To set an input control to always prompt:1. Locate a Topic, such as the Parameterized Report Topic, in the repository and click Edit.2. On the Controls & Resources page of the JasperReport wizard, under Input Control Options, select Always prompt:
To determine whether an input control is visible:1. Locate a Topic, such as the Parameterized Report Topic, in the repository and click Edit.2. On the Controls & Resources page, click the name of an input control, such as Country.3. On the Locate Input Control page, click Next.
At the bottom of the Create Input Control page, if the Visible check box is selected, the input control appears on the report when it runs. For more information, see section 5.3.2, “Adding Input Controls,” on page 114.
To lock a filter:1. Click Create > Ad Hoc View.2. In the Data Chooser wizard, click Domains to create a new view based on a Domain. 3. Click Choose Data.4. In Fields, move tables and fields from Source to Selected Fields.5. Click Pre-filters.6. Double-click a field in the Fields panel. 7. In the Filters panel, define a filter as described in section 4.8.1.2, “The Pre-filters Page,” on page 95.8. Check the Locked check box, and click OK.9. Click Table to open the Ad Hoc Editor.
In the Filters panel, the name of the filter and a note about the lock appears under the heading Locked.
4.8 Creating a View from a DomainLike Topics and OLAP connections, administrators and data analysts create Domains for reuse to simplify access to data during view design. Domains give view makers more flexibility than Topics in choosing fields from the database and allow filtering of the data before it is included in a view and the subsequent report.
A view based on a Domain can prompt the user for input that determines what data is presented. For example, if a Domain includes all sales data for a company, the view can present detailed information grouped by postal code and prompt the user to select the geographic area, such as a US state. The view displays only the pertinent information.
For a more complete description of how to create Domains, see section 6.2, “Example of Creating a Domain,” on page 150.
To begin creating create a basic view from a Domain: 1. On the Home page, click Create > Ad Hoc View. The Data Chooser wizard opens. 2. Click Domains. The list of the available domains appears.
If you don’t provide a default value for the input control, users are prompted to select a value when they create a view based on the Topic.
93

JasperReports Server User Guide
A description of the selected Domain appears at the bottom of the Domains tab.3. Select the domain you want to use.4. Click Choose Data. The Data Chooser opens to the Select Fields page.
You are now ready to configure your data using the Data Chooser Wizard.
4.8.1 Using the Data Chooser WizardTo design a Domain Topic or a view based on a domain, use the Data Chooser wizard. To open the Data Chooser wizard, click Create > Ad Hoc View. Select Domains, click a Domain, and click Choose Data to access the following pages of the Data Chooser wizard:
The Select Fields Page – Choose the fields to make available in the Ad Hoc Editor.The Pre-filters Page – Define a filter on any field, with the option of prompting for user input, or to compare fields.The Display Page – Change the order and names of fields that appear in the Ad Hoc Editor.The Save as Topic Page – Save the settings as a Domain Topic.
You must first select some fields on the Select Fields page, but the other three pages are optional and can be completed in any order. Click Table, Chart, or Crosstab at any time to begin designing a view based on the chosen data.
4.8.1.1 The Select Fields Page
Use this page to choose fields and sets of fields to use in the view or make available in the Domain Topic:
Figure 4-9 Simple Domain Selected in the Ad Hoc Sources Dialog
94
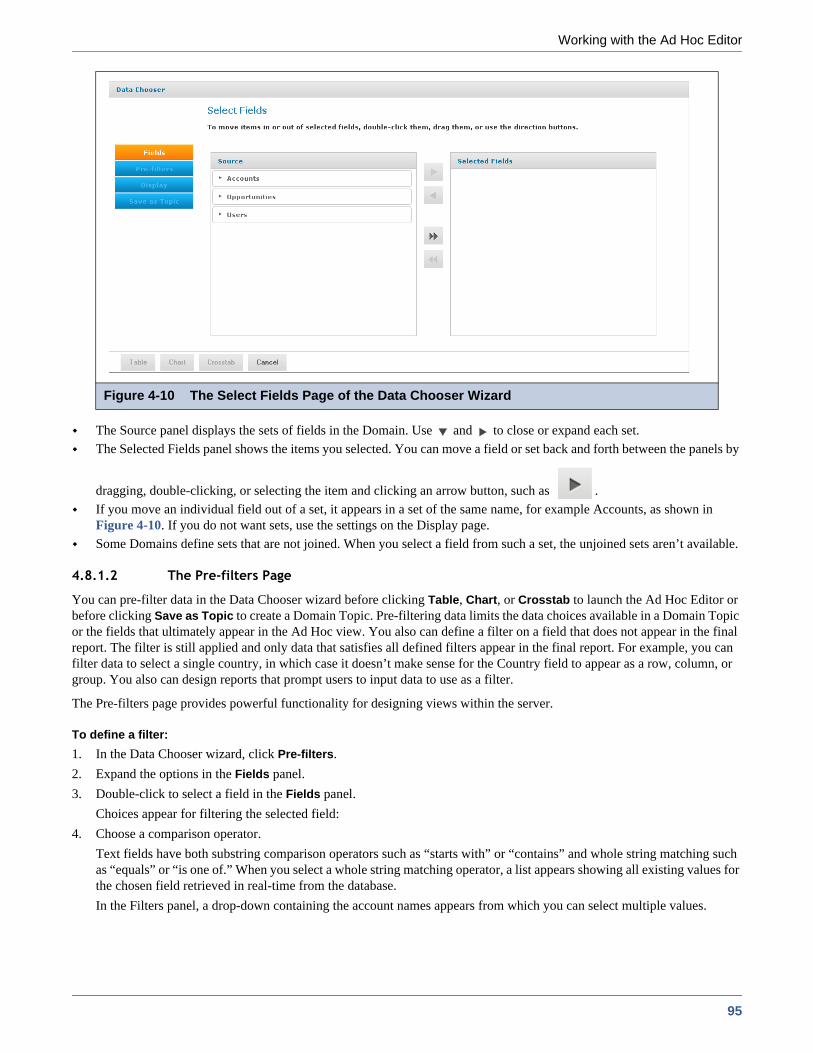
Working with the Ad Hoc Editor
The Source panel displays the sets of fields in the Domain. Use and to close or expand each set.The Selected Fields panel shows the items you selected. You can move a field or set back and forth between the panels by
dragging, double-clicking, or selecting the item and clicking an arrow button, such as .If you move an individual field out of a set, it appears in a set of the same name, for example Accounts, as shown in Figure 4-10. If you do not want sets, use the settings on the Display page.Some Domains define sets that are not joined. When you select a field from such a set, the unjoined sets aren’t available.
4.8.1.2 The Pre-filters Page
You can pre-filter data in the Data Chooser wizard before clicking Table, Chart, or Crosstab to launch the Ad Hoc Editor or before clicking Save as Topic to create a Domain Topic. Pre-filtering data limits the data choices available in a Domain Topic or the fields that ultimately appear in the Ad Hoc view. You also can define a filter on a field that does not appear in the final report. The filter is still applied and only data that satisfies all defined filters appear in the final report. For example, you can filter data to select a single country, in which case it doesn’t make sense for the Country field to appear as a row, column, or group. You also can design reports that prompt users to input data to use as a filter.
The Pre-filters page provides powerful functionality for designing views within the server.
To define a filter:1. In the Data Chooser wizard, click Pre-filters.2. Expand the options in the Fields panel.3. Double-click to select a field in the Fields panel.
Choices appear for filtering the selected field:4. Choose a comparison operator.
Text fields have both substring comparison operators such as “starts with” or “contains” and whole string matching such as “equals” or “is one of.” When you select a whole string matching operator, a list appears showing all existing values for the chosen field retrieved in real-time from the database. In the Filters panel, a drop-down containing the account names appears from which you can select multiple values.
Figure 4-10 The Select Fields Page of the Data Chooser Wizard
95

JasperReports Server User Guide
5. Click each value for comparison in Available Values to move it to Selected Values.
The account names appear in Selected Values.6. To limit the view design to the four account names in Selected Values, check the Locked check box:
By default, the Locked check box is unchecked, making the filter available to end-users when they run the report. In the Report Viewer, users can click the Options button to enter a comparison value for this condition; when the user clicks Apply or OK, the report preview refreshes with data that match the condition. The condition is available as a prompt even if the filtered field does not appear in the report. For example, the final report might present data for a single country, but the country is chosen by the user. Once defined, filter prompts can be modified in the Ad Hoc Editor, as explained in section 4.7.2, “Using Input Controls,” on page 91.Note that when the Locked check box is checked, the filter is not available to end-users when they run the report. The condition can only be removed from the view, if needed, but not edited.
7. Click OK to define the filter.The Filters panel shows the filters you have defined.
8. In the Filters panel, click Change to modify the condition. Click OK to save the changes. After selecting a row, you can also click Remove to delete it from the list.
If there are more than 50 values to display in Available Values, click to search for the value. The maximum number of items that can be displayed in Available Values is configurable. For details, see the JasperReports Server Administrator Guide.
Figure 4-11 Condition Editor in the Filters Panel on the Pre-filters Page
Data rows must match all conditions. In other words, the overall filter applied to the data is the logical AND of all conditions you have defined.
96

Working with the Ad Hoc Editor
4.8.1.3 The Display Page
Use the Display page to change the default label and order of the fields as they should appear in the list of fields in the Ad Hoc Editor. You can always change the field labels and ordering in the Ad Hoc Editor, but setting them here makes them available in a Domain Topic. The page includes these options:
To change the order of fields, click once anywhere in a field’s row and use the Move to top, Move up, Move down, or Move to bottom buttons:
, , , and Fields may be moved only within their set, but sets as a whole may be also be moved.By default, the field name becomes the display label for the row, column, or measure that you create from the given field. To change the default display label of a field or set, double-click anywhere in the row and type the new label in the text box. Sets and the fields they contain appear in the list of fields in the Ad Hoc Editor. Sets are not used in views, but can be used to add all their fields at once, expediting view creation.If you don’t want to use sets in the Ad Hoc Editor, select Flat List at the top of the Data Source Selection panel. You can now relabel the fields and reorder them.
4.8.1.4 The Save as Topic Page
On the Save as Topic page, you can enter a name and a description to save the Data Chooser settings as a Domain Topic. Thereafter, you can create different views from the Domain Topic, using its fields, filters, and display label settings. You can also edit the Domain Topic to change the settings.
After you enter a name for the Domain Topic, save it by clicking Table, Chart, or Crosstab from any page in the wizard. The Ad Hoc Editor opens in table, chart, or crosstab mode, respectively, ready to use the fields, filters, and display label settings.By default, Domain Topics are saved in the standard Topics folder. This corresponds to the Ad Hoc Components > Topics location in the repository; JRXML Topics and Domain Topics in this folder appear on the Topics tab when you start a view. Do not modify this folder name.The description text appears with the Domain Topic in the repository and at the bottom of the Topics tab on the Ad Hoc Source dialog. Enter an informative description that helps users understand the nature and purpose of this Domain Topic.
4.9 Creating TopicsWhen a user clicks Create > Ad Hoc View on the Home page, the list of Topics on the Topics tab is populated from the Ad Hoc Components/Topics folder in the repository. There are two types of Topics:
JRXML-based Topics – Created by administrators using iReport and uploaded as JRXML files to the proper location in the repository. Topics are typically of this type.Domain Topics – Created from a Domain by administrators using JasperReports Server.
Either type of Topic is an empty view associated with a data source in the server, and is then built on in the Ad Hoc Editor.
4.9.1 Creating and Uploading a TopicJRXML-based topics are the most common type of topic. You can upload previously-created JRXML topics via the repository.
To upload a JRXML-based Topic:1. Log into the server as administrator and select View > Repository.
While any user with sufficient repository permissions can upload a Topic to the server, this example requires an administrator login to access the JServer Jdbc data source.
97

JasperReports Server User Guide
2. Locate the folder where Topics are stored. The location of the Topics folder depends on your system configuration; by default, Topics are in the Ad Hoc Components > Topics folder.
3. Right-click the Topics folder and select Add Resource > JasperReport from the context menu.
After selecting Add Resource > JasperReport, the Set Up the Report page of the JasperReport wizard appears.4. In the Set Up the Report page, give the Topic a name, a Resource ID, and an optional description, then click Next.
The Name field is the visible name of the file in the repository, such as Example Topic.The Resource ID field is the internal ID of the object, such as Example_Topic. The server does not accept spaces in an internal ID.The Description field, such as Topic uploaded for User Guide example, helps users understand the purpose of the file.
5. In the Locate the JRXML File section, select Upload a Local File, and click Browse to locate the file and upload the Topic from the file system. In this example, the file is <js-install>/samples/adhoc/topics/adhoc_sample.jrxml.
6. Click Data Source.
7. Click Select data source from repository and Browse to locate the data source named Data Sources/JServer Jdbc data source.Topics must be associated with the data source that they were designed for.
8. Click Next.9. In Locate Query, click Submit.
Topics usually do not need a query or customization, but you can define them.
When you select Create > Ad Hoc View, the Example Topic appears on the Topics tab of the Data Chooser wizard. If you select the Example Topic, you can create a report using the columns available in the data source selected in step 7.
When you create a JRXML file for use as a Topic, you can specify the name to display for each field that the Topic returns. To do so, define a field property named adhoc.display for each field declared in the JRXML. The adhoc.display field property must have the following syntax:
<property name=”adhoc.display” value=”Any Name”/>
For example, this JRXML code declares a StoreState field that is displayed in reports as Store State:
Topics also support the $R expressions for field names; for more information, see section 5.6, “Localizing Reports,” on page 128.
For fields in a non-domain topic the following properties may be of interest:dimensionOrMeasure: marks a field as a field or a measuredefaultAgg: which aggregation should be used for this measure (avg, etc)semantic.item.desc: A description for the fieldDefaultMask: set a measure as a $, date etc
Add Resource appears on the context menu only if your login account has write privilege to the folder.
To locate adhoc_sample.jrxml, you need access to the server host file system.
Because this is a simple Topic without parameters, there are no controls and resources associated with it. If the Topic has a Parameterized query, you can create input controls for it. See section 5.3.3, “Selecting a Data Source for Running the Complex Report,” on page 124. Such input controls can appear in the Ad Hoc Editor and when the report is run.
<field name=”StoreState” class=”java.lang.String”>
<property name=”adhoc.display” value=”Store State”/>
</field>
98

Working with the Ad Hoc Editor
4.9.2 Creating Topics from DomainsIn some circumstances, it is important to create a Topic based on the Domain and data settings you chose. In other circumstances, creating a Topic isn’t necessary. The main consideration is how reports based on the Domain-based view are used. The following table explains the choices:
4.9.2.1 Access Permissions in Domain Topics
If other users create reports from your Domain Topic-based view, and the Domain is configured for security, it is important to consider everyone’s access permissions. You might not have access to all of the fields in the Domain nor to all the data in those fields. There may be fields that can be seen only by other users, and in the fields that you can see, there may be data that is hidden from you. When you save the Domain as a Topic, only the fields that you selected appear in the Domain Topic. When you create a view from the Topic, only the data that you can access in those fields appears. When others create views from the Topic, they see only fields that they have permission to access. These rules also apply to the reports generated from these views.
For example, in a Domain, user Tomas can access fields B-C and data rows 1-3; Anita can access fields C-E and data rows 2-5. Tomas uses the Data Chooser wizard and saves a Domain Topic based on the Domain. When Tomas and Anita create reports from the same view, they see different combinations of fields and the data in them.
If you want to … Then do this Explanation
Create a single-use report from the Domain with your settings.
Click Table, Chart, or Crosstab after defining your settings in the Data Chooser wizard, then format the view and create your report.
Your field selections appear in the Ad Hoc Editor and you can create views from them, but the settings themselves are not saved.
Run a report repeatedly as is or with prompting for new input, or make very similar reports in the Ad Hoc Editor.
Click Table, Chart, or Crosstab after defining your settings in the Data Chooser wizard, then format and save the view in the Ad Hoc Editor.
After you save a view, users can create reports to be run from it repeatedly and be prompted for input each time if you defined unlocked filters.
Reuse your field, filter, and display settings on this Domain to create new views with different formatting.
After saving your settings as a Domain Topic on the Save as Topic page of the Data Chooser wizard, start a new view and choose your Domain Topic from the Domains tab.
Domain Topics are saved in JRXML format in the repository. They appear on the Topics tab when you start a view.
Be able to modify one or more of the settings you made in the Data Chooser wizard.
After saving your settings as a Domain Topic on the Save as Topic page of the Data Chooser wizard, find your Domain Topic in the repository and open it in the Domain Designer.
Domain Topics can be edited as described in section 4.9.2.3, “Editing a Domain Topic,” on page 100. After you save your changes, you can create views based on the modified Domain Topic.
Create views from the same repository data source but with different Domain settings, such as derived fields and different joins to make new fields available in a report.
Edit the Domain and save it with a new name. Then start a new view and choose your data from the new Domain.
Domains provide advanced functionality such as table joins and derived fields based directly on a data source. Domains usually require administrator permissions to create and modify.
Fields Data
Tomas’s report from his Domain Topic B C 1 2 3
Anita’s report from the same Domain Topic C 2 3 4 5
99

JasperReports Server User Guide
Even though Anita has permission to see more fields, they are not available to her because Tomas did not have access to them when he created the Domain Topic. However, Anita does have permission to see more data than Tomas, so when she creates a view, or opens or runs the report based on that view, she can see more rows than Tomas can when he views the report. See section 8.4, “The Domain Security File,” on page 220 for a technical explanation of data security for Domains. See the note in section 6.6, “Editing a Domain,” on page 178 about the impact of editing a Domain or Domain Topic.
4.9.2.2 Saving Domain Settings as a Domain Topic
To save settings in the Data Chooser wizard as a Domain Topic:1. While making selections in the Data Chooser wizard, navigate to the Save Topic page.2. Enter a Topic name and description.
Do not change the location folder. Using the default /adhoc/topics folder makes the saved Domain Topic available on the Topics tab when you select Create > Ad Hoc View.
3. If your data selections, filter definitions, and display settings are complete, click Table, Chart, or Crosstab.
The new Topic appears in the Ad Hoc Components > Topics folder. Because a Domain Topic is a type of report, it appears when the Search page is filtered to show reports:
4.9.2.3 Editing a Domain Topic
You can modify a Domain Topic you created using the Data Chooser wizard.
To edit the settings in a Domain Topic:1. Select View > Repository and search (or browse) for the Domain Topic you want to modify.
Domain Topics are usually kept in the Ad Hoc Components > Topics folder.2. Right-click the Domain Topic and select Open in Designer from the context menu.
The Domain Topic opens in the Data Chooser wizard.3. Follow the guidelines in section 4.8.1, “Using the Data Chooser Wizard,” on page 94 to edit the Domain Topic as
needed.4. To save changes to the selected Domain Topic, click Table, Chart, or Crosstab on any page.
To save changes as a new Domain Topic, navigate to the Save as Topic page and enter identifying information for the new Topic, then click Table, Chart, or Crosstab.
If settings are incomplete, navigate to the other pages to finish, then click Table, Chart, or Crosstab
Use caution when editing Domain Topics that may have been used to create other views. Users who relied on the Domain Topic might receive unexpected data or errors. It is safer to save changes as a new Domain Topic.
100

Adding Reports Directly to the Repository
CHAPTER 5 ADDING REPORTS DIRECTLY TO THE REPOSITORY
Using the Ad Hoc Editor, you can create reports within JasperReports Server from pre-defined Topics and Domains. You can also create reports outside of JasperReports Server and add them to the repository. To add a report to the repository, you need to have a valid JRXML file. To create and validate this file, you can use iReport Designer. Jaspersoft recommends iReport for most users because its graphical user interface simplifies the job. You can also use a text editor to create the file containing JRXML code if you have a thorough understanding of the JasperReports file structure.
You can add a report to the server’s repository in two ways:From within the serverAdd a JRXML file and any other resources the report needs as a report unit. A wizard guides you through each step.From iReport DesignerDesign the report in iReport, and use the JasperReports Server Plug-in to add the JRXML and resources to the repository.
This chapter includes examples of adding a report to the repository using the server’s wizard and the plug-in. The chapter contains the following sections:
Overview of a Report UnitAdding a Simple Report Unit to the ServerAdding a Complex Report Unit to the ServerAdding Cascading Input Controls to a ReportEditing JRXML Report UnitsLocalizing Reports
5.1 Overview of a Report UnitIn the server, a report unit is the collection of elements for retrieving data and formatting output. Figure 5-1 on page 102 shows these elements:
The data source and query that retrieves data for the report.The main JRXML that determines the layout and is the core of the report unit.The main JRXML defines other elements in one of the following ways:
This section describes functionality that can be restricted by the software license for JasperReports Server. If you don’t see some of the options described in this section, your license may prohibit you from using them. To find out what you're licensed to use, or to upgrade your license, contact Jaspersoft.
101

JasperReports Server User Guide
Creating definitions internallyReferring to existing elements in the repository using the repo: syntax
The input controls and other resources.
For more information about the report unit, refer to the JasperReports Server Ultimate Guide.
5.2 Adding a Simple Report Unit to the ServerThis section presents an example of uploading a JRXML to the server. The report only has two image resources. The example defines a custom query for the report unit.
To add the simple report unit to the server, you need access to the following sample data installed with the server:<js-install>/samples/reports/AllAccounts.jrxml <js-install>/samples/images/logo.jpg files
5.2.1 Uploading the Main JRXMLIf you want to validate the JRXML before uploading it, use iReport. The server doesn’t validate the JRXML when you upload it.
This procedure shows you how to set up a name for the report in the repository and upload the main JRXML file that references all other elements.
To upload the main JRXML for the simple report example:1. Log into the server as administrator and select View > Repository.
Figure 5-1 Elements of a Report Unit
If you log in as a user, you can upload a report unit to the server, but this example requires an administrator login to access the image resources.
Data Source
Main JRXMLInput Controls
Query
Resources *
ReportData
ReportOutput * Images, fonts, resource
ReferencesData Flow bundles, and scriptlets
102

Adding Reports Directly to the Repository
2. Locate the folder where you want to add the report.For example, go to Organization > Reports > Samples.
3. Right-click the Samples folder and select Add Resource > JasperReport from the context menu.
The Set Up the Report page of the JasperReport wizard appears.4. In Naming, enter the name and description of the new report, and accept the Resource ID generated as you type the name:
NameDisplay name of the report: New Simple ReportResource IDPermanent designation of the report object in the repository: New_Simple_ReportDescriptionOptional description displayed in the repository: This is a simple example
5. Select Upload a Local File and Browse to <js-install>samples/reports/AllAccounts.jrxml.
Figure 5-2 shows the Set Up the Report page.
Add Resource only appears on the context menu if your user account has write permission to the folder.
You can upload a new JRXML or select a JRXML from the repository.
Figure 5-2 Required Set Up Values
103
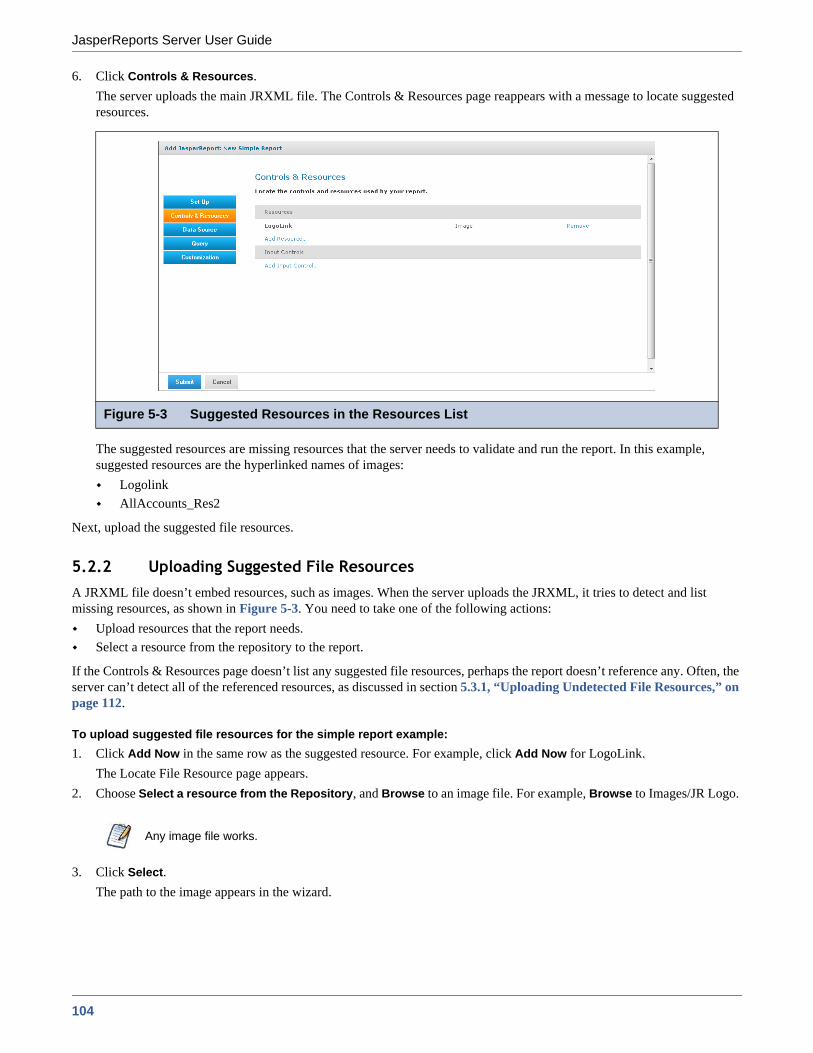
JasperReports Server User Guide
6. Click Controls & Resources.The server uploads the main JRXML file. The Controls & Resources page reappears with a message to locate suggested resources.
The suggested resources are missing resources that the server needs to validate and run the report. In this example, suggested resources are the hyperlinked names of images:
LogolinkAllAccounts_Res2
Next, upload the suggested file resources.
5.2.2 Uploading Suggested File ResourcesA JRXML file doesn’t embed resources, such as images. When the server uploads the JRXML, it tries to detect and list missing resources, as shown in Figure 5-3. You need to take one of the following actions:
Upload resources that the report needs.Select a resource from the repository to the report.
If the Controls & Resources page doesn’t list any suggested file resources, perhaps the report doesn’t reference any. Often, the server can’t detect all of the referenced resources, as discussed in section 5.3.1, “Uploading Undetected File Resources,” on page 112.
To upload suggested file resources for the simple report example:1. Click Add Now in the same row as the suggested resource. For example, click Add Now for LogoLink.
The Locate File Resource page appears.2. Choose Select a resource from the Repository, and Browse to an image file. For example, Browse to Images/JR Logo.
3. Click Select. The path to the image appears in the wizard.
Figure 5-3 Suggested Resources in the Resources List
Any image file works.
104
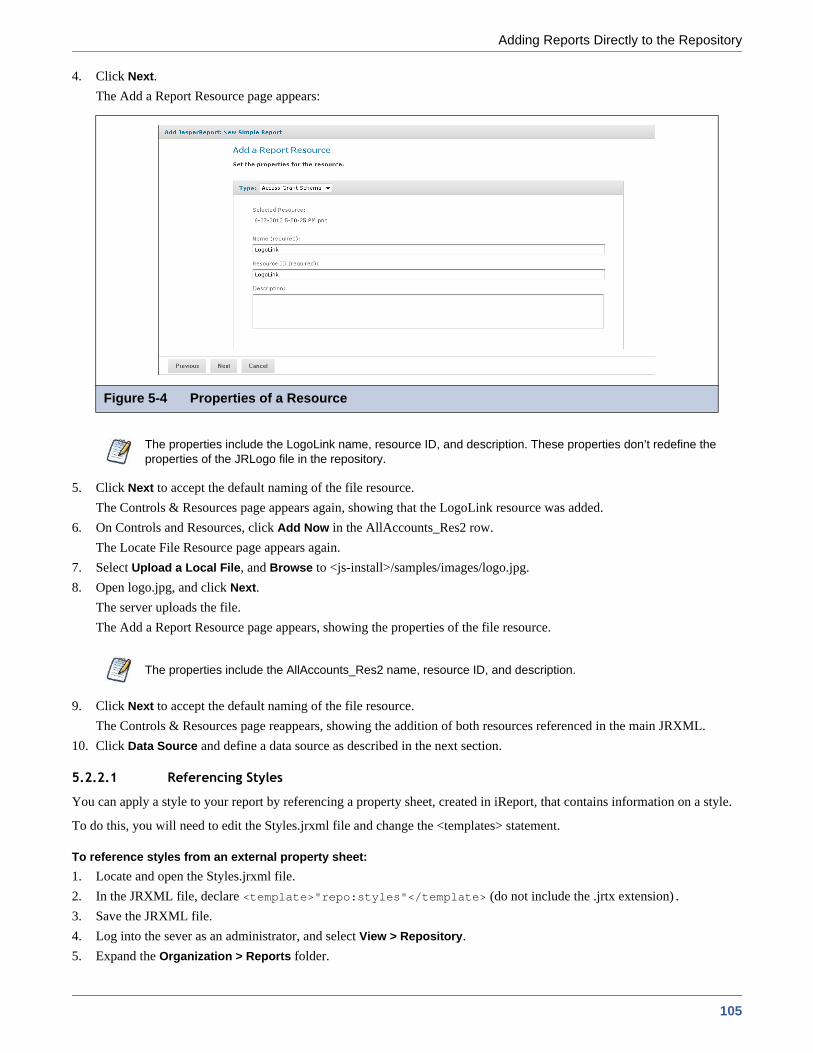
Adding Reports Directly to the Repository
4. Click Next.The Add a Report Resource page appears:
5. Click Next to accept the default naming of the file resource.The Controls & Resources page appears again, showing that the LogoLink resource was added.
6. On Controls and Resources, click Add Now in the AllAccounts_Res2 row. The Locate File Resource page appears again.
7. Select Upload a Local File, and Browse to <js-install>/samples/images/logo.jpg.8. Open logo.jpg, and click Next.
The server uploads the file. The Add a Report Resource page appears, showing the properties of the file resource.
9. Click Next to accept the default naming of the file resource.The Controls & Resources page reappears, showing the addition of both resources referenced in the main JRXML.
10. Click Data Source and define a data source as described in the next section.
5.2.2.1 Referencing Styles
You can apply a style to your report by referencing a property sheet, created in iReport, that contains information on a style.
To do this, you will need to edit the Styles.jrxml file and change the <templates> statement.
To reference styles from an external property sheet:1. Locate and open the Styles.jrxml file.2. In the JRXML file, declare <template>"repo:styles"</template> (do not include the .jrtx extension).3. Save the JRXML file.4. Log into the sever as an administrator, and select View > Repository.5. Expand the Organization > Reports folder.
Figure 5-4 Properties of a Resource
The properties include the LogoLink name, resource ID, and description. These properties don’t redefine the properties of the JRLogo file in the repository.
The properties include the AllAccounts_Res2 name, resource ID, and description.
105
JasperReports Server User Guide
6. Right-click the Samples folder and select Add Resource > JasperReport to open the Add JasperReport wizard.7. On the Set Up page, enter the required information.8. Select Upload a Local File and click Browse...9. Locate Styles.jrxml, and click Open.10. Click Submit.11. Copy the base_styles.jrtx file from the directory:
<jrs-install>\ireport\demo\samples\templates\reports
and place into the C:\ directory.12. Edit the styles.jrtx file and add C:\\ before base_styles.jrtx.13. Back on the server, select View > Repository, then expand the Organization folder.14. Right-click Images, and select Add Resource > File > Style Template.15. Under Path to File,click Browse... then locate the style.jrtx file.16. Enter a Name (Styles) and click Submit.17. In the repository, open the Reports > Styles folder, then right click on Styles report and select Edit.18. Click Control & Resources, then click the Add Resource... link.19. Select Select a resource from the Repository radio button, Browse...20. Locate Organization > Images > Styles, and click Select.21. Click Next button22. On the Add a Report Resource screen, enter Name: Styles, then click Next.23. Click Submit
5.2.3 Defining the Data SourceData sources belong to the report engine, JasperReports Server, and are not defined in the main JRXML. The JRXML does not retain any data source defined in iReport when you add the JRXML to the server. You need to define a data source in the server that the report unit can use. From the Data Source page, select a data source in the repository or create a new data source on-the-fly. The data source can be different from the database configured for JasperReports Server if the application server can find its driver. For example, in a default installation of JasperReports Server, Tomcat looks for data source drivers in <js-install>/apache-tomcat/lib. Put a copy of the driver in this location.
To define the data source for the simple report example:1. In the JasperReport wizard, click Data Source.
The Link a Data Source to the Report page presents these choices:Do not link a data source – Select or define the data source at a later time. You see an error if you run the report in this state.Click here to create a new data source – Define a new data source that is only available to your report.Select data source from repository – Select an existing data source from the repository.
106

Adding Reports Directly to the Repository
2. Choose Select data source from the Repository and Browse to /Data Sources/JServer JNDI Data Source. Click Select. The path to the data source appears.
3. Click Query to define the Query as described in the next section.
5.2.4 Defining the QueryThe query in the report unit determines the data that the server retrieves from a data source. You can use an existing query or define a new one. You can create multiple reports that look the same but contain different data by defining different queries for the same JRXML file. The simple report example defines a custom query that displays accounts from a single country.
To define a custom query for the simple report example:1. In the JasperReport wizard, click Query.
The Locate Query page presents these choices:Do not link a Query – Uses the query, if there is one, defined within the main JRXML. If the main JRXML doesn’t have a query, you can’t run the report.Click here to create a new Query – Guides you through defining a new query, only available to your report.Select a Query from the Repository – Selects an existing query from the repository.
The AllAccounts.jrxml file uploaded in section 5.2.1, “Uploading the Main JRXML,” on page 102 already contains a query. This example overrides the existing query by defining a new one.
Figure 5-5 Data Source Page
107

JasperReports Server User Guide
2. On the Query page, select the Click here to create a new Query option:
3. Click the link, Click here to create a new Query.The Name the Query page appears where you can enter the name, resource ID, and description of the query. This query and its properties are visible only within the report unit.
4. In this example, the query must retrieve only Canadian accounts. Enter the following values:Name – CanadaAccountsResource ID – CanadaAccountsDescription – Query for New Simple Report in User Guide
5. Click Next. The Link a Data Source to the Query page appears.The Link a Data Source to the Query page appears. You can select a query from the repository, define a new one, or select not to link a data source.
6. Select Do not link a data source to use the data source you selected in section , “You can apply a style to your report by referencing a property sheet, created in iReport, that contains information on a style.,” on page 105.
7. Click Next. The Define the Query page appears.
Figure 5-6 Query Page
Figure 5-7 Name the Query Page
108

Adding Reports Directly to the Repository
8. Select SQL in the Query Language drop-down and enter the following Query String to retrieve only Canadian accounts: SELECT * FROM accounts WHERE billing_address_country = ‘Canada’ ORDER BY billing_address_city
9. Click Save to save the query. The Customization page appears. No customization is required. 10. Click Submit to submit the new report unit to the repository.
5.2.5 Saving the New Report UnitTo submit a new report unit to the repository, click Submit on any page of the JasperReport wizard, from the Set Up page to the Customization page. You don’t have to set options on pages, such as Customization, you do not need. When you click Submit, the server validates the report unit. After clicking Submit, a message appears at the top of the repository page, indicating that the report was successfully saved. The report appears in the repository with the description you entered on the Set Up page. To run the report and view the output, click its name, New Simple Report.
Figure 5-10 on page 110 shows the output, only Canadian accounts.
Figure 5-8 Definition of a Query
Figure 5-9 New Simple Report Added to the Repository
109
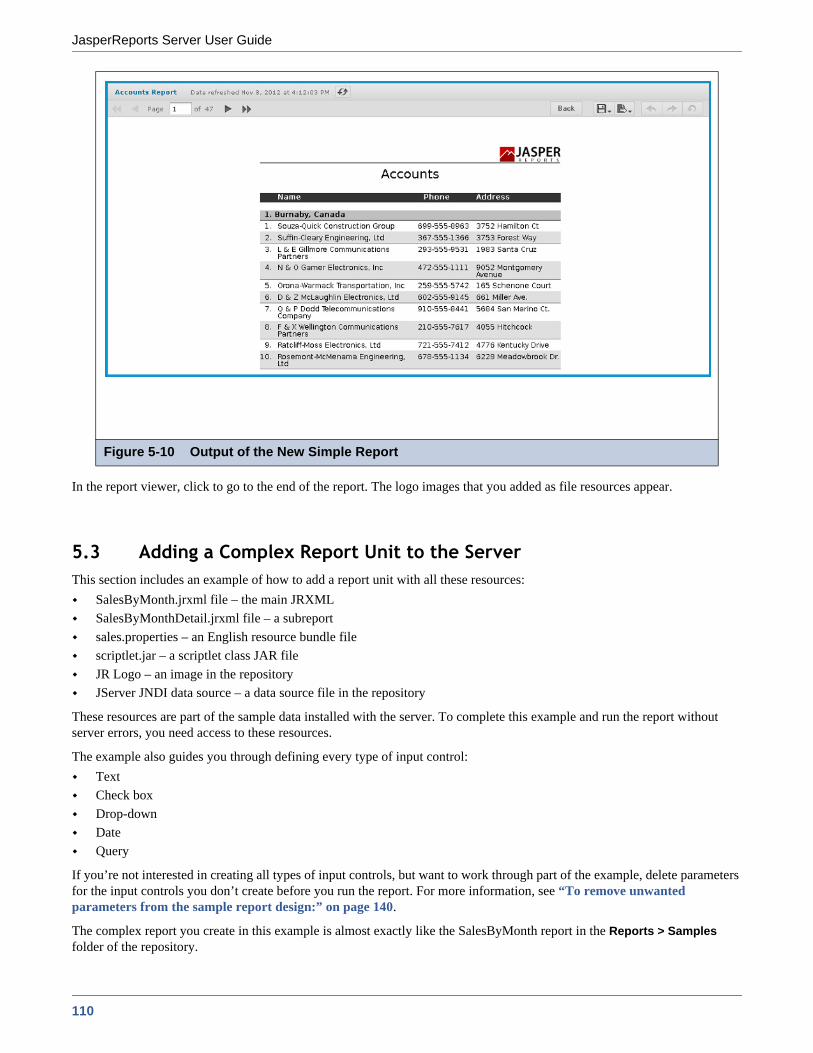
JasperReports Server User Guide
In the report viewer, click to go to the end of the report. The logo images that you added as file resources appear.
5.3 Adding a Complex Report Unit to the ServerThis section includes an example of how to add a report unit with all these resources:
SalesByMonth.jrxml file – the main JRXMLSalesByMonthDetail.jrxml file – a subreportsales.properties – an English resource bundle filescriptlet.jar – a scriptlet class JAR fileJR Logo – an image in the repositoryJServer JNDI data source – a data source file in the repository
These resources are part of the sample data installed with the server. To complete this example and run the report without server errors, you need access to these resources.
The example also guides you through defining every type of input control: TextCheck boxDrop-downDateQuery
If you’re not interested in creating all types of input controls, but want to work through part of the example, delete parameters for the input controls you don’t create before you run the report. For more information, see “To remove unwanted parameters from the sample report design:” on page 140.
The complex report you create in this example is almost exactly like the SalesByMonth report in the Reports > Samples folder of the repository.
Figure 5-10 Output of the New Simple Report
110

Adding Reports Directly to the Repository
To upload the main JRXML and suggested resource files for the complex report unit:1. Log into JasperReports Server as administrator and select View > Repository.
2. Navigate to a folder to add the report. For example, navigate to Organization > Reports > Samples.3. Right-click the Samples folder and select Add Resource > JasperReport from the context menu.
The Set Up the Report page appears.4. On the Set Up the Report page, enter these properties:
Name – New Complex ReportResource ID – New_Complex_ReportDescription – This is a complex report
5. Select Upload a Local File.6. Click Browse to locate the file <js-install>/samples/reports/SalesByMonth.jrxml. 7. Click Controls & Resources.
On the Controls & Resources page, the list of suggested resources appears:A sub-report (the SalesByMonthDetail.jrxml file) A logo image
Figure 5-11 shows the list of suggested resources.
8. On the Controls & Resources page, upload the sub-report:a. Click Add Now in the same row as SalesByMonthDetail.
The Locate File Resource page appears.b. Select Upload a Local File.c. Click Browse and locate the file <js-install>/samples/reports/SalesByMonthDetail.jrxml. Select
SalesByMonthDetail.jrxml.
If you log in as a user, you can upload a report unit to the server, but this example requires an administrator login to access the image resources.
Add Resource only appears on the menu if your user account has write privilege to the folder.
Figure 5-11 Suggested Resources for the Complex Report
111

JasperReports Server User Guide
The path to SalesByMonthDetail.jrxml appears in the Upload a Local File field.d. On the Locate File Resource page, click Next.e. On the Add a Report Resource page, click Next to accept the default report resource name and resource ID.
9. On the Controls & Resources page, upload the logo image resource:a. In the same row as Logo, click Add Now.
The Locate File Resource page appears.b. On the Locate File Resource page, click Select a resource from the Repository.c. Click Browse to locate the file /Images/JR Logo and select JR Logo.d. Click Next.
The Add a Report Resource page appears.e. On the Add a Report Resource page, click Next to accept the default name, resource ID, and description: Logo.The second suggested resource is added.
5.3.1 Uploading Undetected File ResourcesThe JasperReport wizard can’t detect every type of resource referenced in the main JRXML. You need to know the names of these resources and add them to the report; otherwise, the server can’t validate the report. This document provides you with the names of these resources, but if you wanted to discover these names, use the JasperReports Server Plug-in to open the JRXML in iReport and examine its parameters and properties. For more information about the JasperReports Server Plug-in, see Chapter 7, “Accessing Reports and Domains from iReport,” on page 185.
These are the undetected resources in the SalesByMonth.jrxml:A scriptlet JAR – The scriptlet writes the message, “I’m a scriptlet in a jar,” to the last page of the report output. An English language resource bundle. The optional Romanian language resource bundle.If you’re interested in working with a multi-lingual report, add the Romanian resource bundle. The Romanian resource bundle is part of the sample data installed with the server.
On the Controls & Resources page, upload the undetected resources to the server using exactly the same name for the resource ID as iReport uses.
To upload the undetected file resources for the complex report example:1. Add and upload the scriptlet JAR file:
a. On the Controls & Resources page, click Add Resource.b. On the Locate File Resource page, select Upload a Local File, and click Browse to locate the <js-install>/samples/
jars/scriptlet.jar file. Select scriptlet.jar.The path to the file appears in the Upload a Local file field.
c. Click Next.The Add a Report Resource page appears. Figure 5-12 on page 113 shows that the file name scriptlet.jar appears, indicating that the server successfully loaded and automatically detected the JAR.
d. Enter the following information; the Resource ID is referenced in the main JRXML file, so do not change it:Name – ScriptletResource ID– ScriptletDescription – Scriptlet JAR for complex report
Figure 5-12 on page 113 shows these values entered on the Add a Report Resource page.
112

Adding Reports Directly to the Repository
2. Click Next.3. Add and upload the English resource bundle:
a. On the Controls & Resources page, click Add Resource again.The Locate File Resource page appears.
b. Select Upload a Local File, click Browse to locate the file <js-install>/samples/resource_bundles/sales.properties. Select the file.The path to the resource bundle appears in the Upload a Local file field.
c. In Locate File Resource, click Next. The Add a Report Resource page indicates that the file was successfully loaded and automatically detected as a resource bundle.
d. Enter the following information:Name – sales.propertiesResource ID – sales.propertiesDescription – Default English resource bundle
4. Click Next.5. Add and upload the Romanian Resource bundle:
a. On the Controls & Resources page, click Add Resource again.b. Select Upload a Local File and click Browse to locate this file:
<js-install>/samples/resource_bundles/sales_ro.propertiesc. In Locate File Resource, click Next.
The Add a Report Resource page shows that uploading the file was successful. The server recognized the type (resource bundle) and name (sales_ro.properties) of the selected resource.
d. Enter the following information:Name – sales_ro.properties
Figure 5-12 Scriptlet JAR Resource Properties
Enter the Resource ID field exactly as shown.
113

JasperReports Server User Guide
Resource ID – sales_ro.properties
Description – Romanian resource bundlee. Click Next.
Controls & Resources lists all the files:
If you want to upload a different file for a named resource, click its resource ID in the Resources list and locate the new file or repository object. You can also change the name and description of the resource, but not its resource ID. If there’s a mistake in a resource ID:
Locate the ID in the list of resources on the Controls & Resources page, and click Remove.Re-add the resource, entering the correct resource ID.
5.3.2 Adding Input ControlsInput controls are graphical widgets the server displays with the report. Input controls perform the following functions:
Prompt the user for inputValidate the format of the inputPass the input to the report
Based on the input, the server modifies the WHERE filter clauses in SQL parametrized queries.
Input controls correspond to the parameters defined in JRXML reports, such as $P{name}. The server maps the value that the user enters for the input control to the parameter of the same name. If you define an input control in the JasperReport and the server can’t find a parameter by the same name in the JRXML, the input control doesn’t function when the report runs.
When you create an input control, you define, or use a predefined, datatype, for user entries. Datatypes define the expected input (numbers, text, date, or date/time) and can include range restrictions that the server enforces. The server uses the datatype to classify and validate the data.
Enter the Resource ID field exactly as shown.
Figure 5-13 List of Detected and Undetected File Resources
The JRXML can define a default value for the input control. To prevent users from changing the default, you can make the input control read-only or invisible.
114
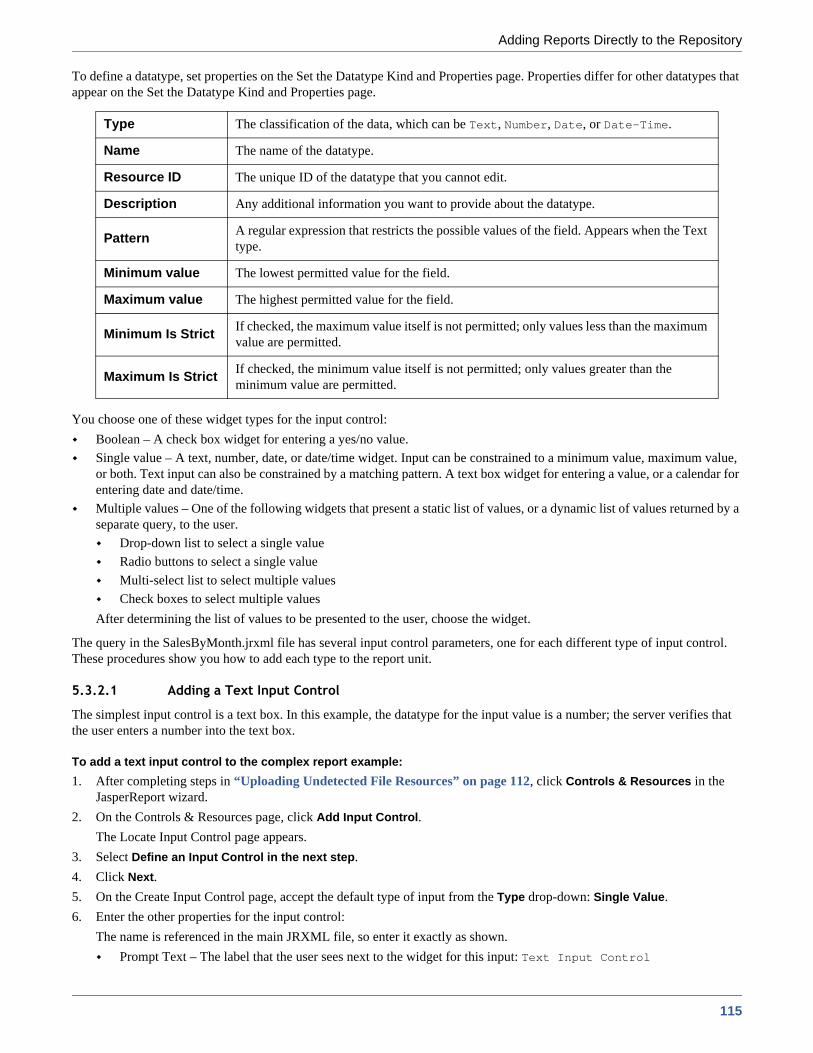
Adding Reports Directly to the Repository
To define a datatype, set properties on the Set the Datatype Kind and Properties page. Properties differ for other datatypes that appear on the Set the Datatype Kind and Properties page.
You choose one of these widget types for the input control: Boolean – A check box widget for entering a yes/no value.Single value – A text, number, date, or date/time widget. Input can be constrained to a minimum value, maximum value, or both. Text input can also be constrained by a matching pattern. A text box widget for entering a value, or a calendar for entering date and date/time.Multiple values – One of the following widgets that present a static list of values, or a dynamic list of values returned by a separate query, to the user.
Drop-down list to select a single valueRadio buttons to select a single valueMulti-select list to select multiple valuesCheck boxes to select multiple values
After determining the list of values to be presented to the user, choose the widget.
The query in the SalesByMonth.jrxml file has several input control parameters, one for each different type of input control. These procedures show you how to add each type to the report unit.
5.3.2.1 Adding a Text Input Control
The simplest input control is a text box. In this example, the datatype for the input value is a number; the server verifies that the user enters a number into the text box.
To add a text input control to the complex report example: 1. After completing steps in “Uploading Undetected File Resources” on page 112, click Controls & Resources in the
JasperReport wizard.2. On the Controls & Resources page, click Add Input Control.
The Locate Input Control page appears.3. Select Define an Input Control in the next step.4. Click Next.5. On the Create Input Control page, accept the default type of input from the Type drop-down: Single Value. 6. Enter the other properties for the input control:
The name is referenced in the main JRXML file, so enter it exactly as shown.Prompt Text – The label that the user sees next to the widget for this input: Text Input Control
Type The classification of the data, which can be Text, Number, Date, or Date-Time.
Name The name of the datatype.
Resource ID The unique ID of the datatype that you cannot edit.
Description Any additional information you want to provide about the datatype.
Pattern A regular expression that restricts the possible values of the field. Appears when the Text type.
Minimum value The lowest permitted value for the field.
Maximum value The highest permitted value for the field.
Minimum Is Strict If checked, the maximum value itself is not permitted; only values less than the maximum value are permitted.
Maximum Is Strict If checked, the minimum value itself is not permitted; only values greater than the minimum value are permitted.
115

JasperReports Server User Guide
Parameter Name – The name of the parameter in the report that receives the user value: TextInput Description – An optional description that appears only within the report wizard: leave blank in this example.Mandatory, Read-only, Visible – A setting that affects how the input control is displayed: check only Visible.
7. Click Next.8. In Locate Datatypes, select Define a DataType in the next step, and click Next:
9. In Set the Datatype Kind and Properties, enter the properties for the datatype: a. In Type, select the format of the data that the user may enter. Select Number from the drop-down.
b. Enter a name – Integer Typec. Enter a resource ID – Integer_Type
Figure 5-14 Properties of the Text Input Control
To reuse an input control, add it to the repository independent of any report using Add Resource > Input Control. Before using the input control in a report, check that the parameter name in the JRXML matches the name in the Create Input Control page; otherwise, the server can’t run the report.
Instead of defining a datatype, you can use one in the repository if its type and range are compatible with your input control.
The number format allows users to enter integers and decimals.
116

Adding Reports Directly to the Repository
The name and resource ID are required, but only visible when defining the input control.
d. Leave these properties blank in this example:Description – An optional description that appears only within the report wizard.Minimum value – The lower bound of the value the user may enter.Maximum value – The upper bound of the value the user may enter.Minimum is strict – Means the minimum value itself is not allowed.Maximum is strict – Means the maximum value itself is not allowed.
10. Click Save.
Figure 5-15 Integer Datatype Properties
117

JasperReports Server User Guide
The Controls & Resources page now lists the Text Input Control.
5.3.2.2 Adding a Simple Check Box Input Control
A check box input control accepts true/false (boolean) input from the user.
To add a simple check box input control to the complex report example: 1. Continuing with the previous example, on the Controls & Resources page, click Add Input Control. 2. On the Locate Input Control page, click Define an Input Control in the next step.3. Click Next.4. On the Create Input Control page, select the type of input from the Type drop-down: Boolean. 5. Enter the other properties for the input control.
Prompt Text – Check Box Input ControlParameter Name – CheckboxInput
Description – Leave blank in this example.Mandatory, Read-only, Visible – Check only visible.
6. Click Submit. The Controls & Resources page appears with the new check box input control.
5.3.2.3 Adding a Drop-Down Input Control
The drop-down input control, also called a list input control, gives the user a pre-determined list of choices. As a report designer, you make these decisions about a drop-down input control:
To present a single-select or multi-select list to the userTo present a single choice as a drop-down list or a set of radio buttonsTo present a multi-select control as a multi-select list or a set of check boxes
Radio buttons and check boxes usually work well for five or fewer choices. This example shows how to create an input control that presents three choices in a drop-down list. A list of values defines these choices. You can create a new list of values, dedicated to this input control, or you can use a list of values in the repository.
Figure 5-16 Text Input Control in Input Controls List
Enter the parameter name exactly as shown because the main JRXML file references this name.
118

Adding Reports Directly to the Repository
To add a drop-down input control to the complex report example: 1. Continuing with the previous example, on the Controls & Resources page, click Add Input Control. 2. On the Locate Input Control page, click Define an Input Control in the next step. 3. Click Next.4. On the Create Input Control page, select the type of input from the Type drop-down: Single-select List of Values.5. Enter the other properties for the input control:
Prompt Text – List Input ControlParameter Name – ListInput
Description – Leave blank in this example.Mandatory, Read-only, Visible – Check only visible.
6. Click Next.7. On the Locate List of Values page, select Define a list of values in the next step.
8. Click Next.9. On the Add List of Values page, enter a name, resource ID, and optional description for the list of values. These properties
aren’t visible outside of the input control. Enter these values:Name – list typeResource ID – list_typeDescription – Leave blank in this example.
10. In the Name Value panel, enter names and values to present as choices to the user:Enter unique names.
Enter values of the type that match the parameter definition in the JRXML report. After entering a name and value, click Add. If you make a mistake, click Remove. For this example, enter:
Name First Item with value 1.Name Second Item with value 2.
Enter the parameter name exactly as shown because the main JRXML file references this name.
Instead of defining a list of values, you can use one in the repository if its values are compatible with the parameter defined in the JRXML report.
The server requires unique names to distinguish which item the user chose.
119

JasperReports Server User Guide
Name Third Item with value 3.
11. Click Submit.The Controls & Resources page appears with the new List Input control.
5.3.2.4 Adding a Date Input Control
This example of adding a date input control uses a datatype that already exists in the sample data in the repository.
To add a date input control to the complex report example: 1. On the Controls & Resources page, click Add Input Control.2. On the Locate Input Control page, select Define an Input Control in the next step, then click Next.3. On the Create Input Control page, select the type of input from the Type drop-down: Single-Value 4. Enter the other properties for the input control:
Prompt Text – Date Input ControlParameter Name – DateInput
Description – Leave blank in this example.Mandatory, Read-only, Visible – Check only the visible setting.
5. Click Next.6. On the Locate Datatypes page, select Select a Datatype from the Repository. 7. Click Browse. 8. In Select Resource from Repository, expand Input Data Types, and select the Date Datatype. 9. Click Select.
The Locate DataTypes page shows the location of this datatype in the repository, /datatypes/DateDatatype.10. Click Next.
The Controls & Resources page appears with the new Date Input Control.
Figure 5-17 Definition of the List of Values
Enter the parameter name exactly as shown because the main JRXML file references this name.
120
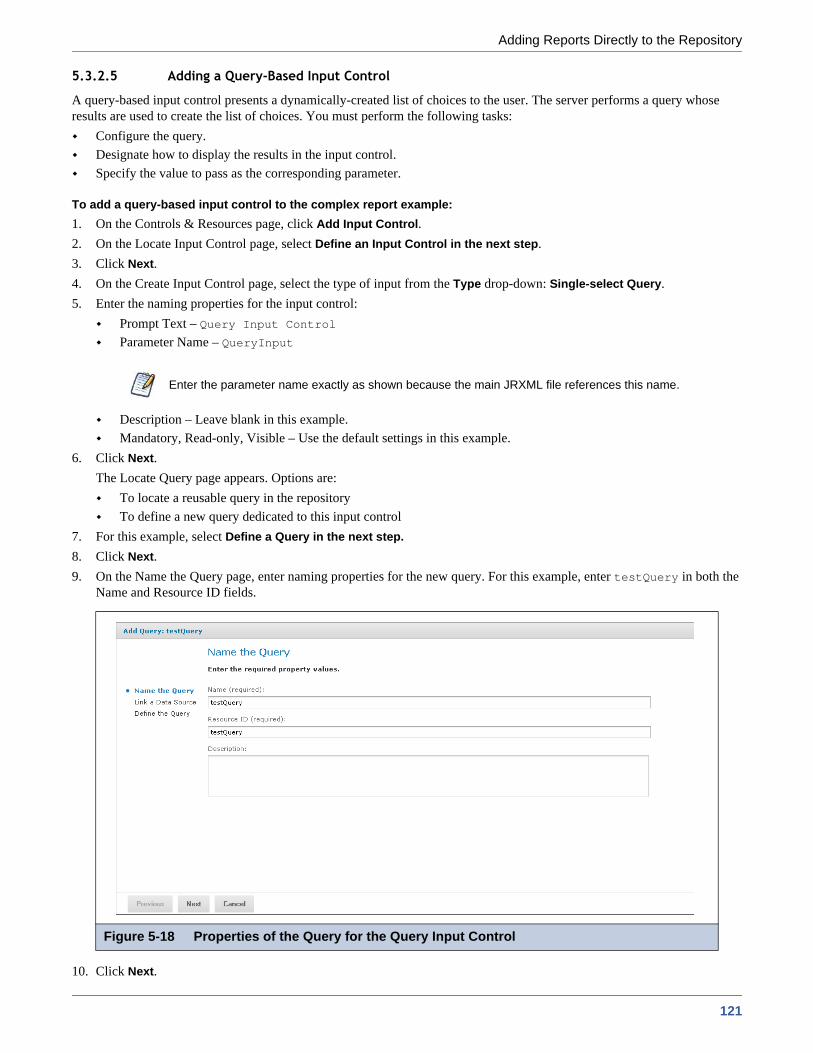
Adding Reports Directly to the Repository
5.3.2.5 Adding a Query-Based Input Control
A query-based input control presents a dynamically-created list of choices to the user. The server performs a query whose results are used to create the list of choices. You must perform the following tasks:
Configure the query.Designate how to display the results in the input control.Specify the value to pass as the corresponding parameter.
To add a query-based input control to the complex report example: 1. On the Controls & Resources page, click Add Input Control.2. On the Locate Input Control page, select Define an Input Control in the next step.3. Click Next.4. On the Create Input Control page, select the type of input from the Type drop-down: Single-select Query. 5. Enter the naming properties for the input control:
Prompt Text – Query Input ControlParameter Name – QueryInput
Description – Leave blank in this example.Mandatory, Read-only, Visible – Use the default settings in this example.
6. Click Next.The Locate Query page appears. Options are:
To locate a reusable query in the repositoryTo define a new query dedicated to this input control
7. For this example, select Define a Query in the next step.8. Click Next.9. On the Name the Query page, enter naming properties for the new query. For this example, enter testQuery in both the
Name and Resource ID fields.
10. Click Next.
Enter the parameter name exactly as shown because the main JRXML file references this name.
Figure 5-18 Properties of the Query for the Query Input Control
121

JasperReports Server User Guide
The Link a Data Source to the Report page appears. Options are:To use the same data source for the input control as you use for the reportTo define a new data source, dedicated to this input controlTo select a reusable data source from the repository
11. For this example, select Do not link a data source to use the same data source for the input control as you use for the report. You will select the data source for the report in 5.3.3, “Selecting a Data Source for Running the Complex Report,” on page 124.
12. Click Next.13. On the Define the Query page, select SQL from the Query Language drop-down.14. Enter this Query String to retrieve the labels and values to be displayed for this input control:
SELECT user_name, first_name, last_name FROM users
15. Click Save.16. For each row in the results of the query, the server presents a single value, such as Sarah Smith, in the input type widget
(drop-down, radio buttons, multi-choice, check boxes). On the Query Information page, name the database columns to
Figure 5-19 Data Source Link for the Query Input Control
Figure 5-20 Query String Definition
122

Adding Reports Directly to the Repository
comprise the input value presented to the user. The column names must match those in the SELECT clause of the query string exactly:a. In the Value Column, enter the user_name. b. In the Visible Column, enter first_name.c. Click Add.d. In the Visible Column, enter last_name.e. Click Add.
For each visible column that you want to display as a choice, enter the name, then click Add. If you make a mistake, click Remove.
17. Click Submit.The Controls & Resources page displays all the resources, including the new input controls. Figure 5-21 on page 124 shows these resources.
Next, set the input control options, described in the next section.
5.3.2.6 Setting the Input Control Options
In this procedure, you set the display mode in Input Control Options at the bottom of the Controls & Resources page. These options only appear after you add an input control to the report. Figure 5-21 on page 124 shows these options.
To configure the appearance of the input controls for the complex report example:1. Select Pop-up window.
2. Check Always prompt when you want the server to display the Input Controls dialog to prompt the user when the report runs.
You can also select Separate page to display the input controls in a separate browser window, Top of page to display them above the report, or In page to display them on the side of the report.
The definition of input controls in this example specified Visible and not Mandatory. When input controls aren’t mandatory and Always prompt isn’t checked on the Controls & Resources page, the user must click the Options button in the report viewer to change input controls; otherwise, the report runs with default input controls
123

JasperReports Server User Guide
3. Leave Optional JSP Location blank for this example. You can use the Optional JSP Location option to specify the path to a JSP file that affects the appearance of the input controls.
Select the data source to finish the complex report example.
5.3.3 Selecting a Data Source for Running the Complex ReportYou select a data source to retrieve data for the report and the query input control; otherwise, the report and the list of users in the query input control will be blank.
To select a data source and run the complex report:1. On the Controls & Resources page of the JasperReport wizard, select Data Source.2. On the Locate Data Source page, choose Select data source from repository. 3. Click Browse, and choose Organization > Data Sources > JServerJNDI Data Source. Click the Select button.4. On Link a Data Source to the Report, click Submit.5. On the Locate Query Page, click Submit again to save the complex report.
Skip the Query and Customization pages of the JasperReport wizard to use the default settings on those pages.The server validates the report and a message appears indicating that the report was added to the repository. The New Complex Report appears in the repository.
6. In the Repository, click the name New Complex Report to run and view the report. Input controls appear.
7. Enter these input values, as shown in Figure 5-22:a. Text Input Control: myTextb. Check Box Input Control: Check the checkbox.c. List Input Control: Select Third Item.
Figure 5-21 Input Controls and Resources
124

Adding Reports Directly to the Repository
d. Date Input Control: Click , select December 31, 2010.e. Query Input Control: Select Sarah Smith from the drop-down.
8. Click OK or Apply to run the report with the selected input, including the incorrect non-numerical input for the Text Input Control. The server enforces the proper format defined for each input control. You defined the Text Input Control as a numeric type, so it accepts only valid numbers, as indicated by the message to specify a valid float number, as shown in Figure 5-23.
9. In Text Input Control, enter 3 and click OK or Apply again.
Figure 5-22 Input Controls Dialog for the New Complex Report
Figure 5-23 Invalid Input Message
125
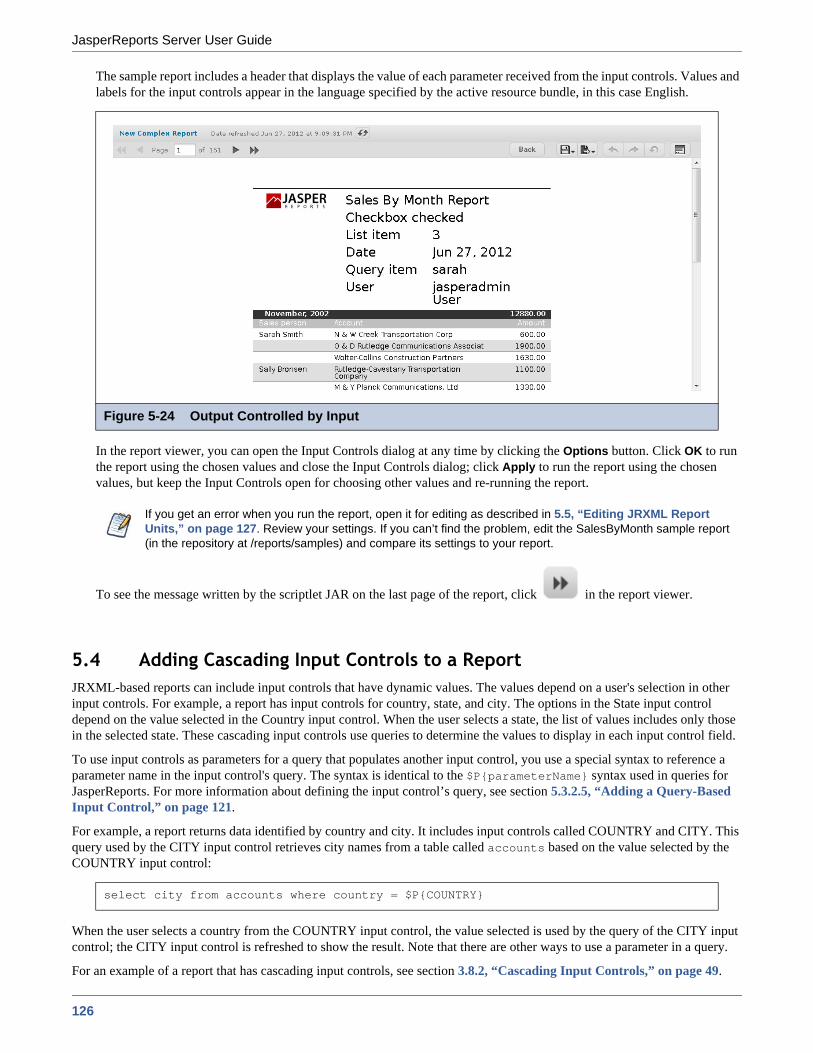
JasperReports Server User Guide
The sample report includes a header that displays the value of each parameter received from the input controls. Values and labels for the input controls appear in the language specified by the active resource bundle, in this case English.
In the report viewer, you can open the Input Controls dialog at any time by clicking the Options button. Click OK to run the report using the chosen values and close the Input Controls dialog; click Apply to run the report using the chosen values, but keep the Input Controls open for choosing other values and re-running the report.
To see the message written by the scriptlet JAR on the last page of the report, click in the report viewer.
5.4 Adding Cascading Input Controls to a ReportJRXML-based reports can include input controls that have dynamic values. The values depend on a user's selection in other input controls. For example, a report has input controls for country, state, and city. The options in the State input control depend on the value selected in the Country input control. When the user selects a state, the list of values includes only those in the selected state. These cascading input controls use queries to determine the values to display in each input control field.
To use input controls as parameters for a query that populates another input control, you use a special syntax to reference a parameter name in the input control's query. The syntax is identical to the $P{parameterName} syntax used in queries for JasperReports. For more information about defining the input control’s query, see section 5.3.2.5, “Adding a Query-Based Input Control,” on page 121.
For example, a report returns data identified by country and city. It includes input controls called COUNTRY and CITY. This query used by the CITY input control retrieves city names from a table called accounts based on the value selected by the COUNTRY input control:
When the user selects a country from the COUNTRY input control, the value selected is used by the query of the CITY input control; the CITY input control is refreshed to show the result. Note that there are other ways to use a parameter in a query.
For an example of a report that has cascading input controls, see section 3.8.2, “Cascading Input Controls,” on page 49.
Figure 5-24 Output Controlled by Input
If you get an error when you run the report, open it for editing as described in 5.5, “Editing JRXML Report Units,” on page 127. Review your settings. If you can’t find the problem, edit the SalesByMonth sample report (in the repository at /reports/samples) and compare its settings to your report.
select city from accounts where country = $P{COUNTRY}
126

Adding Reports Directly to the Repository
5.5 Editing JRXML Report UnitsAfter you add a report unit to the repository, you can edit any of its elements, including file resources and input controls. This example modifies the display text of the ambiguous Text Input Control.
To edit the complex report example:1. Log into the server as an administrator and select View > Repository.
2. Search or browse the repository to locate the report. In this example, go to Organization > Reports > Samples.3. Right-click the New Complex Report and select Edit from the context menu.
The JasperReport wizard opens the report unit. 4. Navigate to the page of the wizard for making the change; in this example, click Controls & Resources.5. Make changes to an input control prompt and the display mode of the input controls, for example:
a. Click the name of the TextInput control.The Locate Input Control page shows that this input control is locally defined.
b. Click Next.The Create Input Control page appears.
c. Change the contents of the Prompt Text field to Enter a number. Click Next.The Locate Datatypes page appears. You can select a different datatype from the repository. For this example, accept the existing datatype setting.
d. In Locate Datatypes, click Next.e. In Set the Datatype Kind and Properties, click Save to accept the datatype property settings.
6. On the Controls & Resources page:a. Change the Display Mode to In Page.b. Clear the Always prompt check box.c. Click Submit.
7. Run the New Complex Report again.Instead of appearing in a pop-up before the report; the input controls appear in the Options panel of the report. Figure 5-25 shows the new prompt, Enter a number, for the text input control. Because none of the input controls in this example are required, the report can display with blank input controls. Enter values and click Apply to modify the report output according to your input.
If you log in as a user, you can edit a report that you created. This example requires an administrator login because an administrator created the complex report.
127
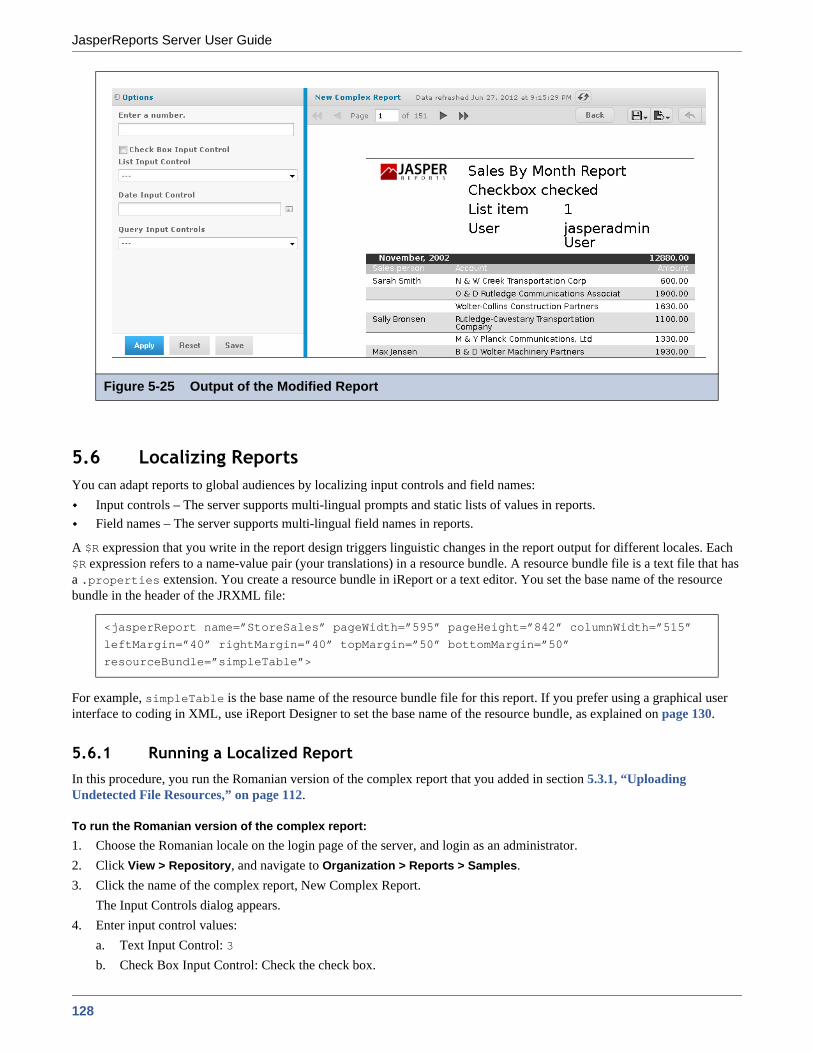
JasperReports Server User Guide
5.6 Localizing ReportsYou can adapt reports to global audiences by localizing input controls and field names:
Input controls – The server supports multi-lingual prompts and static lists of values in reports.Field names – The server supports multi-lingual field names in reports.
A $R expression that you write in the report design triggers linguistic changes in the report output for different locales. Each $R expression refers to a name-value pair (your translations) in a resource bundle. A resource bundle file is a text file that has a .properties extension. You create a resource bundle in iReport or a text editor. You set the base name of the resource bundle in the header of the JRXML file:
For example, simpleTable is the base name of the resource bundle file for this report. If you prefer using a graphical user interface to coding in XML, use iReport Designer to set the base name of the resource bundle, as explained on page 130.
5.6.1 Running a Localized ReportIn this procedure, you run the Romanian version of the complex report that you added in section 5.3.1, “Uploading Undetected File Resources,” on page 112.
To run the Romanian version of the complex report:1. Choose the Romanian locale on the login page of the server, and login as an administrator.2. Click View > Repository, and navigate to Organization > Reports > Samples.3. Click the name of the complex report, New Complex Report.
The Input Controls dialog appears.4. Enter input control values:
a. Text Input Control: 3b. Check Box Input Control: Check the check box.
Figure 5-25 Output of the Modified Report
<jasperReport name=”StoreSales” pageWidth=”595” pageHeight=”842” columnWidth=”515”
leftMargin=”40” rightMargin=”40” topMargin=”50” bottomMargin=”50”
resourceBundle=”simpleTable”>
128
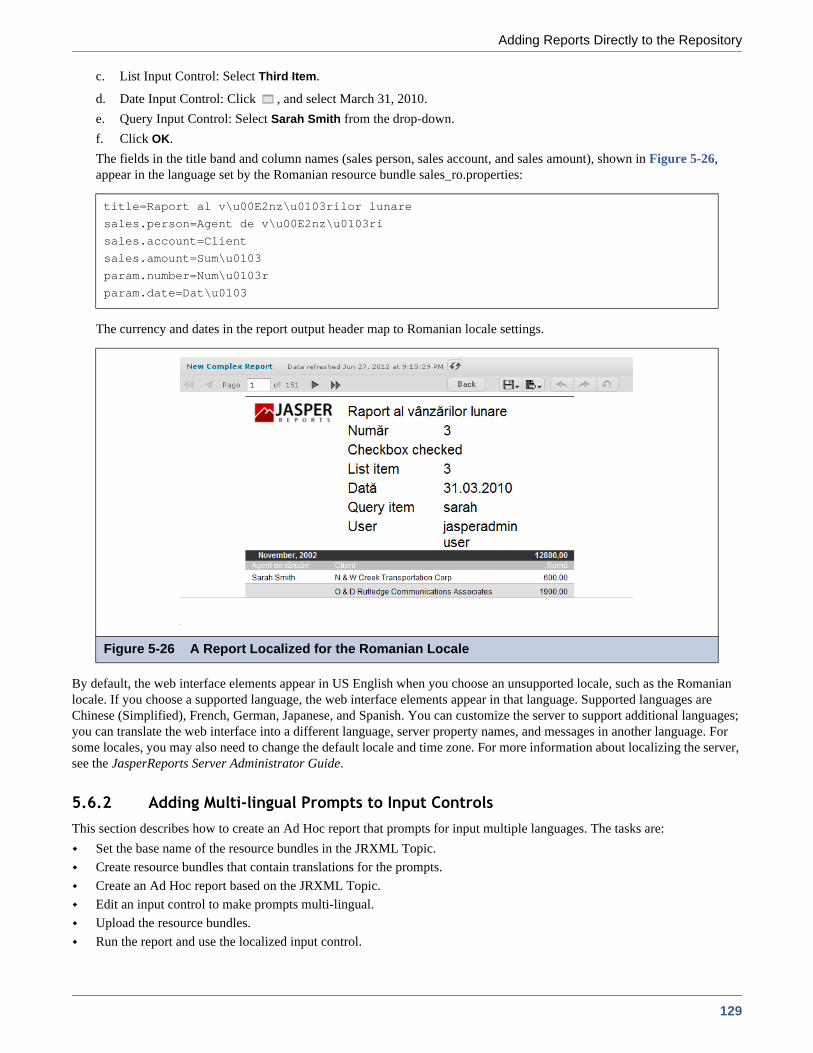
Adding Reports Directly to the Repository
c. List Input Control: Select Third Item.
d. Date Input Control: Click , and select March 31, 2010.e. Query Input Control: Select Sarah Smith from the drop-down.f. Click OK.The fields in the title band and column names (sales person, sales account, and sales amount), shown in Figure 5-26, appear in the language set by the Romanian resource bundle sales_ro.properties:
The currency and dates in the report output header map to Romanian locale settings.
By default, the web interface elements appear in US English when you choose an unsupported locale, such as the Romanian locale. If you choose a supported language, the web interface elements appear in that language. Supported languages are Chinese (Simplified), French, German, Japanese, and Spanish. You can customize the server to support additional languages; you can translate the web interface into a different language, server property names, and messages in another language. For some locales, you may also need to change the default locale and time zone. For more information about localizing the server, see the JasperReports Server Administrator Guide.
5.6.2 Adding Multi-lingual Prompts to Input ControlsThis section describes how to create an Ad Hoc report that prompts for input multiple languages. The tasks are:
Set the base name of the resource bundles in the JRXML Topic.Create resource bundles that contain translations for the prompts.Create an Ad Hoc report based on the JRXML Topic.Edit an input control to make prompts multi-lingual.Upload the resource bundles.Run the report and use the localized input control.
title=Raport al v\u00E2nz\u0103rilor lunare
sales.person=Agent de v\u00E2nz\u0103ri
sales.account=Client
sales.amount=Sum\u0103
param.number=Num\u0103r
param.date=Dat\u0103
Figure 5-26 A Report Localized for the Romanian Locale
129
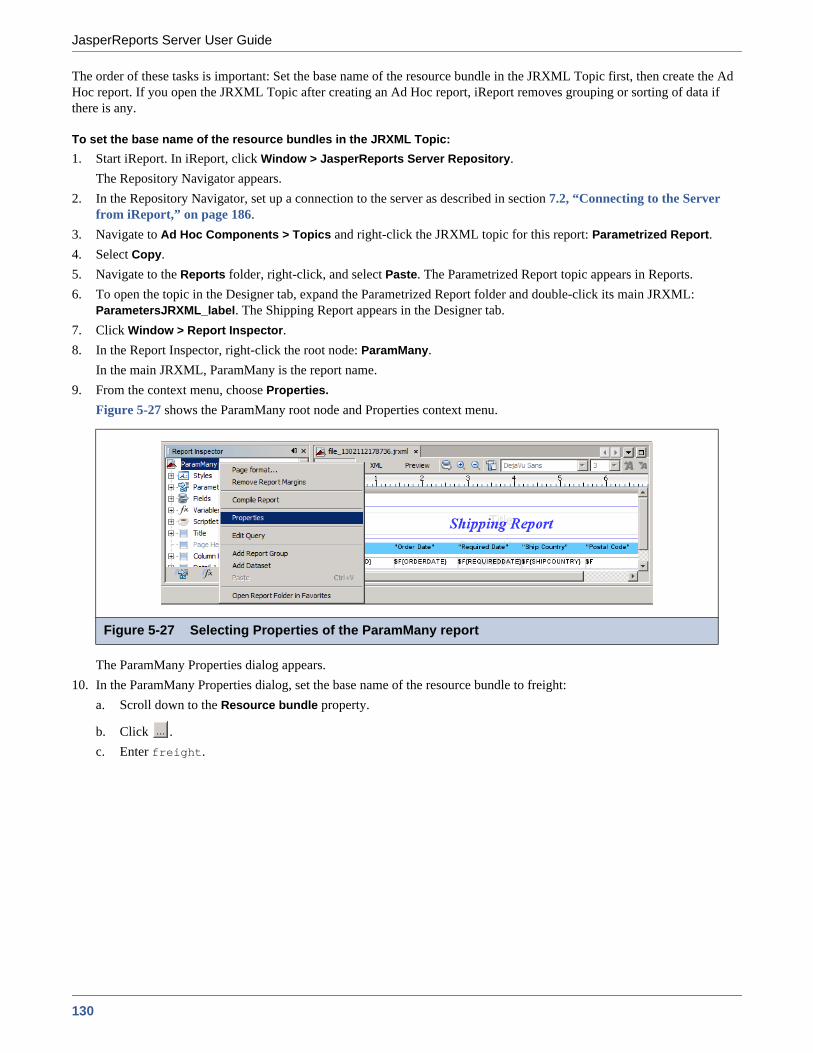
JasperReports Server User Guide
The order of these tasks is important: Set the base name of the resource bundle in the JRXML Topic first, then create the Ad Hoc report. If you open the JRXML Topic after creating an Ad Hoc report, iReport removes grouping or sorting of data if there is any.
To set the base name of the resource bundles in the JRXML Topic:1. Start iReport. In iReport, click Window > JasperReports Server Repository.
The Repository Navigator appears.2. In the Repository Navigator, set up a connection to the server as described in section 7.2, “Connecting to the Server
from iReport,” on page 186. 3. Navigate to Ad Hoc Components > Topics and right-click the JRXML topic for this report: Parametrized Report. 4. Select Copy. 5. Navigate to the Reports folder, right-click, and select Paste. The Parametrized Report topic appears in Reports.6. To open the topic in the Designer tab, expand the Parametrized Report folder and double-click its main JRXML:
ParametersJRXML_label. The Shipping Report appears in the Designer tab.7. Click Window > Report Inspector. 8. In the Report Inspector, right-click the root node: ParamMany.
In the main JRXML, ParamMany is the report name. 9. From the context menu, choose Properties.
Figure 5-27 shows the ParamMany root node and Properties context menu.
The ParamMany Properties dialog appears.10. In the ParamMany Properties dialog, set the base name of the resource bundle to freight:
a. Scroll down to the Resource bundle property.
b. Click .c. Enter freight.
Figure 5-27 Selecting Properties of the ParamMany report
130
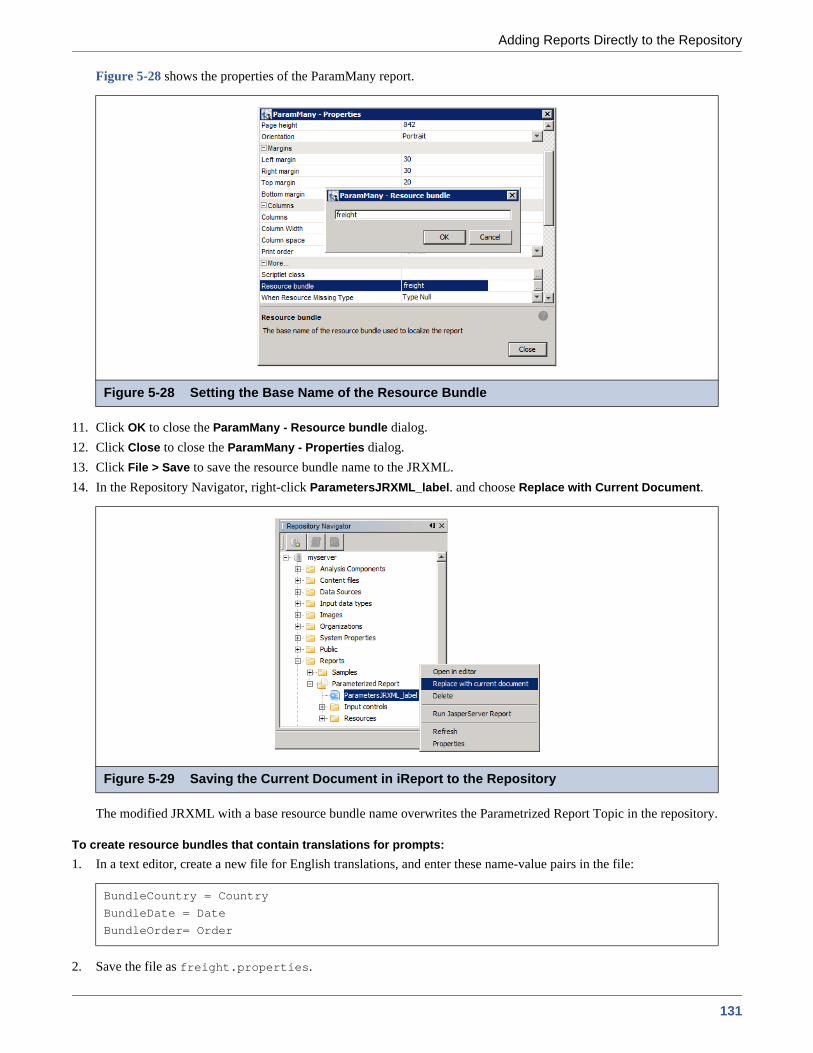
Adding Reports Directly to the Repository
Figure 5-28 shows the properties of the ParamMany report.
11. Click OK to close the ParamMany - Resource bundle dialog. 12. Click Close to close the ParamMany - Properties dialog. 13. Click File > Save to save the resource bundle name to the JRXML.14. In the Repository Navigator, right-click ParametersJRXML_label. and choose Replace with Current Document.
The modified JRXML with a base resource bundle name overwrites the Parametrized Report Topic in the repository.
To create resource bundles that contain translations for prompts:1. In a text editor, create a new file for English translations, and enter these name-value pairs in the file:
2. Save the file as freight.properties.
Figure 5-28 Setting the Base Name of the Resource Bundle
Figure 5-29 Saving the Current Document in iReport to the Repository
BundleCountry = Country
BundleDate = Date
BundleOrder= Order
131

JasperReports Server User Guide
3. In a text editor, create a new file for French translations, and enter these name-value pairs in the file:
4. Save the file as freight_fr.properties.
To create an Ad Hoc View based on the JRXML Topic:1. Log into the server as administrator, and choose Create > Ad Hoc View. 2. In the Data Chooser wizard, navigate to Ad Hoc Components > Topics, on the Topics tab, choose Parametrized Report. 3. Click Table. The Parametrized Report topic (a blank report) opens in the Ad Hoc Editor.4. In the Measures list, double-click these fields:
Order IDFreight
5. Right-click the Customer Id field and select Add as Group.6. Click Click to add a title, and enter Multi-lingual Input Prompts View.
7. Click , select Save Ad Hoc view As and Create Report. In the Save As dialog, select the Ad Hoc Reports folder, and enter:Data View Name: Multi-lingual Input Prompts ViewData View Description: A report that prompts for input in French and English.Report Name: Multi-lingual Input Prompts View Report
8. Click Save.
To edit an input control to make prompts multi-lingual:1. In the server, click View > Repository.2. Locate the Multi-lingual Input Prompts View Report, right-click it, and choose Edit.
The file name of the default (English) resource bundle consists of the base name of the resource bundle and the properties extension.
BundleCountry = Pays
BundleDate = Datte
BundleOrder = Pour ID
The file name of a localized resource bundle follows this Java naming convention:<default_file_name>_<locale>.properties
<default_file_name> is the base name of the resource bundle<locale> is a Java-compliant locale identifier
Figure 5-30 Creating an Ad Hoc View
132

Adding Reports Directly to the Repository
The JasperReport wizard appears.3. Click Controls & Resources. The Controls & Resources page lists these input controls:
CountryRequestDateOrderID
4. Click the Country input control.5. On the Locate Input Control page, click Next to define an input control in the next step.6. On the Create Input Control page, change the prompt text from Country to this expression:
$R{BundleCountry}
Figure 5-31 shows this expression entered in the prompt text field.
7. Click Next.8. Accept the default settings on subsequent pages by clicking Next and Save:
a. On the Locate Query page, click Next.b. On the Name the Query page, click Next.c. On the Link a Data Source to the Query page, click Next.d. On the Define the Query page, click Save.
9. On the Set Parameter Values page, click Submit.
Figure 5-31 Entering a $R Expression in the Prompt Text Field
133

JasperReports Server User Guide
The Controls & Resources page now shows the $R{BundleCountry} expression instead of Country at the top of the list of input controls:
10. Change the prompt text of the other input controls in a similar manner:a. Repeat step 4 through step 6 to change the RequestDate and OrderID input controls to these expressions:
RequestDate: $R{BundleDate}OrderID: $R{BundleOrder}
b. Accept the default settings on subsequent pages of the JasperReport wizard by clicking Next and Save.The Controls & Resources page now shows the $R expressions for all three input controls.
To upload the resource bundles:1. On the Controls & Resources page, click Add Resource.
The Locate File Resource page appears.2. On the Locate File Resource page, select Upload a Local File. 3. Click Browse, locate the freight.properties file, select the file, and click Open.4. On the Locate File Resource page, click Next.
On the Add a Report Resource page, freight.properties appears as the Selected Resource, indicating that the server automatically detected it as a resource bundle.
5. On the Add a Report Resource page, enter these properties:Name – freight.propertiesResource ID – freight.properties
Description – Default English resource bundle6. Click Next. The list of resources on the Controls & Resources page now includes the resource bundle freight.properties.7. On Controls & Resources, click Add Resource again, but this time, upload the French resource bundle:
a. On the Controls & Resources page, click Add Resource again.b. Select Upload a Local File, click Browse, locate the freight_fr.properties file you created, select it, and click Open.c. In Locate File Resource, click Next. The Add a Report Resource page appears:
Figure 5-32 Input Controls Include One Multi-lingual Input Control
Enter the Resource ID field exactly as shown.
134

Adding Reports Directly to the Repository
d. Enter the following information:Name – freight_fr.propertiesResource ID – freight_fr.propertiesDescription – French resource bundle
8. Click Next.The Controls & Resources page shows the English and French resource bundles in the resources list.
9. Click Submit.
To run the report and use the localized input control:1. Click Log Out.2. On the Login page, click Show locale & time zone.3. Select the en_US-English (United States) locale, and log into the server as an administrator.4. Run the Multi-lingual Input Prompts Report.
The report appears in the report viewer:
5. Click Options.The input controls appear with English prompts.
6. Click Log Out.7. On the Login page, click Show locale & time zone.8. Select the fr - French locale, and log in as administrator.9. Run the report again and click Options.
Figure 5-33 Viewing the Report in English
135

JasperReports Server User Guide
Figure 5-34 shows the input controls that with English and French prompts.
5.6.3 Adding a Multi-Lingual Static List to an Input ControlThe server provides linguistic support for the list of values that an input control can present to users. The input controls that can present a list of values are:
Single-select list of valuesSingle-select list of values (radio)Multi-select list of valuesMulti-select list of values (check box)
Figure 5-35 shows an example of the multi-lingual Department Report in the Reports/Samples folder (if you installed sample reports during installation). The prompts and the multi-select list of values appear in English or Spanish, depending on the locale you select on the login page.
Figure 5-34 Input Control Prompts in English and French
Figure 5-35 A Multi-select List of Values in English and Spanish
136

Adding Reports Directly to the Repository
The next example shows how to localize an input control that presents a single-select list of values. These tasks are explained step-by-step:
Add a multi-lingual static list of values to a list input control.Create a new resource bundle for the French translations.Upload the French resource bundle.Create a new resource bundle for the English translations.Replace the existing English resource bundle with the new one.Remove unwanted parameters from the sample report design.Run the report that uses a multi-lingual list of values in an input control.
You edit a sample report to localize the list input control. To the list input control, you add a multi-lingual list of values for the US English and French locales.
To add a multi-lingual static list of values to a list input control:1. Log into the server as administrator and add a folder to the repository named Temp.2. Locate the Sales By Month report in the Reports > Samples folder of the repository. Select it and click Copy.3. Navigate to the Temp folder and choose Paste. The Sales By Month Report appears in the Temp folder.4. Select the Sales By Month Report and click Edit.
The JasperReport wizard appears.5. Click Controls & Resources.
The report has five input controls, including a List Input Control, two resource bundles, and other resources, as shown in Figure 5-21 on page 124.
6. Click the List Input Control to edit it.7. In Locate Input Control, click Next.8. On the Create Input Control page, change the prompt text from List Input Control to $R{department_multi}.
Figure 5-36 shows the $R expression in the Prompt Text field.
9. Click Next.10. On the Locate List of Values page, click Next. The Edit List of Values page appears.11. On the Edit List of Values page, click Remove to remove each existing name-value pair.
Figure 5-36 A $R Expression in the Prompt Text Field
137

JasperReports Server User Guide
12. Add these name-value pairs:
Figure 5-37 shows the edited list of values containing the $R expressions in the name fields.
13. Click Submit.The Controls & Resources page shows the change to the input control prompt. The expression $R{department_multi} replaces List Input Control in the list of input controls.
14. Click Submit again to save your work.
To create a new resource bundle for the French translations:1. In a text editor, create a new file for French translations, and enter these name-value pairs for the input control:
2. At the bottom of the file, enter these field and property translations to localize the report:
Name Value$R{department_1} 1$R{department_2} 2$R{department_3} 3
Figure 5-37 The Revised List of Values Containing $R Expressions
department_multi=Choisir le service
department_1 = Travail # 1
department_2 = Travail # 2
department_3 = Travail # 3
title=Rapport de ventes mensuelles
sales.person=Commercial
sales.account=Compte
sales.amount=Montant
param.list=Liste Détaillée
Use the Unicode escape sequence if you cannot enter é: \u00e9
138

Adding Reports Directly to the Repository
3. Save the file as sales_fr.properties to your hard drive.
To upload the French resource bundle:1. Assuming you are still logged into the server, select the Sales By Month report, and click Edit.2. On the Controls & Resources page, click Add Resource.3. Select Upload a Local File, click Browse, and locate the sales_fr.properties file on your hard drive. Select the file, and
click Open.4. In Locate File Resource, click Next.
On the Add a Report Resource page, sales_fr.properties appears as the Selected Resource, indicating that the server automatically detected it as a resource bundle.
5. On the Add a Report Resource page, enter this information:Name – sales_fr.propertiesResource ID – sales_fr.properties
6. Click Next.The Controls & Resources page appears.
To create a new resource bundle for the English translations:1. In a text editor, create a new file for English translations, and enter these input control name-value pairs in the file:
2. At the bottom of the file, enter these field and property translations to localize the report:
3. Save the file as sales.properties to your hard drive.
To replace the old English resource bundle in the repository with the new one:1. Assuming you are still logged into the server and editing the Sales By Month report, remove the old sales.properties
resource bundle:a. On the Controls & Resources page, select sales.properties.b. Click Remove.
2. Click Add Resource.3. On the Locate File Resource page, select Upload a Local File, click Browse, and locate the new sales.properties file that
you created in the previous procedure. Click Open.4. Click Next.
On the Add a Report Resource page, sales.properties appears as the Selected Resource, indicating that the server automatically detected it as a resource bundle.
5. On the Add a Report Resource page, enter this information:Name – sales.properties
Enter the Resource ID field exactly as shown.
department_multi=Select Department
department_1=Work #1
department_2=Work #2
department_3=Work #3
title=Sales By Month Report
sales.person=Sales person
sales.account=Account
sales.amount=Amount
param.list=List item
139
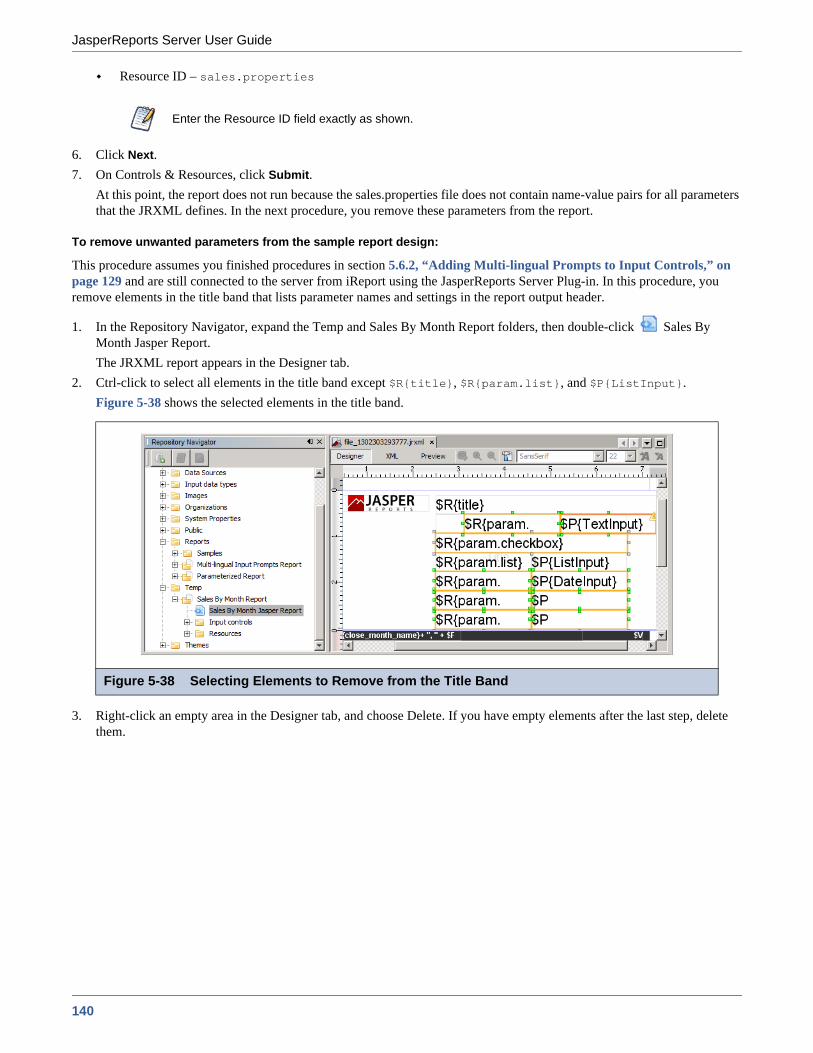
JasperReports Server User Guide
Resource ID – sales.properties
6. Click Next.7. On Controls & Resources, click Submit.
At this point, the report does not run because the sales.properties file does not contain name-value pairs for all parameters that the JRXML defines. In the next procedure, you remove these parameters from the report.
To remove unwanted parameters from the sample report design:
This procedure assumes you finished procedures in section 5.6.2, “Adding Multi-lingual Prompts to Input Controls,” on page 129 and are still connected to the server from iReport using the JasperReports Server Plug-in. In this procedure, you remove elements in the title band that lists parameter names and settings in the report output header.
1. In the Repository Navigator, expand the Temp and Sales By Month Report folders, then double-click Sales By Month Jasper Report. The JRXML report appears in the Designer tab.
2. Ctrl-click to select all elements in the title band except $R{title}, $R{param.list}, and $P{ListInput}. Figure 5-38 shows the selected elements in the title band.
3. Right-click an empty area in the Designer tab, and choose Delete. If you have empty elements after the last step, delete them.
Enter the Resource ID field exactly as shown.
Figure 5-38 Selecting Elements to Remove from the Title Band
140
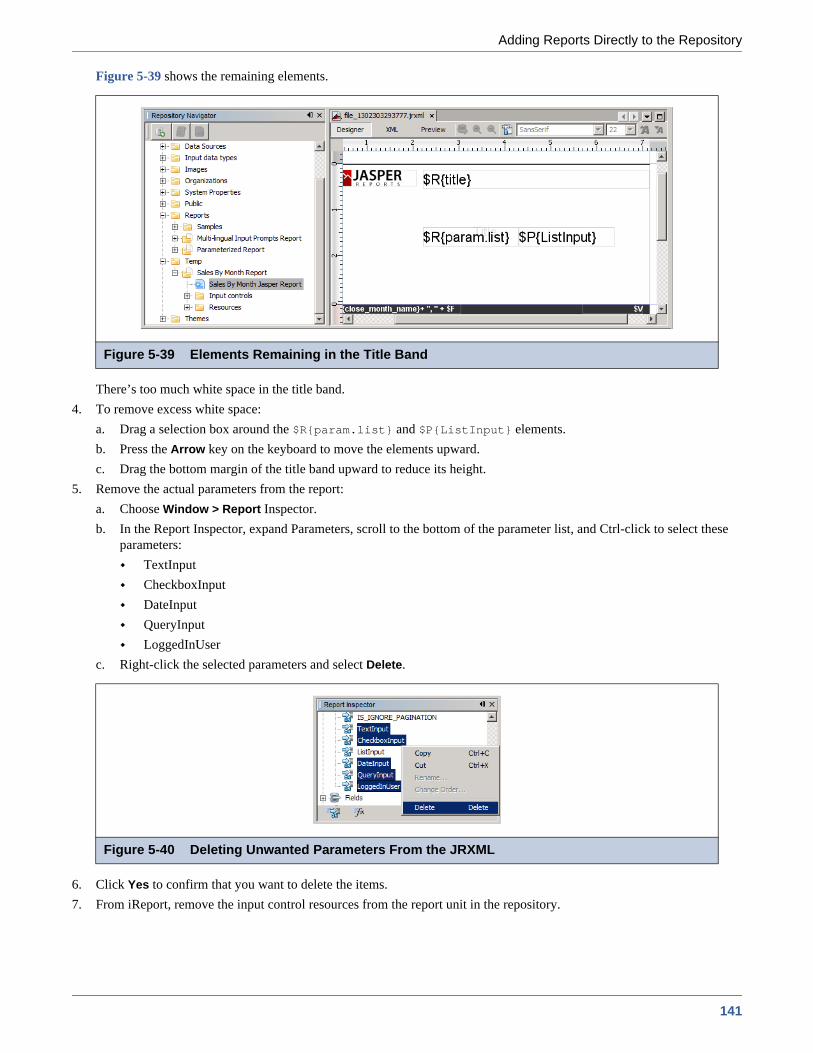
Adding Reports Directly to the Repository
Figure 5-39 shows the remaining elements.
There’s too much white space in the title band. 4. To remove excess white space:
a. Drag a selection box around the $R{param.list} and $P{ListInput} elements.b. Press the Arrow key on the keyboard to move the elements upward. c. Drag the bottom margin of the title band upward to reduce its height.
5. Remove the actual parameters from the report:a. Choose Window > Report Inspector. b. In the Report Inspector, expand Parameters, scroll to the bottom of the parameter list, and Ctrl-click to select these
parameters:TextInputCheckboxInputDateInputQueryInputLoggedInUser
c. Right-click the selected parameters and select Delete.
6. Click Yes to confirm that you want to delete the items.7. From iReport, remove the input control resources from the report unit in the repository.
Figure 5-39 Elements Remaining in the Title Band
Figure 5-40 Deleting Unwanted Parameters From the JRXML
141
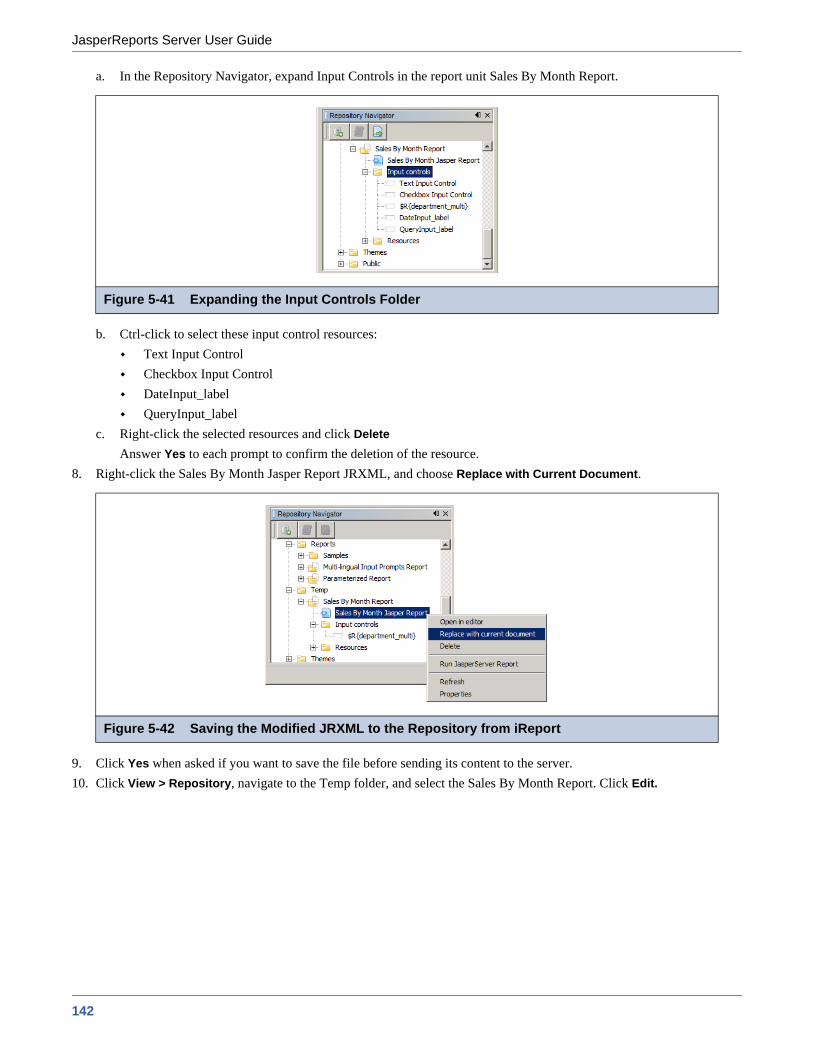
JasperReports Server User Guide
a. In the Repository Navigator, expand Input Controls in the report unit Sales By Month Report.
b. Ctrl-click to select these input control resources:Text Input ControlCheckbox Input ControlDateInput_labelQueryInput_label
c. Right-click the selected resources and click DeleteAnswer Yes to each prompt to confirm the deletion of the resource.
8. Right-click the Sales By Month Jasper Report JRXML, and choose Replace with Current Document.
9. Click Yes when asked if you want to save the file before sending its content to the server.10. Click View > Repository, navigate to the Temp folder, and select the Sales By Month Report. Click Edit.
Figure 5-41 Expanding the Input Controls Folder
Figure 5-42 Saving the Modified JRXML to the Repository from iReport
142

Adding Reports Directly to the Repository
Figure 5-43 shows the JasperReport wizard on the server. Only one input control remains in the report.
To run the report that uses a multi-lingual list of values:1. Click LogOut. On the server login page, click Show locale & time zone, select the en_US-English (United States)
locale, and log into the server as an administrator.2. Navigate to the Temp folder of the repository, and click the name of the Sales By Month Report to run the report.
The report viewer presents the report using English field and property names in the report.3. Click Options, and select the drop-down.
The prompt and list of values appear in English, as shown in Figure 5-45 on page 144.4. Logout, on the server login page, click Show locale & time zone, select the fr_French locale, and log into the server as
an administrator.5. Navigate to the Temp folder of the repository, and click the name of the Sales By Month Report to run the report.
Figure 5-44 shows the report output: the French report title, field, and property names defined in the resource bundle. The server formats the currency using a comma instead of a decimal point to separate Euro cents from dollars. Translation
Figure 5-43 Controls & Resources Listing Only One Input Control
143

JasperReports Server User Guide
packs and resource bundles installed with the server for the French locale are used to format currency and dates and to translate web interface components.
6. Click Options, and select the drop-down. The input control prompt and static list of values appears in French.Figure 5-45 shows the input control prompt and static list of values in English and in French.
Figure 5-44 Viewing Report Output for the French Locale
Figure 5-45 A List of Values in English and French
144
Adding Reports Directly to the Repository
5.6.4 Reusing Resource BundlesThe location of a resource bundle determines its capability for being reused and conditions under which the server uses it. To resolve a $R expression in a report, the server scans resource bundles at two levels in the order described in this table.
First, the server searches the report/repository level and stops scanning resource bundles if it finds a resolution to the $R expression. If the server does not find a resolution, it scans the server level for the resource ID of the field and uses this ID.
5.6.5 Using Default Fonts in JasperReports ServerBy default, the server uses three fonts you can use in reports:
DejaVu SansDejaVu SerifDejaVu Sans Mono
Using the DejaVu fonts shipped with the server ensures availability of fonts in all environments; the PDF is pixel-perfect every time.
The DejaVu fonts replace the Java logical fonts used in previous versions of the server:SansSerifSerifMonospaced
When using the DejaVu fonts coming from JasperReports font extensions, you don’t need to set any other font attributes (such as the pdfXXX attributes) in the JRXML or specify font mapping. The font extension file that makes these fonts available sets font attributes and mapping.
For more information about DejaVu, refer to its SourceForge project at:http://dejavu-fonts.org/wiki/index.php?title=Main_Page.
Order Level Description
1 Report/ Repository
A report-level bundle declares the resource bundle base name in the header of its JRXML file. The Romanian resource bundle is a report-level bundle. A repository-level bundle is independent of any specific report and can be linked to multiple reports, as described in section 8.5, “Locale Bundles,” on page 228).
2 Server A server-wide bundle typically contains server messages and labels of user interface components, as described in the JasperReports Server Administrator Guide. This bundle typically resides in the WEB-INF/bundles directory of the server.
SansSerif, Serif, Monospaced can still be used, but are deprecated because these Java logical fonts map to different TTF files in different environments, and run the risk of text being cut when exported to PDF due to font metric mismatches. Also, these Java logical fonts aren't recognized by some browsers, resulting in font substitutions. For example, Firefox in a Windows environment renders the SansSerif logical font as Serif.
When you upload a TrueType font to the repository, the file name must include the correct extension (.TTF).
145

JasperReports Server User Guide
146

Creating Domains
CHAPTER 6 CREATING DOMAINS
A Domain is a metadata layer that provides a business view of the data accessed through a data source. A Domain presents the data in business terms appropriate to your audience, and can limit the access to data based on the security permissions of the person running the report. A Domain defined in JasperReports Server can be used to create reports, Ad Hoc views, and Domain Topics.
This chapter covers the process of creating a Domain and defining its contents. For instructions about creating Domain Topics and views based on Domains in the Ad Hoc Editor, see section 4.8, “Creating a View from a Domain,” on page 93. Domains defined in the server can be accessed through iReport Designer as well, as described in section 7.7, “Using the Domain Plug-in,” on page 195.
This chapter contains the following sections:Introduction to DomainsExample of Creating a DomainExample of Creating a Domain Using a Virtual Data SourceUsing the Add New Domain PageUsing the Domain DesignerEditing a Domain
6.1 Introduction to DomainsProduction databases typically contain data in tables that are optimized for storage and retrieval. Columns with data relevant to users need to be joined across several tables, filtered by business needs, secured against unauthorized access, and labeled using user-friendly names. In relational databases, a view can perform some of these functions. In the server, a Domain performs all these functions and more, such as the localization of report text and permissions based on data values.
A Domain is a virtual view, created and stored in the server without modifying the data source. Through a Domain, users see columns that have been joined, filtered, and labeled for their business needs. Security policies limit the data values users can access through a Domain. Administrators define Domains, and users create reports based on Domains using either the Ad Hoc Editor or iReport.
Domains, like Topics, are used in the Ad Hoc Editor as a basis for designing reports. Users can save a report based on a Domain for others to run, and can also save the settings in a Domain Topic so others can design similar reports.
Typically, database administrators or business analysts create Domains for end users who understand the structure of the raw data in the database. In the default server installation, those who create Domains must have organization admin privileges.
147

JasperReports Server User Guide
Using a Domain instead of a Topic has the following advantages:Domains can be created directly through the server user interface.Domains can use virtual data sources, which combine data residing in multiple JDBC or JNDI data sources into a single data source that can query the combined data. Domain creators can write SQL queries, joins, filter expressions, and security files to specify exactly what data can be accessed, as well as labels and locale bundles to specify how the data appears.When designing a report based on a Domain, the server can optimize database access to allow editing of reports that access huge datasets.A Domain design typically includes data filtering, but users who create reports using the Domain can filter data even further. Users can select a subset of columns to appear in the Ad Hoc Editor and give them custom labels. Users can filter the data for each column.Users who create reports can design prompts for input from report readers to filter data that appears in the document.
For more information, see section 4.8, “Creating a View from a Domain,” on page 93 and section 4.9.2, “Creating Topics from Domains,” on page 99.
6.1.1 Domain Use CasesTypically, you base the decision to use Domains, Domain Topics, or saved reports on the complexity of the data and your business needs. Consider the following use cases:
Case 1 – Domains and Domain Topics can be designed to give users great freedom in designing reports plus the security features that prevent unauthorized access to data. Case 2 – Administrators can create very targeted Domains and Domain Topics, then use repository access permissions to make sure users cannot modify them.
In the first case, a Domain could contain dozens of tables in several unjoined sets, perform very little filtering but define a strong data-level security policy. Users of the Domain might see only a single set of tables according to their security permissions. They could then perform their own filtering, relabel columns for their own needs, and save their settings as a Domain Topic for future reuse in Ad Hoc views. In this case, there might be only one Domain within the organization but many Domain Topics that users have created for specific needs.
In the second case, Domains can be used to perform complex joins, have formulae for calculating new columns, filter data, and select a small set of columns for specific users or specific types of reports. Perhaps reports also need to be internationalized, so the administrator creates the corresponding locale bundles. In this scenario, there might be many specific Domains, and each would have corresponding locale bundles and a single Domain Topic. Users would have a wide variety of Domain Topics to choose from, each for a specific purpose, but no opportunity to access the Domains to perform their own filtering.
The preceding examples illustrate two extreme cases, but there are many scenarios that combine some degree of both. The number of users in your production environment and their level of proficiency also determine your general use cases. A small number of users who understand their database might be given administrator privileges to define complex Domains as an extension of the Ad Hoc view design process. On the other hand, with large numbers of users or with users who have limited database skills, administrators want to create Domains that help the users meet their business goals.
The table in section 4.9.2, “Creating Topics from Domains,” on page 99 describes individual use cases for Domains, Domain Topics, and reports based on Domains.
6.1.2 TerminologyThis chapter refers to both columns and fields. Conventionally, database tables are composed of columns, and the columns divide each row or record into fields. Some Domain operations refer to columns, others to fields, however the two terms refer to the same concept from different perspectives. For example, a calculated field refers to a field that is computed from the other field values in the same row or record. But the effect of a calculated field in every row is to create a new calculated column. Similarly, operations such as joins and filters operate on designated field values in a row, but they are defined by the columns that determine the fields involved.
Within a Domain, columns are called items. Because an item may originate from derived tables or calculated fields, it may not correspond to a single column in the database.
148

Creating Domains
Measures are columns or fields that display numeric values or aggregate values in reports. Measures are the quantitative values of a record, such as an amount, as opposed to qualitative values such as name or location. Having a field designated as a measure determines where the item can be placed in the report. For example, measures appear summarized in the center of crosstabs, whereas only non-measures, simply called fields, can be used as row and column groups of the crosstab. In Domains, all items based on numeric fields are designated as measures by default, but you can set them manually as well. By marking items as measures, Domains help report creators find and use the data they need in the Ad Hoc Editor.
6.1.3 Components of a DomainA Domain is saved as an object in the repository. Like other repository objects, it has a name, optional description, and folder location specified at creation time. A Domain references the following components:
A JDBC, JNDI, or virtual data source whose tables and columns are presented through the Domain. Data sources are selected from previously defined data sources in the repository.The Domain design that specifies tables and columns in the data source, queries for derived tables, joins between tables, calculated fields, and labels to display the columns.Optional locale bundles consisting of localized property files that present labels and descriptions in other languages.Optional security file that defines row and column-level access privileges based on users or roles.
The Domain design is either created using the Domain Designer or uploaded from an external XML file. Locale bundles and security files are uploaded from external files. The following sections describe the various dialogs for selecting, creating, or uploading the components of a Domain.
6.1.4 Sample DomainsThe following sample Domains are provided in Organization > Domains in the default installation:
Simple Domain – Demonstrates basic features of DomainsBased on the SugarCRM JNDI sample data sourceIncludes a design file that you can export, as described in section 8.1, “The Domain Design File,” on page 201Used to create Simple Domain Topic in the Organization > Ad Hoc Components > Topics folder, as described in section 4.9.2, “Creating Topics from Domains,” on page 99Shows how a report creator can see the items in a Domain through a Domain Topic
SuperMart Domain – Demonstrates advanced features of DomainsBased on the Foodmart sample data sourceRepresents a complex Domain with many tables and joinsIncludes a design file that you can export, as described in section 8.1, “The Domain Design File,” on page 201Includes the Domain security file and locale bundles that you can download and inspect, as described in section 8.1, “The Domain Design File,” on page 201
You can use the samples to practice designing and using Domains and to see complex reports based on Domains:
6.1.5 Overview of Creating a DomainIn practice, you should plan Domain features before you begin the creation process. Decide on the data source and define it in the server repository. If you need to combine several data sources into a single data source, first define each data source in the repository and then create a virtual data source that combines them. Know the elements of your design: tables and columns to choose, joins to perform, filters to define, sets you need, and item properties to expose to users. Determine whether the users of the Domain need localized resources, such as translated labels and local formats. Finally, determine a security policy for the data retrieved through the Domain.
To launch the Domain Designer:1. As an administrative user, select Add Resource > Domain in the repository to open the Add New Domain page of the
Domain Designer.2. Enter a name and optional description for the Domain.3. Under Data Source, browse to locate a data source.
149

JasperReports Server User Guide
4. Optionally define localization bundles or data-level security on the Add New Domain page of the Domain Designer.5. Click Create with Domain Designer to launch the Domain Designer.
The next two sections include detailed examples of creating Domains.
6.2 Example of Creating a DomainThe following example shows how to create a Domain. For complete information about all of the options and settings available for designing reports, see section 6.4, “Using the Add New Domain Page,” on page 165 and section 6.5, “Using the Domain Designer,” on page 167.
To create a sample Domain:1. Log in to JasperReports Server as an administrator and select Create > Domain.
Alternatively, you can select View > Repository, then right-click a folder, such as /Domains, and select Add Resource > Domain from the context menu.The Add New Domain page appears:
2. In Name, enter a name for the Domain and an optional description. In this example:Name – Example DomainDescription – Created in User Guide tutorial
3. In Resource ID, accept the automatically entered ID or enter an ID. No space characters are allowed.
Figure 6-1 Add New Domain Page
150

Creating Domains
4. In Save Location, click Browse, and browse to the Domains folder.5. Under Data Source, click Browse. The Select Data Source dialog box appears.6. Select Analysis Components > Analysis Data Sources > SugarCRM Data Source, and then click Select:
The path to the data source appears on the Add New Domain page.7. Under Domain Design, click Create with Domain Designer.8. For data sources that allow schemas (subdivisions of a database), you are prompted to select a schema. The PostgreSQL
database that is bundled in the evaluation version supports schemas, so you must select the public schema, as shown in the following figure:
9. Click OK in the Select Database Schemas dialog if necessary.The Domain Designer appears. The Tables tab shows the database tables in the data source. You can expand each table to see its individual columns.
Figure 6-2 Select a Data Source for a New Domain
Figure 6-3 Select a Schema for a New Domain
151

JasperReports Server User Guide
10. Double-click the following tables in Data Source to add them to Selected Tables:public_accounts, public_accounts_opportunities,public_cases, public_opportunities, public_users
Because this example uses the Sugar CRM data source, ignore the check box Inspect new tables and automatically generate joins.
11. Click the Derived Tables tab. A derived table is defined by a query and a selection of the columns in the result. 12. Create a derived table:
a. Enter a meaningful name in the Query ID field, in this example: p1cases.b. Type the following query:
select * from public.cases where cases.priority='1' and cases.deleted='0'
c. Click Run Query.d. Using Ctrl-click, select the following fields from the query result:
In databases that support schemas (subdivisions of a database), tables names are prefixed by <schemaName>_ to distinguish tables that may have the same name in separate schemas. This procedure is based on the sample data in a PostgreSQL database, and therefore it uses table names with the public_ prefix.
Figure 6-4 Tables Tab of the Domain Designer
idcase_numberdate_entered
assigned_user_idnameaccount_id
statusdescriptionresolution
152
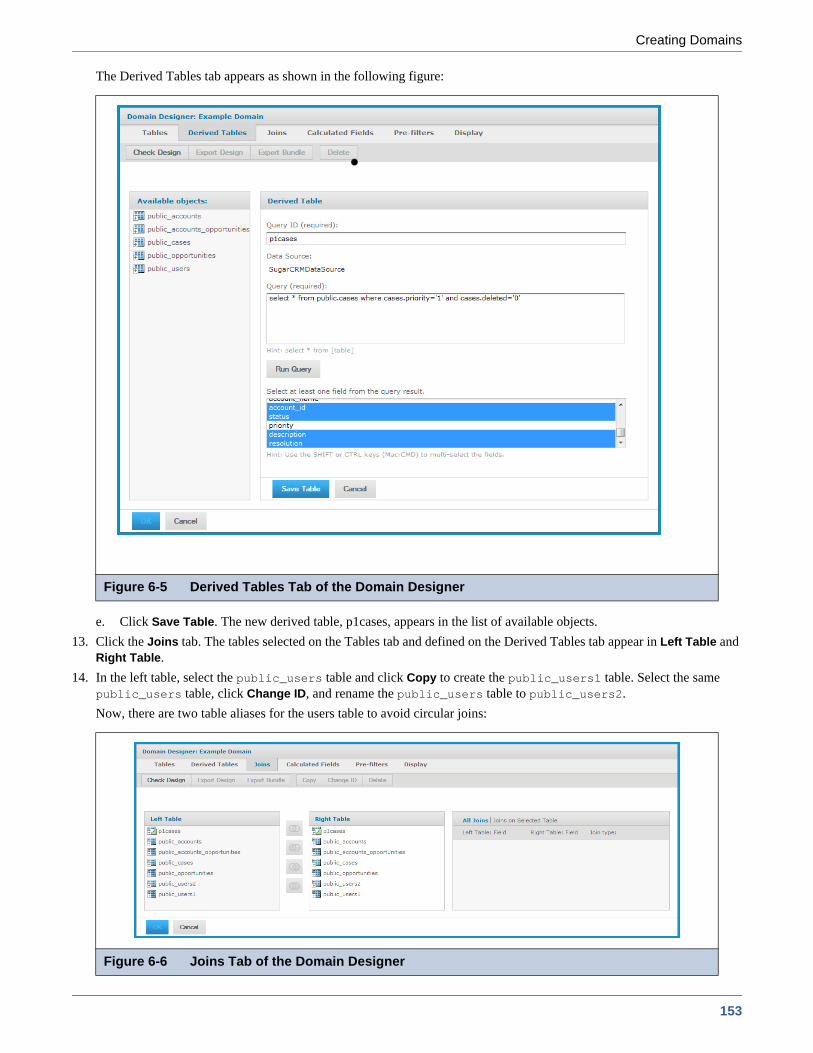
Creating Domains
The Derived Tables tab appears as shown in the following figure:
e. Click Save Table. The new derived table, p1cases, appears in the list of available objects. 13. Click the Joins tab. The tables selected on the Tables tab and defined on the Derived Tables tab appear in Left Table and
Right Table. 14. In the left table, select the public_users table and click Copy to create the public_users1 table. Select the same
public_users table, click Change ID, and rename the public_users table to public_users2. Now, there are two table aliases for the users table to avoid circular joins:
Figure 6-5 Derived Tables Tab of the Domain Designer
Figure 6-6 Joins Tab of the Domain Designer
153

JasperReports Server User Guide
15. To specify a join, expand the tables to see column names, select a column in the left table and a column in the right table, then click a join icon. For this example, specify the following joins:
The final list of joins appears as shown below:
16. Click the Calculated Fields tab.
17. Enter the following details for a calculated field that creates unambiguous city names:Field Name – city_and_stateType – StringExpression – concat( public_accounts.billing_address_city, ', ', public_accounts.billing_address_state)
Left Table and Column Right Table and Column Join Type
public_accounts: id public_accounts_opportunities: account_id Inner
public_accounts_opportunities: opportunity_id public_opportunities: id Inner
public_opportunities: assigned_user_id public_users1: id Inner
public_accounts: id P1cases: account_id Left Outer
public_users2: id P1cases: assigned_user_id Right Outer
Each row returned by an inner join contains data from all tables involved in the join. Outer joins return rows that satisfy the join condition plus rows from either the left or right table for which no corresponding rows exist in the other table. In this example, the result of the left outer join includes accounts without P1 cases. The result of the right outer join includes P1 cases without assigned users.
Figure 6-7 Joins for Example Domain
The Available Fields panel shows join trees, which are the joined tables resulting from any joins you defined, and any unjoined tables, such as the cases table in this example.The cases table was used only to help create the p1cases derived table, but itself was not joined to the other tables, as shown in Figure 6-8.
When entering the expression, you can expand the join tree and double-click column names to insert them instead of typing them.
154

Creating Domains
18. Click Save Field to validate the expression and add the calculated field to Available Fields.19. Click the Pre-filters tab.
The Fields and Filters panels appear.20. Define two filters as follows:
a. In Fields, expand the join tree and the public_opportunities table.b. Double-click the opportunity_type column to create a filter condition.c. Use Equals as the comparison operator, and select Existing Business from the drop-down.d. Click OK to create the filter.e. Create another filter by expanding the p1cases table and double-clicking the status column.
f. Choose the is not equal to comparison operator.g. Enter the value closed in the search field, but do not click the search icon.
h. Click OK to save the filter.
Figure 6-8 Calculated Fields Tab of the Domain Designer
If you select the wrong column, click Cancel.
When the selection list in the Filters pane does not contain the value you want to use, type it in the search field.
155

JasperReports Server User Guide
The filters you defined appear in the Filters panel:
21. Click the Display tab. On this tab, you define how you want your fields to appear to users.
22. Create a hierarchy of sets and items from the tables and columns in JoinTree_1:a. Select JoinTree_1.
b. Click to add all of the JoinTree_1 tables and columns to Sets and Items. 23. In the Properties panel, rename the sets and items to give them descriptions specified in the following table.
Figure 6-9 Pre-filters Tab of the Domain Designer
Figure 6-10 Display Tab of the Domain Designer
The properties in the following table are meant to be realistic but do not represent an actual business case.
156
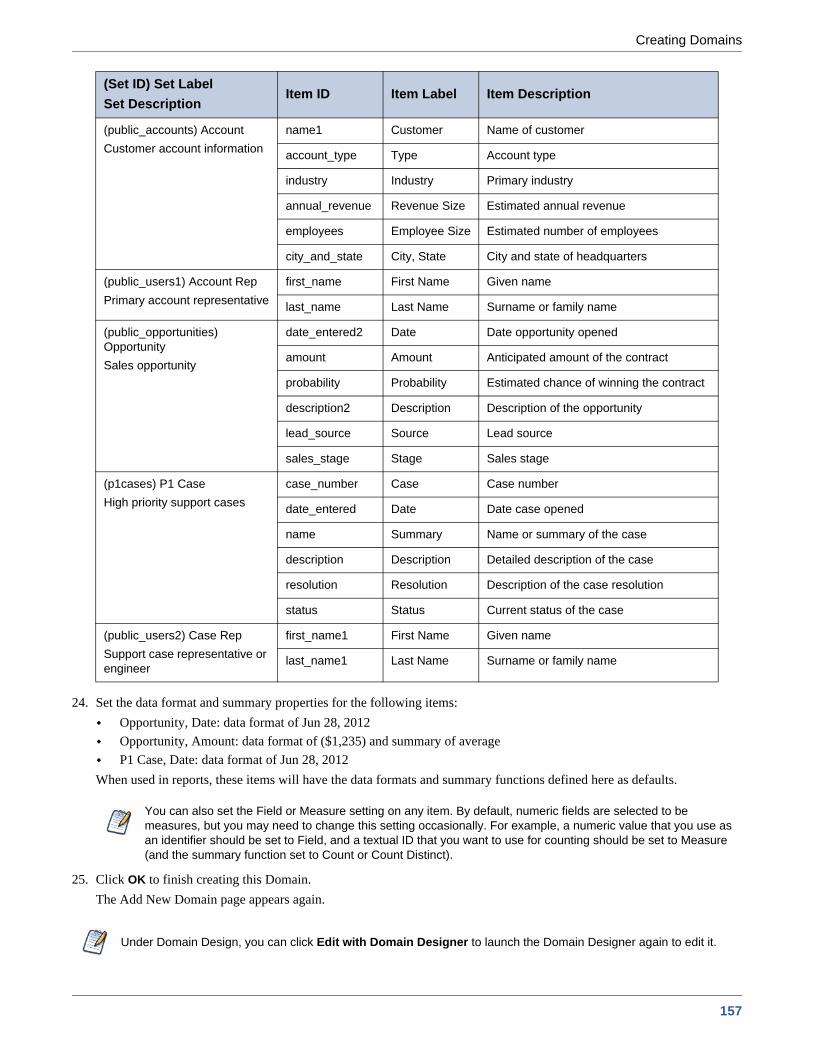
Creating Domains
24. Set the data format and summary properties for the following items:Opportunity, Date: data format of Jun 28, 2012Opportunity, Amount: data format of ($1,235) and summary of averageP1 Case, Date: data format of Jun 28, 2012
When used in reports, these items will have the data formats and summary functions defined here as defaults.
25. Click OK to finish creating this Domain. The Add New Domain page appears again.
(Set ID) Set LabelSet Description
Item ID Item Label Item Description
(public_accounts) AccountCustomer account information
name1 Customer Name of customer
account_type Type Account type
industry Industry Primary industry
annual_revenue Revenue Size Estimated annual revenue
employees Employee Size Estimated number of employees
city_and_state City, State City and state of headquarters
(public_users1) Account RepPrimary account representative
first_name First Name Given name
last_name Last Name Surname or family name
(public_opportunities) OpportunitySales opportunity
date_entered2 Date Date opportunity opened
amount Amount Anticipated amount of the contract
probability Probability Estimated chance of winning the contract
description2 Description Description of the opportunity
lead_source Source Lead source
sales_stage Stage Sales stage
(p1cases) P1 CaseHigh priority support cases
case_number Case Case number
date_entered Date Date case opened
name Summary Name or summary of the case
description Description Detailed description of the case
resolution Resolution Description of the case resolution
status Status Current status of the case
(public_users2) Case RepSupport case representative or engineer
first_name1 First Name Given name
last_name1 Last Name Surname or family name
You can also set the Field or Measure setting on any item. By default, numeric fields are selected to be measures, but you may need to change this setting occasionally. For example, a numeric value that you use as an identifier should be set to Field, and a textual ID that you want to use for counting should be set to Measure (and the summary function set to Count or Count Distinct).
Under Domain Design, you can click Edit with Domain Designer to launch the Domain Designer again to edit it.
157

JasperReports Server User Guide
26. Click Submit in the Add New Domain page.The new Domain is validated and stored in the location you specified in step 4. The new Domain appears in search results when you search the repository for it.
6.3 Example of Creating a Domain Using a Virtual Data SourceThe following example shows how to create a Domain based on a virtual data source. The Domain designer interface is very similar to the example in section 6.2, “Example of Creating a Domain,” on page 150, which covers some of these options in more detail. For complete information about all of the options and settings available for designing reports, see section 6.4, “Using the Add New Domain Page,” on page 165 and section 6.5, “Using the Domain Designer,” on page 167.
The example in this section uses the SugarFoodMartVDS virtual data source, which combines the Foodmart and SugarCRM JDBC data sources. Normally, you combine data sources that have relationships you want to explore. For this example, lets you work with SugarCRM sales and Foodmart sales by city, region, or state.
To create a useful Domain using a virtual data source, you need to define relationships that connect the tables of the different data sources. This example shows how to create a Domain that shows the sales by city for each data source. To do this, you create two derived tables, one which aggregates sales by city for the Foodmart data source and another which aggregates amount by city for the SugarCRM data source. Then you join the two data sources on city to combine them.
To create a sample Domain using a virtual data source:1. Log in to JasperReports Server as an administrator and select Create > Domain.
Alternatively, you can select View > Repository, then right-click a folder, such as /Domains, and select Add Resource > Domain from the context menu.
158
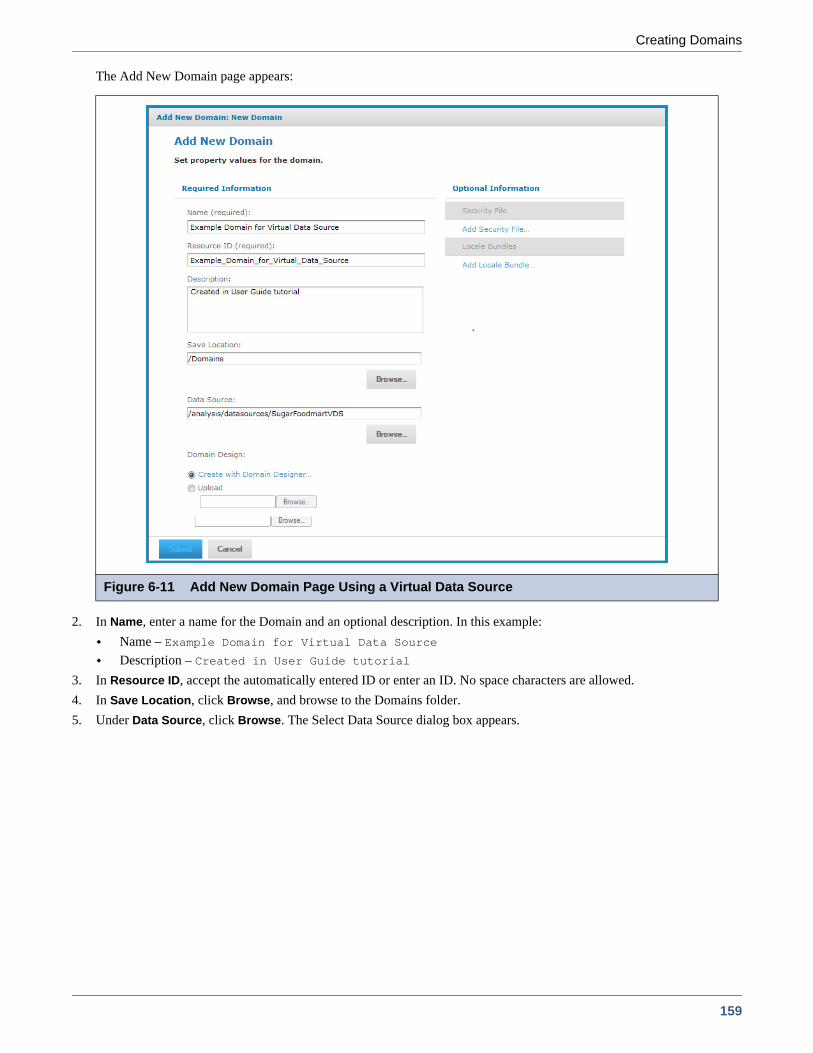
Creating Domains
The Add New Domain page appears:
2. In Name, enter a name for the Domain and an optional description. In this example:Name – Example Domain for Virtual Data SourceDescription – Created in User Guide tutorial
3. In Resource ID, accept the automatically entered ID or enter an ID. No space characters are allowed. 4. In Save Location, click Browse, and browse to the Domains folder.5. Under Data Source, click Browse. The Select Data Source dialog box appears.
Figure 6-11 Add New Domain Page Using a Virtual Data Source
159

JasperReports Server User Guide
6. Select Data Sources > SugarCRM-Foodmart Virtual Data Source, and then click Select:
The path to the data source appears on the Add New Domain page.7. Under Domain Design, click Create with Domain Designer.8. You are prompted to select the database schemas to use. Use Ctrl-Click to select multiple schemas; these can be schemas
from different databases or different schemas from the same database. The example in this section uses the schemas as they appear in the PostgreSQL database that is bundled in the evaluation version. Select the FoodmartDataSource_public and SugarDataSource_public schemas:
9. Click OK.
Figure 6-12 Select a Virtual Data Source for a New Domain
Figure 6-13 Select Schemas for a New Domain Using a Virtual Data Source
In Domains that use virtual data sources, table and schema names are prefixed by the data source alias to distinguish tables and schemas that may have the same name in separate data sources. Aliases are set when the virtual data source is created. The example in this section uses the schema names as they appear in the PostgreSQL database that is bundled in the evaluation version.
160

Creating Domains
The Domain Designer appears. The Tables tab shows the database tables in the data source.
You can create a Domain by joining the two data sources on City, Region, and Country. In this example, a Domain created that way works well for a crosstab, but does not work as well for a chart or table. This is because the data sources include geographic information at lower level than City. To use the data for a chart or table, you need to aggregate the city values for each data source, and then join those.10. Double-click the following tables in Data Source to add them to Selected Tables:
FoodmartDataSource_public_sales_fact_1998, FoodmartDataSource_public_store,SugarCRMDataSource_public_sales_fact, SugarCRMDataSource_public_sales_location
Ignore the check box Inspect new tables and automatically generate joins.
11. Click the Derived Tables tab. 12. Create the following derived table to aggregate store_sales for the Foodmart data source by city:
a. Enter a meaningful name in the Query ID field, in this example: FoodmartSalesByCity.b. Type the following query to aggregate the store sales by city:
select store_city FoodCity, sum(store_sales) FoodCitySales from FoodmartDataSource_public.store join FoodmartDataSource_public.sales_fact_1998 on (FoodmartDataSource_public.sales_fact_1998.store_id = FoodmartDataSource_public.store.store_id) group by store_city
c. Click Run Query.d. The fields from the query result are automatically highlighted:
FoodCityFoodCitySales
The Derived Tables tab appears as shown in the following figure:
Figure 6-14 Tables Tab of the Domain Designer Using a Virtual Data Source
SQL queries for a derived table must be valid with respect to the JDBC driver for the data source. If you are working with a virtual data source, SQL queries are validated against Teiid SQL, which provides DML SQL-92 support with select SQL-99 features. For more information, see the Teiid documentation under the Documentation link on the Jaspersoft Support Portal.
161

JasperReports Server User Guide
e. Click Save Table. The new derived table, FoodmartSalesByCity, appears in the list of available objects. 13. Create a second derived table to aggregate the amount for the Sugar data source by city:
a. Enter a meaningful name in the Query ID field, in this example: SugarAmountByCity.b. Type a query to aggregate the amount by city. If the data source you are using supports database schemas, use the
following query: select city SugarCity, sum(amount) SugarCityAmount from SugarCRMDataSource_public.sales_location join SugarCRMDataSource_public.sales_fact on (SugarCRMDataSource_public.sales_location.id = SugarCRMDataSource_public.sales_fact.sales_location_id) group by SugarCRMDataSource_public.sales_location.city
c. Click Run Query.d. The following fields are highlighted in the query result:
SugarCitySugarCityAmount
Figure 6-15 Derived Tables Tab of the Domain Designer Using a Virtual Data Source
162

Creating Domains
The Derived Tables tab appears as shown in the following figure:
e. Click Save Table. The new derived table, SugarAmountByCity, appears in the list of available objects.
14. Click the Joins tab. The tables selected on the Tables tab and defined on the Derived Tables tab appear in Left Table and Right Table.
15. In the left table, expand the FoodmartSalesByCity table and select the FoodCity column. 16. In the right table, expand the SugarAmountsByCity table and select the SugarCity column.
Figure 6-16 Derived Tables Tab of the Domain Designer Using a Virtual Data Source
You can also use the Derived Tables tab to combine two tables from different databases or schemas that have identical columns. For example, if you have a virtual data source where Table 1 in DataSource1 and Table2 in DataSource2 have identical columns, you can create a derived table that combines these two tables using the following syntax:select * from DataSource1.Table 1 UNION ALL select * from DataSource2.Table2
163
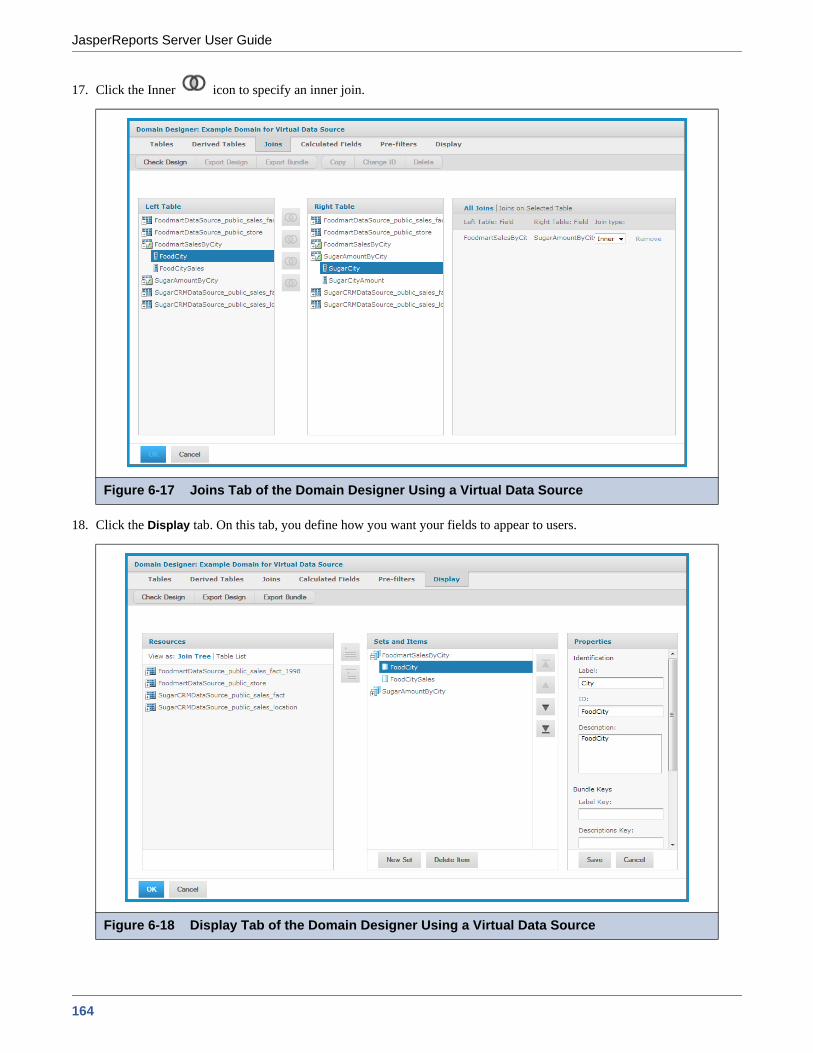
JasperReports Server User Guide
17. Click the Inner icon to specify an inner join.
18. Click the Display tab. On this tab, you define how you want your fields to appear to users.
Figure 6-17 Joins Tab of the Domain Designer Using a Virtual Data Source
Figure 6-18 Display Tab of the Domain Designer Using a Virtual Data Source
164

Creating Domains
19. Create a hierarchy of sets and items from the tables and columns in JoinTree_1:a. Expand JoinTree_1.
b. Select FoodmartSalesByCity and click to add it to Sets and Items.
c. Select SugarAmountsByCity and click to add it to Sets and Items.20. Select FoodCity under FoodMartSalesByCity in the Sets and Items panel. Click Edit in the Properties panel and change
the Label to City. Click Save.21. Click OK to finish creating this Domain.
The Add New Domain page appears again. 22. Click Submit in the Add New Domain page.
The new Domain is validated and stored in the location you specified in step 4. The new Domain appears in search results when you search the repository for it. You can use this Domain to create Ad Hoc views based on this combined information.
6.4 Using the Add New Domain PageThe Add New Domain page appears when you click Create > Domain or when you right-click a repository folder and choose Add Resource > Domain. From the Add New Domain page, you set up basic properties of the Domain, such as its name and data source, and then launch the Domain Designer.
On the Add New Domain page, you specify the following components of the Domain:Name – Specify the name for the Domain that users will see in the repository.Resource ID – Accept the automatically entered resource ID or enter a new one. No spaces allowed.Description – Specify the description that appears in the repository and in the Ad Hoc Editor when users create a report using the Domain. Optional, but recommended.
Figure 6-19 Add New Domain Page
165

JasperReports Server User Guide
Save Location – Browse to the repository folder where you want to save the Domain.
Data Source – Browse the repository to choose a data source from the list of data sources in your organization.Use only data sources that are in the repository and for which the user has at least read permission.Domains must use a JDBC, JNDI, or virtual data source.You can use the sample JDBC, JNDI, and virtual data sources in Organization > Data Sources and Organization > Analysis Components > Analysis Data Sources if you installed the sample data.
Domain Design – Create the design using the Domain Designer console or upload a Domain design file from outside the repository. See chapter Chapter 8, “Advanced Domain Features,” on page 201 for more information about Domain design files.Optional Information – Specify a security file and one or more locale bundles.
Before you can submit and save a Domain to the repository, you must specify a display name, resource ID, save location, data source, and Domain design. The Submit button is grayed out until you have created or specified the design for your domain.
The Cancel button exits the Add New Domain page. For new Domains, no Domain is created; when modifying an existing Domain, it remains unchanged.The Submit button validates and saves the Domain components. For more information, see section 6.5, “Using the Domain Designer,” on page 167. The location for Domains in the sample data is the Organization > Domains folder, but you may use any location.
6.4.1 Add Security File and Add Locale Bundle OptionsThe Add New Domain page includes options to upload security and locale bundle files for the Domain. You can add, replace, or remove any previously uploaded files for the Domain:
Adding security and local bundle files is documented in section 8.3, “Security and Locale Information for a Domain,” on page 218.
The server locates Domains by their repository object type, not by their location. The default location is the last folder selected in the repository.
Figure 6-20 Resources Page of the Add New Domain Dialog
166

Creating Domains
6.4.2 Selecting a SchemaIf you are using a data source that supports database schemas, such as an Oracle RDBMS, you need to specify the schema to use. You also need to select schemas when you are using a virtual data source. The Select Database Schemas dialog box appears when your database supports schemas and you click Create with Domain Designer.
If you are using a JDBC or JNDI data source, select a single schema from the available schemas in the data source. If you are using a virtual data source, use Ctrl-click to select multiple schemas; these can be from the same data source or different data sources.
All the tables in the schemas you choose appear in the Data Source panel on the Tables tab. For more information, see section 8.1, “The Domain Design File,” on page 201.
6.5 Using the Domain DesignerYou use the Domain Designer to define all the components of a Domain. From the bottom of the Add New Domain or Edit Domain pages, click Create in Domain Designer or Edit in Domain Designer, respectively to open the Domain Designer console. Along the top of the Domain Designer console are tabs for configuring various aspects of the design:
Tables tab – Select all tables whose columns you want to use in the Domain, either directly or indirectly.Derived Tables tab – Enter queries whose results appear as derived tables available in the Domain.Joins tab – Define inner and outer joins between all the tables and derived tables.Calculated Fields tab – Enter expressions whose results appear as calculated fields.Pre-filters tab – Specify conditions on field values to limit the data accessed through the Domain.Display tab – Organize the visual aspects of the Domain and change the display properties of tables, columns, sets, and items exposed to Domain users.
From the Tables tab, you can navigate to any other tab. To navigate between tabs, click the tab name at the top of the Domain Designer. Before you can save the design, you must choose which sets and items to expose to users of the Domain. The OK button on the console validates the design and saves it in the location you specified earlier. For more information, see section 6.5.10, “Domain Validation,” on page 177. After saving a Domain, you can modify it using the Domain Designer.
The Cancel button on the console exits the Domain Designer without saving any of the design settings. For new Domains, no design is saved; when modifying an existing design, it remains unchanged.
Figure 6-21 Select Database Schemas for Regular and Virtual Data Sources
167
JasperReports Server User Guide
6.5.1 Tables TabThe Tables tab contains two panels:
Data Source – Shows the tables and columns in the data source or database schema you chose in the Add New Domain page. Selected Tables – Shows all tables and columns that you use to design the Domain. Initially, this panel is blank.
Typically, you move the following tables from Data Source to Selected Tables:Tables that need to be joinedTables that you want to reference in the Domain design, even if their columns do not appear directly in the Domain. For example, select the tables containing columns that you want to use in a derived table or calculated field.
An understanding of the logical design of tables in the data source is critical to selecting which tables need to be joined.
To select tables for use in designing the Domain, first expand the table icons beside the table names to inspect the columns of a table. Double-click or drag a table name in the Data Source panel to move it to the Selected Tables panel. Alternatively, use or to move a table from one panel to the other.
To remove a table, double-click or drag it out of Selected Tables. You can also click to clear Selected Tables.
The Inspect new tables and automatically generate joins check box at the bottom of Selected Tables creates joins only if the database has been configured with referential constraints (foreign keys). Otherwise, selecting it has no effect.
The Tables tab does not detect changes to the database tables and columns in real-time. To update a Domain after making changes to the database structure, click OK to close the Domain Designer, then launch it again.
Keep the following points in mind regarding Domain updates:New tables and columns appear in the Data Source panel; new columns appear under their table name. To add a new column to the Domain, move its table to Selected Tables. The Tables tab works only with entire tables. From Selected Tables, respond affirmatively to the prompt to remove tables and columns deleted from the database. The Domain Designer removes those columns or tables from the Tables tab.
On the Tables tab, you can select only entire tables for the Domain. On the Display tab, you can make column-level selections.
If applicable, the generated joins appear on the Join tab.
If you had selected the dropped columns for display, you must manually remove them from the Display tab, otherwise the Domain issues a validation error. For information about removing columns that were displayed through the Domain, see section 6.6.1, “Maintaining Referential Integrity,” on page 180.
168

Creating Domains
6.5.2 Manage Data Source Dialog BoxThe name of the data source that you choose for the Domain appears at the top of the Data Source panel on the Tables tab. Click the name of the data source to make changes to it. The Manage Data Source dialog box appears:
As shown in this figure, the default name for a data source is the display name of its repository object. You can edit the name by typing a new one. Usually, this is not necessary because Domain users do not see the name of the data source. However, if you select a new data source for the Domain, the name in the design does not change automatically. In this situation, you typically change the name in the design to match the new data source.
If the database changes servers, you need to create a new data source object and use it to replace the previous one in the Domain. To change the data source, select a new one, and click OK to apply the changes.
If the database supports schemas, such as PostgreSQL, Oracle RDBMS, or virtual data sources, click Select Schemas at the bottom of the Manage Data Source dialog box to choose among available schemas in the data source. The tables in the schemas that you choose appear in the Data Sources panel.
6.5.3 Derived Tables TabYou create a derived table in a Domain by first building a custom query using the objects you selected on the Tables tab. Because Domains are based on JDBC and JNDI data sources, you write the query in SQL. You run the query, and then select columns from the query result for use in the Domain design.
Figure 6-22 Manage Data Source Dialog Box of the Tables Tab
When you change the data source, previous settings in the Domain Designer that do not conform to the new data source are lost without prompting. Before you change the data source of a Domain, copy the Domain as described in section 8.7, “Copying a Domain,” on page 232. For more information about switching the data source, see section 8.8, “Switching the Data Source of a Domain,” on page 232.
The Data Source panel shows columns that have a supported type listed on page 206. If the data source has special datatypes such as CLOB or NVARCHAR2, or if you access synonyms on an Oracle database, you need to configure the server to recognize them. See the configuration chapter in the JasperReports Server Administrator Guide.
169
JasperReports Server User Guide
To define a derived table:1. Type a name for the table in the Query ID field.2. Enter a valid SQL query in Query. The query may refer to any table or column in Available objects. Only queries that
begin with the select statement are allowed. Do not include a closing semi-colon (;).
3. When the query is complete, click Run Query to test it and choose the list of columns in the result.4. By default, all columns in the result are selected. Use Ctrl-click to change the selection. If you want only a few columns
out of many, it is easier to specify the column names in the SELECT clause of the query.
5. Click Save Table to add the derived table to Available objects. A distinctive icon, identifies it as a derived table.
6.5.4 Joins TabJoins create associations between tables so that their rows may be presented together in the same report. Multiple joins associate columns across many tables to create powerful data visualizations when used in reports. The number of tables and joins in the Domain depends on your business needs, as described in section 6.1.1, “Domain Use Cases,” on page 148. The server supports the four most common join types, all based on equality between values in each column.
To join tables for the Domain, use the Joins tab. On the Joins tab, the list of selected and derived tables is duplicated in the Left Table and Right Table panels. Expand tables in both panels, select a column in each table having the same logical meaning and compatible formats, then click a join icon:
Join Inner – The result contains only rows where the values in the chosen columns are equal. In the support case example in section 6.2, “Example of Creating a Domain,” on page 150, the result of an inner join contains only support cases that have been assigned to a support engineer.
Join Left Outer – The result contains all the rows of the Left Table, paired with a row of the Right Table when the values in the chosen columns are equal or contain blanks. If the support cases are in the Left Table of the example, the result of a left outer join contains all support cases even if they do not have an assigned engineer.
Join Right Outer – The result contains all the rows of the Right Table, paired with a row of the Left Table when the values in the chosen columns are equal or contain blanks. If the users are in the Right Table of the example, the result of a right outer join contains all the users and the support cases assigned to each engineer, if there are any. In this example, a user might also appear several times if different support cases refer to the same support engineer user ID.
Full Outer Join – The result contains all rows from both tables, paired when the joined columns are equal, and filled with blanks otherwise.
The new join appears in All Joins | Joins on Selected Table panel.
In order to create a join between two tables, each table must have a column with the same meaning. For example, a table with data for support cases has a column for the assigned engineer user ID that can be joined with the table of user data that has a user ID column.
In some cases, you may need to duplicate a table in order to join it several times without creating a circular join, or in order to join it to itself. You can also duplicate a table so it may be joined with different tables for different uses. Click the following icons above the Right Table to make a copy, change the name, or delete a table:
Copy – Copies the selected table and gives it a name with sequential numbering. The copy appears in both Left Table and Right Table.
The clauses in a query determine the structure and contents of the table returned by the query. For example, the WHERE clause may contain conditions that determine the rows of the derived table.
Expand the tables in Available objects. Double-click column names to add them to the query.
170

Creating Domains
Change ID – Changes the name of the selected table. The new name becomes the ID of the table throughout the Domain, and is updated everywhere it appears in the Domain Designer.Delete – Removes the table from both lists. If the deleted table was the only instance of a table, removing it on the Joins tab also removes it from the list of selected tables on the Tables tab.
You use the All Joins | Joins on Selected Table panel to see the defined joins, to remove a join, and to change the join type:All Joins – Lists all joins defined for the Domain.Joins on Selected Table – Lists only joins defined on the table you select, simplifying the view you have of many joins.Join Type – Changes the type of join. Remove – Removes the selected join definition from the list of joins and from the Domain design.
After creating joins, one or more join trees appear on the Calculated, Pre-Filters and Display tabs. For example, if you join tables A and B, B and C, then join tables D and E, the result is two join trees. Columns of table A and table C may appear in the same report because their tables belong to the same join tree. Tables A and D are said to be unjoined; their columns may not be compared or appear in the same report. Tables that are not joined appear individually along with the join trees.
6.5.5 Calculated Fields TabYou create a calculated field for the Domain by writing an expression that computes a value based on the data in another column or columns. In order for the value to be coherent, all columns that appear in the expression for a calculated field must be from the same join tree.
To create a calculated field:1. Select the Calculated Fields tab to begin defining a new calculated field.2. In Field Name, enter a short name for the calculated field. This name becomes the ID of the field in the Domain.
3. In Type, select a datatype for the calculated field. The expression you write must return a value of this type.
4. Enter an expression to compute the value of the calculated field.
To insert a reference to the value of another column:a. Expand the join-tree to find its table and double-click the column name.
The column name appears in the expression at the cursor, qualified by its table name.
b. Double-click the calculated field name to insert a reference to it into an expression.
5. Click Save Field to save the new calculated field. To clear the calculated field editor without saving, click Cancel.
After saving the calculated field, the Domain Designer validates the expression and warns you of any errors at this time. If there are errors, use the indications of the error message to help correct the expression. After validation, a calculated field appears in the table or join tree whose columns are used in the expression.
Later you can give the field a more meaningful label and full description.
Generally, this datatype matches the datatype of the columns in the expression. Therefore, you need to be familiar with the datatypes of columns in the data source.
Write expressions using the Domain Expression Language, fully described in section 8.2, “The DomEL Syntax,” on page 214.
Calculated fields may be used to compute other calculated fields.
Do not insert a column reference from unjoined trees because the Domain Designer does not validate expressions as they are written.
171
JasperReports Server User Guide
Calculated fields have a distinctive icon, , for easy recognition in Available Fields.
An expression that does not use any columns has a constant value. For example, you might create an integer field named Count that has the value 1 and later has a default summary function to count all occurrences. Constant fields are independent of join trees and automatically appear in a set called Constants.
To view, edit, or delete the definition of a calculated field:1. Cancel any input in the calculated field editor, then click the name of the field in Available Fields.2. Modify its name, its type, or its expression.3. Click OK to save the new definition, or click Cancel if you just viewed the field definition.
Click Delete Field to remove the calculated field from the Domain design.
6.5.6 Pre-filters TabA filter on one or more columns reduces data that is not needed or wanted in reports based on the Domain. For example, financial reports for the current fiscal year may need data from the previous fiscal year for comparison, but nothing earlier. It is always good practice to filter out irrelevant data to reduce the size of query results and processing time within the server.
Also, reports based directly on the Domain can define their own filters. Putting often-used filters in the Domain design avoids the need for each user to define filters independently and also reduces the chance for errors.
You can define a filter on a column that you do not plan to expose in the Domain. The filter remains active and only data that satisfies all defined filters appears to report users. For example, you can filter data to select a single country, in which case it doesn’t make sense for the column to appear in a report. However, you should clearly document such data restrictions in the description of the Domain, so that users understand what data is accessible through the Domain.
To define a filter:1. Double-click a column in Fields.
Alternatively, you can drag a column to the Filters panel. The column appears in the Filters panel with a list of conditional operators you can apply to that column.
2. Choose the comparison operator and filter value from the drop-down.In the Filters panel, the choice of comparison operators depends on the datatype of the column. For example, string types offer a choice of string search operators and date types offer time comparison operators. The filter value depends on the datatype and the comparison operator.
172

Creating Domains
For example, if you select a date column with the is between operator, the Filters panel displays two calendar icons for specifying a date range:
Text columns have both substring comparison operators such as starts with or contains and whole string matching such as equals or is one of. When you select a whole string matching operator, the panel displays a list of all existing values for the chosen column, retrieved in real-time from the database. If there are more than 50 values to display, use the
search controls to the left and click to narrow the list of available values. For multiple value matching, double-click the available values to select them. You may perform multiple searches and select values from each list of results.
3. Click OK to define the filter. To clear the condition editor without saving a filter, click Cancel.Filters shows all the filters you have defined. The overall filter applied to the data is the logical AND of all conditions you defined.
In Filters, click Change to modify a filter you defined. Click OK to save the changes. After selecting a row, you can click the Remove button to remove it from the list.
6.5.7 Display TabOn the Display tab, you specify which columns and calculated fields to expose through the Domain and how they appear. Typically, you select only columns that are useful in building or filtering reports, and omit other columns for simplicity. You also can modify display properties, such as the label and description of tables and sets and items for each specified column. Using meaningful labels and descriptions to help users of the Domain.
The Display tab contains three panels:Resources – Lists tables or join trees, depending on the view you choose.Sets and Items – Lists resources that appear to report creators who use the Domain. Properties – Displays and modifies properties of selected sets and item.
In the Resources panel you can view resources as either a Join Tree or a Table List: Join Tree – Displays joined, unjoined, and calculated tables for this Domain. Joined tables appear as join trees.
Figure 6-23 Filters Panel of the Domain Designer
To define a filter that compares two columns of the same datatype, Ctrl-click to select the second column, and drag the columns to the Filters panel. This action is possible only when two columns of the same type are selected.
173

JasperReports Server User Guide
Table List – Displays the selected and calculated tables for this Domain.
In the Table List view, you can use the Delete Table button to remove the selected table from the Resources panel and from the Domain design. The table no longer appears on the Joins tab, and any joins to the table are deleted. Use carefully.
To specify which columns and calculated fields are exposed to users of the Domain, you move resources from the Resources panel to the Sets and Items panel:
Set – A group of items independent of the tables in which the columns originate. Item – A column or calculated field, along with its display properties, that you want to appear in the Domain.
All items in a set correspond to columns in a join tree. Sets and items appear to report creators who use the Domain. Sets are optional. You can create a list of items outside of any sets. If you want to display only a few of the columns from the join tree, first create a new set in Sets and Items. Next, add items from the join tree in Resources.
To move a resource to Sets and Items, you can drag it from Resources and drop it in Sets and Items, or you can use one of the following buttons:
Add to Sets – Select a resource in Resources and click this icon to add it to Sets and Items. Tables are added as sets, and columns are added as items outside of any set.
Add to Selected Set – Select a destination set in Sets and Items, select a resource in Resources, and click this icon. Tables are added to Sets and Items as subsets, and columns are added as items within the destination set. You can also expand sets in Sets and Items and drag tables and columns from Resources to the destination set.
To create new sets or delete items, use the New Set and Delete buttons:
New Set – Creates a new set or subset in Sets and Items. If a set is not selected, clicking New Set creates a top-level set; otherwise, clicking New Set creates a subset.
Delete – Removes the selected set or item from Sets and Items. You can also double-click the object or drag and drop it in a blank area of Resources. Items removed from Sets and Items automatically reappear in Resources.
To move most of the tables and columns in Resources to Sets and Items:1. Double-click the join tree name in Resources, or drag-and-drop it from Resources to Sets and Items. All tables are created
as sets, and the columns are created as items within the sets. 2. Remove any unwanted sets or items individually from Sets and Items using the Delete Item button.
To change the order of items within a set in Sets and Items:1. Select the item.2. Reposition the item using one of the following buttons:
Move the selected set or item to the top. Move the selected set or item up. Move the selected set or down.
Move the selected set or item to the bottom.
You can also use these buttons to reposition sets within Sets and Items.
To move items and subsets into other sets:1. In Sets and Items, select the item or subset you want to move.2. Click Delete Item.3. In Sets and Items, select the destination set.4. In Resources, select the item or subset deleted from Sets and Items.
5. Click to add the item or subset from Resources to the destination set.
174

Creating Domains
Subsets always appear after the items in a set.
6.5.8 The Properties Panel
In the Properties panel on the Display tab, you can view, edit, and save properties of a set or item. You select an item in the Sets and Items panel, and click the Edit button. For example, open the Simple Domain example in the repository for editing in the Domain Designer. On the Display tab, select the Opportunities: Amount item, then click the Edit button in Properties. Set the Data Format and Summary Function, as shown in the previous figure. Click the Save button. The property settings determine how sets and items appear to users of the Domain.
The following table shows the properties and possible actions you can perform on the, depending on what you select in the other panels. For example, if you select the ID of a table in the Resources panel, you can view and edit the ID.
Figure 6-24 Table of Properties on the Display Tab of the Domain Designer
Panel Selection Properties Possible actions
Resources (Table List view)
Table ID of the tableName of the data source Name of the table in the data source
View and editView onlyView only
Resources(Table List view)
Field (column) ID of the fieldName of the data sourceName of the field’s table in the data sourceJava datatype of the field
View onlyView onlyView onlyView only
175

JasperReports Server User Guide
Labels and descriptions are visible to users of the Domain. Descriptions of sets and items appear as tooltips in the Ad Hoc Editor and help report creators understand their purpose. The internationalization keys are the property names of internationalized strings in locale bundles. Selecting an item in Sets and Items displays the internationalization keys, if there are any, for the item under Bundle Keys.
After defining the list of sets, subsets and items, refine the way the Domain appears to users by renaming and providing descriptions for sets, subsets, and items. Click Edit in the Properties panel to modify properties. The following table describes each of the properties in detail:
Resources(Join Tree view)
Table, field, or join tree
None None
Sets and Items Set Label of the setID of the setDescription of the setInternationalization keys for the set
View and editView and editView and editView and edit
Sets and Item Item Label of the itemID of the itemDescription of the itemInternationalization keys for the itemSource, table.fieldData formatDefault summary functionField or measure
View and editView and editView and editView and editView onlyView and editView and editView and edit
Property Appears On Description
ID Table, FieldSet, Item
An identifier used within the Domain. Default table and field IDs are based on the names in the data source, but you may change the ID of a table as long as it remains unique. Set and item IDs are a separate namespace in which each ID must be unique, although based on table and field IDs by default. The ID property value must be alphanumeric and not start with a digit.When editing a Domain that has been used to create Topics and reports, you should not change any IDs. For more information, see section 6.6.1, “Maintaining Referential Integrity,” on page 180.
Data Source Table, Field Alias of the data source for the selected field or table.
Source Table Table, Field Name of the selected table, or of the field’s table, in the data source. Does not change when the ID property of a table is modified.
Datatype Field Java datatype of the selected field.
Label Set, Item User-friendly name displayed in the Data Chooser and the Ad Hoc Editor.
Description Set, Item User-friendly description displayed as tooltip on the label in the Ad Hoc Editor. The description helps the report creator understand the data represented by this set or item.
Label KeyDescription Key
Set, Item Internationalization keys for the label and description properties; locale bundles associate this key with the localized text for the label or description. Keys may only use characters from the ISO Latin-1 set, digits, and underscores (_).
Source Item References the Domain names of the table and field associated with this item; the syntax is Domain_jointree.Domain_table.datasource_field.
Panel Selection Properties Possible actions
176

Creating Domains
From the Export menu you can choose to export the design or locale bundle for the Domain, as described in the next section.
6.5.9 Designer Tool BarThe tool bar buttons operate on the Domain design in its current state, regardless of which tab is selected.
Check Design – Validates the Domain as described in the next section. Export Design – Exports the XML design for the Domain. Use this menu item if you want to edit the XML in an external editor, for example to duplicate settings with copy-paste or to enter a complex formula. Exporting the XML design from the Domain Designer avoids having to write it from scratch. For more information, see section 8.1, “The Domain Design File,” on page 201.Export Bundle – Generates the internationalization keys and saves them to a Java properties file that serves as a template for the locale bundles. Use this menu item to create a template for the locale bundles after you have defined the sets and items on the Display tab. You can select a check box to automatically generate keys based on the set and item IDs. This option is visible only after you define localized sets or items. For more information, see section 8.5, “Locale Bundles,” on page 228.You can save time editing the properties for a large number of sets and items by using the exported XML file instead of using the properties table on the Display tab. For more information about saving and uploading XML, see section 8.1, “The Domain Design File,” on page 201. Before exporting a bundle, make sure the set and item IDs are finalized because they are used to generate the keys. The generated keys are added to the Domain design and appear in the table of properties. For more information about the internationalization keys, see section 8.5, “Locale Bundles,” on page 228.
6.5.10 Domain ValidationThe validation of a Domain ensures that all of its components are consistent. The Domain Designer checks the syntax of files when they are uploaded, but overall consistency must be checked when saving a new or edited Domain.
When you click Check Design, the Domain Designer performs the following validation. 1. Verifies that the tables and columns of the Domain design exist in the data source.
2. Verifies that all items in each defined set originate in the same join tree.3. Verifies that all items reference existing columns.4. Verifies that derived tables have valid SQL queries.5. If a security file has been uploaded, verifies that all items and sets in the security file exist in the Domain design.
If validation fails, the Domain Designer remains open and a message appears to help you correct the error. Make the necessary changes to the settings and save again. If the settings are in the uploaded files, edit the files and upload them again.
Validation is important because the Domain design may include derived table queries and calculated field expressions entered by the user.
Data Format Item Default numerical format (such as number of decimal places) for the item when used in a report.
Summary Function
Item Default summary function for the item when used in a report. Numerical items have functions, such as sum or average. Other items have either a function to count distinct values or to count all values.
Field or Measure
Item Designates whether the item is a qualitative value (field) or quantitative value (measure). By default, all numeric types are assumed to be measures, and all non-numeric items are plain fields. Use this setting to override the default. For more information, see section 6.1.2, “Terminology,” on page 148.
In special cases where you need to create a design before the data source is available, this step can be omitted by setting a parameter in the server configuration file. See the JasperReports Server Administrator Guide.
Property Appears On Description
177

JasperReports Server User Guide
Validation occurs at the following times:When opening the Domain Designer. This check detects any inconsistencies in Domain designs from uploaded files.When navigating from tab to tab under certain circumstances. This check detects problems on the tab where they occur.When changing the data source.When exporting the Domain design file.When clicking Check Design in the Domain Designer.When clicking OK to exit the Domain Designer.
Unless you click Check Design, no message appears when validation succeeds. When validation fails, however, a message appears to help you correct the error.
6.6 Editing a DomainYou can edit a Domain by changing, adding to, and deleting its components.
To edit a Domain:1. Log in to the server as an administrator and select View > Search Results.2. Locate the Domain.
a. Choose View > Search Results.b. In the Filters panel, under Types, click More choices. c. Click Domains.
3. Right-click an existing Domain and select Edit from the context menu.The Edit Domain page appears. This page is similar to the Add New Domain page documented in section 6.4, “Using the Add New Domain Page,” on page 165.
Use extreme caution when editing Domains that might have been used for reports and Domain Topics. A Domain specifies the data source for the Domain Topics and reports that are based on the Domain. These Domain Topics and reports might fail if you edit the underlying Domain; if you delete the underlying Domain, dependent reports fail.Before you edit a Domain, see section 6.6.1, “Maintaining Referential Integrity,” on page 180.
178

Creating Domains
4. In the Name field, change the display name of the Domain. 5. In the Description field, change the description of the Domain.6. In the Data Source field, browse to locate a new data source for the Domain. Because the Domain design relies
extensively on the data source, changing the data source only makes sense in certain cases. Examples include: Switching to a data source with a different schema but with the same tables, for example, when moving from staging to production. Switching from a regular data source to a virtual data source that contains the original data source. In this case, JasperReports Server attempts to locate the original data source inside the virtual data source and create the correct prefix. Derived tables and calculated fields are not preserved. Switching from a virtual data source to one of the underlying data sources. In this case, any resources that are not in the selected data source are deleted along with any dependent information, such as derived tables, joins, calculated fields, or labels that depend on the deleted resources.
If you change to a data source with a different database, the definitions in the Domain design are no longer valid and you are not able to save the Domain.
7. Under Domain Design, click Edit with Domain Designer. For instructions, see section 6.5, “Using the Domain Designer,” on page 167. Alternatively, select the Upload option, and browse to locate a Domain design file. You can import the XML file of the Domain design after exporting it and making modifications in an external editor. See also “Maintaining Referential Integrity” below if you need to remove items in the Domain.
Figure 6-25 Edit Domain Page
Before you switch the data source for a Domain, you should back up the Domain and export a Domain design file. See 8.8, “Switching the Data Source of a Domain,” on page 232 for more information.
179

JasperReports Server User Guide
8. To add or replace the security file or locale bundles for the Domain, click Add Security File or Add Locale Bundle in Optional Information. The Resources page is further documented in section 8.1, “The Domain Design File,” on page 201.
9. Click Submit to update the Domain. To close the Domain Designer without modifying the Domain stored in the repository, click Cancel.
After modifying a Domain, you must clear the Ad Hoc cache of all queries based on the Domain. This removes any data that was based on the old instance of the Domain and avoids inconsistencies in new reports. For instructions, see the JasperReports Server Administrator Guide.
6.6.1 Maintaining Referential IntegrityWhen editing an existing Domain, the user is responsible for maintaining the referential integrity between the items in the Domain and any Domain Topics or reports that have been created from the Domain. Referential integrity means that at the time a Domain Topic or report is opened or run, all the items that the Domain references are still defined in the Domain. If you modify a Domain by removing sets or items, you must be sure that no Domain Topics or reports are based on those sets or items. Even if the underlying tables and columns still exist in the database, the sets and items referenced in the Domain must still exist in the Domain.
Any report that references a deleted item no longer runs, nor can you open it in the Ad Hoc Editor again. A Domain Topic that references a deleted item causes errors when used in the Ad Hoc Editor. You can, however, open a Domain Topic for editing and remove references to deleted items. That action, however, allows only new reports to use the Domain Topic, and does not fix the broken reports based on the items deleted from the Domain Topic.
The granularity of referential integrity is at the individual set and item level. This means that changes to sets and items that are not used in a given report or Topic do not affect the report or Topic. For example, if you delete an item used by Topic A but not Topic B, then Topic A fails and reports based on Topic A that included the item fail. But Topic B and its reports are unaffected, as are any reports based on Topic A that did not include the deleted item.
6.6.2 Fixing Referential Integrity ProblemsGenerally, to maintain referential integrity, avoid deleting items from a Domain that reports need to use. Sometimes, removing an item or set from a Domain is unavoidable. For example, you included an item erroneously that exposes confidential data to unauthorized users, or the underlying database changes, making the item invalid.
In a typical scenario, an administrator or data analyst creates a Domain and many end-users create Topics and reports based on it. When deleting Domain items in such a situation, tell users beforehand to modify reports to prevent reports from using the item. Inevitably, a user fails to modify a report as requested, and needs to fix the broken report. The server provides a mechanism to simplify fixing the report. The user can replace the deleted item with a placeholder, open the report, and edit it, even after the original item has been removed.
The following procedure assumes a user created a report based on a Domain. The Domain is similar to the one described in section 6.2, “Example of Creating a Domain,” on page 150. The Domain exposes the accounts_opportunities table that contains no useful columns and is necessary only to join the accounts and opportunities tables. Unfortunately, some users were confused by the additional items exposed by the Domain, and used the date_modified item in their reports. You want to delete the accounts_opportunities table from Sets and Items, so it is no longer exposed to users.
To fix referential integrity problems:1. Locate the problematic Domain in the repository, right-click, and choose Edit. The Edit Domain page appears.2. On the Edit Domain page, click Edit with Domain Designer.
Domain items are identified by their IDs and the IDs of the sets in which they are located. Changing the ID of an item or moving it to a different set also makes it unavailable to any Topics and reports that referenced the ID. To change the name of an item or set, edit its label property, not its ID (see section 6.5.8, “The Properties Panel,” on page 175). Moving an item is considered the same as deleting it from its current location so it can be added elsewhere.
180

Creating Domains
3. In the Domain Designer, click the Display tab, and select the public_accounts_opportunities set in Sets and Items:
4. Click Delete Item. The Confirm dialog box appears, indicating that the item is in use and that a potential referential integrity problem exists. The message includes a link, See items that will be deleted, to the Detail dialog box, containing the items you are deleting from the Domain. Figure 6-27 shows the Confirm dialog box.
Figure 6-26 Deletion of Items in Use in Reports from a Domain
Figure 6-27 Indication of Referential Integrity Problem
181

JasperReports Server User Guide
5. Click See items to be deleted. For each deleted item, the Detail window lists the item label, the set and items IDs as a path, and the datatype of the item:
6. Close the Detail dialog box and click OK in the Confirm dialog box. 7. Click the Calculated Fields tab.
8. Enter a field name, type, and an expression that returns a constant value of the same type as the deleted item, as shown in Figure 6-29, and click Save Field.
Figure 6-28 List of Items to Be Deleted
The date_modified item has the ID date_modified1, is in the accounts_opportunities set, and is of the type java.sql.Timestamp.
Because a calculated field is a custom column of a user-selected type, it can serve as a placeholder. The value of the custom column is irrelevant, but it needs to be recognized as a placeholder when it appears in a report.
Figure 6-29 Creation of Calculated Field as Placeholder for a Deleted Item
182

Creating Domains
9. Click the Display tab.
10. In Sets and Items, click New Set to create the placeholder set. 11. In Resources, expand the list of Constants and select ZZdate_modified:
12. Click to add the ZZdate_modified to the new set.
13. In Sets and Items, select the placeholder set, newSet1. 14. In Properties, click Edit and change these properties:
15. In Sets and Items, select ZZdate_modified. 16. In Properties, click Edit and change these properties:
The ZZ prefix in Name distinguishes the placeholder from other columns in the Domain. The value in Type must match the datatype of the deleted item, in this case a timestamp. For information about calculated field datatypes, see section 8.2.1, “Datatypes,” on page 214.
A placeholder item must be located in placeholder set to mimic the structure of the deleted item, and generally, in exactly the same path of nested sets as the original item. You deleted the accounts_opportunities set, so you need to create a set for the placeholder item.
Figure 6-30 Calculated Field Set Up as a Placeholder
Property New ValueID accounts_opportunities Label ZZDeletedSet
Description Placeholder for deleted set
Property New ValueID date_modified1 Label ZZDeletedField
Description Placeholder for deleted item
Distinguishing the placeholders from real items by using the ZZDeletedSet and ZZDeletedField labels discourages their use in building new Ad Hoc views. The IDs, although invisible to users, must be identical to those of the deleted item and set, so the server can open and run the view.
183

JasperReports Server User Guide
Figure 6-31 shows the modified properties for the placeholder item.
17. Click OK in the Domain Designer and then Submit on the Edit Domain page.
Alternatively, you can edit the XML design file of a Domain to fix referential integrity problems. Conceptually, the modifications are the same as described in this procedure, but the order is slightly different.
To fix referential integrity problems in the XML design file of a Domain:1. Instead of deleting the item, first create the constant calculated field. You can do this in the Domain Designer even before
exporting the design file. You must be familiar with the design file syntax to create the calculated field with the correct type and expression, as described in section 8.1.3, “Structure of the Design File,” on page 203.
2. Next, locate the item definition and change its resourceID so that it references the newly created calculated field. This removes the reference to the unwanted column, and replaces it with an item that references the placeholder field.
3. Update the other properties of the item and its enclosing set, using the values shown in Figure 6-31. For more information, see section 8.1.3.6, “Representing Sets and Items in XML,” on page 210.
4. Save the design file and upload it, as described in section 8.1.4, “Uploading a Design File to a Domain,” on page 213.
Figure 6-31 Modification of ID Properties to Match the Deleted Item
184

Accessing Reports and Domains from iReport
CHAPTER 7 ACCESSING REPORTS AND DOMAINS FROM IREPORT
iReport Designer includes JasperReports Server and Domain plug-ins. Using the JasperReports Server Plug-in, you move reports between iReport and JasperReports Server. The server plug-in uses web services to interact with the server. Some tasks you can perform using the server plug-in are:
Browse the repository on the server from iReport.Add reports and subreports to the repository from iReport.Drag and drop images and other resources from the repository to the iReport Designer tab.Add and delete folders and resources on the server from iReport. Resources include images, fonts, JRXML files, JAR files, datatypes, and input controls.Modify resource properties on the server from iReport.Link input controls to reports on the server.Import and export data sources (JDBC, JNDI, and JavaBean).Download, edit, and upload JRXML files. Connect to multiple servers to facilitate access both test and production environments.
Using the Domain Plug-in, you can create a report in iReport based on a Domain in JasperReports Server.
This chapter contains the following sections:Plug-in RequirementsConnecting to the Server from iReportCreating a Report Unit in the Repository from iReportManaging Resources in the Repository from iReportEditing a Report in the Repository from iReportRunning a Report from iReportUsing the Domain Plug-inCreating and Uploading Chart Themes to the Server
This section describes functionality that can be restricted by the software license for JasperReports Server. If you don’t see some of the options described in this section, your license may prohibit you from using them. To find out what you're licensed to use, or to upgrade your license, contact Jaspersoft.
185
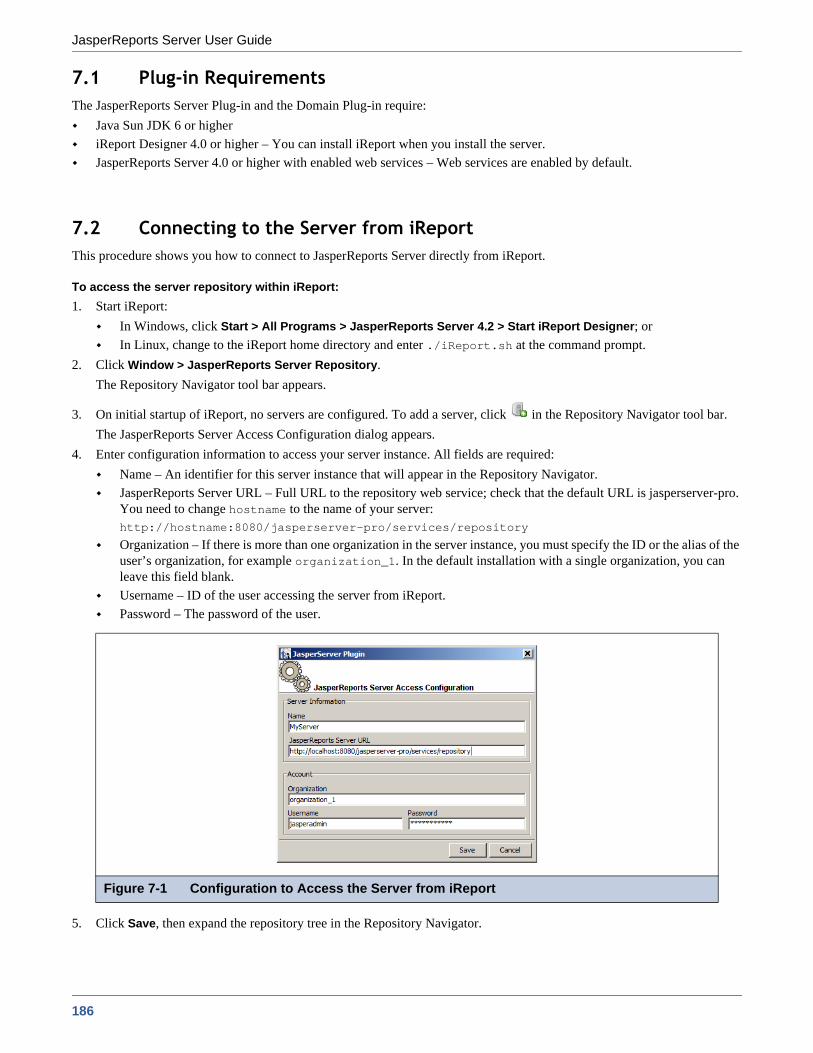
JasperReports Server User Guide
7.1 Plug-in RequirementsThe JasperReports Server Plug-in and the Domain Plug-in require:
Java Sun JDK 6 or higheriReport Designer 4.0 or higher – You can install iReport when you install the server.JasperReports Server 4.0 or higher with enabled web services – Web services are enabled by default.
7.2 Connecting to the Server from iReportThis procedure shows you how to connect to JasperReports Server directly from iReport.
To access the server repository within iReport:1. Start iReport:
In Windows, click Start > All Programs > JasperReports Server 4.2 > Start iReport Designer; orIn Linux, change to the iReport home directory and enter ./iReport.sh at the command prompt.
2. Click Window > JasperReports Server Repository.The Repository Navigator tool bar appears.
3. On initial startup of iReport, no servers are configured. To add a server, click in the Repository Navigator tool bar.The JasperReports Server Access Configuration dialog appears.
4. Enter configuration information to access your server instance. All fields are required:Name – An identifier for this server instance that will appear in the Repository Navigator.JasperReports Server URL – Full URL to the repository web service; check that the default URL is jasperserver-pro. You need to change hostname to the name of your server:http://hostname:8080/jasperserver-pro/services/repository
Organization – If there is more than one organization in the server instance, you must specify the ID or the alias of the user’s organization, for example organization_1. In the default installation with a single organization, you can leave this field blank.Username – ID of the user accessing the server from iReport. Password – The password of the user.
5. Click Save, then expand the repository tree in the Repository Navigator.
Figure 7-1 Configuration to Access the Server from iReport
186

Accessing Reports and Domains from iReport
You can add multiple servers to the Repository Navigator. Servers configured for iReport 3.1 versions of the plug-in and later are compatible with the iReport 4.0.0 or later version of the plug-in. You may experience problems if you connect to incompatible servers.
7.3 Creating a Report Unit in the Repository from iReportTo add a new report unit, you need a JRXML file, which you can create in iReport beforehand. A report unit has a main JRXML file, a data source, input controls (zero or more), and resources (zero or more).
To create a report unit in the repository:1. In the Repository Navigator, shown in Figure 7-2, right-click a parent folder for the new report and click Add >
JasperServer Report. For example, add the report unit to the Reports folder.The ReportUnit Wizard appears.
2. In the Naming step, enter an ID, for example, report_unit_example. No spaces allowed.3. In the Name field, enter a meaningful name. For example, enter Report Unit Example. This name will appear in the
repository on the server, and consequently, in the Repository Navigator.4. In the Description field, briefly describe the report unit. The description will appear in the repository on the server and
help users find the report they need.5. Click Next. 6. In the Main JRXML step, locate the main JRXML file in the repository or on your hard drive. You can also specify a
report that you have open in iReport. For example, assume you have a report file named report1.jrxml on your hard drive that you already opened the report in iReport. Select Locally Defined, then click the Get source from current opened report button.
7. Click Next. 8. In the Locate Data Source step, select one of the following options:
From the repositoryLocally DefinedDon’t use any data source
For this example, select Locally Defined.
Figure 7-2 Server Repository as Seen from iReport
The visibility and access to resources in the Repository Navigator depend on the organization and permissions of the user.
187

JasperReports Server User Guide
9. Click the Edit local datasource button.The Data Source dialog appears.
10. In the Data Source dialog:a. On the General tab, enter a unique ID. No spaces allowed. For example, enter MyFoodmartDS.b. In Name, enter a meaningful name. This name will appear in the repository on the server. For example, enter
FoodmartDS.c. On the Data Source Details tab, select a data source type, for example JDBC Data Source, and fill in the required
details: Driver – org.postgresql.DriverURL – jdbc:postgresql://localhost:5432/foodmartUser name (for the database) – postgresPassword (for the database)
Figure 7-3 shows typical details for a JDBC data source.
d. Click Save.11. In the ReportUnit wizard, click Finish.
If you defined the JDBC data source in the currently opened report, you can click the Import from iReport button to help provide these details. Select the data source from the drop-down that you specified during report design. Fill in the port number for the database (5432 for example), and click OK
Figure 7-3 Data Source Details
If the report unit doesn’t appear in the Repository Navigator, right-click the server name (MyServer in Figure 7-4) and select Refresh from the context menu.
188

Accessing Reports and Domains from iReport
12. In the Repository Navigator, expand the Reports folder. The report unit, Report Unit Example, appears:
7.3.1 Adding an Image and Subreport to the Report UnitA subreport is a JasperReport that’s embedded within another report: the master report. As the Master report executes, each time the server encounters a subreport element it executes the subreport. The server embeds the subreport content into the output of the Master report. Subreports can process records from a query different from the Master report's query.
To add an image from the repository to a report unit:1. Continuing the previous example, expand the Images folder in the Repository Navigator, select the JR Logo image.2. Drag the image to the Designer. Drop the image in the page footer band of the open report, report1.jrxml.
The plug-in adds the image element to the report, setting an expression in repo: syntax, which refers to the location of the image in the repository.Figure 7-5 shows the selected image file in the Repository Navigator, the image element in the page footer band of the report, and the location expression at the top and bottom of the properties list.
Figure 7-4 The New Report Unit in the Repository Navigator
Figure 7-5 A Repository Image Added to a Report
189
JasperReports Server User Guide
To add a subreport to a report unit:1. In iReport, assuming report1.jrxml is still open from the previous procedures, perform these steps:
a. From the palette, drag a Subreport element to the detail band of the report in the Designer.The Subreport wizard appears.
b. On the Subreport page of the wizard, select one of these options:Create a new reportUse an existing reportJust create a subreport element
For this example, assume you have a pre-existing and compiled JRXML file named subreport.jrxml. Select Use an existing report.
c. Browse to the jrxml version of the report, subreport.jrxml. d. Select the .jrxml file. Click Open, then Next.
The Connection expression page of the Subreport wizard appears, offering these options:Use the same connection as the master reportFills the master report when the subreport is JDBC-based. The JDBC connection is passed to the subreport for execution.Use another connectionSets up a different JDBC connection.Use a JRDatasource expressionUses a JRDataSource object to fill the subreport. You will need to write an expression capable of returning a JRDataSource object.Use an empty data sourceSets the data source expression to new JREmptyDataSource(). This expression creates a special data source that provides a single record with all the field values set to null. Useful for displaying static content in a subreport.Don’t use any connection or data sourceUsed for displaying static content in a report.
e. Select the first option, Use the same connection used to fill the master report. Click Next. The Parameters page of the subreport wizard appears.
f. In this example, there are no parameters. On the Parameters page, click Next.The Subreport expression page of the wizard appears.
g. On Subreport expression page of the wizard, select one of these options:Store the directory name in a parameterIf you’re creating reports to run or preview in iReport, choose this option. Use a static absolute path referenceIf you’re creating reports to run or preview in iReport, choose this option.
Figure 7-6 shows the Subreport expression page.
If the report has parameters, you select the Expression drop-down next to the name of the parameter, the scroll and select the field that contains the parameter.
190

Accessing Reports and Domains from iReport
For this example, choose the Store the directory name in a parameter option, then click Finish.
2. Stretch the subreport element until it’s wide enough to fill the band.3. Select the subreport in the master report’s Report Inspector and edit the size of the subreport:
a. In the properties panel, edit the print margins. Set the Left and Top properties to zero because a subreport is meant to be a portion of a page, not an entire document.
b. Set the Height property to a very small value, such as 1 pixel. When the subreport element is filled with subreport data, it dynamically expands in height, so you can set its height to a very small value to leave room in the band for other elements.
4. In iReport, click File > Save to save changes to the report.5. Synchronize the changes you made in iReport to the Report Unit Example on the server by replacing its Main
JRXMLwith the JRXML you just altered in iReport: a. In the Repository Navigator, expand the Report Unit Example folder.b. Right-click the Main JRXML, and select Replace with current document.
The JRXML validation dialog appears. Figure 7-7 shows the JRXML validation dialog.
Figure 7-6 A Subreport Expression
Figure 7-7 JRXML Validation
191

JasperReports Server User Guide
The server detects that the report unit includes a subreport, and the subreport needs a different expression. In iReport, subreports need this expression:
$P{SUBREPORT_DIR} + reportName.jasper In the server, subreports need this expression:
repo : reportName expression c. If the Subreport resource is not selected, click the checkbox to select it, then click continue to upload the subreport
and the proposed expression to the repository.
A message confirms that the JRXML was updated. d. Click OK.
In the Repository Navigator, the subreport jrxml appears in the Resources folder of the Report Unit Example.6. To run the report from iReport:
a. Right-click the Report Unit Example folder in the Repository Navigator.
b. Select Run JasperServer Report from the context menu.7. To run the report in the server, first you need to link a data source to the report:
a. Log into the server.b. Click View > Repository. Select the report unit in the repository.c. Click Edit.d. On the Set Up page, upload report1.jrxml.e. On the Data Source page, link a data source to the report. For example, select the following data source from the
repository:/Analysis Components/Analysis Data Sources/FoodmartDataSourceJNDI
7.4 Managing Resources in the Repository from iReportWhile creating reports that you intend to store in the repository, you also need to create and manage the resources associated with them, such as images, JARs, JRXML files, property files for localized reports, input controls, datatypes, lists of values, style templates (JRTX), and data sources. If you’re maintaining existing reports, you may need to access, modify, and save changes to existing resources. You can also modify the location, name, or description of the repository folders.
To add, modify, or delete resources to the repository from iReport:1. If the Repository Navigator is not open, click Window > JasperReports Server Repository. 2. To add a resource to the repository, right-click a folder, select Add, and then select the type of object you want to add.
3. To change the location of a resource in the repository, locate the object, then drag-and-drop it to the new location.Or, perform the following steps:a. Right-click the object and select Copy or Cut. Or use the keyboard shortcuts: Ctrl-C and Ctrl-X, respectively. b. Locate the destination, right-click, and select Paste, or use the keyboard shortcut Ctrl-V. When cutting the object, it is not removed from its original location until pasted in the new location.
When you upload a report to the server that uses the repo: syntax to refer to resources in the repository, the server prompts you to locate the resources for JRXML validation. For more information, refer to the JasperReports Server Ultimate Guide.
You cannot run a subreport alone on the server; you must run the entire report unit.
If you choose to add any item other than a JasperReport, a dialog for entering the location and other information about the object appears. If you choose to add a JasperReport, a wizard guides you through the process.
192

Accessing Reports and Domains from iReport
4. To delete a resource from the repository, locate the object, right-click it, and select Delete. You must confirm your action to prevent accidental deletions.
5. To modify a resource, find its folder in the Repository Navigator, then right-click the resource and select Properties. In the Properties dialog appears. The number of tabs in the dialog depends on the type of resource:
6. On the General tab, view the object’s repository ID, name, and description.
Tabs other than General, if there are any, contain controls that are specific to each type of resource. File-based resources have a Resource tab.
7. On the Resource tab, check Replace the resource with this file, browse to another image on your hard drive, and click Save to replace the image on the server with the image on your hard drive.
8. Click Export File, and then Save to download a resource descriptor to your hard drive. For example, in the Repository Navigator, you can replace a resource on one server with a resource on another: Connect to both servers using the plug-in, export an image from server 1, open image properties on server 2, browse to the file you exported from server 1.
9. Change an input control from the Input Control Details tab:
10. Click Save in the Properties dialog box to make the changes effective in the repository.
7.5 Editing a Report in the Repository from iReport
In the Repository Navigator, the icon means a report unit, and means a JRXML file. When you work with a JRXML file in the Repository from iReport, iReport operates on a copy of the file. You need to upload the JRXML file to put it back into the repository when finished.
To edit a JRXML file in the Repository from iReport:1. In the Repository Navigator, right-click the JRXML file in the report unit and select Open in Editor.
The JRXML from the repository is stored locally in the <USER_HOME>/.ireport/jstmp directory. This directory is never automatically cleared.
If you are logged in as an administrator, you can modify property values and save them back to the Repository.
Figure 7-8 Properties of an Input Control Resource
193

JasperReports Server User Guide
The JRXML appears in the Designer window.2. Edit the file, either in the Designer or in the XML editor. For information about adding images or subreports to the
JRXML file, see section 7.3, “Creating a Report Unit in the Repository from iReport,” on page 187.3. To save the file and upload it to the repository, right-click the file in the repository tree and click Replace with Current
JRXML. A message confirms the operation’s success.
To edit a Report Unit in the Repository from iReport:1. In the Repository Navigator, right-click the report unit and select Properties.2. On the General tab, change the repository name and description.3. On the Main Report and Data Source tab, you can change the JRXML file for the report, either by selecting one from the
repository, or uploading one through iReport. Click Current Report to use the JRXML currently being edited in iReport. Similarly, you can select the data source from the repository or from iReport. See Figure 7-9 on page 194.
4. On the Other tab, you can set display properties for any input controls. 5. On the JSP fields you can modify the appearance of the controls.
The Controls Layout determines where they appear.
6. Click Save to make the changes effective in the repository.
7.6 Running a Report from iReport
To run a report on the server using all the export options set in iReport:1. Right-click a report in the repository tree and click Run JasperServer Report. 2. If the report has input controls, the Report Parameters dialog prompts you for values:
The report is displayed in the report viewer. If the report does not appear, look for errors or messages in Report Problems at the bottom of the iReport console.
Figure 7-9 Properties of a Report Unit in iReport
194
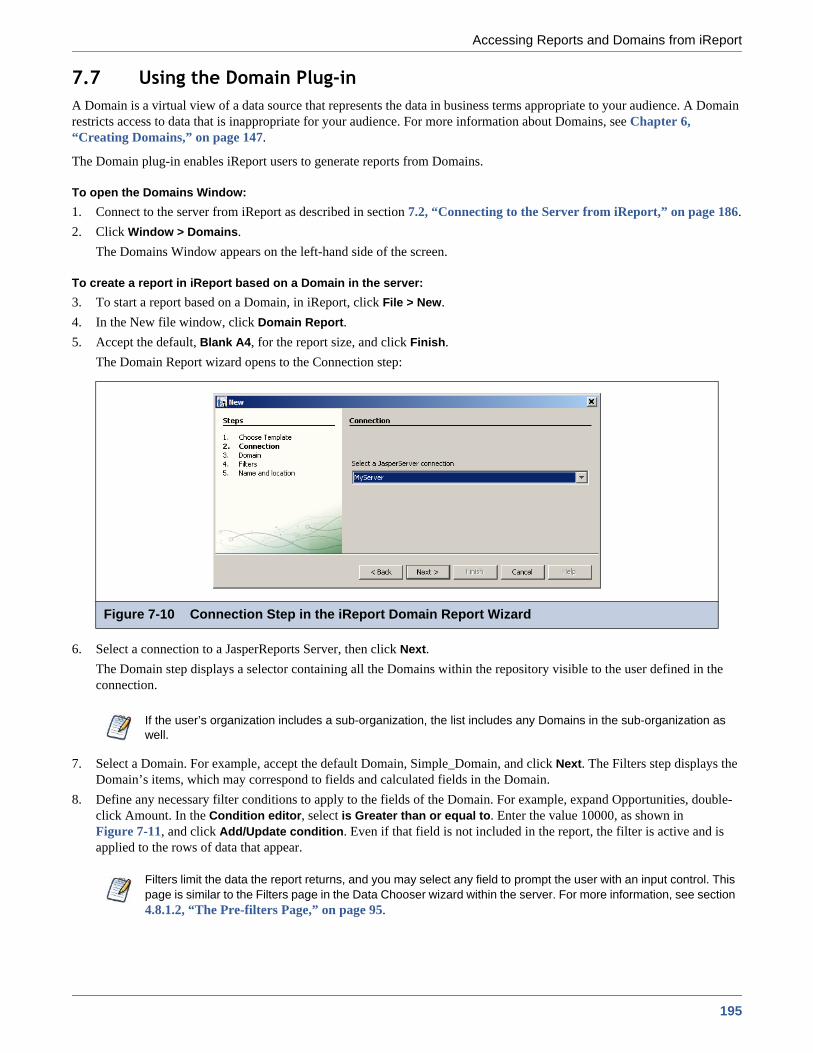
Accessing Reports and Domains from iReport
7.7 Using the Domain Plug-inA Domain is a virtual view of a data source that represents the data in business terms appropriate to your audience. A Domain restricts access to data that is inappropriate for your audience. For more information about Domains, see Chapter 6, “Creating Domains,” on page 147.
The Domain plug-in enables iReport users to generate reports from Domains.
To open the Domains Window:1. Connect to the server from iReport as described in section 7.2, “Connecting to the Server from iReport,” on page 186.2. Click Window > Domains.
The Domains Window appears on the left-hand side of the screen.
To create a report in iReport based on a Domain in the server:3. To start a report based on a Domain, in iReport, click File > New. 4. In the New file window, click Domain Report.5. Accept the default, Blank A4, for the report size, and click Finish.
The Domain Report wizard opens to the Connection step:
6. Select a connection to a JasperReports Server, then click Next.The Domain step displays a selector containing all the Domains within the repository visible to the user defined in the connection.
7. Select a Domain. For example, accept the default Domain, Simple_Domain, and click Next. The Filters step displays the Domain’s items, which may correspond to fields and calculated fields in the Domain.
8. Define any necessary filter conditions to apply to the fields of the Domain. For example, expand Opportunities, double-click Amount. In the Condition editor, select is Greater than or equal to. Enter the value 10000, as shown in Figure 7-11, and click Add/Update condition. Even if that field is not included in the report, the filter is active and is applied to the rows of data that appear.
Figure 7-10 Connection Step in the iReport Domain Report Wizard
If the user’s organization includes a sub-organization, the list includes any Domains in the sub-organization as well.
Filters limit the data the report returns, and you may select any field to prompt the user with an input control. This page is similar to the Filters page in the Data Chooser wizard within the server. For more information, see section 4.8.1.2, “The Pre-filters Page,” on page 95.
195
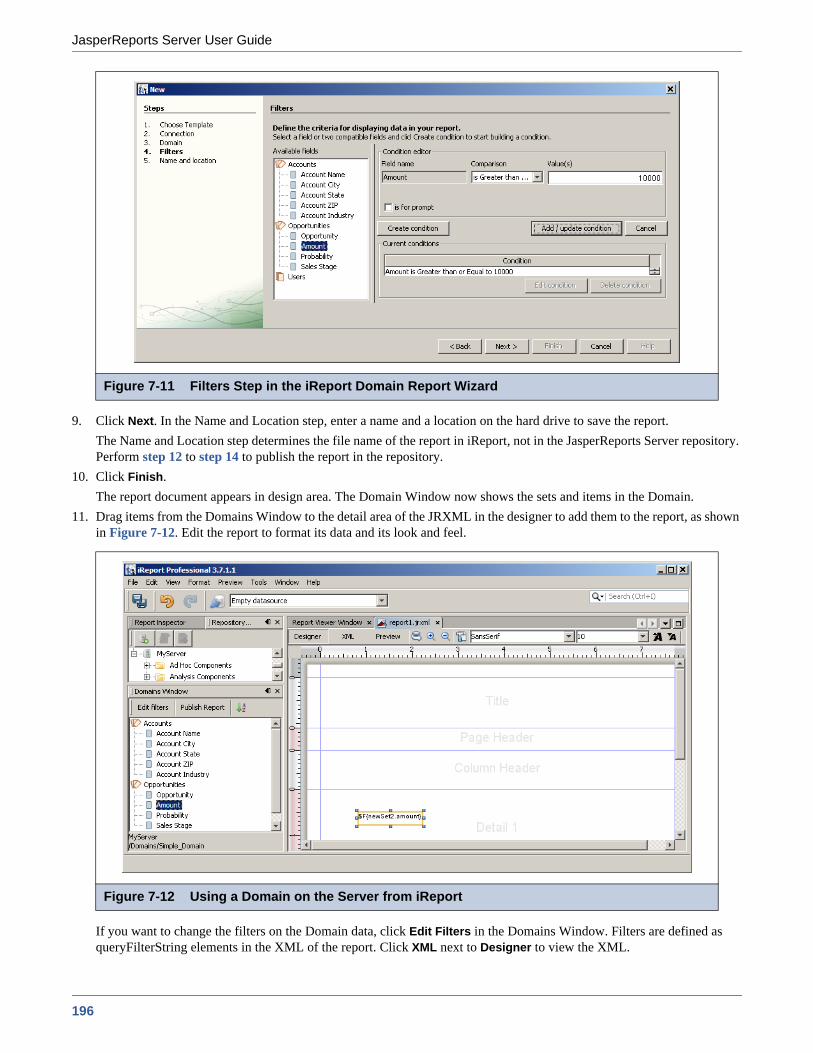
JasperReports Server User Guide
9. Click Next. In the Name and Location step, enter a name and a location on the hard drive to save the report.The Name and Location step determines the file name of the report in iReport, not in the JasperReports Server repository. Perform step 12 to step 14 to publish the report in the repository.
10. Click Finish.The report document appears in design area. The Domain Window now shows the sets and items in the Domain.
11. Drag items from the Domains Window to the detail area of the JRXML in the designer to add them to the report, as shown in Figure 7-12. Edit the report to format its data and its look and feel.
If you want to change the filters on the Domain data, click Edit Filters in the Domains Window. Filters are defined as queryFilterString elements in the XML of the report. Click XML next to Designer to view the XML.
Figure 7-11 Filters Step in the iReport Domain Report Wizard
Figure 7-12 Using a Domain on the Server from iReport
196
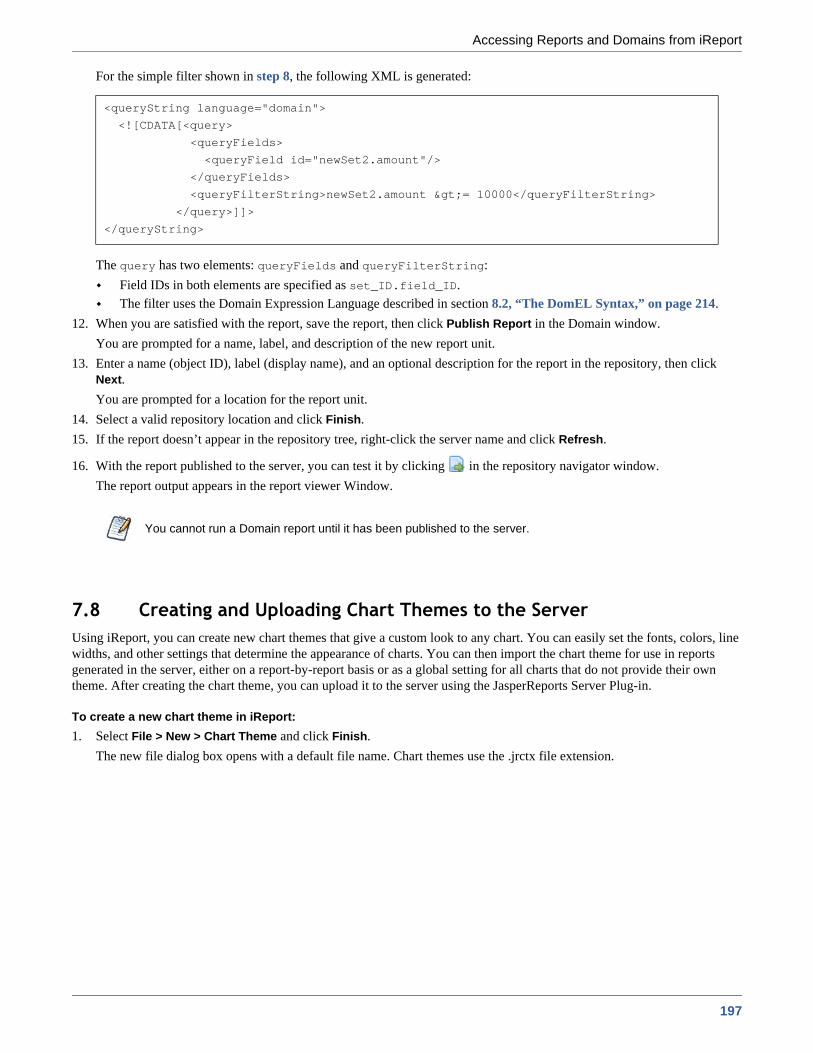
Accessing Reports and Domains from iReport
For the simple filter shown in step 8, the following XML is generated:
The query has two elements: queryFields and queryFilterString:Field IDs in both elements are specified as set_ID.field_ID. The filter uses the Domain Expression Language described in section 8.2, “The DomEL Syntax,” on page 214.
12. When you are satisfied with the report, save the report, then click Publish Report in the Domain window.You are prompted for a name, label, and description of the new report unit.
13. Enter a name (object ID), label (display name), and an optional description for the report in the repository, then click Next.You are prompted for a location for the report unit.
14. Select a valid repository location and click Finish.15. If the report doesn’t appear in the repository tree, right-click the server name and click Refresh.
16. With the report published to the server, you can test it by clicking in the repository navigator window.The report output appears in the report viewer Window.
7.8 Creating and Uploading Chart Themes to the ServerUsing iReport, you can create new chart themes that give a custom look to any chart. You can easily set the fonts, colors, line widths, and other settings that determine the appearance of charts. You can then import the chart theme for use in reports generated in the server, either on a report-by-report basis or as a global setting for all charts that do not provide their own theme. After creating the chart theme, you can upload it to the server using the JasperReports Server Plug-in.
To create a new chart theme in iReport:1. Select File > New > Chart Theme and click Finish.
The new file dialog box opens with a default file name. Chart themes use the .jrctx file extension.
<queryString language="domain">
<![CDATA[<query>
<queryFields>
<queryField id="newSet2.amount"/>
</queryFields>
<queryFilterString>newSet2.amount >= 10000</queryFilterString>
</query>]]>
</queryString>
You cannot run a Domain report until it has been published to the server.
197

JasperReports Server User Guide
2. Enter a name and location and click Finish.Alternatively, open an existing chart theme file with the .jrctx extension.The chart theme editor appears in the Designer window.
3. Maximize and pin, if necessary, the following windows, which you use together to work with the chart theme:Template Inspector on the left – Select a category of properties.Properties on the right – View and change properties.
If the windows are not open, select Window > Template Inspector and Window > Properties.These windows are shown in Figure 7-14 on page 199.The available options are based on the JFreeChart library used to generate charts. iReport supports only the most common options provided by JFreeCharts.
4. Select each category in the template inspector and review the available options, which appear in the properties window to the right.
5. Select a property to change its value. Depending on the nature of the property, you might type text, select a color, check or clear a check box, or select a value from a drop-down. As you update the chart theme, the Designer shows your changes. For example, change the Series Color property in the Plot category to set the color of the data series in the chart.
6. Select different chart types from the drop-down.
Figure 7-13 New Chart Theme in iReport
iReport supports only the most common options provided by JFreeCharts.
Testing the theme with different chart types is critical if you are creating a theme for use with many reports, such as a corporate chart theme.
198

Accessing Reports and Domains from iReport
7. To view the XML that defines the chart theme’s appearance, click the XML tab.
8. When you are satisfied with the chart theme, click File > Save to save the chart theme.This saves the report to your local hard drive.
9. In the template inspector, right-click Chart Theme, and click Export as Jar from the context menu.
10. Enter the name of the theme and the name of the JAR file when prompted to identify the chart theme.The chart theme name is the text that appears in the Chart Theme drop-down in iReport’s properties list. If you don’t want this theme to be available in iReport for some reason, clear the check box.
11. Leave the box checked if you want the JAR to be placed on iReport’s classpath.12. Click Export.
The chart theme is exported. The theme can be used at the report or server level in JasperReports Server. For more information, refer to the JasperReports Server Administrator Guide.
Figure 7-14 Chart Theme Editor in iReport
Figure 7-15 Exporting a Chart Theme
In iReport, you can upload the chart theme to the server using the JasperReports Server plug-in; right-click the folder in the repository where the theme should reside, and select Add > JAR Archive.
199

JasperReports Server User Guide
200
Advanced Domain Features
CHAPTER 8 ADVANCED DOMAIN FEATURES
The security file and locale bundle are optional information in a Domain. When included, these options provide data access permissions and localized strings for reports based on a Domain. The data security and localized strings are defined in external files that Domain creators must upload to the Domain. Security and locale options take effect in the Ad Hoc Editor when creating the report and in the final output when running the report.
The Domain design can be exported to an XML file and edited outside of JasperReports Server. This gives Domain creators an alternative to using JasperReports Server to modify the design and simplifies sharing of Domains between systems. This chapter documents the syntax for the security file and locale bundle and discusses the important considerations in writing or modifying file contents. The discussion begins with the Domain design file because the security file and locale bundles rely on certain values it contains.
For a definition of the terms column, field, and item as used in Domains, see section 6.1.2, “Terminology,” on page 148.
This chapter contains the following sections:The Domain Design FileThe DomEL SyntaxSecurity and Locale Information for a DomainThe Domain Security FileLocale BundlesInternationalized Databases
8.1 The Domain Design FileThe design of a Domain specifies the selection of tables in the data source, any derived tables, joins, calculated fields, and filters, as well as how those elements appear to users. In JasperReports Server, the Domain design can be created interactively through the Domain Designer, however there is also an XML file format for exporting and uploading the settings. The text file containing a Domain design represented in XML is called a design file.
The XML in a design file is a hierarchy of elements and attributes on those elements that specifies all the settings in the Domain. The elements and attributes are defined by an XML schema provided in an XSD file. In addition, there are constraints on a Domain design that are not expressed in the XML schema. A design file can be modified or written from scratch in an editor and uploaded to the server, as long as it conforms to the XML schema and the design constraints.
XML is not the native format of the Domain design. The XML file is only a representation from which the design can be inferred. A design has additional constraints that are not mapped in the XML format.
201
JasperReports Server User Guide
There are several common use cases for working with design files:Completing the elements of a new design. Use the Domain Designer to define as much of the design as possible, then export the design file and add your handwritten code to the exported file. For example, you can enter the SQL query for a derived table or complex expressions for a calculated field. Working with very large Domains. The Domain Designer makes it easy to select all tables and columns and expose them as sets and items, but editing the labels and descriptions of dozens of items is faster when they appear in a single design file.Making repetitive changes to an existing Domain design. If the database changes or you want to move a design file to a different system, you may need to edit each table or item in the design in the same way. Using search-and-replace on an external editor does this quickly.Creating locale bundles and security files as described in the other sections of this chapter. These optional files refer to elements of the Domain design, and it is often more convenient to copy-paste them between external files.Creating a Domain design from scratch. It is possible to write a valid XML file that meets the constraints of JasperReports Server and defines a Domain design. However, due to the complexity of creating a valid design file, it is much easier to begin with a basic design file exported from the Domain Designer or to modify an existing design file.
After editing, a design file can be uploaded, validated, and used to define the design of a new or existing Domain. When you open the design in the Domain Designer again, the modifications appear and are editable in the Designer. For example, a description you added in the XML design file appears in the Properties table of the Display Tab, and you are be able to edit it again the Designer. Other elements of the XML file appear on some or all of the Designer tabs.
8.1.1 Exporting the Design File from a DomainThe design file of a Domain can be exported from the Domain Designer dialog and saved as an XML file. The file contains the current state of the Domain in the Domain Designer.
To export a Domain’s design file:1. Log in to the server as an administrator and browse or search for the Domain you want to export. 2. Right-click the Domain and select Edit from the context-menu.
The Edit Domain page of the Domain Designer appears.3. In Domain Design, click Edit with Domain Designer.
The Domain Designer opens to the Tables tab. The tabs of the designer show the design settings for this Domain that you can export to XML.
4. Click Export Design.5. If your data source supports schemas (subdivisions of a database), you are prompted to include the schema name in the
table name. Select Yes if you intend to use this Domain design file with the same data source and schema. Select No if you intend to re-use this Domain design with other data sources or other schemas.
6. The browser usually gives you the choice of viewing or saving the file. To save the design file, select a location and give it a name. Be sure to keep the .xml suffix.The server validates the design before exporting the XML file. If errors are found, you can cancel the export. For more information, see section 6.5.10, “Domain Validation,” on page 177.
8.1.2 Working With a Design FileThe relationship between item definitions, column definitions, and actual database columns is the essence of the Domain itself and must be maintained when editing the design file. In order to be usable when uploaded to a Domain, a design file must meet the following conditions:
It must be well-formed XML. This means that all syntax, spelling, and punctuation is correct so that the file contains a hierarchy of elements, attributes, and content.
202
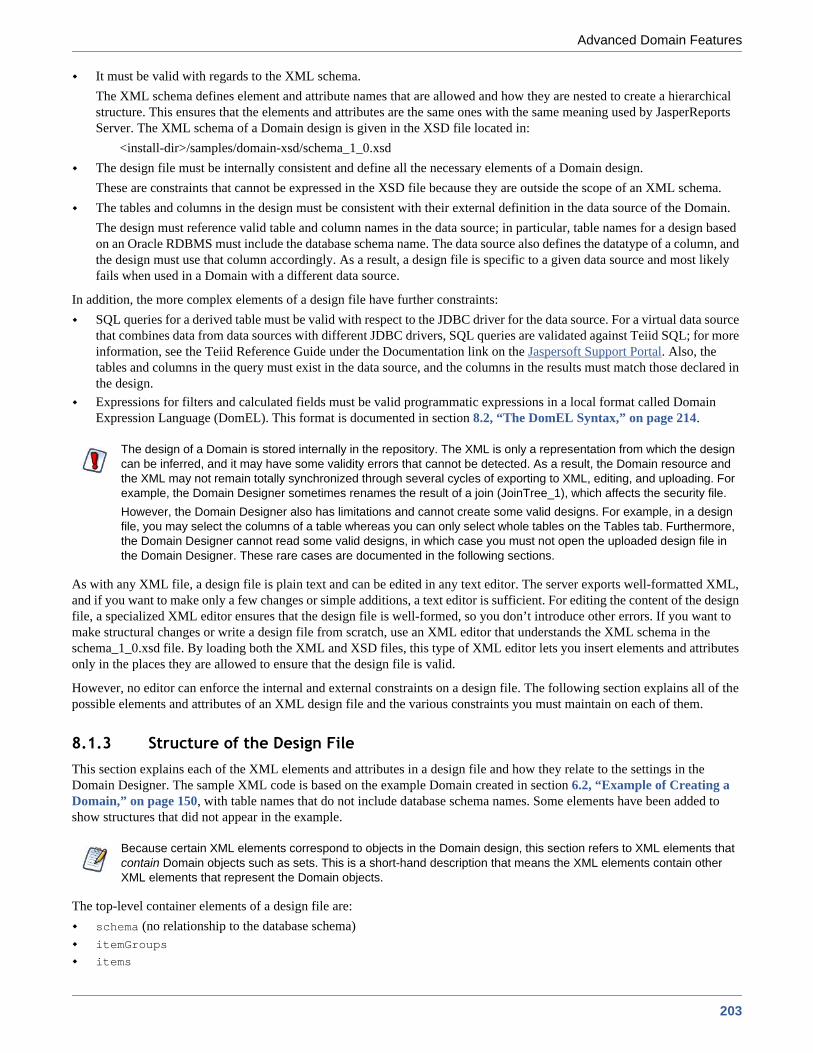
Advanced Domain Features
It must be valid with regards to the XML schema. The XML schema defines element and attribute names that are allowed and how they are nested to create a hierarchical structure. This ensures that the elements and attributes are the same ones with the same meaning used by JasperReports Server. The XML schema of a Domain design is given in the XSD file located in:
<install-dir>/samples/domain-xsd/schema_1_0.xsdThe design file must be internally consistent and define all the necessary elements of a Domain design.These are constraints that cannot be expressed in the XSD file because they are outside the scope of an XML schema.The tables and columns in the design must be consistent with their external definition in the data source of the Domain.The design must reference valid table and column names in the data source; in particular, table names for a design based on an Oracle RDBMS must include the database schema name. The data source also defines the datatype of a column, and the design must use that column accordingly. As a result, a design file is specific to a given data source and most likely fails when used in a Domain with a different data source.
In addition, the more complex elements of a design file have further constraints:SQL queries for a derived table must be valid with respect to the JDBC driver for the data source. For a virtual data source that combines data from data sources with different JDBC drivers, SQL queries are validated against Teiid SQL; for more information, see the Teiid Reference Guide under the Documentation link on the Jaspersoft Support Portal. Also, the tables and columns in the query must exist in the data source, and the columns in the results must match those declared in the design.Expressions for filters and calculated fields must be valid programmatic expressions in a local format called Domain Expression Language (DomEL). This format is documented in section 8.2, “The DomEL Syntax,” on page 214.
As with any XML file, a design file is plain text and can be edited in any text editor. The server exports well-formatted XML, and if you want to make only a few changes or simple additions, a text editor is sufficient. For editing the content of the design file, a specialized XML editor ensures that the design file is well-formed, so you don’t introduce other errors. If you want to make structural changes or write a design file from scratch, use an XML editor that understands the XML schema in the schema_1_0.xsd file. By loading both the XML and XSD files, this type of XML editor lets you insert elements and attributes only in the places they are allowed to ensure that the design file is valid.
However, no editor can enforce the internal and external constraints on a design file. The following section explains all of the possible elements and attributes of an XML design file and the various constraints you must maintain on each of them.
8.1.3 Structure of the Design FileThis section explains each of the XML elements and attributes in a design file and how they relate to the settings in the Domain Designer. The sample XML code is based on the example Domain created in section 6.2, “Example of Creating a Domain,” on page 150, with table names that do not include database schema names. Some elements have been added to show structures that did not appear in the example.
The top-level container elements of a design file are: schema (no relationship to the database schema)itemGroups
items
The design of a Domain is stored internally in the repository. The XML is only a representation from which the design can be inferred, and it may have some validity errors that cannot be detected. As a result, the Domain resource and the XML may not remain totally synchronized through several cycles of exporting to XML, editing, and uploading. For example, the Domain Designer sometimes renames the result of a join (JoinTree_1), which affects the security file.However, the Domain Designer also has limitations and cannot create some valid designs. For example, in a design file, you may select the columns of a table whereas you can only select whole tables on the Tables tab. Furthermore, the Domain Designer cannot read some valid designs, in which case you must not open the uploaded design file in the Domain Designer. These rare cases are documented in the following sections.
Because certain XML elements correspond to objects in the Domain design, this section refers to XML elements that contain Domain objects such as sets. This is a short-hand description that means the XML elements contain other XML elements that represent the Domain objects.
203
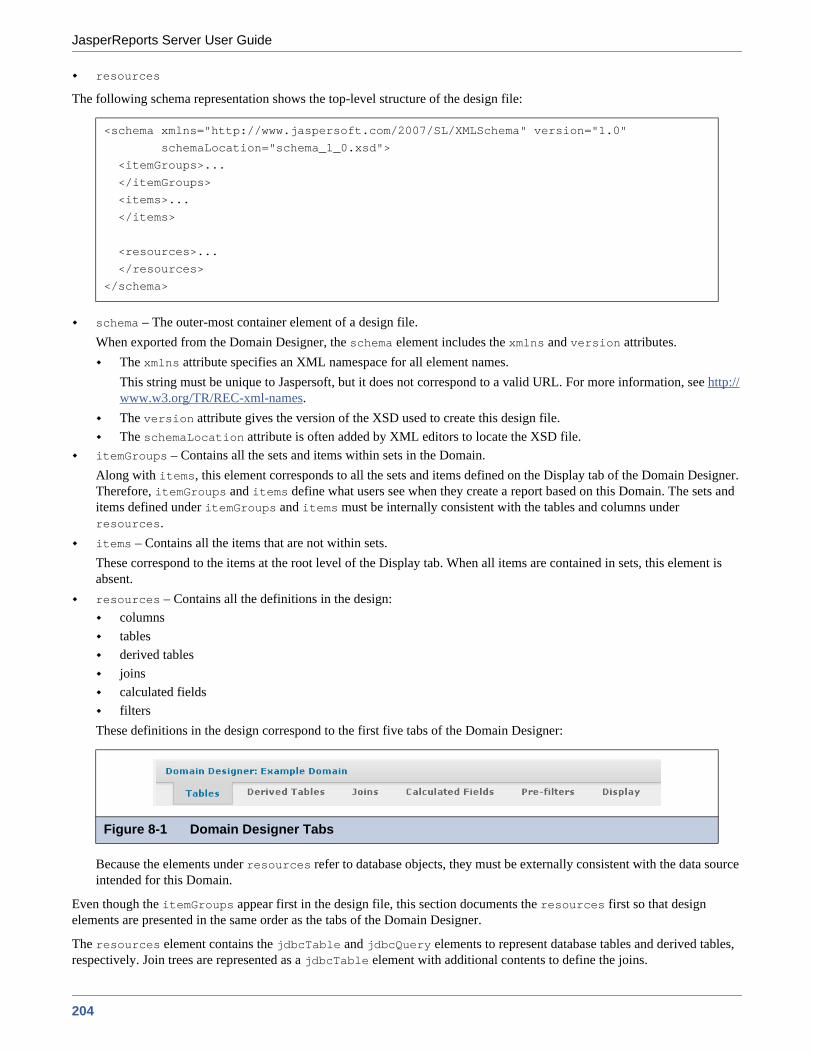
JasperReports Server User Guide
resources
The following schema representation shows the top-level structure of the design file:
schema – The outer-most container element of a design file. When exported from the Domain Designer, the schema element includes the xmlns and version attributes.
The xmlns attribute specifies an XML namespace for all element names. This string must be unique to Jaspersoft, but it does not correspond to a valid URL. For more information, see http://www.w3.org/TR/REC-xml-names.The version attribute gives the version of the XSD used to create this design file.The schemaLocation attribute is often added by XML editors to locate the XSD file.
itemGroups – Contains all the sets and items within sets in the Domain. Along with items, this element corresponds to all the sets and items defined on the Display tab of the Domain Designer. Therefore, itemGroups and items define what users see when they create a report based on this Domain. The sets and items defined under itemGroups and items must be internally consistent with the tables and columns under resources.items – Contains all the items that are not within sets. These correspond to the items at the root level of the Display tab. When all items are contained in sets, this element is absent.resources – Contains all the definitions in the design:
columnstablesderived tablesjoinscalculated fieldsfilters
These definitions in the design correspond to the first five tabs of the Domain Designer:
Because the elements under resources refer to database objects, they must be externally consistent with the data source intended for this Domain.
Even though the itemGroups appear first in the design file, this section documents the resources first so that design elements are presented in the same order as the tabs of the Domain Designer.
The resources element contains the jdbcTable and jdbcQuery elements to represent database tables and derived tables, respectively. Join trees are represented as a jdbcTable element with additional contents to define the joins.
<schema xmlns="http://www.jaspersoft.com/2007/SL/XMLSchema" version="1.0"
schemaLocation="schema_1_0.xsd">
<itemGroups>...
</itemGroups>
<items>...
</items>
<resources>...
</resources>
</schema>
Figure 8-1 Domain Designer Tabs
204

Advanced Domain Features
8.1.3.1 Representing Tables in XML
In the Domain Designer, you can select only entire tables, not individual columns. In the XML design file, however, you can specify any subset of columns that you need.
jdbcTable – Represents a table or a copy of a table in the data source. A Domain design must reference all the tables that it needs to access. The jdbcTable element is also used to describe join trees, but this case is documented separately on page 208. All three attributes of jdbcTable are required:
datasourceId – Alias that identifies the data source. When created in the Domain Designer, this is the data source alias defined in section 6.5.3, “Derived Tables Tab,” on page 169. When creating a design file, this alias may be any name you choose, but it must be identical for all tables and derived tables. When uploading the file, the datasourceId automatically becomes the alias associated with the data source defined for the Domain. tableName – Literal name of the table in the data source. Depending on the data source type and the database, this name includes additional information:
<resources>
<jdbcTable datasourceId="SugarCRMDataSource" tableName="accounts" id="accounts">
...
</jdbcTable>
<jdbcTable datasourceId="SugarCRMDataSource" tableName="accounts_opportunities"
id="accounts_opportunities">
...
</jdbcTable>
<jdbcTable datasourceId="SugarCRMDataSource" tableName="opportunities"
id="opportunities">
...
<filterString>opportunity_type == 'Existing Business'</filterString>
</jdbcTable>
<jdbcQuery datasourceId="SugarCRMDataSource" id="p1cases">
<fieldList>
<field id="account_id" type="java.lang.String"/>
<field id="assigned_user_id" type="java.lang.String"/>
<field id="case_number" type="java.lang.Integer"/>
<field id="date_entered" type="java.sql.Timestamp"/>
<field id="description" type="java.lang.String"/>
<field id="id" type="java.lang.String"/>
<field id="name" type="java.lang.String"/>
<field id="resolution" type="java.lang.String"/>
<field id="status" type="java.lang.String"/>
</fieldList>
<filterString>status != 'closed'</filterString>
<query>select * from cases where cases.priority=1 and cases.deleted=false</query>
</jdbcQuery>
<jdbcTable datasourceId="SugarCRMDataSource" tableName="users" id="users1">
...
</jdbcTable>
<jdbcTable datasourceId="SugarCRMDataSource" tableName="users" id="users2">
...
</jdbcTable>
<jdbcTable datasourceId="SugarCRMDataSource" tableName="accounts" id="JoinTree_1">
...
</jdbcTable>
</resources>
205
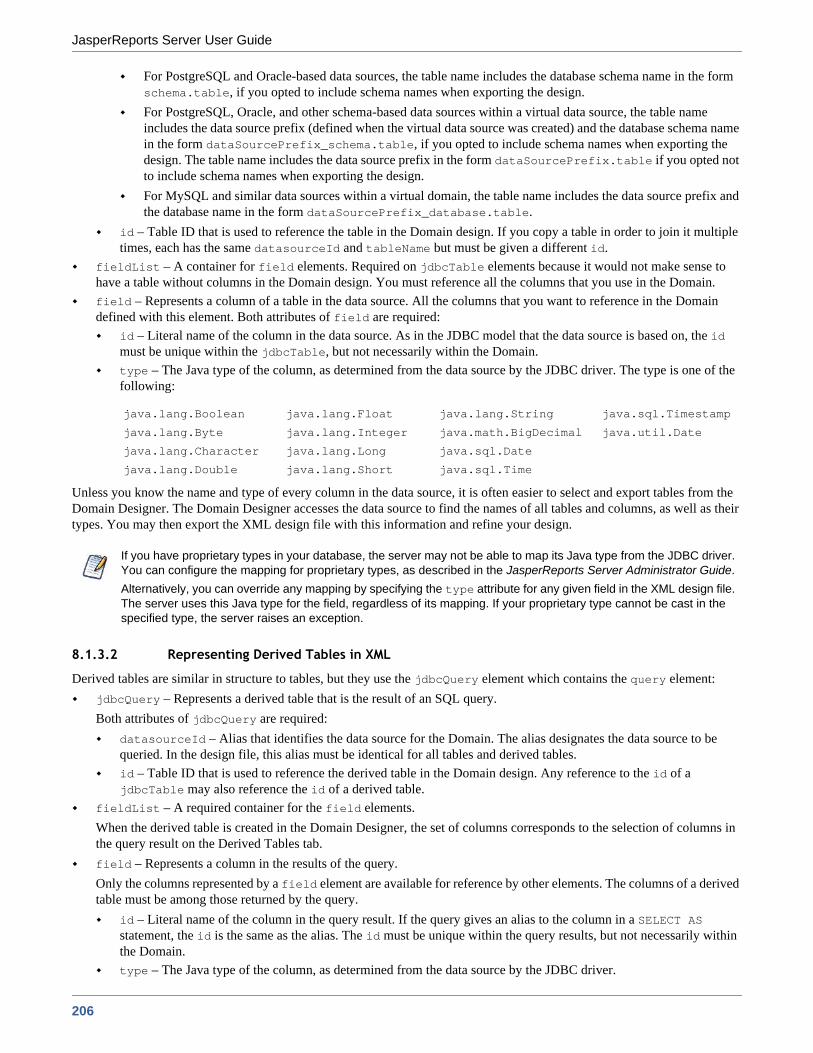
JasperReports Server User Guide
For PostgreSQL and Oracle-based data sources, the table name includes the database schema name in the form schema.table, if you opted to include schema names when exporting the design. For PostgreSQL, Oracle, and other schema-based data sources within a virtual data source, the table name includes the data source prefix (defined when the virtual data source was created) and the database schema name in the form dataSourcePrefix_schema.table, if you opted to include schema names when exporting the design. The table name includes the data source prefix in the form dataSourcePrefix.table if you opted not to include schema names when exporting the design.For MySQL and similar data sources within a virtual domain, the table name includes the data source prefix and the database name in the form dataSourcePrefix_database.table.
id – Table ID that is used to reference the table in the Domain design. If you copy a table in order to join it multiple times, each has the same datasourceId and tableName but must be given a different id.
fieldList – A container for field elements. Required on jdbcTable elements because it would not make sense to have a table without columns in the Domain design. You must reference all the columns that you use in the Domain.field – Represents a column of a table in the data source. All the columns that you want to reference in the Domain defined with this element. Both attributes of field are required:
id – Literal name of the column in the data source. As in the JDBC model that the data source is based on, the id must be unique within the jdbcTable, but not necessarily within the Domain.type – The Java type of the column, as determined from the data source by the JDBC driver. The type is one of the following:
Unless you know the name and type of every column in the data source, it is often easier to select and export tables from the Domain Designer. The Domain Designer accesses the data source to find the names of all tables and columns, as well as their types. You may then export the XML design file with this information and refine your design.
8.1.3.2 Representing Derived Tables in XML
Derived tables are similar in structure to tables, but they use the jdbcQuery element which contains the query element:jdbcQuery – Represents a derived table that is the result of an SQL query. Both attributes of jdbcQuery are required:
datasourceId – Alias that identifies the data source for the Domain. The alias designates the data source to be queried. In the design file, this alias must be identical for all tables and derived tables.id – Table ID that is used to reference the derived table in the Domain design. Any reference to the id of a jdbcTable may also reference the id of a derived table.
fieldList – A required container for the field elements. When the derived table is created in the Domain Designer, the set of columns corresponds to the selection of columns in the query result on the Derived Tables tab.field – Represents a column in the results of the query. Only the columns represented by a field element are available for reference by other elements. The columns of a derived table must be among those returned by the query.
id – Literal name of the column in the query result. If the query gives an alias to the column in a SELECT AS statement, the id is the same as the alias. The id must be unique within the query results, but not necessarily within the Domain.type – The Java type of the column, as determined from the data source by the JDBC driver.
java.lang.Boolean
java.lang.Byte
java.lang.Character
java.lang.Double
java.lang.Float
java.lang.Integer
java.lang.Long
java.lang.Short
java.lang.String
java.math.BigDecimal
java.sql.Date
java.sql.Time
java.sql.Timestamp
java.util.Date
If you have proprietary types in your database, the server may not be able to map its Java type from the JDBC driver. You can configure the mapping for proprietary types, as described in the JasperReports Server Administrator Guide.Alternatively, you can override any mapping by specifying the type attribute for any given field in the XML design file. The server uses this Java type for the field, regardless of its mapping. If your proprietary type cannot be cast in the specified type, the server raises an exception.
206

Advanced Domain Features
query – The SQL query sent to the database server. You can use any valid SQL that returns results, as long as the tables and columns in the query exist in the data source, and the columns in the result match the id and type of all field elements of the derived table given in the fieldList. The syntax for a valid SQL query does not include a closing semi-colon (;). If you add a derived table in the Domain Designer, it runs the query and generates columns based on the result set. You can then export the design file containing the generated column list.
The following sample query selects some columns, including a field calculated in the SQL, from the result of a join with sorted results. In this case, only exp_date, store_id, amount, currency, conv, and as_dollars can be exposed as columns of this derived table.
A derived table provides an alternative way to create joins and calculated fields. Here are some things to keep in mind when deciding how to implement the Domain:
Unlike joins defined in the Domain, joins within a derived table are not restricted to equality comparisons when uploaded to the Domain Designer. For more information, see section 8.1.3.3, “Representing Joins in XML,” on page 207.Unlike calculated fields in DomEL, calculated fields within derived tables may use any function call recognized by the RDBMS. See section 8.2, “The DomEL Syntax,” on page 214 for restrictions on function calls in calculated fields.The Domain mechanism applies filters, aggregation, and joins to derived tables by wrapping the SQL in a nested query, which may be less efficient on some databases than the equivalent query generated for a non-derived table.
8.1.3.3 Representing Joins in XML
A join is represented in the design file as a special jdbcTable element. It contains the joinInfo and joinedDataSetList elements to define the actual joins. It also contains a list of columns that are exposed through the Domain, each with a prefix on the field id attribute to identify its originating table. The Domain Designer automatically exposes all columns of all tables in a join, but in the design file you only need to specify those you want to reference elsewhere in the Domain.
SQL queries for a derived table are with respect to the JDBC driver for the data source. If you are working with a virtual data source, SQL queries are validated against Teiid SQL, which provides DML SQL-92 support with select SQL-99 features. For more information, see the Teiid Reference Guide under the Documentation link on the Jaspersoft Support Portal.
<query>
select e.exp_date, e.store_id, e.amount, c.currency, c.conversion_ratio conv,
amount * c.conversion_ratio as_dollars
from expense_fact e join currency c
on (e.currency_id = c.currency_id and date(e.exp_date) = c.date)
order by e.exp_date
</query>
<jdbcTable datasourceId="SugarCRMDataSource" id="JoinTree_1" tableName="accounts">
<fieldList>
<field id="accounts_opportunities.account_id" type="java.lang.String"/>
...
</fieldList>
<joinInfo alias="accounts" referenceId="accounts"/>
<joinedDataSetList>
<joinedDataSetRef>
<joinString>join accounts_opportunities accounts_opportunities on
(accounts.id == accounts_opportunities.account_id)</joinString>
</joinedDataSetRef>
<joinedDataSetRef><joinString>join opportunities opportunities on
(accounts_opportunities.opportunity_id == opportunities.id)</joinString>
</joinedDataSetRef>
207

JasperReports Server User Guide
jdbcTable – Represents the results of one or more joins between tables. If not all tables are joined together, there is one jdbcTable representing each join tree and containing only the join expressions for that tree. To define the join, the attributes and elements have a different meaning than for a regular table.
datasourceId – Alias that identifies the data source for the Domain. The alias designates the data source where the join is performed. In the design file, this alias must be identical to that for all tables and derived tables.id – ID that is used to reference the join results in the Domain design. In the Domain Designer, each join tree is automatically given the ID JoinTree_n, where n is a sequential number. In the design file, you can give the join any name, as long as it is unique among all other tables and derived tables.tableName – Literal name of the first table in the join. This table name is combined with those in the joinInfo and joinedDataSetList to define the join expressions.
For PostgreSQL and Oracle-based data sources, the table name includes the database schema name in the form schema.table, if you opted to include schema names when exporting the design. For PostgreSQL and Oracle-based data sources within a virtual data source, the table name includes the data source prefix defined when the virtual data source was created and the database schema name in the form dataSourcePrefix_schema.table, if you opted to include schema names when exporting the design. The table name includes the data source prefix in the form dataSourcePrefix.table if you opted not to include schema names when exporting the design.For MySQL and similar data sources within a virtual domain, the table name includes the data source prefix and the database name in the form dataSourcePrefix_database.table.
fieldList – A required container for the field elements in the join tree.field – Represents a column in the join tree. The table of each column is identified by a prefix on the id attribute. When created in the Domain Designer, the design file includes every column in every table of the join. When you create your own design file, only the columns you want to reference are needed. Both attributes of field are required:
id – Field ID composed of the ID of the table in the design and the literal name of the column in the data source. The syntax is table_ID.field_name.type – The Java type of the column, identical to the type in its table definition.
joinInfo – Gives the table ID and alias for the table given by the tablename attribute. The table ID and alias are used as the first table in the join definition. This element and its two attributes are required even if they are identical.
alias – Alternative name within the join expression for the table identified in referenceId. By default, the alias is the same as the referenceID, but you may supply a true alias in handwritten design files. If you use a distinct alias, you must be careful to use the alias throughout the joinString element that defines the join.referenceId – Table id of the table within the design whose data source name is given in tableName.
joinedDataSetList – Container for the list of join statements.joinedDataSetRef – Container for the join statement.joinString – A string expressing an SQL join statement in the following format:
join_type join table_ID table_alias on join_expressionWhere:
join_type – One of right outer, left outer, or full outer. Inner join is the default if no join type is specified.table_ID – The ID of a table within the design.
<joinedDataSetRef><joinString>join users1 users1 on
(opportunities.assigned_user_id == users1.id)</joinString>
</joinedDataSetRef>
<joinedDataSetRef><joinString>left outer join p1cases p1cases on
(accounts.id == p1cases.account_id)</joinString>
</joinedDataSetRef>
<joinedDataSetRef><joinString>right outer join users2 users2 on
(users2.id == p1cases.assigned_user_id)</joinString>
</joinedDataSetRef>
</joinedDataSetList>
</jdbcTable>
208

Advanced Domain Features
table_alias – Alternative name to use for the table_ID within the join expression. By default, the alias is the same as the table_ID, but you may supply a true alias in handwritten design files.join_expression – Expression that compares the columns on which the join is made, in the form
left_table_alias.field_name == right_table_alias.field_name
The order of joinedDataSetRef elements is important. The first one must contain a join expression between the table_alias it defines and the alias in the joinInfo element. The subsequent ones may only reference the table_alias they define and ones that appear in joinString elements before them.
8.1.3.4 Representing Calculated Fields in XML
Calculated fields are defined as regular columns in a field element with an additional attribute. Calculated fields that rely only on columns of the same table appear in jdbcTable for that table, as well as in the join tree. Calculated fields that rely on columns from different tables that are joined appear only in the join tree.
The following example shows the XML for a calculated expression in the accounts table. Because it references only the columns of accounts, it appears in that table and in the join tree.
The attributes of the field element have a different meaning when defining a calculated field:dataSetExpression – Expression which calculates a value based on other columns. The syntax for the expression, including how to reference columns, is documented in section 8.2, “The DomEL Syntax,” on page 214.id – User-defined name of the calculated field. The format of the id is dependent on how the calculated field appears in the design file:
1. If the expression references columns in the same table:a. The field appears in the table and the id is a simple column name.b. The field also appears in a join tree that uses the table, the id has the form table_ID.field_name.
2. When the expression references columns in different tables, the field appears only in the join tree of those tables, and the id has the form jointree_ID.field_name.
Join expressions are actually written in the DomEL syntax to allow more complex expressions, such as boolean operators and other comparisons. See section 8.2, “The DomEL Syntax,” on page 214.However, join expressions other than equality between field values are not supported in the Domain Designer. You can upload a design file with such joins, but they are overwritten with equi-joins if you open the design in the Domain Designer. Join expressions with several boolean clauses are not supported in the Domain Design either. You can sometimes replace them with filters on tables in the join.
<jdbcTable datasourceId="SugarCRMDataSource" id="accounts" tableName="accounts">
<fieldList>
...
<field dataSetExpression="concat( billing_address_city, ', ',
billing_address_state )" id="city_and_state" type="java.lang.String"/>
...
</fieldlist>
</jdbcTable>
...
<jdbcTable datasourceId="SugarCRMDataSource" id="JoinTree_1" tableName="anything">
<fieldList>
...
<field dataSetExpression="concat( accounts.billing_address_city, ', ',
accounts.billing_address_state )" id="accounts.city_and_state"
type="java.lang.String"/>
...
</fieldlist>
</jdbcTable>
209

JasperReports Server User Guide
3. When the expression computes a constant value. The field appears in a table named Constant, and the id is a simple column name. Constant fields are further explained below.type – The Java type of the value calculated by the expression, for example java.lang.String. This type must be compatible with the result of the DomEL expression and among the JDBC-compatible types listed on page 206.
A special case of a calculated field occurs when the expression does not reference any column names. The calculated field always has the same value and is said to be a constant. In the Domain Designer, constant fields are automatically grouped in a table named Constant and may be used in other calculated fields, filters, or even as an item. Because constant fields are not dependent on any column values, they may be used in any join tree and exposed to the user along with the items from any join tree. When editing a design file, you must treat constant calculated fields in the same way.
8.1.3.5 Representing Filters in XML
Filters are defined as optional filterString elements inside of jdbcTable and jdbcQuery elements. They impose a condition on any results that are returned for that table, query, or join tree, thereby limiting the number of rows returned when accessing the data source. Whereas other settings mainly determine which columns are available for use in a report. A filter determines which rows are available when running the report.
filterString – Expression which evaluates to true or false when applied to each row of values in the data source. The expression refers to columns using their id attribute. Thus, a filter on a table or derived table refers to the simple column name, but a filter on a join tree refers to the table_ID.field_name. The full syntax for the expression is documented in section 8.2, “The DomEL Syntax,” on page 214.
For example, the following filters are defined in the example Domain on page 156:
8.1.3.6 Representing Sets and Items in XML
Now that all the table and field IDs have been defined, look at the definitions of sets and items that are exposed through itemGroups and items elements at the top of the Domain design file. The itemGroups and items elements are equivalent to the selection of sets and items on the Display tab of the Domain Designer. They create a hierarchy of sets, subsets and items and hold attributes that define all the properties available on sets and items. For a description of each possible property, see section 6.5.8, “The Properties Panel,” on page 175. The following example shows two levels of sets, with items inside each level as well as at the root, outside of any set.
Filters defined in the Domain Designer are limited to conditions on one column or comparisons of two columns, with more complex filters created by the conjunction (logical AND) of several conditions. Other filter expressions are not supported. You can upload a design file with more complex filters, but they are overwritten or cause errors if you open the design in the Domain Designer.
<jdbcTable datasourceId="SugarCRMDataSource" id="opportunities"
tableName="opportunities">
<fieldList>
...
<field id="opportunity_type" type="java.lang.String"/>
</fieldList>
<filterString>opportunity_type == 'Existing Business'</filterString>
</jdbcTable>
<jdbcQuery datasourceId="SugarCRMDataSource" id="p1cases">
<fieldList>
...
<field id="status" type="java.lang.String"/>
</fieldList>
<filterString>status != 'closed'</filterString>
<query>...</query>
</jdbcQuery>
210

Advanced Domain Features
itemGroups – A container for itemGroup elements.itemGroup – Represents a set. The itemGroup element may contain an itemGroups element, an items element, or both, representing its subsets and items, respectively. The attributes of itemGroup are the properties of the set it represents:
id – The unique identifier of the set among all set and item IDs. This attribute is required.label – The set’s name, visible to users of the Domain. If the label is missing, the Ad Hoc Editor displays the id.description – The optional description of the set, visible to users as a tooltip on the set name in the Ad Hoc Editor.labelId – The internationalization key for the label in the Domain’s locale bundles.descriptionId – The internationalization key for the description in the Domain’s locale bundles.resourceId – A reference to the table on which the set is based. This attribute is required, but it has no meaning on a set and is not significant in the design.
When an internationalization key is defined for the label or description, the label or description is replaced with the value given by the key in the local bundle corresponding to the user’s locale. See section 8.5, “Locale Bundles,” on page 228.items – A container for item elements.item – Represents an item. The attributes of item are the properties of the item it represents:
id – The unique identifier of the item among all set and item IDs. This attribute is required.label – The item’s name, visible to users. If the label is missing, the Ad Hoc Editor displays the id.description – The optional description of the item, visible as a tooltip on the item name in the Ad Hoc Editor.labelId – The internationalization key for the label in the Domain’s locale bundles.descriptionId – The internationalization key for the description in the Domain’s locale bundles.resourceId – A reference to the column on which the item is based. This attribute is required because it defines the connection between what the user sees and the corresponding data in the data source. The resourceId has the form table_ID.field_ID. When the item refers to a column in a join tree, the resourceID corresponds to jointree_ID.table_ID.field_name because the field ID in a join tree includes the table ID.dimensionOrMeasure – Corresponds to the Field or measure setting in the user interface. Its possible values are Dimension (equivalent to field) or Measure. By default, all numeric fields are treated as measures in the Ad Hoc Editor. This attribute is optional and necessary only when overriding the default behavior, for example to make a numeric item explicitly not a measure. See section 6.1.2, “Terminology,” on page 148.defaultMask – A representation of the default data format to use when this item is included in a report. The possible values depend on the type attribute of the column referenced by the resourceId. See the table below.
<itemGroups>
<itemGroup label="outerset" ... >
<itemGroups>
<itemGroup label="innerset" ... >
<items>
<item label="innersetitem1" ... />
<item label="innersetitem2" ... />
</items>
</itemGroup>
</itemGroups>
<items>
<item label="outersetitem1" ... />
<item label="outersetitem2" ... />
</items>
</itemGroup>
</itemGroups>
<items>
<item label="outsideitem1" ... />
<item label="outsideitem2" ... />
</items>
211

JasperReports Server User Guide
defaultAgg – The name of the default summary function (also called aggregation) to use when this item is included in a report. The possible values for the defaultAgg depend on the type attribute of the column referenced by the resourceId. The following table gives the possible data formats and summary functions based on the column type. The appearance columns show the equivalent setting in the properties table of the Display tab:
The following example shows the use of the itemGroup and item elements to represent the sets and items from section 6.2, “Example of Creating a Domain,” on page 150. The design file was exported from the Domain Designer.
Field Type
Default Data Formats Default Summary Functions
Attribute Value Appearance Attribute Value Appearance
Integer #,##00$#,##0;($#,##0)#,##0;(#,##0)
-1,234-1234($1,234)(1234)
Highest
Lowest
Average
Sum
DistinctCount
Count
MaximumMinimumAverageSumDistinct CountCount All
Double #,##0.000$#,##0.00;($#,##0.00)$#,##0;($#,##0)
-1,234.56-1234($1,234.56)($1,234)
Date short,hidemedium,hidelong,hidemedium,medium
3/31/09Mar 31, 2009March 31, 2009Mar 31, 2009 23:59:59
DistinctCount Count
Distinct CountCount All
All others Not allowed
<itemGroups>
...
<itemGroup id="users1" label="Account Rep" description="Primary account
representative" labelId="" descriptionId="" resourceId="JoinTree_1">
<items>
<item id="first_name" label="First Name" description="Given name"
labelId="" descriptionId="" resourceId="JoinTree_1.users1.first_name"/>
<item id="last_name" label="Last Name" description="Surname or family name"
labelId="" descriptionId="" resourceId="JoinTree_1.users1.last_name"/>
</items>
</itemGroup>
<itemGroup id="opportunities" label="Opportunity" description="Sales opportunity"
labelId="" descriptionId="" resourceId="JoinTree_1">
<items>
<item id="date_entered1" label="Date" description="Date opportunity opened"
labelId="" descriptionId="" defaultMask="short,hide"
resourceId="JoinTree_1.opportunities.date_entered"/>
<item id="amount" label="Amount" description="Estimated contract Amount"
labelId="" descriptionId="" defaultMask="$#,##0;($#,##0)"
defaultAgg="Average" resourceId="JoinTree_1.opportunities.amount"/>
<item id="probability" label="Probability" description="Chance of closing the
contract" labelId="" descriptionId=""
resourceId="JoinTree_1.opportunities.probability"/>
212

Advanced Domain Features
Labels and descriptions may contain any characters, but the ID property value of both itemGroup and item elements must be alphanumeric and not start with a digit.
8.1.4 Uploading a Design File to a DomainAfter you have modified an XML design file, you can upload it through the Add New Domain page. Alternatively, you can create a new Domain based on a modified file or even on a design file created from scratch.
To upload an XML design file:1. Log in to the server as an administrator and select View > Search Results.2. Locate the Domain.
a. Choose View > Search Results.b. In the Filters panel, under Types, click More choices. c. Click Domains.
3. To update an existing Domain, right-click the Domain and select Edit from the context-menu.To create a new Domain, select Create > Domain from the main menu.The Domain appears in the Data and Design page of the Edit Domain or Add New Domain dialog. If you are creating a new Domain, you must select a data source before you can proceed.
<item id="description1" label="Description" description="Description of
opportunity" labelId="" descriptionId=""
resourceId="JoinTree_1.opportunities.description"/>
<item id="lead_source" label="Lead Source" description="Lead Source" labelId=""
descriptionId="" resourceId="JoinTree_1.opportunities.lead_source"/>
<item id="sales_stage" label="Sales Stage" description="Sales Stage" labelId=""
descriptionId="" resourceId="JoinTree_1.opportunities.sales_stage"/>
</items>
</itemGroup>
<itemGroup id="p1cases" label="P1 Case" description="High priority (P1) support
case" labelId="" descriptionId="" resourceId="JoinTree_1">
<items>
<item id="case_number" label="Case" description="Case number" labelId=""
descriptionId="" resourceId="JoinTree_1.p1cases.case_number"/>
<item id="date_entered2" label="Date" description="Date case opened" labelId=""
descriptionId="" resourceId="JoinTree_1.p1cases.date_entered"/>
<item id="name2" label="Summary" description="Name or summary of case"
labelId="" descriptionId="" resourceId="JoinTree_1.p1cases.name"/>
<item id="description2" label="Description" description="Detailed description
of the case" labelId="" descriptionId=""
resourceId="JoinTree_1.p1cases.description"/>
<item id="resolution" label="Resolution" description="Description of the case
resolution" labelId="" descriptionId=""
resourceId="JoinTree_1.p1cases.resolution"/><item id="status" label="Status" description="Current case status" labelId=""
descriptionId="" resourceId="JoinTree_1.p1cases.status"/>
</items>
</itemGroup>
...
</itemGroups>
213

JasperReports Server User Guide
4. Select Upload under Domain Design, then click Browse to find the XML design file. In the File Upload window, click Open.
The server validates the uploaded XML file. If there are syntax or semantic errors, the current design is not replaced. You can make changes to the XML file and upload it again until there are no errors.
5. If you used only supported features in the design file, verify the uploaded Domain design by selecting Edit in Domain Designer. Make sure the settings you made in the XML file appear as expected on the various tabs of the Domain Designer. If there are any errors or inconsistencies, you should make changes to the XML file, upload it again, and verify it again. The results of editing a design in the Domain Designer based on inconsistent XML file are unpredictable. If you cannot resolve the error or inconsistencies, you should click Cancel on the Data and Design page so that the uploaded design is not saved.After the design appears correctly in the Domain Designer, you may make further modifications on any of the tabs.
6. Click OK, then click Submit to update the Domain in the repository.7. If you modified an existing Domain, you must clear the Ad Hoc cache of all queries based on the Domain. This removes
any data that was based on the old instance of the Domain and avoid inconsistencies in new reports. For instructions, see the JasperReports Server Administrator Guide.
8.2 The DomEL SyntaxVarious components of a Domain need to compute values based on some expression involving constants, field values, and environment variables. The Domain Expression Language (DomEL) was created to fill this need. Currently, the following features in XML design files are expressed in DomEL:
The on and where clauses of derived tablesThe on clause of join statementsCalculated fieldsFilter expressions in Domains and Domain topics (equivalent to where clauses)The testProfileAttribute functionRow-level security (see section 8.4, “The Domain Security File,” on page 220)
A DomEL expression is a shorthand way of writing a complex query. When processing a report based on a Domain, the server interprets DomEL expressions to generate parts of the SQL expression that perform the desired query. Depending on the data policy, either the augmented SQL is passed to the data source, or the server performs a simpler query and applies the DomEL expressions to the full dataset in memory.
8.2.1 DatatypesThe following simple datatypes may be declared as constants, used in expressions, and returned as values:
The design file overwrites any existing design without prompting. If you make a mistake or upload the wrong file, click Cancel on the Data and Design page and start over.
If you intentionally use syntax in the design file that Domain Designer does not support, do not launch the Domain Designer after uploading the file. The Domain Designer can have unpredictable results with some XML designs it does not support.
Simple Type Description Example of Constant
boolean Expressions such as comparison operators return boolean values, but true and false constants are undefined and cannot be used.
none
integer Whole numbers. 123 or -123
214
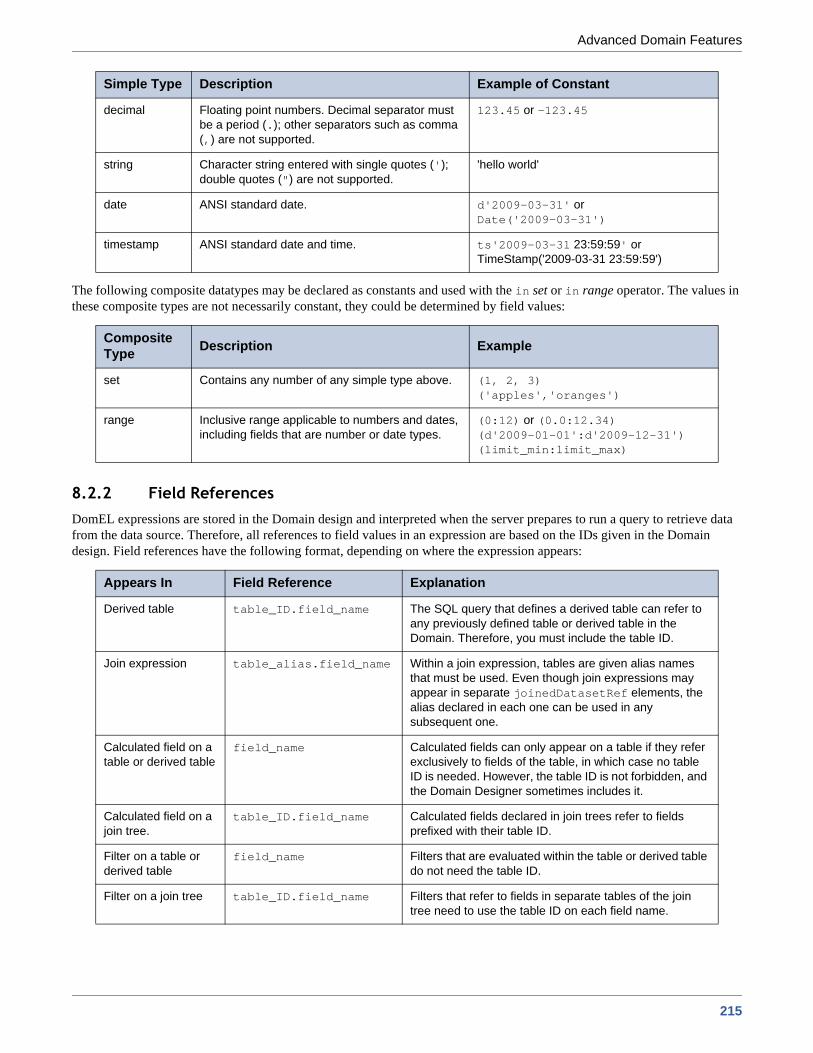
Advanced Domain Features
The following composite datatypes may be declared as constants and used with the in set or in range operator. The values in these composite types are not necessarily constant, they could be determined by field values:
8.2.2 Field ReferencesDomEL expressions are stored in the Domain design and interpreted when the server prepares to run a query to retrieve data from the data source. Therefore, all references to field values in an expression are based on the IDs given in the Domain design. Field references have the following format, depending on where the expression appears:
decimal Floating point numbers. Decimal separator must be a period (.); other separators such as comma (,) are not supported.
123.45 or -123.45
string Character string entered with single quotes ('); double quotes (") are not supported.
'hello world'
date ANSI standard date. d'2009-03-31' orDate('2009-03-31')
timestamp ANSI standard date and time. ts'2009-03-31 23:59:59' orTimeStamp('2009-03-31 23:59:59')
Composite Type Description Example
set Contains any number of any simple type above. (1, 2, 3)('apples','oranges')
range Inclusive range applicable to numbers and dates, including fields that are number or date types.
(0:12) or (0.0:12.34)(d'2009-01-01':d'2009-12-31')(limit_min:limit_max)
Appears In Field Reference Explanation
Derived table table_ID.field_name The SQL query that defines a derived table can refer to any previously defined table or derived table in the Domain. Therefore, you must include the table ID.
Join expression table_alias.field_name Within a join expression, tables are given alias names that must be used. Even though join expressions may appear in separate joinedDatasetRef elements, the alias declared in each one can be used in any subsequent one.
Calculated field on a table or derived table
field_name Calculated fields can only appear on a table if they refer exclusively to fields of the table, in which case no table ID is needed. However, the table ID is not forbidden, and the Domain Designer sometimes includes it.
Calculated field on a join tree.
table_ID.field_name Calculated fields declared in join trees refer to fields prefixed with their table ID.
Filter on a table or derived table
field_name Filters that are evaluated within the table or derived table do not need the table ID.
Filter on a join tree table_ID.field_name Filters that refer to fields in separate tables of the join tree need to use the table ID on each field name.
Simple Type Description Example of Constant
215

JasperReports Server User Guide
8.2.3 Operators and FunctionsDomEL provides the following operators, listed in order of precedence. Operators higher in this list are evaluated before operators lower in the list:
DomEL also defines the following operations as functions:
8.2.4 Profile AttributesA profile attribute is a name-value pair associated with a user account. It is ordinarily used to extend the object's standard access grants, but it has other uses as well. To define or modify the profile attributes for a user account, see the section on editing user attributes in the JasperReports Server Administrator Guide.
For example, this Groovy expression tests users for the Cities access grant in the store_city field in the store table: <filterExpression>store.store_city in (groovy('authentication.getPrincipal().getAttributes().find{ it.attrName == "Cities"
Operator Syntax Description
multiply, divide i * j / k Arithmetic operators for numeric types only. Parentheses for grouping are not supported.
add, subtract i + j - k
equal i == j Comparison operators for string, numeric, and date types.
not equal i != j
less than i < j Comparison operators for numeric and date types only.
less than or equal i <= j
greater than i > j
greater than or equal i >= j
in set i in ('apples','oranges') Sets can be of any type.
in range i in (j:k) Ranges must be numeric or date types.
not not ( i ) Boolean operators. Parentheses are required for not and may be used for grouping.
and i and j and k
or i or j or k
Function Syntax Description
startsWith startsWith(i, 'prefix') Comparison operators for strings. To test string equality, use i in ('string').
endsWith endsWith(j, 'suffix')
contains contains(k, 'substring')
concat concat(i, ' and ', j, ...) Returns the string of all parameters concatenated.
testProfileAttribute*
* Profile attributes are available in all editions of JasperReports Server, but the testProfileAttribute function is available only in JasperReports Server Professional and Enterprise editions. Contact Jaspersoft to obtain the software.
testProfileAttribute(table_ID.field_name,'profileAttribute')
table_ID.field_name is the table name and field name of the field you’re comparing to a profile attribute. This argument can also be an expression, such as a concatenation of fields. It cannot be a constant or a groovy call.profileAttribute is the name of the user profile attribute.
216
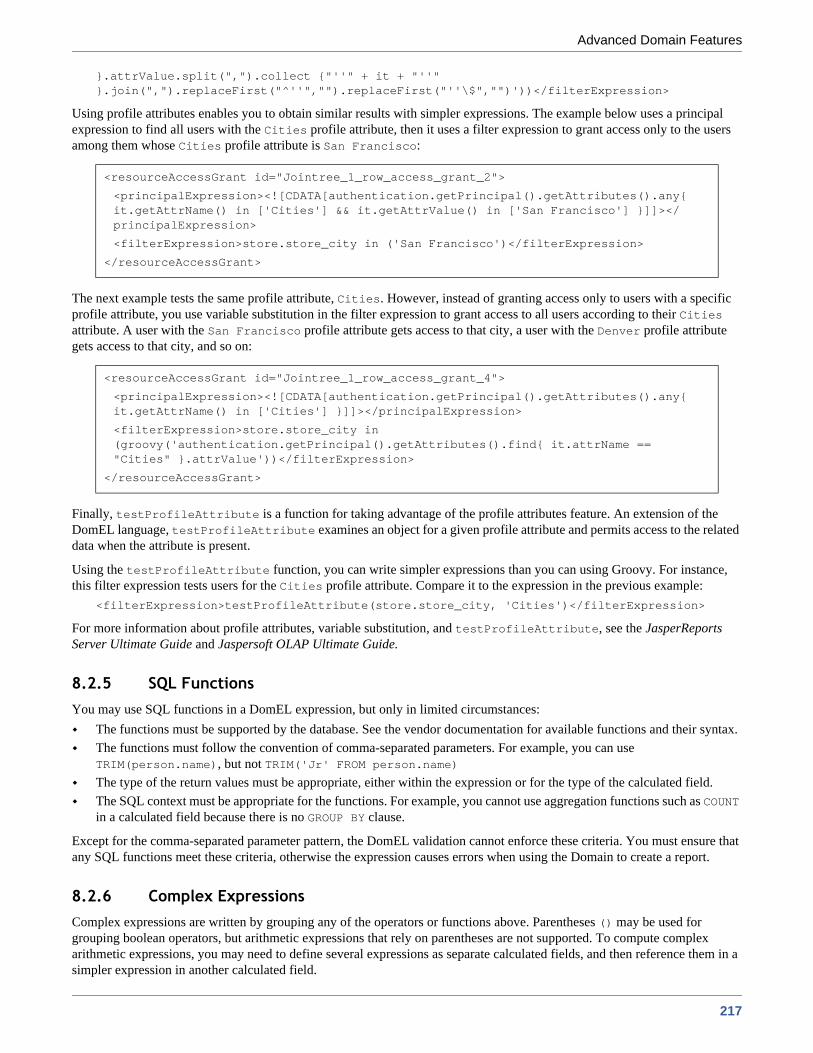
Advanced Domain Features
}.attrValue.split(",").collect {"''" + it + "''" }.join(",").replaceFirst("^''","").replaceFirst("''\$","")'))</filterExpression>
Using profile attributes enables you to obtain similar results with simpler expressions. The example below uses a principal expression to find all users with the Cities profile attribute, then it uses a filter expression to grant access only to the users among them whose Cities profile attribute is San Francisco:
The next example tests the same profile attribute, Cities. However, instead of granting access only to users with a specific profile attribute, you use variable substitution in the filter expression to grant access to all users according to their Cities attribute. A user with the San Francisco profile attribute gets access to that city, a user with the Denver profile attribute gets access to that city, and so on:
Finally, testProfileAttribute is a function for taking advantage of the profile attributes feature. An extension of the DomEL language, testProfileAttribute examines an object for a given profile attribute and permits access to the related data when the attribute is present.
Using the testProfileAttribute function, you can write simpler expressions than you can using Groovy. For instance, this filter expression tests users for the Cities profile attribute. Compare it to the expression in the previous example:
<filterExpression>testProfileAttribute(store.store_city, 'Cities')</filterExpression>
For more information about profile attributes, variable substitution, and testProfileAttribute, see the JasperReports Server Ultimate Guide and Jaspersoft OLAP Ultimate Guide.
8.2.5 SQL FunctionsYou may use SQL functions in a DomEL expression, but only in limited circumstances:
The functions must be supported by the database. See the vendor documentation for available functions and their syntax.The functions must follow the convention of comma-separated parameters. For example, you can use TRIM(person.name), but not TRIM('Jr' FROM person.name)
The type of the return values must be appropriate, either within the expression or for the type of the calculated field.The SQL context must be appropriate for the functions. For example, you cannot use aggregation functions such as COUNT in a calculated field because there is no GROUP BY clause.
Except for the comma-separated parameter pattern, the DomEL validation cannot enforce these criteria. You must ensure that any SQL functions meet these criteria, otherwise the expression causes errors when using the Domain to create a report.
8.2.6 Complex ExpressionsComplex expressions are written by grouping any of the operators or functions above. Parentheses () may be used for grouping boolean operators, but arithmetic expressions that rely on parentheses are not supported. To compute complex arithmetic expressions, you may need to define several expressions as separate calculated fields, and then reference them in a simpler expression in another calculated field.
<resourceAccessGrant id="Jointree_1_row_access_grant_2">
<principalExpression><![CDATA[authentication.getPrincipal().getAttributes().any{ it.getAttrName() in ['Cities'] && it.getAttrValue() in ['San Francisco'] }]]></principalExpression>
<filterExpression>store.store_city in ('San Francisco')</filterExpression>
</resourceAccessGrant>
<resourceAccessGrant id="Jointree_1_row_access_grant_4">
<principalExpression><![CDATA[authentication.getPrincipal().getAttributes().any{ it.getAttrName() in ['Cities'] }]]></principalExpression>
<filterExpression>store.store_city in (groovy('authentication.getPrincipal().getAttributes().find{ it.attrName == "Cities" }.attrValue'))</filterExpression>
</resourceAccessGrant>
217

JasperReports Server User Guide
The following examples show complex expressions suitable for filters. This first one selects only stores in Western states of the US:
s1.store_country in ('USA') and s1.store_state in ('WA', 'OR', 'CA', 'NV')
The following filter expression uses a date range:s1.first_opened_date in ( Date( '2000-01-01' ) : Date( '2004-12-31' )) and not( s1.closed )
As shown in these examples, field values are often compared to constant values such as 'USA'. Therefore, the author of the design file must ensure that values used in a DomEL expression exist in the data source. Otherwise, a wrong value might go undetected and impact the quality of data in reports based on the Domain. The Domain Designer determines values for comparison by accessing the data source, so if you export a design file, you can use the values it has found. Another way to reduce errors and also support future data changes is to use more general expressions such as:
s1.store_country in ('US', 'USA', 'United States')
8.2.7 Return ValueDomEL expressions are used in different contexts for different purposes. The expected return type depends on where the expression appears:
8.3 Security and Locale Information for a DomainYou can include security and locale information by uploading the following files:
A single security file. Defines row and column-level access to data selected by the Domain.Any number of locale bundles. Provides internationalized labels for the sets and items of the Domain design.
You upload and manage these files using the Edit Domain or Add New Domain pages of the Domain Designer. This section describes how to upload and replace Domain resources. For more information about the syntax of resource files, see section 8.4, “The Domain Security File,” on page 220 and section 8.5, “Locale Bundles,” on page 228.
To upload and replace a security file and locale bundles for a Domain:1. Log in to the server as an administrator and select View > Search Results.2. Locate the Domain. Typically, you set the Domain filter in Filters > All Types > More Choices > Domains.3. Right-click an existing Domain and select Edit from the context-menu.
The Domain appears in the Edit Domain page of the Domain Designer.
Appears In Expected Return Type Explanation
Derived Table SQL query with boolean expressions
A derived table is defined by an SQL expression that contains DomEL expressions. The join on clause may contain boolean comparisons and the where clause may contain filters, both of which are described below.
Join expression boolean Within a join expression, the on clause contains a comparison of fields from each table that has a boolean result. The on clause may also contain other DomEL expressions logically associated with and or or to create a complex join condition (see warning on page 207).
Calculated field any type The expression must evaluate to a type that is compatible with the SQL type declared in the Domain Designer or in the design file. For example, if the declared type is java.lang.Float, the expression must compute a decimal value.
Filter boolean Filters must be true or false overall. When there are several conditions, they must be logically associated with and or or (currently, only and is supported in the Domain Designer).
218

Advanced Domain Features
4. Click Add Security File or Add Locale Bundle to upload a security file or locale bundle to the Domain. The respective Add Security File or Add Locale Bundle dialog box appears:
There can be only one security file but any number of locale bundles. When a security file exists, the Add Security File text is disabled. See step 8 to replace an existing security file.
5. You can upload resources from local files or from objects in the repository. Select Upload a Local File or Select from Repository and then Browse to select a file or repository object.When browsing the repository, you see only XML files or locale bundle objects. To upload a security file, select an XML file created explicitly as a security file. When selected, the XML file in the repository is referenced by the Domain, unlike a local file that is uploaded directly into the Domain.
6. Click Select to upload the file and add it to the list of current resources.The server validates the file to make sure it matches the format of a security file or locale bundle. If the file type is not recognized or there is a syntax error, the file is not added to the list of resources and you must select another file or click Cancel.
Figure 8-2 Add Security File and Add Locale Bundle Dialog Boxes
The repository manager warns you if you attempt to delete a security or locale bundle file that is referenced by a Domain, but it does not warn you if you replace these files with a different file. When you store these files in the repository, ensure that any updates to the files are compatible with the Domains that reference them.
219

JasperReports Server User Guide
7. Repeat step 4 through step 6 to upload one security file and any number of locale bundles.Optional Information in the Edit Domain page lists the referenced files.
8. To edit or delete the uploaded resources, click Change or Remove, respectively. To download the security file or a locale bundle file, click the name of the referenced file in the list.For example, you add an item to the Domain after creating the locale bundles, and you need to add its label and description keys to each bundle. Download each of the locale bundles in the Domain, edit each file to add the new keys, then upload each file to replace the corresponding locale bundle. You might also want to define access permissions for the new item by downloading, modifying, and uploading the security file as well.
9. If you modified an existing Domain, you must clear the Ad Hoc cache of all queries based on the Domain. This removes any data that was based on the old instance of the Domain and avoids inconsistencies in new reports. For instructions, see the JasperReports Server Administrator Guide.
8.4 The Domain Security FileThe security file defines permissions to control access to Domain data on the basis of user names and roles existing in the server. When creating or running a report based on a Domain, the user name and roles are checked against the permissions in the security file. Permissions can be set separately on the data’s columns and rows.
Security on columns is defined by permissions on the sets and items of the Domain, corresponding to columns in the data source. For example, only certain users might be able to see sensitive employee information such as a Social Security Number. Security on rows is defined by permissions on the data values, for example a manager might only be allowed to see the salary column of employees whose manager field equals the manager’s employee number.
The IDs of tables, columns, sets and items that appear in the design are referenced by the security file. In Domains, columns display the items in the Domain; rows display the values of each item. Column security is defined on itemGroupId and itemId; row security is defined on resourceId.
A user can only see results where he has both column- and row-level access. For instance, in a certain Domain, user David has access to columns A-F and rows 1-6. Tomas has access to columns B-C and rows 1-3. Anita has access to columns C-E and
Figure 8-3 List of Security and Locale Files in the Edit Domain Page
220
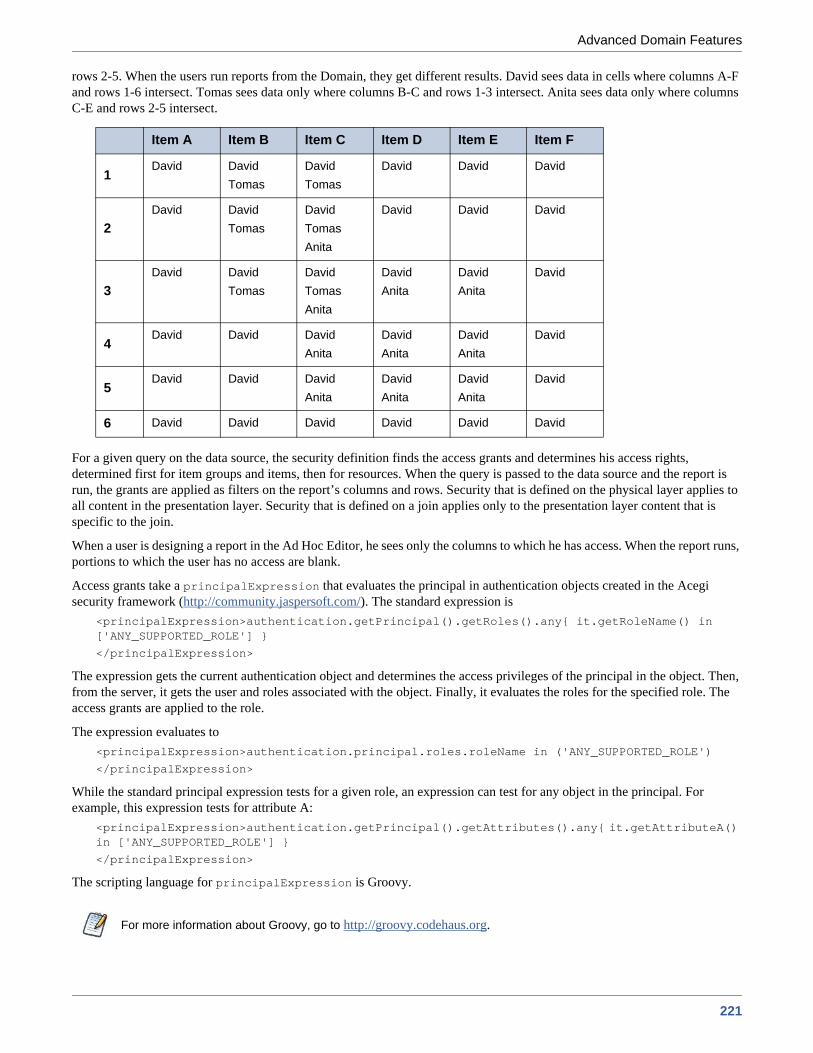
Advanced Domain Features
rows 2-5. When the users run reports from the Domain, they get different results. David sees data in cells where columns A-F and rows 1-6 intersect. Tomas sees data only where columns B-C and rows 1-3 intersect. Anita sees data only where columns C-E and rows 2-5 intersect.
For a given query on the data source, the security definition finds the access grants and determines his access rights, determined first for item groups and items, then for resources. When the query is passed to the data source and the report is run, the grants are applied as filters on the report’s columns and rows. Security that is defined on the physical layer applies to all content in the presentation layer. Security that is defined on a join applies only to the presentation layer content that is specific to the join.
When a user is designing a report in the Ad Hoc Editor, he sees only the columns to which he has access. When the report runs, portions to which the user has no access are blank.
Access grants take a principalExpression that evaluates the principal in authentication objects created in the Acegi security framework (http://community.jaspersoft.com/). The standard expression is
<principalExpression>authentication.getPrincipal().getRoles().any{ it.getRoleName() in ['ANY_SUPPORTED_ROLE'] }
</principalExpression>
The expression gets the current authentication object and determines the access privileges of the principal in the object. Then, from the server, it gets the user and roles associated with the object. Finally, it evaluates the roles for the specified role. The access grants are applied to the role.
The expression evaluates to<principalExpression>authentication.principal.roles.roleName in ('ANY_SUPPORTED_ROLE')
</principalExpression>
While the standard principal expression tests for a given role, an expression can test for any object in the principal. For example, this expression tests for attribute A:
<principalExpression>authentication.getPrincipal().getAttributes().any{ it.getAttributeA() in ['ANY_SUPPORTED_ROLE'] }
</principalExpression>
The scripting language for principalExpression is Groovy.
Item A Item B Item C Item D Item E Item F
1David David
TomasDavidTomas
David David David
2David David
TomasDavidTomasAnita
David David David
3David David
TomasDavidTomasAnita
DavidAnita
DavidAnita
David
4David David David
AnitaDavidAnita
DavidAnita
David
5David David David
AnitaDavidAnita
DavidAnita
David
6 David David David David David David
For more information about Groovy, go to http://groovy.codehaus.org.
221

JasperReports Server User Guide
All access grants for a Domain are defined in a single security file that is attached to the Domain as a resource, as described in section 8.3, “Security and Locale Information for a Domain,” on page 218. The default access is granted.
When creating a security file, be sure to use the IDs of items and groups as they are defined in the Domain design file exported from the Domain Designer. For more information, see section 8.1.2, “Working With a Design File,” on page 202.
If you modify the Domain, you should also export the design file and update the security file with any IDs that have changed. Update the security file using the Change function on the Edit Domain page of the Domain Designer.
Figure 8-4 Changing a Security File in the Domain Designer
222

Advanced Domain Features
A typical security file has the following structure:
8.4.1 Row-Level SecurityRow-level security is specified in resourceAccessGrants. For each dataset from which data is returned by a query in the design file, a resourceAccessGrantList specifies the rows to which a user has access. Each grant is defined in a resourceAccessGrant that contains a principalExpression and a filterExpression.
A resourceAccessGrant must be defined for a joined resource if any query in the security definition has at least one item from the resource, even if that query does not include the related dataset.
Row-level security applies whenever access to a secured resource is requested, even if the request is indirect. For instance, a column in the Region table might be joined to a column in the Sales table. User Tomas has access to Region but not Sales. Tomas’s report uses columns from Region but he cannot see them because he does not have access to Sales.
</resourceAccessGrants>
</resourceAccessGrantList>
...
</resourceAccessGrants>
<securityDefinition xmlns="http://www.jaspersoft.com/2007/SL/XMLSchema"
version="1.0" itemGroupDefaultAccess="granted">
<resourceAccessGrants> <!-- Begin row-level security -->
<resourceAccessGrantList id="expense_join_resource_access_grant" label="aLabel"
resourceId="expense_join">
<resourceAccessGrants>
<resourceAccessGrant id="expense_join_ROLE_SUPERMART_MANAGER_store_row_grant">
<principalExpression>
authentication.getPrincipal().getRoles().any{ it.getRoleName() in
['ROLE_SUPERMART_MANAGER'] }
</principalExpression>
<filterExpression>s.store_country in ('USA') and s.store_state in ('CA')
</filterExpression>
</resourceAccessGrant>
...
<itemGroupAccessGrants> <!-- Begin column-level security -->
<itemGroupAccessGrantList id="expense_join_item_group_access_grant_group"
label="aLabel" itemGroupId="expense_join" defaultAccess="denied">
<itemGroupAccessGrants>
<itemGroupAccessGrant id="expense_join_super_user_item_group_grant"
access="granted">
<principalExpression>
authentication.getPrincipal().getRoles().any{ it.getRoleName() in
['ROLE_ADMINISTRATOR'] }
</principalExpression>
</itemGroupAccessGrant>
...
</itemGroupAccessGrants>
</itemGroupAccessGrantList>
...
</itemGroupAccessGrants>
</securityDefinition>
223
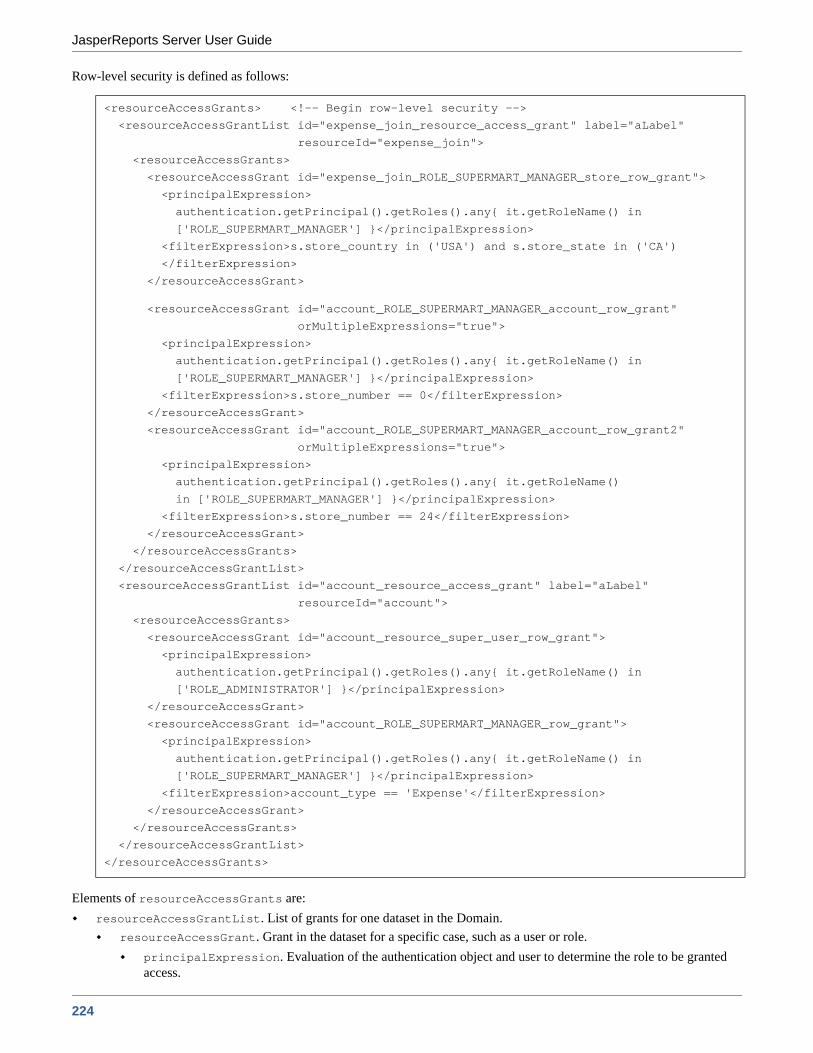
JasperReports Server User Guide
Row-level security is defined as follows:
Elements of resourceAccessGrants are:resourceAccessGrantList. List of grants for one dataset in the Domain.
resourceAccessGrant. Grant in the dataset for a specific case, such as a user or role.principalExpression. Evaluation of the authentication object and user to determine the role to be granted access.
<resourceAccessGrants> <!-- Begin row-level security -->
<resourceAccessGrantList id="expense_join_resource_access_grant" label="aLabel"
resourceId="expense_join">
<resourceAccessGrants>
<resourceAccessGrant id="expense_join_ROLE_SUPERMART_MANAGER_store_row_grant">
<principalExpression>
authentication.getPrincipal().getRoles().any{ it.getRoleName() in
['ROLE_SUPERMART_MANAGER'] }</principalExpression>
<filterExpression>s.store_country in ('USA') and s.store_state in ('CA')
</filterExpression>
</resourceAccessGrant>
<resourceAccessGrant id="account_ROLE_SUPERMART_MANAGER_account_row_grant"
orMultipleExpressions="true">
<principalExpression>
authentication.getPrincipal().getRoles().any{ it.getRoleName() in
['ROLE_SUPERMART_MANAGER'] }</principalExpression>
<filterExpression>s.store_number == 0</filterExpression>
</resourceAccessGrant>
<resourceAccessGrant id="account_ROLE_SUPERMART_MANAGER_account_row_grant2"
orMultipleExpressions="true">
<principalExpression>
authentication.getPrincipal().getRoles().any{ it.getRoleName()
in ['ROLE_SUPERMART_MANAGER'] }</principalExpression>
<filterExpression>s.store_number == 24</filterExpression>
</resourceAccessGrant>
</resourceAccessGrants>
</resourceAccessGrantList>
<resourceAccessGrantList id="account_resource_access_grant" label="aLabel"
resourceId="account">
<resourceAccessGrants>
<resourceAccessGrant id="account_resource_super_user_row_grant">
<principalExpression>
authentication.getPrincipal().getRoles().any{ it.getRoleName() in
['ROLE_ADMINISTRATOR'] }</principalExpression>
</resourceAccessGrant>
<resourceAccessGrant id="account_ROLE_SUPERMART_MANAGER_row_grant">
<principalExpression>
authentication.getPrincipal().getRoles().any{ it.getRoleName() in
['ROLE_SUPERMART_MANAGER'] }</principalExpression>
<filterExpression>account_type == 'Expense'</filterExpression>
</resourceAccessGrant>
</resourceAccessGrants>
</resourceAccessGrantList>
</resourceAccessGrants>
224

Advanced Domain Features
filterExpression. Filter on the dataset; determines the rows to which access is granted. Filters are applied to resource IDs. See the section 8.2, “The DomEL Syntax,” on page 214 for examples of valid filter expressions. For an alternative to writing filter expressions in Groovy, see the testProfileAttribute function in section 8.2.3, “Operators and Functions,” on page 216.
8.4.2 Column-Level SecurityColumn-level security is specified in itemGroupAccessGrants. An itemGroupAccessGrantList defines default access to one item group. Within the group, access is granted by user role in itemGroupAccessGrants. Access to items within an item group can be specified by itemAccessGrants.
Column-level security passes from parent object to child object unless specified otherwise: If access is unspecified for an object, the access of the parent object applies. If the unspecified object is an item in an item group, the item group’s access applies.If the unspecified object is an item in an item group that is nested in another item group, the access of the nearest parent item group applies to the item. If the nearest parent group’s access is also unspecified, that group takes its access from its parent group and passes it to the item. In this case (specified item group > unspecified item group > unspecified item), access for the item cannot be specified in an item-level grant. If access is specified for an item group but there is no item group principal expression matching the current user, the user has the item group’s default access, not the item group’s specified access. If a matching item group principal expression does exist, the user’s access to items depends on access specifications, if there are any. Access to other items depends on the item group’s specified access.If multiple item group principal expressions match the user (such as one expression for the user and one for his role), their access grants are combined, or ANDed, in a simple series. As a result, one denied statement overrides multiple granted statements.
225

JasperReports Server User Guide
Column-level security is defined as follows:
<itemGroupAccessGrants> <!-- Begin column-level security -->
<itemGroupAccessGrantList id="expense_join_item_group_access_grant_group" label="aLabel"
itemGroupId="expense_join" defaultAccess="denied">
<itemGroupAccessGrants>
<itemGroupAccessGrant id="expense_join_super_user_item_group_grant" access="granted">
<principalExpression>
authentication.getPrincipal().getRoles().any{ it.getRoleName() in
['ROLE_ADMINISTRATOR'] }</principalExpression>
</itemGroupAccessGrant>
<itemGroupAccessGrant id="ROLE_SUPERMART_MANAGER_item_group_access_grant"
access="granted">
<principalExpression>
authentication.getPrincipal().getRoles().any{ it.getRoleName() in
['ROLE_SUPERMART_MANAGER'] }</principalExpression>
<itemAccessGrantList id="expense_join_ROLE_SUPERMART_MANAGER_item_grant"
defaultAccess="denied">
<itemAccessGrants>
<itemAccessGrant id="itemAccessGrant1" itemId="ej_expense_fact_exp_date"
access="granted" />
</itemAccessGrants>
</itemAccessGrantList>
</itemGroupAccessGrant>
</itemGroupAccessGrants>
</itemGroupAccessGrantList>
<itemGroupAccessGrantList id="expense_join_store_item_group_access_grant_group"
label="aLabel" itemGroupId="expense_join_store" defaultAccess="denied">
<itemGroupAccessGrants>
<itemGroupAccessGrant id="expense_join_store_super_user_item_group_grant"
access="granted">
<principalExpression>
authentication.getPrincipal().getRoles().any{ it.getRoleName() in
['ROLE_ADMINISTRATOR'] }</principalExpression>
</itemGroupAccessGrant>
226

Advanced Domain Features
Elements of itemGroupAccessGrants are:itemGroupAccessGrantList. List of access grants to one item group. Specifies default access to the item group and all items in the group. If you want to restrict access to items outside of any group or set, create an itemGroupAccessGrantList for them where the id of the group is "".
itemGroupAccessGrant. Specifies access to the item group for one user role.principalExpression. Evaluation of the authentication object and user to determine the role to be granted or denied access.
itemAccessGrantList. List of access grants to items in the item group. Specifies default access to the items. Overrides default in itemGroupAccessGrantList.
itemAccessGrant. Specifies access to one item.
In the above example, the progression of column access grants is:Deny access to everyone. For each item group:
Grant group access to administrator roles. Grant group access to additional roles.For each additional role, deny access to specific items or, alternatively, deny access to all group items, then grant access to specific items.
Access is denied to everyone initially. Otherwise, all users would have complete access. Next, access to each item group is granted for administrator roles.
Next, access is defined for the SuperMart manager role. First, access is granted to each item group even though the access may be limited eventually. If access is not granted at the group level, the SuperMart manager has no access at all. Then, access to all items in the group is denied, followed by grants to specific items.
<itemGroupAccessGrant id="ROLE_SUPERMART_MANAGER_store_item_group_access_grant"
access="granted">
<principalExpression>
authentication.getPrincipal().getRoles().any{ it.getRoleName() in
['ROLE_SUPERMART_MANAGER'] }</principalExpression>
<itemAccessGrantList id="expense_join_ROLE_SUPERMART_MANAGER_store_item_grant"
defaultAccess="denied">
<itemAccessGrants>
<itemAccessGrant id="itemAccessGrant3" itemId="ej_store_store_type"
access="granted" />
<itemAccessGrant id="itemAccessGrant4" itemId="ej_store_region_id"
access="granted" />
<itemAccessGrant id="itemAccessGrant5" itemId="ej_store_store_name"
access="granted" />
<itemAccessGrant id="itemAccessGrant6" itemId="ej_store_store_number"
access="granted" />
<itemAccessGrant id="itemAccessGrant7" itemId="ej_expense_fact_exp_date"
access="granted" />
<itemAccessGrant id="itemAccessGrant8" itemId="ej_expense_fact_amount"
access="granted" />
</itemAccessGrants>
</itemAccessGrantList>
</itemGroupAccessGrant>
</itemGroupAccessGrants>
</itemGroupAccessGrantList>
</itemGroupAccessGrants>
227
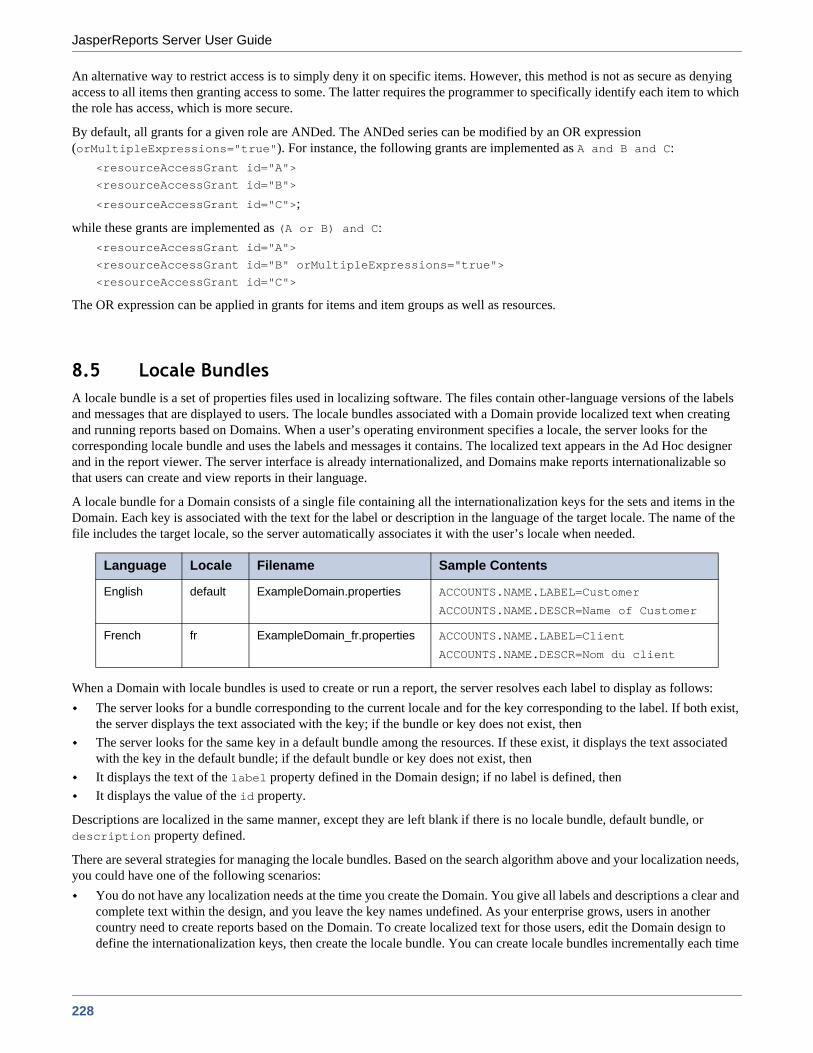
JasperReports Server User Guide
An alternative way to restrict access is to simply deny it on specific items. However, this method is not as secure as denying access to all items then granting access to some. The latter requires the programmer to specifically identify each item to which the role has access, which is more secure.
By default, all grants for a given role are ANDed. The ANDed series can be modified by an OR expression (orMultipleExpressions="true"). For instance, the following grants are implemented as A and B and C:
<resourceAccessGrant id="A">
<resourceAccessGrant id="B">
<resourceAccessGrant id="C">;
while these grants are implemented as (A or B) and C: <resourceAccessGrant id="A">
<resourceAccessGrant id="B" orMultipleExpressions="true">
<resourceAccessGrant id="C">
The OR expression can be applied in grants for items and item groups as well as resources.
8.5 Locale BundlesA locale bundle is a set of properties files used in localizing software. The files contain other-language versions of the labels and messages that are displayed to users. The locale bundles associated with a Domain provide localized text when creating and running reports based on Domains. When a user’s operating environment specifies a locale, the server looks for the corresponding locale bundle and uses the labels and messages it contains. The localized text appears in the Ad Hoc designer and in the report viewer. The server interface is already internationalized, and Domains make reports internationalizable so that users can create and view reports in their language.
A locale bundle for a Domain consists of a single file containing all the internationalization keys for the sets and items in the Domain. Each key is associated with the text for the label or description in the language of the target locale. The name of the file includes the target locale, so the server automatically associates it with the user’s locale when needed.
When a Domain with locale bundles is used to create or run a report, the server resolves each label to display as follows:The server looks for a bundle corresponding to the current locale and for the key corresponding to the label. If both exist, the server displays the text associated with the key; if the bundle or key does not exist, thenThe server looks for the same key in a default bundle among the resources. If these exist, it displays the text associated with the key in the default bundle; if the default bundle or key does not exist, thenIt displays the text of the label property defined in the Domain design; if no label is defined, thenIt displays the value of the id property.
Descriptions are localized in the same manner, except they are left blank if there is no locale bundle, default bundle, or description property defined.
There are several strategies for managing the locale bundles. Based on the search algorithm above and your localization needs, you could have one of the following scenarios:
You do not have any localization needs at the time you create the Domain. You give all labels and descriptions a clear and complete text within the design, and you leave the key names undefined. As your enterprise grows, users in another country need to create reports based on the Domain. To create localized text for those users, edit the Domain design to define the internationalization keys, then create the locale bundle. You can create locale bundles incrementally each time
Language Locale Filename Sample Contents
English default ExampleDomain.properties ACCOUNTS.NAME.LABEL=Customer
ACCOUNTS.NAME.DESCR=Name of Customer
French fr ExampleDomain_fr.properties ACCOUNTS.NAME.LABEL=Client
ACCOUNTS.NAME.DESCR=Nom du client
228
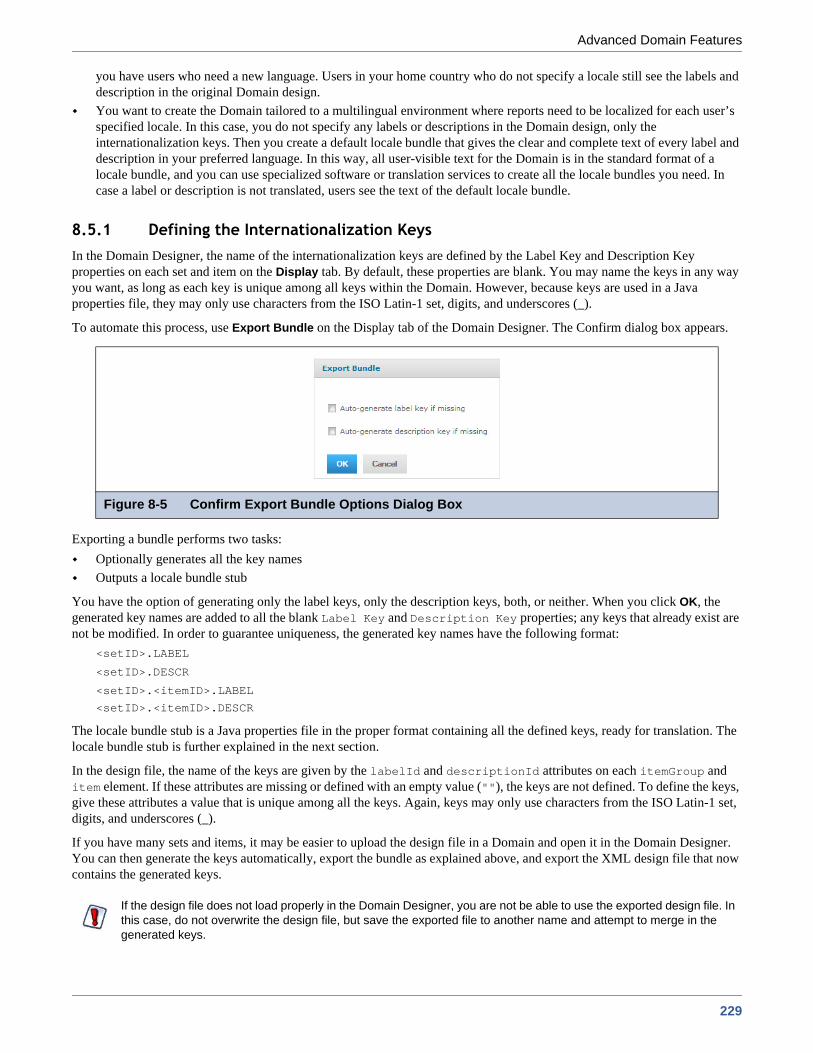
Advanced Domain Features
you have users who need a new language. Users in your home country who do not specify a locale still see the labels and description in the original Domain design.You want to create the Domain tailored to a multilingual environment where reports need to be localized for each user’s specified locale. In this case, you do not specify any labels or descriptions in the Domain design, only the internationalization keys. Then you create a default locale bundle that gives the clear and complete text of every label and description in your preferred language. In this way, all user-visible text for the Domain is in the standard format of a locale bundle, and you can use specialized software or translation services to create all the locale bundles you need. In case a label or description is not translated, users see the text of the default locale bundle.
8.5.1 Defining the Internationalization KeysIn the Domain Designer, the name of the internationalization keys are defined by the Label Key and Description Key properties on each set and item on the Display tab. By default, these properties are blank. You may name the keys in any way you want, as long as each key is unique among all keys within the Domain. However, because keys are used in a Java properties file, they may only use characters from the ISO Latin-1 set, digits, and underscores (_).
To automate this process, use Export Bundle on the Display tab of the Domain Designer. The Confirm dialog box appears.
Exporting a bundle performs two tasks:Optionally generates all the key namesOutputs a locale bundle stub
You have the option of generating only the label keys, only the description keys, both, or neither. When you click OK, the generated key names are added to all the blank Label Key and Description Key properties; any keys that already exist are not be modified. In order to guarantee uniqueness, the generated key names have the following format:
<setID>.LABEL
<setID>.DESCR
<setID>.<itemID>.LABEL
<setID>.<itemID>.DESCR
The locale bundle stub is a Java properties file in the proper format containing all the defined keys, ready for translation. The locale bundle stub is further explained in the next section.
In the design file, the name of the keys are given by the labelId and descriptionId attributes on each itemGroup and item element. If these attributes are missing or defined with an empty value (""), the keys are not defined. To define the keys, give these attributes a value that is unique among all the keys. Again, keys may only use characters from the ISO Latin-1 set, digits, and underscores (_).
If you have many sets and items, it may be easier to upload the design file in a Domain and open it in the Domain Designer. You can then generate the keys automatically, export the bundle as explained above, and export the XML design file that now contains the generated keys.
Figure 8-5 Confirm Export Bundle Options Dialog Box
If the design file does not load properly in the Domain Designer, you are not be able to use the exported design file. In this case, do not overwrite the design file, but save the exported file to another name and attempt to merge in the generated keys.
229

JasperReports Server User Guide
8.5.2 Creating Locale Bundle FilesA locale bundle for a Domain is a Java properties file where each property name is a unique internationalization key from one of the labels or descriptions in the design. The value of each property is the text for the label or description in the target language. The name of the file identifies the locale in the form <any_name>_<locale>.properties, where <locale> is any Java-compliant locale identifier, for example fr or fr_CA. If the _<locale> part of the file name is omitted, the file designates the strings for the default locale.
Usually, the set of keys is identical in the properties file of each locale bundle, but this is not necessary. The text for a given key in a given locale is determined by the algorithm given in section 8.5, “Locale Bundles,” on page 228.
Often, it is simplest to create the properties files from the stub exported by the Domain Designer. Whether you have created the design in the Domain Designer or in an external file uploaded to the Domain Designer, use Export Bundle in the menu bar to export a blank properties file. Optionally, you may generate any missing keys, as described in the previous section.
The following example shows part of the properties file output for the Domain created in section 6.2, “Example of Creating a Domain,” on page 150. All of the internationalization keys were generated automatically as well. As the example shows, sets and items in the bundle stub appear in the same order as on the Display tab of the Domain Designer:
The syntax for the properties file is the same as for Java properties files. Generally, everything after the = symbol is part of the translated text. Java properties files use the ISO-8859-1 (Latin-1) encoding that supports most, but not all, accented characters. For accented characters that are not in ISO-8859-1, or any other international characters, use Unicode escape sequences. For example, the œ character has the Unicode escape sequence \u0153.
The following example shows the French translation for the properties file above, including accented characters.
ACCOUNTS.LABEL=
ACCOUNTS.DESCR=
ACCOUNTS.NAME.LABEL=
ACCOUNTS.NAME.DESCR=
ACCOUNTS.ACCOUNT_TYPE.LABEL=
ACCOUNTS.ACCOUNT_TYPE.DESCR=
ACCOUNTS.INDUSTRY.LABEL=
ACCOUNTS.INDUSTRY.DESCR=
...
ACCOUNTS.CITY_AND_STATE.LABEL=
ACCOUNTS.CITY_AND_STATE.DESCR=
USERS1.LABEL=
USERS1.DESCR=
USERS1.FIRST_NAME.LABEL=
USERS1.FIRST_NAME.DESCR=
USERS1.LAST_NAME.LABEL=
USERS1.LAST_NAME.DESCR=
...
The single straight quote (') sometimes causes issues when processed in Domain properties files. To avoid this issue, use the right single quote (’) by its Unicode sequence \u2019, as shown in the following example.
230
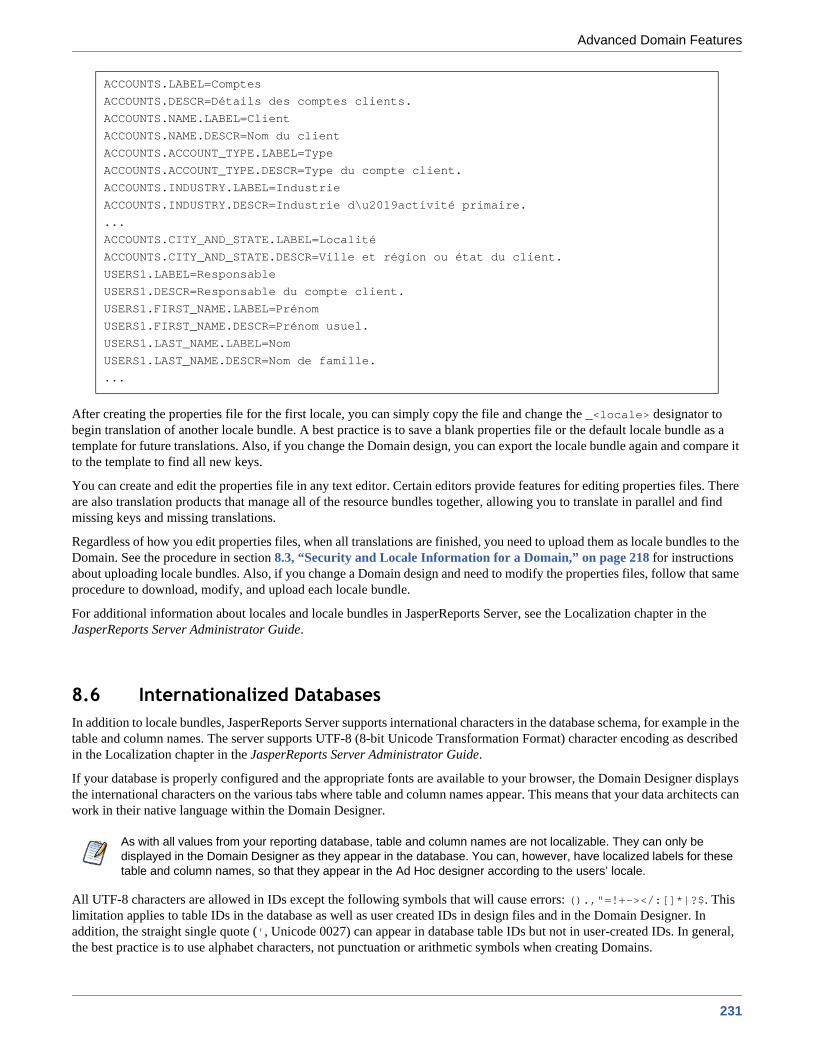
Advanced Domain Features
After creating the properties file for the first locale, you can simply copy the file and change the _<locale> designator to begin translation of another locale bundle. A best practice is to save a blank properties file or the default locale bundle as a template for future translations. Also, if you change the Domain design, you can export the locale bundle again and compare it to the template to find all new keys.
You can create and edit the properties file in any text editor. Certain editors provide features for editing properties files. There are also translation products that manage all of the resource bundles together, allowing you to translate in parallel and find missing keys and missing translations.
Regardless of how you edit properties files, when all translations are finished, you need to upload them as locale bundles to the Domain. See the procedure in section 8.3, “Security and Locale Information for a Domain,” on page 218 for instructions about uploading locale bundles. Also, if you change a Domain design and need to modify the properties files, follow that same procedure to download, modify, and upload each locale bundle.
For additional information about locales and locale bundles in JasperReports Server, see the Localization chapter in the JasperReports Server Administrator Guide.
8.6 Internationalized DatabasesIn addition to locale bundles, JasperReports Server supports international characters in the database schema, for example in the table and column names. The server supports UTF-8 (8-bit Unicode Transformation Format) character encoding as described in the Localization chapter in the JasperReports Server Administrator Guide.
If your database is properly configured and the appropriate fonts are available to your browser, the Domain Designer displays the international characters on the various tabs where table and column names appear. This means that your data architects can work in their native language within the Domain Designer.
All UTF-8 characters are allowed in IDs except the following symbols that will cause errors: ().,"=!+-></:[]*|?$. This limitation applies to table IDs in the database as well as user created IDs in design files and in the Domain Designer. In addition, the straight single quote (', Unicode 0027) can appear in database table IDs but not in user-created IDs. In general, the best practice is to use alphabet characters, not punctuation or arithmetic symbols when creating Domains.
ACCOUNTS.LABEL=Comptes
ACCOUNTS.DESCR=Détails des comptes clients.
ACCOUNTS.NAME.LABEL=Client
ACCOUNTS.NAME.DESCR=Nom du client
ACCOUNTS.ACCOUNT_TYPE.LABEL=Type
ACCOUNTS.ACCOUNT_TYPE.DESCR=Type du compte client.
ACCOUNTS.INDUSTRY.LABEL=Industrie
ACCOUNTS.INDUSTRY.DESCR=Industrie d\u2019activité primaire.
...
ACCOUNTS.CITY_AND_STATE.LABEL=Localité
ACCOUNTS.CITY_AND_STATE.DESCR=Ville et région ou état du client.
USERS1.LABEL=Responsable
USERS1.DESCR=Responsable du compte client.
USERS1.FIRST_NAME.LABEL=Prénom
USERS1.FIRST_NAME.DESCR=Prénom usuel.
USERS1.LAST_NAME.LABEL=Nom
USERS1.LAST_NAME.DESCR=Nom de famille.
...
As with all values from your reporting database, table and column names are not localizable. They can only be displayed in the Domain Designer as they appear in the database. You can, however, have localized labels for these table and column names, so that they appear in the Ad Hoc designer according to the users’ locale.
231
JasperReports Server User Guide
8.7 Copying a DomainIn some cases, for example, when you are making extensive changes to a Domain using the Domain designer, you may wish to create a copy of a Domain. Because each Domain has a Resource ID, you must copy the Domain to a different folder in the repository.
To copy a Domain via the UI:1. Log in to the server as an administrator and select View > Search Results.2. Locate the Domain.
a. Choose View > Search Results.b. In the Filters panel, under Types, click More choices. c. Click Domains.
3. Right-click an existing Domain and select Copy from the context-menu.4. Select View > Repository from the menu. 5. Right-click a folder that does not contain the original Domain and select Paste from the context-menu.
8.8 Switching the Data Source of a DomainYou can select a different data source for a Domain on the Edit Domain page or in the Manage Data Source dialog box. However, because the Domain design relies extensively on the data source, it is likely that some tables in your Domain won’t be valid and information such as derived tables and calculated fields will be lost. Always back up a Domain before switching the data source, and make sure that the change makes sense for this Domain and data source. Examples where it may make sense to switch the data source include:
Switching to a data source with a different database schema but with the same tables; for example, when moving from staging to production. Switching from a regular data source to a virtual data source that contains the original data source. In this case, JasperReports Server attempts to locate the original data source inside the virtual data source and create the correct prefix. Derived tables and calculated fields are not preserved. Switching from a virtual data source to one of the data sources it includes. In this case, any resources that are not in the selected data source are deleted along with any dependent information, such as joins or labels that depend on the deleted resources. Derived tables and calculated fields are not preserved.
To change the data source of a Domain:1. Log in to the server as an administrator and select View > Search Results.2. Locate the Domain.
a. Choose View > Search Results.b. In the Filters panel, under Types, click More choices. c. Click Domains.
3. Create a copy of the Domain as described in section 8.7, “Copying a Domain,” on page 232.
To change the Resource ID of the Domain, export the Domain design file as described in section 8.1.1, “Exporting the Design File from a Domain,” on page 202, manually edit the Domain’s resource ID, then upload the design file as described in 8.1.4, “Uploading a Design File to a Domain,” on page 213.
If you change to a data source with a different schema structure, the definitions in the Domain design are no longer valid and you cannot save the Domain.
232

Advanced Domain Features
4. Locate the Domain again, right-click it and select Edit from the context menu.The Edit Domain page appears.
5. Export the Domain design file as described in section 8.1.1, “Exporting the Design File from a Domain,” on page 202. You can use this file to help reconstruct any derived tables or calculated fields.
6. In the Name field, change the display name of the Domain. 7. In the Description field, change the description of the Domain.8. In the Data Source field, browse to locate a new data source for the Domain. 9. Click Edit with Domain Designer. If you are working with a virtual data source and the database schema used by the
original Domain is not available in the data source, you are asked if you want to select a schema. Select Yes to select one or more schemas and click OK; the first schema you select is added to the name of the tables in the Domain. Select No to remove all schema prefixes from the tables in the Domain.
10. Click Submit to update the Domain. To close the Domain Designer without modifying the Domain stored in the repository, click Cancel.
As mentioned above, in some cases, derived tables and calculated fields will be missing. You may also see invalid tables. You can work with the copy of your original Domain and its exported design file to determine the modifications you need to make to fully restore your domain. For more information, you can export the design file of the modified Domain, as described in section 8.1.1, “Exporting the Design File from a Domain,” on page 202, and compare it to the design file of the original Domain.
Figure 8-6 Edit Domain Page
233

JasperReports Server User Guide
234

Glossary
GLOSSARY
Ad Hoc Editor
The interactive data explorer in JasperReports Server Professional and Enterprise editions. Starting from a predefined collection of fields, the Ad Hoc Editor lets you drag and drop fields, dimensions, and measures to explore data and create tables, charts, and crosstabs. These Ad Hoc views can be saved as reports.
Ad Hoc Report
In previous versions of JasperReports Server, a report created through the Ad Hoc Editor. Such reports could be added to dashboards and be scheduled, but when edited in iReport, lost their grouping and sorting. In the current version, the Ad Hoc Editor is used to explore views which in turn can be saved as reports. Such reports can be edited in iReport and Jaspersoft Studio without loss, and can be scheduled and added to dashboards.
Ad Hoc View
A view of data that is based on a Domain, Topic, or OLAP client connection. An Ad Hoc view can be a table, chart, or crosstab and is the entry point to analysis operations such as slice and dice, drill down, and drill through. Compare OLAP View. You can save an Ad Hoc view as a report in order to edit it in the interactive viewer, schedule it, or add it to a dashboard.
Analysis View
See OLAP View.
Audit Archiving
To prevent audit logs from growing too large to be easily accessed, the installer configures JasperReports Server to move current audit logs to an archive after a certain number of days, and to delete logs in the archive after a certain age. The archive is another table in the JasperReports Server’s repository database.
Audit Domains
A Domain that accesses audit data in the repository and lets administrators create Ad Hoc reports of server activity. There is one Domain for current audit logs and one for archived logs.
Audit Logging
When auditing is enabled, audit logging is the active recording of who used JasperReports Server to do what when. The system installer can configure what activities to log, the amount of detail gathered, and when to archive the data. Audit logs are stored in the same private database that JasperReports Server uses to store the repository, but the data is only accessible through the audit Domains.
Auditing
A feature of JasperReports Server Enterprise edition that records all server activity and allows administrators to view the data.
235

JasperReports Server User Guide
Calculated Field
In a Domain, a field whose value is calculated from a user-written formula that may include any number of fields, operators, and constants. A calculated field is defined in the Domain Designer, and it becomes one of the items to which the Domain’s security file and locale bundles can apply.
CRM
Customer Relationship Management. The practice of managing every facet of a company’s interactions with its clientele. CRM applications help businesses track and support their customers.
CrossJoin
An MDX function that combines two or more dimensions into a single axis (column or row).
Cube
The basis of most OLAP applications, a cube is a data structure that contains three or more dimensions that categorize the cube’s quantitative data. When you navigate the data displayed in an OLAP view, you are exploring a cube.
Custom Field
In the Ad Hoc Editor, a field that is created through menu items as a simple function of one or two available fields, including other custom fields. When a custom field becomes too complex or needs to be used in many reports, it is best to define it as a calculated field in a Domain.
Dashboard
A collection of reports, input controls, graphics, labels, and web content displayed in a single, integrated view. Dashboards often present a high level view of your data, but input controls can parameterize the data to display. For example, you can narrow down the data to a specific date range. Embedded web content, such as other web-based applications or maps, make dashboards more interactive and functional.
Derived Table
In a Domain, a derived table is defined by an additional query whose result becomes another set of items available in the Domain. For example, with a JDBC data source, you can write an SQL query that includes complex functions for selecting data. You can use the items in a derived table for other operations on the Domain, such as joining tables, defining a calculated field, or filtering. The items in a derived table can also be referenced in the Domain’s security file and locale bundles.
Data Policy
In JasperReports Server, a setting that determines how the server processes and caches data used by Ad Hoc reports. Select your data policies by clicking Manage > Ad Hoc Settings.
Data Source
Defines the connection properties that JasperReports Server needs to access data. The server transmits queries to data sources and obtains datasets in return for use in filling reports and previewing Ad Hoc reports. JasperReports Server supports JDBC, JNDI, and Bean data sources; custom data sources can be defined as well.
Dataset
A collection of data arranged in columns and rows. Datasets are equivalent to relational results sets and the JRDataSource type in the JasperReports Library.
Datatype
In JasperReports Server, a datatype is used to characterize a value entered through an input control. A datatype must be of type text, number, date, or date-time. It can include constraints on the value of the input, for example maximum and minimum values. As such, a datatype in JasperReports Server is more structured than a datatype in most programming languages.
Denormalize
A process for creating table joins that speeds up data retrieval at the cost of having duplicate row values between some columns.
236
Glossary
Dice
An OLAP operation to select columns.
Dimension
A categorization of the data in a cube. For example, a cube that stores data about sales figures might include dimensions such as time, product, region, and customer’s industry.
Domain
A virtual view of a data source that presents the data in business terms, allows for localization, and provides data-level security. A Domain is not a view of the database in relational terms, but it implements the same functionality within JasperReports Server. The design of a Domain specifies tables in the database, join clauses, calculated fields, display names, and default properties, all of which define items and sets of items for creating Ad Hoc reports.
Domain Topic
A Topic that is created from a Domain by the Data Chooser. A Domain Topic is based on the data source and items in a Domain, but it allows further filtering, user input, and selection of items. Unlike a JRXML-based Topic, a Domain Topic can be edited in JasperReports Server by users with the appropriate permissions.
Drill
To click on an element of an OLAP view to change the data that is displayed:Drill down. An OLAP operation that exposes more detailed information down the hierarchy levels by delving deeper into the hierarchy and updating the contents of the navigation table.Drill through. An OLAP operation that displays detailed transactional data for a given aggregate measure. Click a fact to open a new table beneath the main navigation table; the new table displays the low-level data that constitutes the data that was clicked.Drill up. An OLAP operation for returning the parent hierarchy level to view to summary information.
Eclipse
An open source Integrated Development Environment (IDE) for Java and other programming languages, such as C/C++.
ETL
Extract, Transform, Load. A process that retrieves data from transactional systems, and filters and aggregates the data to create a multidimensional database. Generally, ETL prepares the database that your reports will access. The Jaspersoft ETL product lets you define and schedule ETL processes.
Fact
The specific value or aggregate value of a measure for a particular member of a dimension. Facts are typically numeric.
Field
A field is equivalent to a column in the relational database model. Fields originate in the structure of the data source, but you may define calculated fields in a Domain or custom fields in the Ad Hoc Editor. Any type of field, along with its display name and default formatting properties, is called an item and may be used in the Ad Hoc Editor.
Frame
A dashboard element that displays reports or custom URLs. Frames can be mapped to input controls if their content can accept parameters.
Group
In a report, a group is a set of data rows that have an identical value in a designated field.In a table, the value appears in a header and footer around the rows of the group, while the other fields appear as columns.In a chart, the field chosen to define the group becomes the independent variable on the X axis, while the other fields of each group are used to compute the dependent value on the Y axis.
Hierarchy Level
In an OLAP cube, a member of a dimension containing a group of members.
237

JasperReports Server User Guide
Input Control
A button, check box, drop-down list, text field, or calendar icon that allows users to enter a value when running a report or viewing a dashboard that accepts input parameters. For JRXML reports, input controls and their associated datatypes must be defined as repository objects and explicitly associated with the report. For Domain-based reports that prompt for filter values, the input controls are defined internally. When either type of report is used in a dashboard, its input controls are available to be added as special content.
iReport Designer
An open source tool for graphically designing reports that leverage all features of the JasperReports Library. The Jaspersoft iReport Designer lets you drag and drop fields, charts, and sub-reports onto a canvas, and also define parameters or expressions for each object to create pixel-perfect reports. You can generate the JRXML of the report directly in iReport, or upload it to JasperReports Server. iReport is implemented in NetBeans.
Item
When designing a Domain or creating a Topic based on a Domain, an item is the representation of a database field or a calculated field along with its display name and formatting properties defined in the Domain. Items can be grouped in sets and are available for use in the creation of Ad Hoc reports.
JasperReport
A combination of a report template and data that produces a complex document for viewing, printing, or archiving information. In the server, a JasperReport references other resources in the repository:
The report template (in the form of a JRXML file)Information about the data source that supplies data for the reportAny additional resources, such as images, fonts, and resource bundles referenced by the report template.
The collection of all the resources that are referenced in a JasperReport is sometimes called a report unit. End users usually see and interact with a JasperReport as a single resource in the repository, but report creators must define all of the components in the report unit.
JasperReports Library
An embeddable, open source, Java API for generating a report, filling it with current data, drawing charts and tables, and exporting to any standard format (HTML, PDF, Excel, CSV, and others). JasperReports processes reports defined in JRXML, an open XML format that allows the report to contain expressions and logic to control report output based on run-time data.
JasperReports Server
A commercial open source, server-based application that calls the JasperReports library to generate and share reports securely. JasperReports Server authenticates users and lets them upload, run, view, schedule, and send reports from a web browser. Commercial versions provide metadata layers, interactive report and dashboard creation, and enterprise features such as organizations and auditing.
Jaspersoft ETL
A graphical tool for designing and implementing your data extraction, transforming, and loading (ETL) tasks. It provides hundreds of data source connectors to extract data from many relational and non-relational systems. Then, it schedules and performs data aggregation and integration into data marts or data warehouses that you use for reporting.
Jaspersoft OLAP
A relational OLAP server integrated into JasperReports Server that performs data analysis with MDX queries. The product includes query builders and visualization clients that help users explore and make sense of multidimensional data. Jaspersoft OLAP also supports XML/A connections to remote servers.
Jaspersoft Studio
An open source tool for graphically designing reports that leverage all features of the JasperReports Library. Jaspersoft Studio lets you drag and drop fields, charts, and sub-reports onto a canvas, and also define parameters or expressions for each object to create pixel-perfect reports. You can generate the JRXML of the report directly in JasperSoft Studio, or upload it to JasperReports Server. Jaspersoft Studio is implemented in Eclipse.
238
Glossary
JavaBean
A reusable Java component that can be dropped into an application container to provide standard functionality.
JDBC
Java Database Connectivity. A standard interface that Java applications use to access databases.
JNDI
Java Naming and Directory Interface. A standard interface that Java applications use to access naming and directory services.
Join Tree
In Domains, a collection of joined tables from the actual data source. A join is the relational operation that associates the rows of one table with the rows of another table based on a common value in given field of each table. Only the fields in a same join tree or calculated from the fields in a same join tree may appear together in a report.
JPivot
An open source graphical user interface for OLAP operations. For more information, visit http://jpivot.sourceforge.net/.
JRXML
An XML file format for saving and sharing reports created for the JasperReports Library and the applications that use it, such as iReport Designer and JasperReports Server. JRXML is an open format that uses the XML standard to define precisely all the structure and configuration of a report.
MDX
Multidimensional Expression Language. A language for querying multidimensional objects, such as OLAP (On Line Analytical Processing) cubes, and returning cube data for analytical processing. An MDX query is the query that determines the data displayed in an OLAP view.
Measure
Depending on the context:In a report, a formula that calculates the values displayed in a table’s columns, a crosstab’s data values, or a chart’s dependent variable (such as the slices in a pie).In an OLAP view, a formula that calculates the facts that constitute the quantitative data in a cube.
Mondrian
A Java-based, open source multidimensional database application.
Mondrian Connection
An OLAP client connection that consists of an OLAP schema and a data source. OLAP client connections populate OLAP views.
Mondrian Schema Editor
An open source Eclipse plug-in for creating Mondrian OLAP schemas.
Mondrian XML/A Source
A server-side XML/A source definition of a remote client-side XML/A connection used to populate an OLAP view using the XML/A standard.
MySQL
An open source relational database management system. For information, visit http://www.mysql.com/.
Navigation Table
The main table in an OLAP view that displays measures and dimensions as columns and rows.
239
JasperReports Server User Guide
ODBO Connect
Jaspersoft ODBO Connect enables Microsoft Excel 2003 and 2007 Pivot Tables to work with Jaspersoft OLAP and other OLAP servers that support the XML/A protocol. After setting up the Jaspersoft ODBO data source, business analysts can use Excel Pivot Tables as a front-end for OLAP analysis.
OLAP
On Line Analytical Processing. Provides multidimensional views of data that help users analyze current and past performance and model future scenarios.
OLAP Client Connection
A definition for retrieving data to populate an OLAP view. An OLAP client connection is either a direct Java connection (Mondrian connection) or an XML-based API connection (XML/A connection).
OLAP Schema
A metadata definition of a multidimensional database. In Jaspersoft OLAP, schemas are stored in the repository as XML file resources.
OLAP View
Also called an analysis view. A view of multidimensional data that is based on an OLAP client connection and an MDX query. Unlike Ad Hoc views, you can directly edit an OLAP view’s MDX query to change the data and the way they are displayed. An OLAP view is the entry point for advanced analysis users who want to write their own queries. Compare Ad Hoc View.
Organization
A set of users that share folders and resources in the repository. An organization has its own user accounts, roles, and root folder in the repository to securely isolate it from other organizations that may be hosted on the same instance of JasperReports Server.
Organization Admin
Also called the organization administrator. A user in an organization with the privileges to manage the organization’s user accounts and roles, repository permissions, and repository content. An organization admin can also create suborganizations and mange all of their accounts, roles, and repository objects. The default organization admin in each organization is the jasperadmin account.
Outlier
A fact that seems incongruous when compared to other member’s facts. For example, a very low sales figure or a very high number of helpdesk tickets. Such outliers may indicate a problem (or an important achievement) in your business. The analysis features of Jaspersoft OLAP excel at revealing outliers.
Parameter
Named values that are passed to the engine at report-filling time to control the data returned or the appearance and formatting of the report. A report parameter is defined by its name and type. In JasperReports Server, parameters can be mapped to input controls that users can interact with.
Pivot
To rotate a crosstab such that its row groups become column groups and its column groups become rows. In the Ad Hoc Editor, pivot a crosstab by clicking .
Pivot Table
A table with two physical dimensions (for example, X and Y axis) for organizing information containing more than two logical dimensions (for example, PRODUCT, CUSTOMER, TIME, and LOCATION), such that each physical dimension is capable of representing one or more logical dimensions, where the values described by the dimensions are aggregated using a function such as SUM. Pivot tables are used in Jaspersoft OLAP.
240

Glossary
Properties
Settings associated with an object. The settings determine certain features of the object, such as its color and label. Properties are normally editable. In Java, properties can be set in files listing objects and their settings.
Report
In casual usage, report may refer to:A JasperReport. See JasperReport.The main JRXML in a JasperReport. The file generated when a JasperReport is scheduled. Such files are also called content resources or output files.The file generated when a JasperReport is run and then exported.In previous JasperReoprts Server versions, a report created in the Ad Hoc Editor. See Ad Hoc Report.
Repository
The tree structure of folders that contain all saved reports, dashboards, OLAP views, and resources. Users access the repository through the JasperReports Server web interface or through iReport. Applications can access the repository through the web service API. Administrators use the import and export utilities to back up the repository contents.
Resource
In JasperReports Server, anything residing in the repository, such as an image, file, font, data source, Topic, Domain, report element, saved report, report output, dashboard, or OLAP view. Resources also include the folders in the repository. Administrators set user and role-based access permissions on repository resources to establish a security policy.
Role
A security feature of JasperReports Server. Administrators create named roles, assign them to user accounts, and then set access permissions to repository objects based on those roles. Certain roles also determine what functionality and menu options are displayed to users in the JasperReports Server interface.
Schema
A logical model that determines how data is stored. For example, the schema in a relational database is a description of the relationships between tables, views, and indexes. In Jaspersoft OLAP, an OLAP schema is the logical model of the data that appears in an OLAP view; they are uploaded to the repository as resources. For Domains, schemas are represented in XML design files.
Schema Workbench
A graphical tool for easily designing OLAP schemas, data security schemas, and MDX queries. The resulting cube and query definitions can then be used in Jaspersoft OLAP to perform simple but powerful analysis of large quantities of multi-dimensional data stored in standard RDBMS systems.
Set
In Domains and Domain Topics, a named collection of items grouped together for ease of use in the Ad Hoc Editor. A set can be based on the fields in a table or entirely defined by the Domain creator, but all items in a set must originate in the same join tree. The order of items in a set is preserved.
Slice
An OLAP operation for filtering data rows.
SQL
Structured Query Language. A standard language used to access and manipulate data and schemas in a relational database.
System Admin
Also called the system administrator. A user who has unlimited access to manage all organizations, users, roles, repository permissions, and repository objects across the entire JasperReports Server instance. The system admin can create root-level organizations and manage all server settings. The default system admin is the superuser account.
241
JasperReports Server User Guide
Topic
A JRXML file created externally and uploaded to JasperReports Server as a basis for Ad Hoc reports. Topics are created by business analysts to specify a data source and a list of fields with which business users can create reports in the Ad Hoc Editor. Topics are stored in the Ad Hoc Components folder of the repository and displayed when a user launches the Ad Hoc Editor.
Transactional Data
Data that describe measurable aspects of an event, such as a retail transaction, relevant to your business. Transactional data are often stored in relational databases, with one row for each event and a table column or field for each measure.
User
Depending on the context:A person who interacts with JasperReports Server through the web interface. There are generally three categories of users: administrators who install and configure JasperReports Server, database experts or business analysts who create data sources and Domains, and business users who create and view reports and dashboards. A user account that has an ID and password to enforce authentication. Both people and API calls accessing the server must provide the ID and password of a valid user account. Roles are assigned to user accounts to determine access to objects in the repository.
View
Several meanings pertain to JasperReports Server:An Ad Hoc view. See Ad Hoc View.An OLAP view. See OLAP View.A database view. See http://en.wikipedia.org/wiki/View_%28database%29.
Virtual Data Source
A virtual data source allows you to combine data residing in multiple JDBC and/or JNDI data sources into a single data source that can query the combined data. Once you have created a virtual data source, you create Domains that join tables across the data sources to define the relationships between the data sources.
WCF
Web Component Framework. A low-level GUI component of JPivot. For more information, see http://jpivot.sourceforge.net/wcf/index.html.
Web Services
A SOAP (Simple Object Access Protocol) API that enables applications to access certain features of JasperReports Server. The features include repository, scheduling and user administration tasks.
XML
eXtensible Markup language. A standard for defining, transferring, and interpreting data for use across any number of XML-enabled applications.
XML/A
XML for Analysis. An XML standard that uses Simple Object Access protocol (SOAP) to access remote data sources. For more information, see http://www.xmla.org/
XML/A Connection
A type of OLAP client connection that consists of Simple Object Access Protocol (SOAP) definitions used to access data on a remote server. OLAP client connections populate OLAP views.
242

Index
INDEX
Aaccess grants
and scheduled reports 51Domain column-level 225Domain row level 223effect of grants 99, 220
Ad Hoc Editordefining filters in 87display mode 67exporting options 67how to use 61interaction with filters and input controls 87opening 61page options 68panels 62round function for custom fields 87saving views 67sources 62support for calculated (custom) fields 85tool bar 67
Ad Hoc View panelabout 67Layout Band 68
Ad Hoc viewsdecimal place support for 87laying out 65localizing 98saving 67
add function 86Add Resource 103adding a design file as a new Domain 214adding filters to advanced expressions 90adding reports 110advanced expression, editing 90advanced filters, editing 90alphabetical ascending 82alternate group 68
Always prompt 93AND 89area chart 76auto-refresh interval in dashboards 27available content 23
Bbar chart 76basic functions 86Boolean operators in Domains 41
Ccalculated fields 85cascading input controls 49, 126CGP 87chart reports
and dashboards 29display options 76levelspivoting 76sample Topic 76slidertheme for 197types of charts 73, 76unique features 76
chart views, compared with tables and crosstabs 65charts
Flash 44HTML5 44
Charts Pro 44collapse members 82column chart 76column-level security in Domains 225columns
conditional formatting 38formatting 37percent of column group parent 87show/hide 35
243
JasperReports Server User Guide
complex expressions 217conditional formatting 38constant calculated field 210controls. See input controls.count all 81Create menu, dashboard 12creating
dashboards 23–29Domain security files 220Domain Topics 99reports 36, 99, 101, 110
creating reportsfrom the Ad Hoc Editor 69from the Home page 12
crosstab reportsand dashboards 29collapse members 82column group parent 87exclude 81expand group 82expand members 82keep only 81percent of group 87pivoting 81row group parent 87sample size 67sample Topic 80setting data formats 81sorting 82switch to column group 76, 81switch to row group 76, 81unique features 80
crosstab views, compared with tables and charts 66custom fields
add 86basic functions 86date functions 86default name 87divide 86multiply 86operators 86overview 85percent of group parent 86percent of total 86rank 86renaming 87round 86special functions 86subtract 86swap fields 86
custom URL in dashboards 23, 26
Ddashboards
adding content 24adding custom URLs 23
adding logos 23area 24auto-refresh interval 27available items 23buttons 23containing other dashboards 30content deleted from repository 30creating 23–29custom URLs in 26deleting content 28design considerations 29designer 24editing 25, 29embedded 30exceed area 24HTTP v. FILE protocol 26input controls for 25, 29, 30limitations 30mapping input controls to URLs 27multiple selection 30opening 25overview 23parameters 30previewing 28refining the layout 28reports for 30screen size 29special content 28SuperMart dashboard 22title 28viewing 22working with 21–30
Data Chooser wizard 94, 94–99, 100data formats 81Data page 94Data Snapshots 35Data Source Selection panel, about 67data sources, access grants, and scheduled reports 51datatypes 114, 116date functions 86defaults, input controls 46–49, 114dependent reports 69design files
See also Domains.adding as a new Domain 214editing 203exporting 202filters 214itemGroups element 204items element 204joins 207Oracle schema name 203resources element 204schema element 204schemaLocation attribute 204
244

Index
structure 203–213uploading edited file 213version attribute 204xmlns attribute 204XSD 203
display mode 67distinct count 81divide function 86Domain Designer wizard 150, 151, 159, 161Domain Expression Language. See DomEL.Domain plug-in
input controls 195parametrized queries 195using in iReport 195
Domain Topicsediting 100effect of access grants 99, 220saving 99
DomainsSee also design files.access grants and scheduled reports 51Boolean comparison operators 41defined 147design file 201designing a Domain 150–??, 158–176Domain plug-in for iReport 186, 195DomEL 214editing 178effect of access grants 99, 220exporting designs to XML files 202filters 41, 218Groovy 221input controls 195item sets 156, 165joins 153, 163, 173locale bundles 228localization 228placeholders 180presentation and physical layers 221principal expressions 221profile attributes 216, 217properties files 228referential integrity 180samples 149saving as Topics. See Domain Topics.Simple Domain 149SuperMart Domain 149typical uses 147using a Domain for a report 93using a virtual data source 158
DomEL 214dynamic filters 87
EEditing advanced expressions 90editing, dashboard 25
Event Details page 60expand members 82exporting Domain designs to XML design files 202external resources 112
Ffields
Organization 11Search 15
FILE protocol 26filters
columns 35compared to input controls 87filtering items in Domains 41in Domain plug-in 195in Domains 218in repository searches 15in the Ad Hoc Editor 87, 92in the Report Viewer 35in Topics 87reports with 47settings 16types 16using 88
Filters panel, about 69fixed sizing 29Flash charts 44folders
Dashboards 22moving 18repository 192
formats for report output 43formatting
columns 35, 37conditional 38
Fusion 45
GGetting Started page
for administrators 13for end users 12icons 12return button 12
Groovy 216, 221groups
expanding and collapsing 82pivoting and switching 68
Hhelp 13hide scroll bars 24hiding detail rows 73HTML5 44
IIDs
organization 11sample user IDs 10
245

JasperReports Server User Guide
input controlsadding 114Always prompt option 123and dashboards 23, 25and parametrized queries 87cascading 49, 126check box type 118compared to filters 87dashboards 30date type 120default values 46–49, 114, 123design tips 30display differences in dashboards 30drop-down type 119in reports run from Domain plug-in 195in the Ad Hoc Editor 68, 87in the Report Viewer 34limitations 30list type 119localizing 26mapped to custom URLs 27, 30Optional JSP Location option 124pop-up page 47query type 121reports with 47reuse of 30running a report with 46text 115types 114using 91Visible property 123
installing JasperReports Server plug-in 186iReport
adding resources 192connecting to JasperServer 186creating JRXML file in 101designer 101Domain plug-in 186, 195JRXML files 193repository 187, 193running reports in 194
item sets 156, 165itemGroups element in design files 203, 204items element in design files 204
JJAR files 110, 112, 199JasperReport wizard
Controls & Resources 104, 111, 112, 124, 127Data Source 98, 106, 124edit report unit 127Query 106–109Set Up 98, 103, 111
Jaspersoft OLAP prerequisites 9Jobs List page 55jobs. See scheduling reports.
joinsin Domains 153, 163, 173security 221
JRXML filesand Domain Topics 99and Topics 97external resources 112field names in 98, 128in iReport 193suggested file resources 104to create a new report 103, 110uploading 102validating in iReport 102
LLayout Band 68layouts of views 65Library menu 12Library page
Created Date column 14Modified Date column 14
line chart 76locale bundles 228locales
expressions 128in Ad Hoc views 98showing 11
localization of Domains 228Locate File Resource page 105Locate Query page 107logging in
multiple organizations 11passwords 10with the default administrator login 10
MMaps Pro 44menus
Create 12View 12
messages about system events 59Messages page 60Microsoft SQL Server Analytical Services 85Microsoft SSAS 85multi-level slider. See slider.multiple organizations, logging in with 11multiple v. single controls in dashboard 23multiply function 86multi-tenant server 11
NNOT 89numeric ascending and descending 82
OOLAP
charts 74crosstabs 82
246

Index
online help 13operators, boolean operators 89options for output 53OR 89Oracle
choosing schemas 151, 160, 166, 167, 168, 169NVARCHAR2 169schema name in design file 203synonyms 169
output options, setting 53
Pparametrized queries
See also filters.adding input controls 114and dashboards 27dashboards 30in reports run from Domain plug-in 195in the Ad Hoc Editor 68, 87running a report with parametrized queries 46
passwords 10percent of group parent functions 86, 87percent of total function 86physical layer 221pie chart 76pivoting 68, 76, 81placeholders 180plug-ins
Domain 186, 195JasperReports Server 186
PostgreSQL, choosing schemas 151, 160, 169pre-filtering items in Domains 41prerequisites for Jaspersoft OLAP 9presentation layer 221preview 24principal expressions 221print view 23profile attributes 216properties, in locale bundles 228proportional sizing 29protocols, HTTP v. FILE 26
Qqueries
viewing SQL query in Ad Hoc Editor 68viewing the MDX query in the Ad Hoc Editor 84
query resource 107
Rrank function 86recurrence
calendar recurrence 57simple recurrence 56types 51
redo 34, 67referential integrity 180Removing filters from advanced expressions 90
report schedules, changing 55report units
adding to server 102complex 109overview 101saving 109
Report Viewer 47about 33Data Snapshots 35exporting 34saving reports 34toolbar 33
reportsSee also scheduling reports and running reports.adding 110attaching files 54changing schedules 55chart layout and formatting options 76creating 61, 99, 101, 110creating from an Ad Hoc view 69crosstab layout and formatting options 80crosstab vs. table and chart 94dependent 69design 19designing in the Ad Hoc Editor 61effect of access grants 51, 99, 220empty 54exporting report output 43filters in 47Flash-enabled 44input controls in 47job schedules, changing 55localization 128output options 53report output 43running 35, 58, 194sample size 67saving 124saving in the Report Viewer 34saving report output 43scheduling 50setting data formats 81simple 102sorting 72, 82submitting 109summarizing rows and columns 67table vs. crosstab and chart 94types 61unit 101with input controls 46
repositoryadding reports directly 101browsing 14folders 18in iReport 187, 193
247

JasperReports Server User Guide
list of reports 55overview 12panel 17resources 17searching 14system messages 59viewing 14
reset 23, 26resolution 29resource access permission 17resources
adding to iReport 192and Ad Hoc views 98and localizations 128bundles 130moving folders 18repository 17
resources element in design files 203, 204RGP 87round function 86row-level security in Domains 223rows, percent of row group parent 87running reports
See also reports and scheduling reports.example 35, 46Flash charts 44from iReport 194in the Ad Hoc Editor 69in the background 58on a schedule 51
Ssample Domains 149sample files
AllAccounts.jrxml 102, 103for JasperReports 19logo.jpg 102SalesByMonth.jrxml 111SalesByMonthDetail.jrxml 111
sample reportsAccounts 36Freight 47library 19SalesByMonth 111
sample size 67sample Topics
foodmart data for crosstab 80Simple Domain Topic 149
sample user IDs 10samples
about 19locating 19
Save Topic page 100saving reports 124Scheduler wizard 51–54scheduling
jobs 51reports 51wizard 51
scheduling reportsSee also reports and running reports.access grants and scheduled reports 51defining a job 51defining schedules 50editing a job 55recurrence 56stopping 56viewing job schedules 55
schema element in design files 203, 204schemaLocation attribute in design files 204schemas. See design files.screen sizes 29search field 15Search Results page 15searches
default settings 15filtering 15refining 16settings 15
searchingfilters 14repository 14
security filescolumn-level security 225effect of access grants 99filters 214principal expressions 221row-level security 223structure 220
servers, multi-tenant 11Set Up the Job pages 51Set Up the Report Page 103Set Up the Report page 111show scroll bars 24showing detail rows 73Simple Domain Topic 149single v. multiple controls in dashboard 23slice 81slidersorting
reports 35sorting reports 72, 82sorting views 68spacer 71special content in dashboards 23, 26special functions 86SSAS 85standard controls in dashboards 23submit 23, 26submitting reports 109subtract function 86
248

Index
SuperMart 22switch to column group 76, 81switch to row group 76, 81switching groups 68
Ttable reports
and dashboards 29compared with crosstab and chart 94hiding detail rows 73showing detail rows 73sorting 72spacer 71
table viewsdesigning layouts 65sorting 68
table views, compared with charts and crosstabs 65testProfileAttribute 216, 217text label 23themes, for charts 197tool bar 67Topics
See also Domain Topics.access grants and scheduled reports 51as JRXML files 97, 99creating 97defined 97field names in 98JRXML files 99localization 98parametrized queries 87saving Domains as Topics. See Domain Topics.Simple Domain Topic 149uploading 97
Topics and Domains page 93
Uundo 34, 67uploading edited design files 213URLs in dashboards 26
user IDslogging in 10sample 10
utilitiesiReport 186messages 59
Vversion attribute in design files 204View menu
contents 12Repository 14Search Results 14
viewingdashboards 22fields and data in a Domain Topic 99repository 14scheduled reports 51
viewing the SQL query 68views
designing layouts 65types 65
virtual data sourcecreating a Domain 158
WWidgets Pro 44wizards
Data Chooser 94, 94–99, 100Domain Designer 151, 161Domain Designer, edit Domain 100JasperReport. See JasperReport wizard.report scheduler 50Scheduler 51–54
XXML Domain design files 202xmlns attribute in design files 204XSD of Domain design file 203
249

JasperReports Server User Guide
250