Unified Learning Environment for Analytics & Data
24
Data Week – Day 1 May 24, 2021 Andrew Weaver, Mounir Benjelloun, Jason Wang Unified Learning Environment for Analytics & Data
Transcript of Unified Learning Environment for Analytics & Data

Data Week – Day 1May 24, 2021Andrew Weaver, Mounir Benjelloun, Jason Wang
Unified Learning Environment for Analytics & Data

Vision for ULEAD
SECURE ENVIRONMENTAnalysis inside UCLA Health security perimeter
SCALABLE ENVIRONMENTSupports growing business needs
UNIFIED ENVIRONMENTSingle location for data, analytics, and compute
FASTER DATA APPROVALReduce time for data release approvals
Users

ULEAD High-Level Architecture

Functionality of ULEAD Pilot
The ULEAD Pilot phase will allow the following activities:
CTSI1. Ability to provide data to researchers in ULEAD (flat files)
Researchers1. Ability to copy data provided by CTSI into a User Folder within
ULEAD2. Ability to bring other data into ULEAD3. Ability to connect to approved data sources4. Ability to blend data from CTSI with other data sources. E.g.
Cancer Registry, images, etc.5. Ability to load data into a database6. Ability to analyze and visualize data7. Limited ability to develop, train and test ML models8. Ability to summarize results and prepare reports/graphs9. Ability to share summarized data with the UCLA Health
research community, within ULEAD
ULEAD Specifications
The ULEAD pilot platform will offer each user the features listed below, and will support 250 concurrent users.
Virtual Desktop: Compute: 4 CPUs (10~ GHz), RAM: 32 GB. Can be increased on a case-to-case basis
Database: MS Access Software: Python, R, SQL Server, SAS Applications: Anaconda, Jupyter Notebook, R Studio, Visual
Studio, SSMS, MS Office (Word, Excel, Powerpoint, Access), Pycharm, Adobe Acrobat, SAS, MATLAB. For licensed software such as SAS and MATLAB, users must
bring their own license Personal Storage: User Folder within ULEAD. 50GB+ storage Can
be increased on a case-to-case basis Collaboration: Team Folders within ULEAD Data Transfer In & Out: Data Transfer Folders within ULEAD Internet access: Websites approved by OHIA Interfaces: Allowed with approved databases and applications

Data Transfer Inbound - CTSIULEAD FoldersData Transfer Folder – OUTSIDE ULEAD
CTSI Folder
project1
project2
project3
project4
project5
CTSI
project1
Project2
Project3
project4
project5
Inbound
Data Transfer
NetworkShares
Citrix Files (S:)
Accessing Data in ULEADData Transfer Inbound - User
ULEAD FoldersData Transfer Folder – OUTSIDE ULEAD
Data Transfer
User1
User2
User3
User4
User5
User1
User2
User3
User4
User5
User Folder
NetworkShares
Citrix Files (S:)\\czohsaulwcoep01.file.core.windows.net\coesharep01\
Data Transfer Folders\Inbound\yourusername
Data Transfer Outbound - UserCollaboration within ULEADULEAD Folders
Team1
Team2
Team3
Team4
Team5
Team Folders
NetworkShares
Citrix Files (S:)
ULEAD FoldersData Transfer Folder – OUTSIDE ULEAD
Data Transfer
User1
User2
User3
User4
User5
\\czohsaulwcoep01.file.core.windows.net\coesharep01\Data Transfer Folders\Inbound\yourusername
Outbound
User1
User2
User3
User4
User5
Data Transfer
NetworkShares
Citrix Files (S:)

ResearchersAn
alyt
ical
& V
isua
lizat
ion
Tool
sDa
ta
REDCapTableauPower BIOracle SQL DeveloperDatabricksGitHubSTATAImage processing software (Gimp, Osiris)
Images
PRODUCT ROADMAP
Adobe AcrobatAnacondaAzure DevOpsJupyter NotebooksMS Office (Word, Excel, Powerpoint, Access)PyCharmR StudioMATLABSASSSMS SQL DeveloperVisual Studio
Ongoing Backlog by User Request
Text WaveformsGenomics
Com
pute GPUsCPUs High Performance Compute
v1 v2 Lifecycle Mgmt

Challenges with Licensed Applications• Previous generations (Legacy xDR Desktop, Tableau Desktop, On Premises VDI):
o Does not support individual licensed applicationso Only supported non-persistent desktops
Affects support for licensed applications Application compatibility issues
o Does not support publishing applications to individual users or groups of users.
• ULEAD supports:o Licensed applications for individuals or groups of userso Provides the ability to publish applications via Citrix and make them
available to our userso Applications can be installed and stay persistent per user by using UPL (User
Personalization Layer)
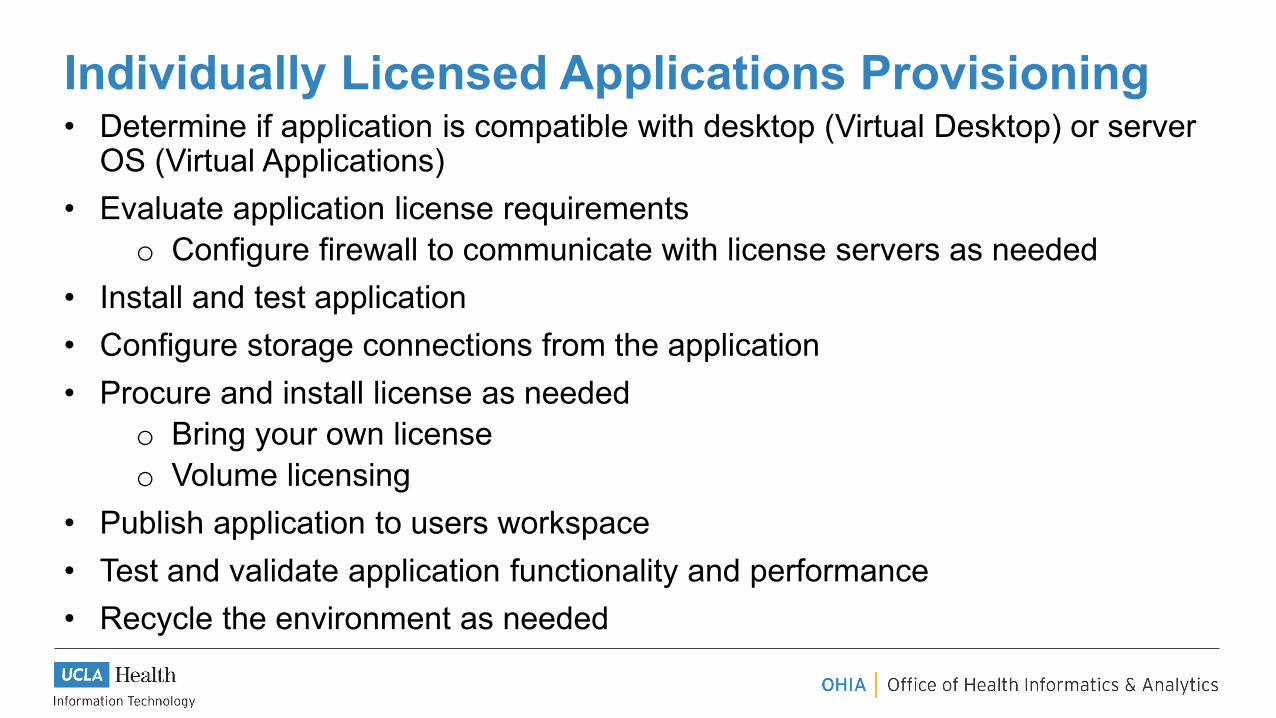
Individually Licensed Applications Provisioning • Determine if application is compatible with desktop (Virtual Desktop) or server
OS (Virtual Applications)• Evaluate application license requirements
o Configure firewall to communicate with license servers as needed• Install and test application• Configure storage connections from the application• Procure and install license as needed
o Bring your own licenseo Volume licensing
• Publish application to users workspace• Test and validate application functionality and performance• Recycle the environment as needed
Deliver Virtual Applications per user • If application is compatible with server OS (Virtual apps), we can publish
applications to users, as needed.• When applications are no longer needed, access is removed and granted to a
different user maintaining license requirements• Preferred method

Provision applications per users as neededo Users login to Citrix Workspace and access applications based on
entitlements
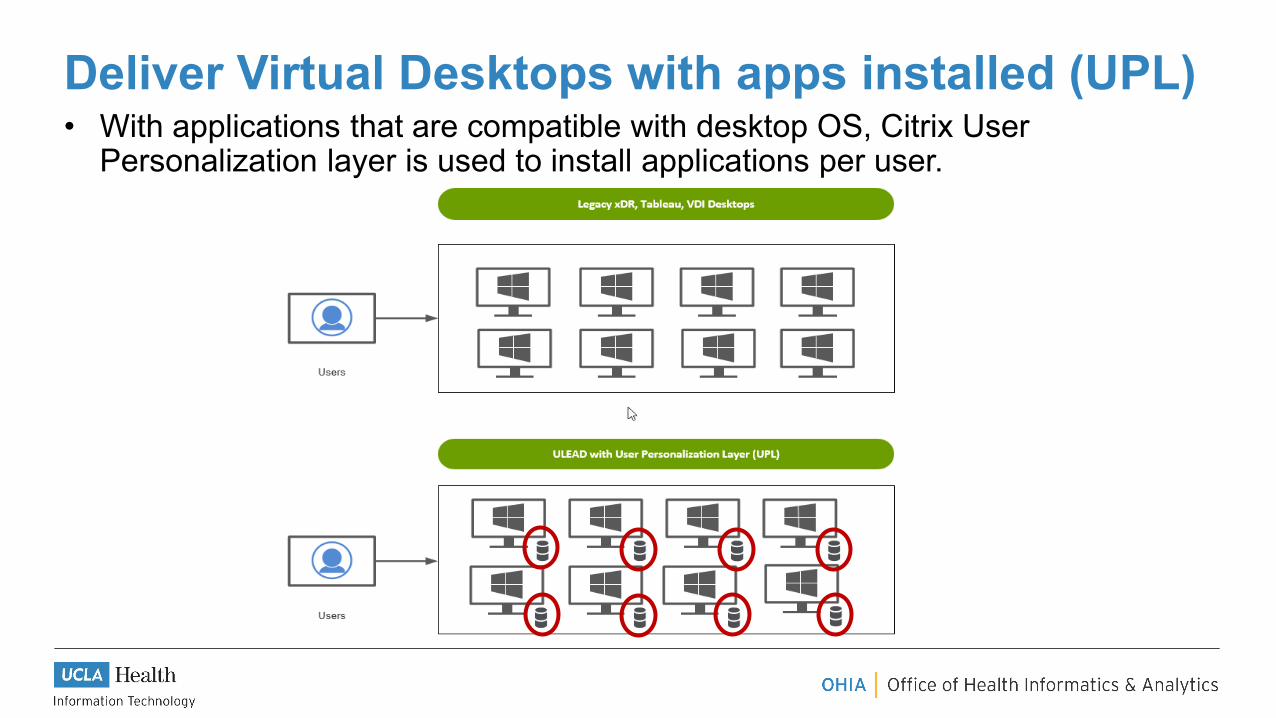
Deliver Virtual Desktops with apps installed (UPL)• With applications that are compatible with desktop OS, Citrix User
Personalization layer is used to install applications per user.

Applications Available per User

ULEAD DemoJason Wang
Windows VM Linux VM

ULEAD DEMO
Vu VuManager, Advanced Analytics, OHIA
Jason Wang, MS. PhDResearcherAdvanced Analytics, OHIA
Dept. of Medicine, David Geffen School of Medicine

27,920 Views7 months
More than 30+ media from regional and international
A use case for this demo

Study background• Clinicians have noted an unusual number of patients with respiratory
complaints at the end of 2019 and early 2020, well before COVID-19 was
officially categorized by the World Health Organization (WHO) as a pandemic
• The excess can represent undetected and early COVID-19 cases prior to
established clinical awareness and testing capabilities for the virus
• Limited data available to accurately assessing regional activity of COVID
pandemic, It is unclear whether such anecdotal reports are correct or the
result of hindsight bias

Can we use EHR data to evaluate whether there was an excess of patients presenting with symptoms and diseases suggestive
of COVID-19 in the months prior to the first known cases in the US health system in March
2020?
We can use words found in chief complaint fields in EHR with symptoms
suggestive of COVID-19
Using time-series methods can address whether there was an excess number of patients presenting for complaints of cough, or hospitalizations for respiratory ailments
OHIA Advanced Analytics
Specifically, can we use symptoms suggestive of COVID-19 as proxy measures to better understand the COVID pandemic?

UCLA Research Project Process Flow
Researcher+ OHIA
Brainstorming
Forming study hypothesis
Visit for Cough as proxy
measure
IRB
• Submit IRB application
CTSI
• Refine study design
• Data preparation
Researcher + CTSI+ OHIA
• Refine data specification
• Obtaining data
• Work with OHIA Advanced
Analytics team to develop
predictive model
• OHIA provide development
platform (ULEAD)

Study design for this demoStudy hypothesis: Excess patient visits for cough in the Months Prior to the COVID-19 Pandemic
Outcome measures: visit for cough
Data source and time frame: Emergency department data from 2014/July to 2020/Feb
Statistical analysis: Using Time-Series Analysis (ARIMA model) to analyze and forecast time series data.
Method: Examine the time when the actual value starts to deviate from the predicted data

ARIMA Model1. Use SAS Seasonal ARIMA model to take into account seasonal pattern in this data.
2. Use 4 years data as a train data to develop a model (between 2014 – 2018/Nov)
3. Use one year data to validate model (between 2018/Dec – 2019/Nov)
4. Compare actual data with predicted interval from 2019/Dec to 2020/Feb for
hypothesis testing.
Train data Test dataData to
test hypothesis
2014-July 2018-Nov 2019-Nov 2020-Feb

Options to do Time-Series Analysis in ULEAD
• SAS modules/procedures: ARIMA, model, forecast, autoreg, X11, X12, Spectra, statespace, varmax, time series forecasting system, Call R program directly into SAS
• R packages: forecast and tseries
• Python (Scipy environment: pandas, statsmodels, scikit-learn)
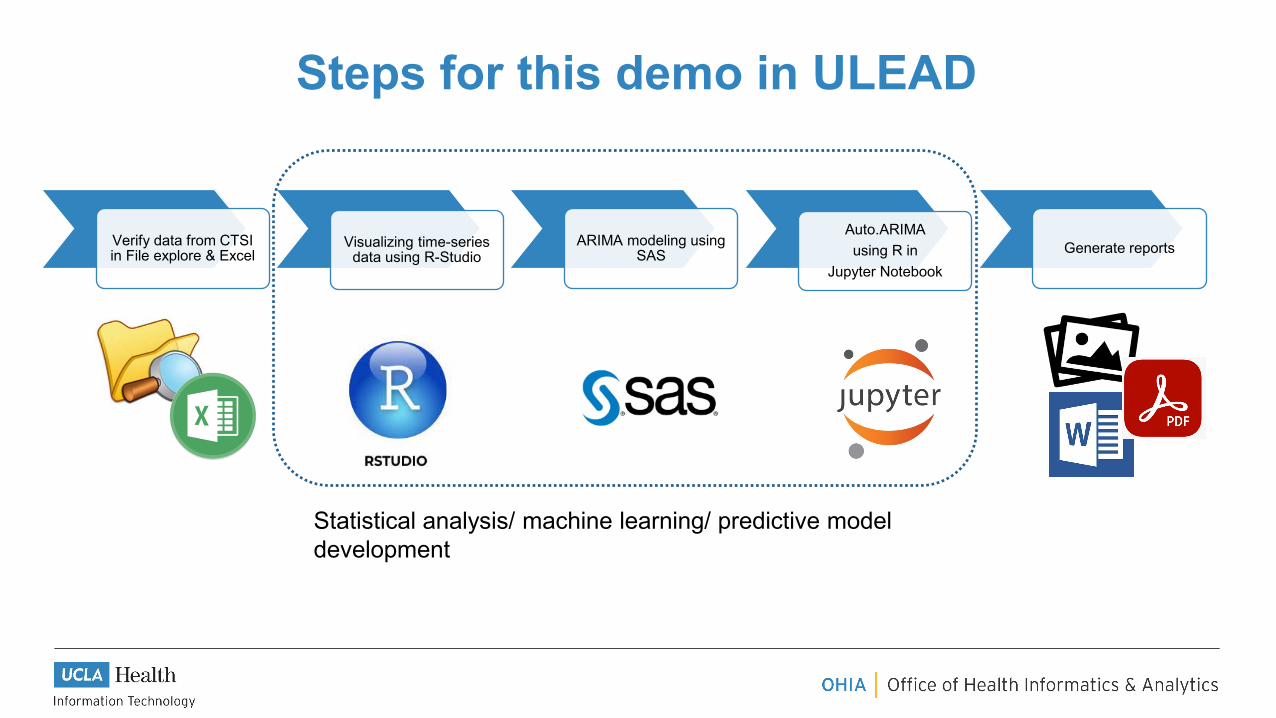
Steps for this demo in ULEAD
Verify data from CTSI in File explore & Excel
Visualizing time-series data using R-Studio
ARIMA modeling using SAS
Auto.ARIMAusing R in
Jupyter NotebookGenerate reports
Statistical analysis/ machine learning/ predictive model development

SummaryWith the ULEAD go live:
• Fully secure environment
• High performance machine
• Easily to access data
• Capable of using multiple programs
• Ability to generate high quality reports


![[Product Launch] Jedox 6 - Transform your business with unified planning & analytics anywhere](https://static.fdocuments.in/doc/165x107/587006f41a28ab427f8b64d7/product-launch-jedox-6-transform-your-business-with-unified-planning-.jpg)