UniCredit Bank Czech Republic and Slovakia, a.s ... Sheet proves the self funded position of the...
29
Presentation to Covered Bond Investors - update Version September 2016 UniCredit Bank Czech Republic and Slovakia, a.s.
Transcript of UniCredit Bank Czech Republic and Slovakia, a.s ... Sheet proves the self funded position of the...

Presentation to Covered Bond Investors - update
Version September 2016
UniCredit Bank Czech Republic and Slovakia, a.s.

Executive Summary 3
Introduction 5
Financial Figures 11
Cover Pool & Rating 19
Content
2
3
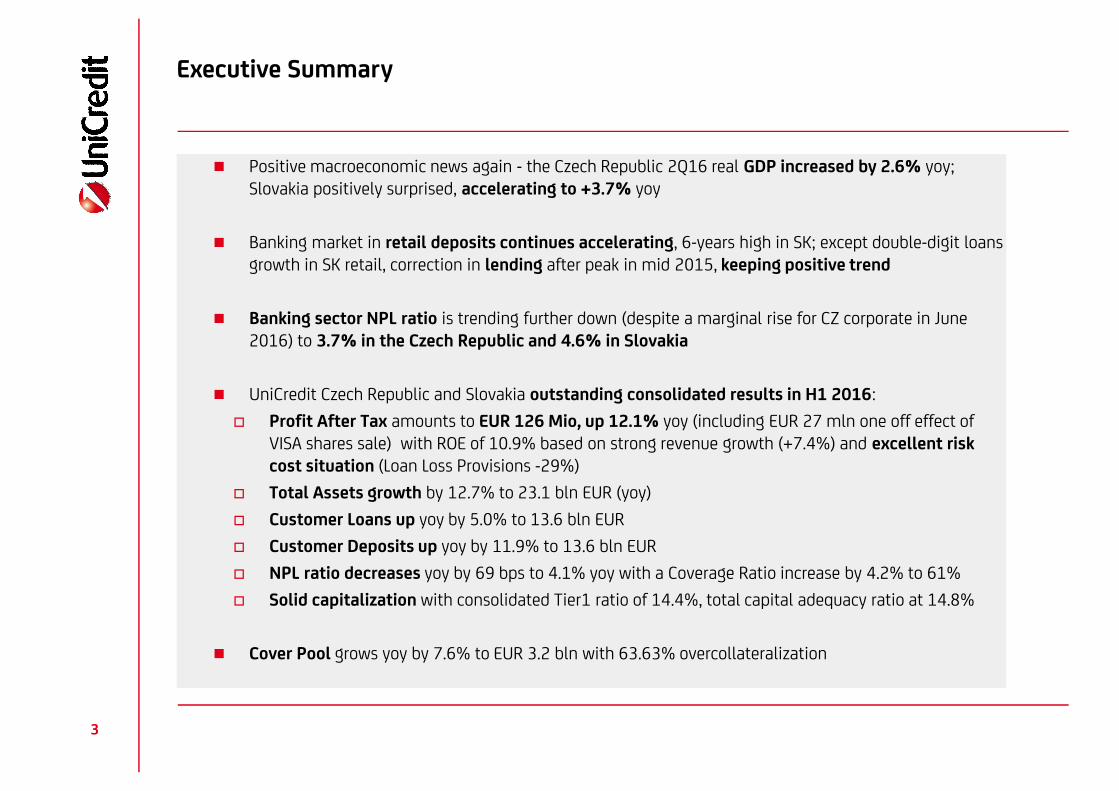
Executive Summary
Positive macroeconomic news again - the Czech Republic 2Q16 real GDP increased by 2.6% yoy;Slovakia positively surprised, accelerating to +3.7% yoy
Banking market in retail deposits continues accelerating, 6-years high in SK; except double-digit loansgrowth in SK retail, correction in lending after peak in mid 2015, keeping positive trend
Banking sector NPL ratio is trending further down (despite a marginal rise for CZ corporate in June2016) to 3.7% in the Czech Republic and 4.6% in Slovakia
UniCredit Czech Republic and Slovakia outstanding consolidated results in H1 2016:
Profit After Tax amounts to EUR 126 Mio, up 12.1% yoy (including EUR 27 mln one off effect ofVISA shares sale) with ROE of 10.9% based on strong revenue growth (+7.4%) and excellent riskcost situation (Loan Loss Provisions -29%)
Total Assets growth by 12.7% to 23.1 bln EUR (yoy)
Customer Loans up yoy by 5.0% to 13.6 bln EUR
Customer Deposits up yoy by 11.9% to 13.6 bln EUR
NPL ratio decreases yoy by 69 bps to 4.1% yoy with a Coverage Ratio increase by 4.2% to 61%
Solid capitalization with consolidated Tier1 ratio of 14.4%, total capital adequacy ratio at 14.8%
Cover Pool grows yoy by 7.6% to EUR 3.2 bln with 63.63% overcollateralization

Executive Summary 3
Introduction 5
Financial Figures 11
Cover Pool & Rating 19
Content
4

5Source: UCBCS Economic Research
IntroductionThe Czech Republic & Slovakia – Macroeconomic trends 2015: CZ outpaced SK in GDP growth for thefirst time since 2009, tightened fiscal policy
Average unemployment rate (%)
Average CPI (yoy)
Public sector balance (% of GDP)
Real GDP (yoy)

The CNB commitment to keep EUR/CZK at or above 27 remains unchanged
Since June 2015, EUR/CZK has been testing the floor at 27, forcing the CNB to repeatedlyintervene on the market
An exit from the intervention policy is expected in 2017; considering the amount ofinvestors-held long CZK positions, volatility may increase after repeal of the floor
Source: UCBCS Economic Research
IntroductionThe Czech Republic & Slovakia – FX market EUR/CZK
6

Note: CZ market - CZK equivalent, SK market – EUR equivalent, residents only
Sources: CNB, NBS, UCBCS Economic Research
CZ market SK market
IntroductionThe Czech Republic & Slovakia – Banking Industry: Lending growth
7
Corporate lending dynamic peaked in mid-2015
Retail lending dynamic also appears to be past the peak
Retail lending dynamic firmly in double-digit
Corporate lending has been slowing in recent months
CZ market
SK market

8 Note CZ market - CZK equivalent, SK market – EUR equivalent, residents only
Sources: CNB, NBS, UCBCS Economic Research
CZ market SK market
IntroductionThe Czech Republic & Slovakia – Banking Industry: Deposit growth
Retail dynamic continues accelerating, corporate dynamic rather volatile
Total dynamic captures public sector deposit flows via the CNB accounts
Deposit dynamics for retail is picking up to 6-years high,
Corporate deposits remain volatile but still keeping positive growth
CZ market
SK market

9 Note: % of total loans in sector, residents only
Sources: CNB, NBS, UCBCS Economic Research
SK marketCZ market
IntroductionThe Czech Republic & Slovakia – Banking Industry: Non-Performing Loans
NPL ratio is trending down despite a marginal rise for corporate in June 2016
NPL ratio continues declining in retail, while turning trendless in corporate
CZ market
SK market

Executive Summary 3
Introduction 5
Financial Figures 11
Cover Pool & Rating 19
Content
10

Balance Sheet proves the self funded position of the bank, loans fully matching deposits
Financial Assets mostly consist of CZ and SK government bonds and T-bills held as a
liquidity reserve
Loans with banks are composed of placements of excesses of liquidity within the group (UniCredit Bank Austria) and short term placements with the
Czech National Bank
Deposits from banks are formed by long term funding from EIB and long term interbank refinancing lines to UniCredit Leasing
Balance Sheet dynamics are driven by the growth of customer business – loans and deposits
Higher growth of Customer Deposits than Loans, further enhances the structural liquidity position of the bank
Stock of Issued securities decreased due to maturities of mostly CZK bonds, both senior unsecured and covered.
11
Equity
Other Liabilities
Debt securities in issue
Deposits from customers
Deposits from banks
Other Assets
Other Financial Assets
Loans and receivableswith customers
Loans and receivableswith banks
Liabilities
23.1
2.41.22.3
13.6
3.7
Assets
23.1
0.4
4.0
13.6
5.2
+12.7%
2Q2016
23.1
2Q2015
20.5
Balance Sheet
+5.0%
2Q2016
13.6
2Q2015
13.0
Customer Loans (Net)
+11.9%
2Q2016
13.6
2Q2015
12.1
Customer Deposits
-6.7%
2Q2016
2.3
2Q2015
2.5
Securities Issued
Consolidated Balance Sheet as of 30/06/2016 Major Trends
bln EUR
Methodological note:
In order to show growth rates neutralized from FX impacts, all periods are recalculated from CZK to EUR by 27.4 rate. Figures represent end of period.
Source: Managerial Reporting
Financial FiguresBalance Sheet structure

Financial FiguresBusiness development
12
Corp - other lending
Corp - RE financing
Retail - other lending
Retail - mortgage
2Q16
14,680
1,720
7,529
1,938420
3,074
1Q16
14,162
1,689
7,135
1,945416
2,977
4Q15
13,959
1,696
7,019
1,925411
2,907
3Q15
13,867
1,660
+7.7%
1,979400
2,821
2Q15
13,634
7,0077,025
1,919389
2,706
Leasing1,596
+13.6%
Corporate
Retail &Private Banking
2Q16
15,005
9,788
5,217
1Q16
14,571
9,538
5,033
4Q15
14,478
9,577
4,901
3Q15
13,520
8,686
4,834
2Q15
13,211
8,423
4,788
Loans to Customers (Gross)
Primary sources* from Customers
Dynamics in retail as well as in
corporate lending continues in
2016 thanks to economic
growth
Despite a high lending growth
rate, increases in deposits are
fully covering the liquidity
need, even improving the
commercial funding gap
Deposit's strategy focused on
transactional accounts, with
low interest rate sensitivity and
with a positive impact on
concentration risk
Primary sources consists of over
1 bln EUR of bonds issued and
held by bank's customers as an
alternative to deposit
Commercial Funding Gap
mln EUR, quarterly averages
* Deposit from customers + own issues held by non-banksSource: Managerial ReportingRemark: in Q2 2016 part of retail portfolio (small business) was re-segmented to Corporate. Historical data were recast..
103.2% 102.6% 96.4% 97.2% 97.8%

Financial FiguresCapital structure and ratios as of 30/06/2016, consolidated
13
Market Risk
Operational Risk
CVA
Credit Risk
14,452
61
813
390
13,188
Tier I Capital
Tier 2 (Provisionsminus Expected Loss)
2,077
63
2,140
14.80%
RWACapital
Capital adequacy ratio (fully loaded):
Basel III regulatory limit set by regulator at14% including capital conservation buffer andlocal SIFI
2015 profit was fully retained to cover thebusiness related RWA growth and to enhancethe capital adequacy ratio
Mortgage
Corporates SME
Corporates
Specialized Lending
Institutions
Government
Other
Retail
524
2,876
5,162
1,771
383345
558
13,188
1,569
mln EUR
Source: Managerial Reporting
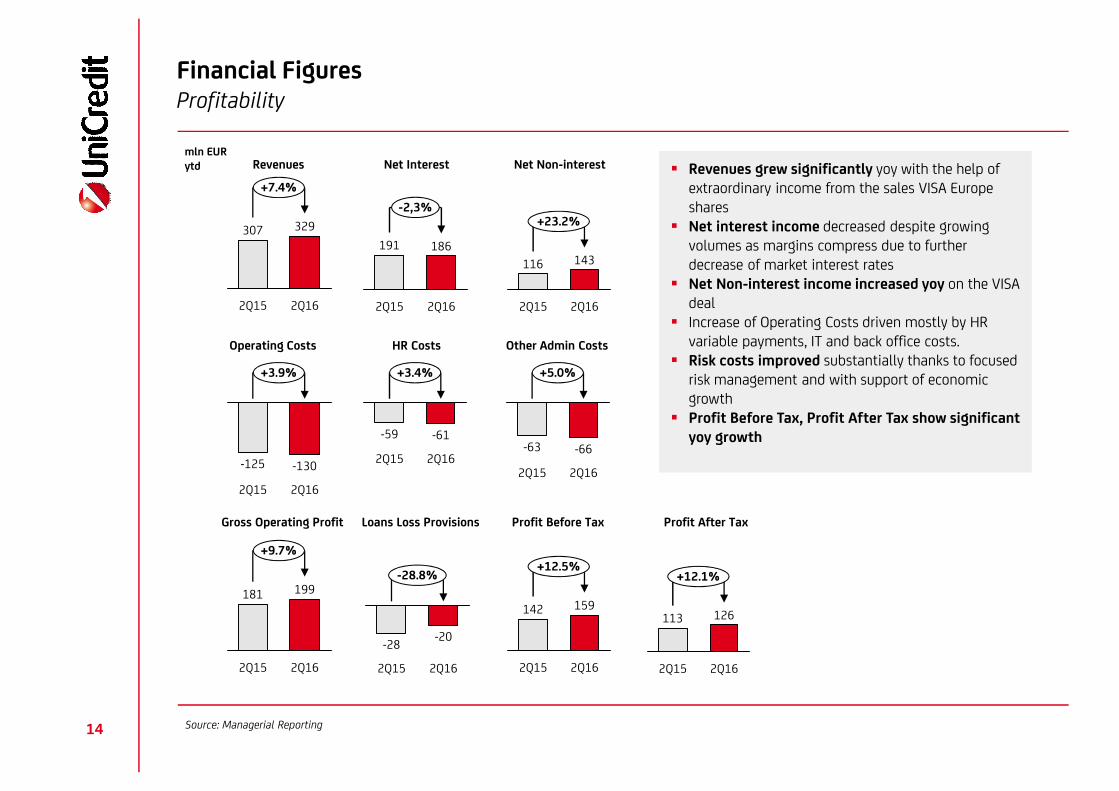
Financial FiguresProfitability
14
+7.4%
2Q16
329
2Q15
307
Revenues
-2,3%
2Q16
186
2Q15
191
+23.2%
2Q16
143
2Q15
116
+3.9%
2Q16
-130
2Q15
-125
-28.8%
2Q16
-20
2Q15
-28
+12.5%
2Q16
159
2Q15
142
Net Interest Net Non-interest
Operating Costs
Loans Loss Provisions Profit Before Tax
Revenues grew significantly yoy with the help ofextraordinary income from the sales VISA Europeshares
Net interest income decreased despite growingvolumes as margins compress due to furtherdecrease of market interest rates
Net Non-interest income increased yoy on the VISAdeal
Increase of Operating Costs driven mostly by HRvariable payments, IT and back office costs.
Risk costs improved substantially thanks to focusedrisk management and with support of economicgrowth
Profit Before Tax, Profit After Tax show significantyoy growth
Profit After Tax
+12.1%
2Q16
126
2Q15
113
mln EURytd
HR Costs Other Admin Costs
+3.4%
2Q16
-61
2Q15
-59
+5.0%
2Q16
-66
2Q15
-63
Gross Operating Profit
2Q16
+9.7%
199
2Q15
181
Source: Managerial Reporting

Financial FiguresPerformance ratios
15
Performance ratios show positive development, however impacted by one off VISA deal; ROE adjusted stands around 8% and C/Iaround 44%
Lower sustainable revenue generation stemming from low interest rate, hence lower margins are impacting both ROE and C/I
10.9%
0.5
2Q162Q15
10.4%
ROE Cost/Income Ratio Revenues on avg RWA
39.6%
-1.3
2Q162Q15
40.9% 4.9%
-0.1
2Q162Q15
5.0%
Source: Managerial Reporting

Financial FiguresRisk management and risk ratios
16
-10.50%
2Q16
571
2Q15
639
NPLs (mln EUR)
-0.69%
2Q16
4.06%
2Q15
4.75%
+4,19%
2Q16
61%
2Q15
57%
-0.14%
2Q16
0.29%
2Q15
0.43%
NPL ratio Coverage Ratio Cost of Risk**
Leasing
11.2%
Retail21.0%
12.1%
FVE*
2.4%
SME
4.9%Mid Corp
19.3%
Large Corp
24.8%
Financial Institutions
3.3%
RE
Other Corp1.1%
Others
15.8%
Leasing11.2%
Transport2.6%
Construction2.9%
Telecommunication
3.1%
Automotive
3.4%
Services
6.7%
Wholesale
6.9%Energy
7.4% Financial
4.9%
RE14.7%
Privates
20.5%
Cost of Risk decreased thanksto successful write-backs,which also led to decrease inNPL volume and ratio
Coverage Ratio growingfurther above the strategictarget of 50%
In terms of segment structure,Financial Institutions decliningwhile Mid Corp growing yoy
Industrial composition changesin favor of Privates, andServices while Energydecreasing
Exposure by segment Exposure by industry
* Photovoltaic power stations** Loan Loss Provisions / Net LoansSource: Managerial Reporting

Financial FiguresNPL ratios in real estate portfolios
17
Portfolios as by managerial definition – not fully matching regulatory view Cover Pool does not include NPLs – NPL ratio of the Cover Pool is 0%
4Q15
1,6161,798
4Q14
-10.1%
1,638
+1.4%
2Q16
IPRE CZ Retail Mortgage CZ Retail Mortgage SK
1,6701,465
4Q14 4Q15
1,769
2Q16
+5.9%+14.0%
4Q14
1,095
+6.8%
4Q15
1,224 1,307
2Q16
+11.7%
Vol
um
eof
loan
s(m
lnEU
R)
4Q14
7.0%
4Q15
6.2%
0.29 -0.75
2Q16
6.7%
2Q164Q14
-0.13
1.5%
4Q15
-0.56
1.4%
2.1%
-0.27
1.0%
4Q15
1.2%
0.9%
2Q164Q14
-0.08
NP
Lra
tio
Source: Managerial ReportingRemark: in Q2 2016 part of retail portfolio (small business) was re-segmented to Corporate. Historical data were recast..
Executive Summary 3
Introduction 5
Financial Figures 11
Cover Pool & Rating 19
Content
18
19
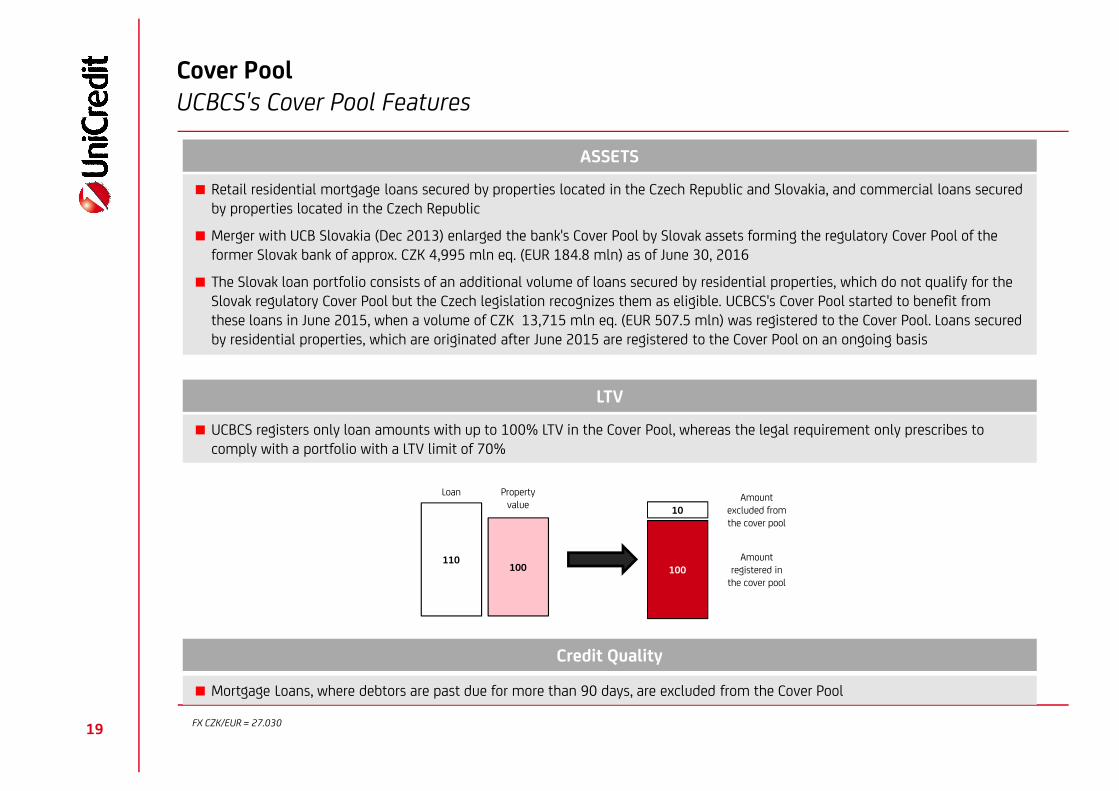
Cover PoolUCBCS's Cover Pool Features
Retail residential mortgage loans secured by properties located in the Czech Republic and Slovakia, and commercial loans securedby properties located in the Czech Republic
Merger with UCB Slovakia (Dec 2013) enlarged the bank's Cover Pool by Slovak assets forming the regulatory Cover Pool of theformer Slovak bank of approx. CZK 4,995 mln eq. (EUR 184.8 mln) as of June 30, 2016
The Slovak loan portfolio consists of an additional volume of loans secured by residential properties, which do not qualify for theSlovak regulatory Cover Pool but the Czech legislation recognizes them as eligible. UCBCS's Cover Pool started to benefit fromthese loans in June 2015, when a volume of CZK 13,715 mln eq. (EUR 507.5 mln) was registered to the Cover Pool. Loans securedby residential properties, which are originated after June 2015 are registered to the Cover Pool on an ongoing basis
ASSETS
UCBCS registers only loan amounts with up to 100% LTV in the Cover Pool, whereas the legal requirement only prescribes tocomply with a portfolio with a LTV limit of 70%
LTV
110100
Loan Propertyvalue
100
10
Amountregistered in
the cover pool
Amountexcluded fromthe cover pool
Mortgage Loans, where debtors are past due for more than 90 days, are excluded from the Cover Pool
Credit Quality
FX CZK/EUR = 27.030

20
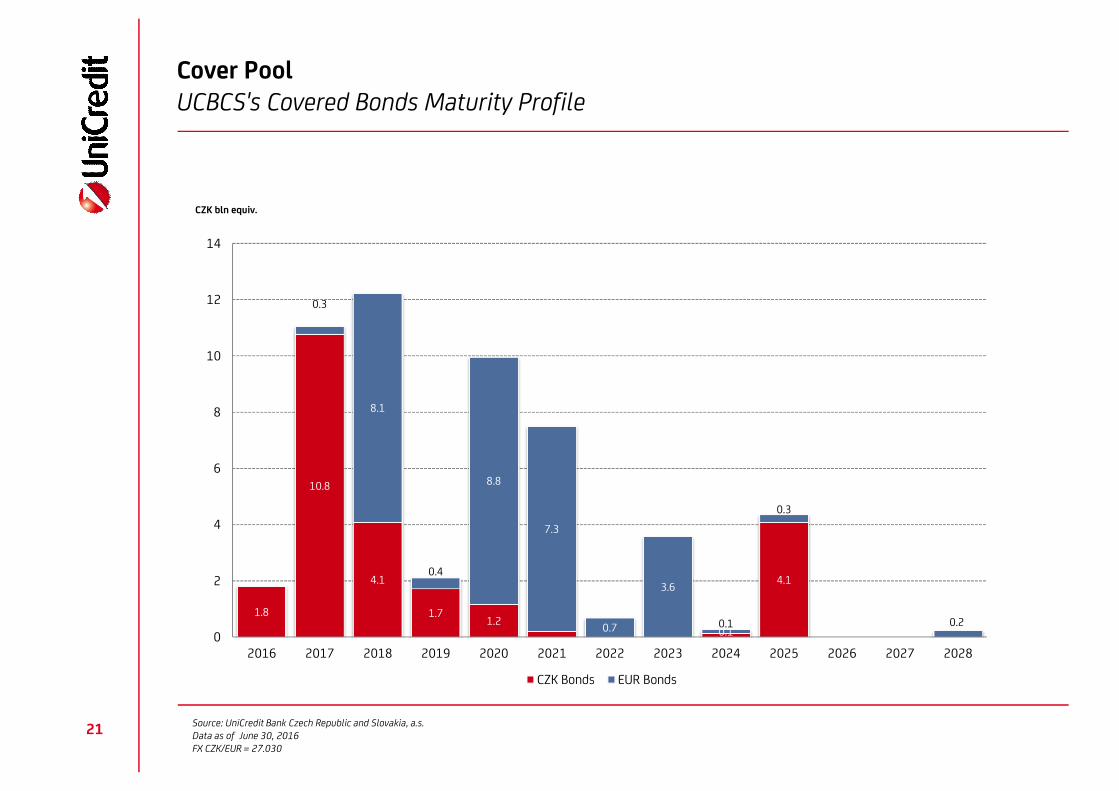
Total value of the outstanding Covered Bonds as of 30 June 2016: CZK 53,719 mln eq.
o/w denominated in CZK: CZK 23,922 mln (44.5%)
o/w denominated in EUR: CZK 29,797 mln eq. (55.5%)
Current Overcollateralization: 63.63%
Current rating: Aa3 (Moody's), assigned 5th Aug 2015
Cover PoolUCBCS's Cover Pool Features
Total value of the Cover Pool as of 30 June 2016: CZK 87,900 mln eq.
o/w in retail residential loans secured by CZ properties: CZK 34,573 mln eq. (39.3%)
o/w in retail residential loans secured by SK properties: CZK 21,799 mln eq. (24.8%)
o/w in commercial loans secured by CZ properties: CZK 31,528 mln eq. (35.9%)
o/w denominated in CZK: CZK 48,894 mln (55.6%)
o/w denominated in EUR: CZK 39,006 mln eq. (44.4%)
Cover Pool Overview
Covered Bonds Overview
Source: UniCredit Bank Czech Republic and Slovakia, a.s.Data as of June 30, 2016FX CZK/EUR = 27.030
21
Cover PoolUCBCS's Covered Bonds Maturity Profile
Source: UniCredit Bank Czech Republic and Slovakia, a.s.Data as of June 30, 2016FX CZK/EUR = 27.030
1.8
10.8
4.1
1.71.2 0.1
4.1
0.3
8.1
0.4
8.8
7.3
0.7
3.6
0.1
0.3
0.2
0
2
4
6
8
10
12
14
2016 2017 2018 2019 2020 2021 2022 2023 2024 2025 2026 2027 2028
CZK bln equiv.
CZK Bonds EUR Bonds

22
Cover PoolUCBCS's Cover Pool Maturity Profile
Source: UniCredit Bank Czech Republic and Slovakia, a.s.Data as of June 30, 2016FX CZK/EUR = 27.030
2.1
4.2 4.4 4.3
2.92.5 2.6
2.2 2.31.9 2.0
1.7 1.6 1.5 1.4 1.3 1.2 1.1 1.1 1.0 0.9 0.9 0.8 0.7 0.7
1.8
3.0
4.6
3.3 3.7
1.8
1.4
4.9
1.1 1.1 2.0
1.0
0.9 0.9 0.90.8 0.8 0.8 0.7 0.7 0.7 0.6 0.6 0.6 0.5 0.5
1.2
0
1
2
3
4
5
6
7
8
9
10
CZK bln equiv.
CZK Assets EUR Assets
23
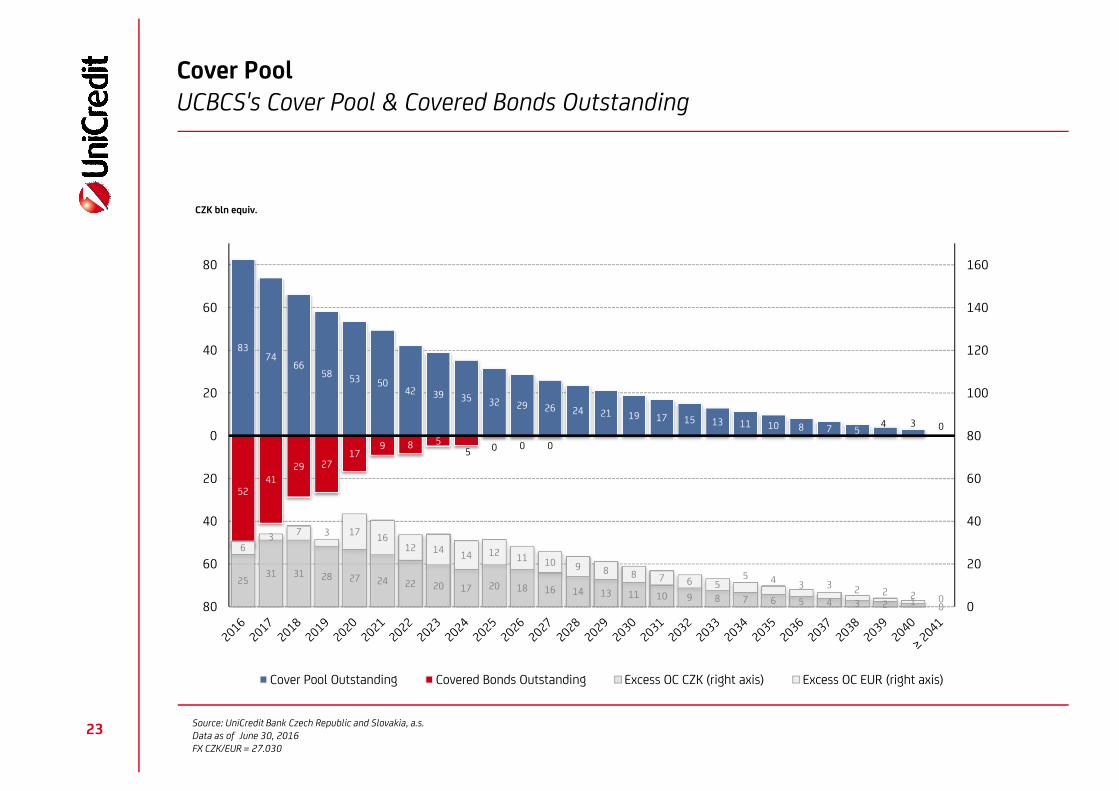
Cover PoolUCBCS's Cover Pool & Covered Bonds Outstanding
Source: UniCredit Bank Czech Republic and Slovakia, a.s.Data as of June 30, 2016FX CZK/EUR = 27.030
8374
6658 53 50
42 39 35 32 29 26 24 21 19 17 15 13 11 10 8 7 54 3 0
5241
29 2717
9 8 55 0 0 0
2531 31 28 27 24 22 20 17 20 18 16 14 13 11 10 9 8 7 6 5 4 3 2
2 0
63
7 3 1716
12 1414 12 11 10 9 8 8 7 6 5
5 4 3 3 2 21 0 0
20
40
60
80
100
120
140
160
80
60
40
20
0
20
40
60
80
CZK bln equiv.
Cover Pool Outstanding Covered Bonds Outstanding Excess OC CZK (right axis) Excess OC EUR (right axis)

24
Cover PoolUCBCS's Cover Pool & Covered Bonds - Currency Breakdown
Source: UniCredit Bank Czech Republic and Slovakia, a.s.Data as of June 30, 2016FX CZK/EUR = 27.030
Ass
ets
Liabilities
48.89
17.21
21.80
23.9229.80
40
30
20
10
0
10
20
30
40
50CZK EUR
CZK bln equiv.
CZ Loans SK Loans Covered Bonds

25
Cover PoolUCBCS's Cover Pool Features - CZ Retail Residential Portfolio
Source: UniCredit Bank Czech Republic and Slovakia, a.s.Data as of June 30, 2016FX CZK/EUR = 27.030
ST
JC
PL
KV
LBUS
HK
PA
JM
MSOL
ZL
VY
PRG
Total Loan Balance (in CZK) 34,572,434,288
Average Loan Balance (in CZK) 1,319,962
Total Number of Loans 26,192
Total Number of Debtors 24,075
Total Number of Properties 25,490
Weighted Average Seasoning (in years) 3.5
Contracted Weighted Average Remaining Term (in years) 20.8
Weighted Average LTV 70%
Stake of Fixed Interest Rate Loans 75%
Stake of 10 Biggest Loans 1%
Stake of Bullet Loans 0%
Residential Portfolio - Czech Republic
PRG Prague-East & Prague-West 25.3%
ST Středočeský kraj excl. Prague -East & Prague-West 19.1%
JM Jihomoravský kraj 13.8%
MS Moravskoslezský kraj 6.8%
OL Olomoucký kraj 5.1%
US Ústecký kraj 4.2%
JC Jihočeský kraj 4.0%
ZL Zlínský kraj 3.9%
HK Královéhradecký kraj 3.9%
LB Liberecký kraj 3.8%
PL Plzeňský kraj 3.6%
PA Pardubický kraj 3.1%
VY Kraj Vysočina 2.3%
KV Karlovarský kraj 1.1%
Regional Distribution - Czech Republic

26
Cover PoolUCBCS's Cover Pool Features - SK Retail Residential Portfolio
Source: UniCredit Bank Czech Republic and Slovakia, a.s.Data as of June 30, 2016FX CZK/EUR = 27.030
Total Loan Balance (in CZK) 21,799,214,090
Average Loan Balance (in CZK) 933,186
Total Number of Loans 23,360
Total Number of Debtors 18,354
Total Number of Properties 19,114
Weighted Average Seasoning (in years) 3.3
Contracted Weighted Average Remaining Term (in years) 21.4
Weighted Average LTV 69%
Stake of Fixed Interest Rate Loans 83%
Stake of 10 Biggest Loans 1%
Stake of Bullet Loans 0%
Residential Portfolio - Slovakia
BA Bratislavský kraj 33.6%
TT Trnavský kraj 16.5%
ZA Žilinský kraj 10.0%
NR Nitriansky kraj 9.7%
KE Košický kraj 8.8%
BB Banskobystrický kraj 8.0%
TN Trenčiansky kraj 6.8%
PO Prešovský kraj 6.6%
Regional Distribution - Slovakia

27
Cover PoolUCBCS's Cover Pool Features - CZ Commercial Portfolio
Source: UniCredit Bank Czech Republic and Slovakia, a.s.Data as of June 30, 2016FX CZK/EUR = 27.030
ST
JC
PL
KV
LBUS
HK
PA
JM
MSOL
ZL
VY
PRG
Total Loan Balance (in CZK): 31,528,325,112
Average Loan Balance (in CZK): 28,951,630
Total Number of Loans: 1,089
Total Number of Debtors: 931
Total Number of Properties: 1,155
Weighted Average Seasoning (in years): 2.9
Contracted Weighted Average Remaining Term (in years): 4.9
Weighted Average LTV: 70%
Stake of Fixed Interest Rate Loans: 30%
Stake of 10 Biggest Loans: 37%
Stake of Bullet Loans: 2%
Commercial Portfolio - Czech Republic
PRG Prague-East & Prague-West 42.5%
JM Jihomoravský kraj 9.3%
OL Olomoucký kraj 9.0%
MS Moravskoslezský kraj 7.6%
ST Středočeský kraj excl. Prague -East & Prague-West 7.5%
US Ústecký kraj 7.1%
PL Plzeňský kraj 4.3%
JC Jihočeský kraj 2.8%
LB Liberecký kraj 2.8%
PA Pardubický kraj 1.9%
KV Karlovarský kraj 1.7%
HK Královéhradecký kraj 1.6%
VY Kraj Vysočina 1.1%
ZL Zlínský kraj 1.1%
Regional Distribution - Czech Republic

Your Contacts
28
Finance
UniCredit Bank Czech Republic and Slovakia, a.s.
Gregor Hofstaetter-Pobst
CFO and member of the Board
Tel. + 420 955 961 800
Libor Ondrich
Head of Assets & Liability Management
Tel. + 420 955 960 774
Risk Management
UniCredit Bank Czech Republic and Slovakia, a.s.
Antonin Fikrle
Director Strategic Credit Risk
Tel. + 420 955 960 850
Markets
UniCredit Bank Czech Republic and Slovakia, a.s.
Stepan Nyvlt
Head of Debt Origination
Tel. + 420 221 216 821
For Debt Investor Relations please visit http://eng.unicreditbank.cz/en/web/debt-investor-relations

Disclaimer
29
This publication is presented to you by:Corporate & Investment BankingUniCredit Bank Czech Republic and Slovakia, a.s.Želetavská 1525/1140 92 Prague 4 – MichleCzech RepublicThe information in this presentation is based on carefully selected sources believed to be reliable. However we do not make any representation as to its accuracy or completeness. Any opinions herein reflect our judgement at the date hereofand are subject to change without notice. Any investments presented in this presentation may be unsuitable for the investor depending on his or her specific investment objectives and financial position. Any reports provided herein areprovided for general information purposes only and cannot substitute the obtaining of independent financial advice. Private investors should obtain the advice of their banker/broker about any investments concerned prior to making them.Nothing in this publication is intended to create contractual obligations. Corporate & Investment Banking of UniCredit Group consists of UniCredit Bank AG, Munich, UniCredit Bank Austria AG, Vienna, UniCredit CAIB Securities UK Ltd.London, UniCredit S.p.A., Rome and other members of the UniCredit Group. UniCredit Bank Czech Republic and Slovakia, a.s is regulated by Czech National Bank, UniCredit Bank AG is regulated by the German Financial SupervisoryAuthority (BaFin), UniCredit Bank Austria AG is regulated by the Austrian Financial Market Authority (FMA),UniCredit CAIB AG is regulated by the UniCredit CAIB AG is regulated by the Austrian Financial Market Authority (FMA) and UniCredit S.p.A. is regulated by both the Banca d’Italia and the Commissione Nazionale per le Società e la Borsa(CONSOB).
Note to UK Residents:In the United Kingdom, this presentation is being communicated on a confidential basis only to clients of Corporate & Investment Banking of UniCredit Goup (acting through UniCredit Bank AG, London Branch and/or UniCredit CAIBSecurities UK Ltd. who (i) have professional experience in matters relating to investments being investment professionals as defined in Article 19(5) of the Financial Services and Markets Act 2000 (Financial Promotion) Order 2005 (“FPO”);and/or (ii) are falling within Article 49(2) (a) – (d) (“high net worth companies, unincorporated associations etc.”) of the FPO (or, to the extent that this publication relates to an unregulated collective scheme, to professional investors as definedin Article 14(5) of the Financial Services and Markets Act 2000 (Promotion of Collective Investment Schemes) (Exemptions) Order 2001 and/or (iii) to whom it may be lawful to communicate it, other than private investors (all such personsbeing referred to as “Relevant Persons”). This presentation is only directed at Relevant Persons and any investment or investment activity to which this publication relates is only available to Relevant Persons or will be engaged in only withRelevant Persons. Solicitations resulting from this publication will only be responded to if the person concerned is a Relevant Person. Other persons should not rely or act upon this publication or any of its contents.The information provided herein (including any report set out herein) does not constitute a solicitation to buy or an offer to sell any securities. The information in this presentation is based on carefully selected sources believed to be reliablebut we do not make any representation as to its accuracy or completeness. Any opinions herein reflect our judgement at the date hereof and are subject to change without notice.We and/or any other entity of Corporate & Investment Banking of UniCredit Group may from time to time with respect to securities mentioned in this publication (i) take a long or short position and buy or sell such securities; (ii) act asinvestment bankers and/or commercial bankers for issuers of such securities; (iii) be represented on the board of any issuers of such securities; (iv) engage in “market making” of such securities; (v) have a consulting relationship with anyissuer. Any investments discussed or recommended in any report provided herein may be unsuitable for investors depending on their specific investment objectives and financial position. Any information provided herein is provided forgeneral information purposes only and cannot substitute the obtaining of independent financial advice.UniCredit Bank AG, London Branch is regulated by the Financial Services Authority for the conduct of business in the UK as well as by BaFIN, Germany. UniCredit CAIB Securities UK Ltd., London, a subsidiary of UniCredit Bank Austria AG,is authorised and regulated by the Financial Services Authority.Notwithstanding the above, if this presentation relates to securities subject to the Prospectus Directive (2005) it is sent to you on the basis that you are a Qualified Investor for the purposes of the directive or any relevant implementinglegislation of a European Economic Area (“EEA”) Member State which has implemented the Prospectus Directive and it must not be given to any person who is not a Qualified Investor. By being in receipt of this presentation you undertakethat you will only offer or sell the securities described in this presentation in circumstances which do not require the production of a prospectus under Article 3 of the Prospectus Directive or any relevant implementing legislation of an EEAMember State which has implemented the Prospectus Directive.
Note to US Residents:The information provided herein or contained in any report provided herein is intended solely for institutional clients of Corporate & Investment Banking of UniCredit Group acting through UniCredit Bank AG, New York Branch and UniCreditCapital Markets, Inc. (together “UniCredit”) in the United States, and may not be used or relied upon by any other person for any purpose. It does not constitute a solicitation to buy or an offer to sell any securities under the Securities Act of1933, as amended, or under any other US federal or state securities laws, rules or regulations. Investments in securities discussed herein may be unsuitable for investors, depending on their specific investment objectives, risk tolerance andfinancial position.In jurisdictions where UniCredit is not registered or licensed to trade in securities, commodities or other financial products, any transaction may be effected only in accordance with applicable laws and legislation, which may vary fromjurisdiction to jurisdiction and may require that a transaction be made in accordance with applicable exemptions from registration or licensing requirements.All information contained herein is based on carefully selected sources believed to be reliable, but UniCredit makes no representations as to its accuracy or completeness. Any opinions contained herein reflect UniCredit’s judgement as of theoriginal date of publication, without regard to the date on which you may receive such information, and are subject to change without notice.UniCredit may have issued other reports that are inconsistent with, and reach different conclusions from, the information presented in any report provided herein. Those reports reflect the different assumptions, views and analytical methods ofthe analysts who prepared them. Past performance should not be taken as an indication or guarantee of further performance, and no representation or warranty, express or implied, is made regarding future performance.UniCredit and/or any other entity of Corporate & Investment Banking of UniCredit Group may from time to time, with respect to any securities discussed herein: (i) take a long or short position and buy or sell such securities; (ii) act asinvestment and/or commercial bankers for issuers of such securities; (iii) be represented on the board of such issuers; (iv) engage in “market-making” of such securities; and (v) act as a paid consultant or adviser to any issuer.The information contained in any report provided herein may include forward-looking statements within the meaning of US federal securities laws that are subject to risks and uncertainties. Factors that could cause a company’s actual resultsand financial condition to differ from its expectations include, without limitation: Political uncertainty, changes in economic conditions that adversely affect the level of demand for the company’s products or services, changes in foreignexchange markets, changes in international and domestic financial markets, competitive environments and other factors relating to the foregoing. All forward-looking statements contained in this presentation are qualified in their entirety bythis cautionary statement.
Corporate & Investment BankingUniCredit Bank Czech Republic and Slovakia, a.s.as of September 2016