UNI-ASIA GROUP LIMITED
38
UNI-ASIA GROUP LIMITED Company Registration No: 201701284Z Incorporated in the Republic of Singapore UNI-ASIA GROUP LIMITED AND ITS SUBSIDIARIES UNAUDITED CONDENSED INTERIM CONSOLIDATED FINANCIAL STATEMENTS 30 JUNE 2021
Transcript of UNI-ASIA GROUP LIMITED

UNI-ASIA GROUP LIMITED
Company Registration No: 201701284Z Incorporated in the Republic of Singapore
UNI-ASIA GROUP LIMITED AND ITS SUBSIDIARIES
UNAUDITED CONDENSED INTERIM CONSOLIDATED FINANCIAL STATEMENTS
30 JUNE 2021

Contents
Unaudited Condensed Interim Consolidated Financial Statements
Condensed Interim Consolidated Statement of Profit or Loss ....................................................... 1 Condensed Interim Consolidated Statement of Comprehensive Income ...................................... 2 Condensed Interim Statements of Financial Positions ................................................................... 3 Condensed Interim Consolidated Statement of Changes in Equity ............................................... 5 Condensed Interim Statement of Changes in Equity ..................................................................... 6 Condensed Interim Consolidated Statement of Cash Flows.......................................................... 7 Notes To The Condensed Interim Consolidated Financial Information ......................................... 9 Other Information Required by Listing Rule Appendix 7.2 ........................................................... 30

- 1 -
Condensed Interim Consolidated Statement of Profit or Loss For The Six Months Ended 30 June 2021
The Group 6 months ended 30 June 2021 2020 % Note US$’000 US$’000 Change
Continuing Operations Charter income 10 19,998 13,743 46% Fee income 11 2,925 4,828 (39%) Sale of property under development 5,091 – N/M Investment returns 12 2,505 2,206 14% Interest income 70 487 (86%) Other income 1,072 295 N/M
Total income 31,661 21,559 47%
Employee benefits expenses (4,224) (3,136) 35% Amortisation and depreciation (4,518) (5,478) (18%) Depreciation of right-of-use assets (801) (699) 15% Vessel operating expenses (9,374) (8,290) 13% Costs of property under development sold (4,506) – N/M Impairment of property, plant and equipment 6 – (7,920) N/M Gain on disposal of asset held for sale 7 365 – N/M Reversal of impairment/(impairment) of loan receivable 1,050 (1,050) 200% Impairment of receivables (3) (75) (96%) Net foreign exchange gain/(loss) 1,179 (64) N/M Other expenses (1,681) (2,121) (21%)
Total operating expenses (22,513) (28,833) (22%)
Operating profit/(loss) 9,148 (7,274) N/M
Finance costs – interest expense (1,487) (2,179) (32%) Finance costs – lease interest (139) (207) (33%) Finance costs – others (79) (75) 5% Share of results of associate 11 (3) N/M Allocation to Tokumei Kumiai1 investors (96) 90 N/M
Profit/(loss) before tax from continuing operations 7,358 (9,648) 176%
Income tax expense 13 (325) (388) (16%)
Profit/(loss) after tax from continuing operations 7,033 (10,036) 170%
Discontinued Operation Loss from discontinued operation, net of tax – (18,304) N/M Gain from deconsolidation of subsidiary – 24,435 N/M
Net gain from discontinued operation – 6,131 N/M
Profit/(loss) for the period 7,033 (3,905) N/M
Profit/(loss) for the period attributable to:
Owners of the parent
- from continuing operations 7,180 (10,143) 171% - from discontinued operation – 6,316 N/M 7,180 (3,827) N/M
Non-controlling interests (147) (78) 88% 7,033 (3,905) N/M
1 Tokumei Kumiai (“TK”) refers to a form of silent partnership structure used in Japan. Allocation to TK investors refers to share of profit
and loss attributable to other TK investors of the TK structure.

- 2 -
Condensed Interim Consolidated Statement of Comprehensive Income For The Six Months Ended 30 June 2021
The Group 6 months ended 30 June 2021 2020 % Note US$’000 US$’000 Change Profit/(loss) for the period 7,033 (3,905) N/M
Other comprehensive income for the period, net of tax:
Items that may be reclassified subsequently to profit or loss: Exchange differences on translation of foreign operations
from continuing operations
(2,048) 138 N/M Exchange differences on translation of foreign operations
from discontinued operation
– (126) N/M Reclassification of exchange differences on discontinued
foreign operation
– 553 N/M Net movement on cash flow hedges 468 (665) 170%
Other comprehensive expense for the period, net of tax (1,580) (100) N/M
Total comprehensive income/(expense) for the period 5,453 (4,005) N/M Total comprehensive income/(expense) for the period
attributable to:
Owners of the parent - from continuing operations 5,595 (10,665) 152% - from discontinued operation – 6,744 N/M 5,595 (3,921) N/M
Non-controlling interests (142) (84) 69%
5,453 (4,005) N/M
N/M: Not meaningful

- 3 -
Condensed Interim Statements of Financial Positions As At 30 June 2021
The Group The Company 30 June 31 December 30 June 31 December 2021 2020 2021 2020 Note US$’000 US$’000 US$’000 US$’000
ASSETS Non-current assets Investment properties 5 11,363 9,853 – – Investments 18 31,032 30,549 – – Investment in subsidiary – – 113,022 113,022 Investment in associate 32 23 – – Property, plant and equipment 6 139,690 144,028 8 11 Right-of-use assets 1,678 2,500 74 162 Rental deposit 509 546 – – Deferred tax assets 190 206 – –
Total non-current assets 184,494 187,705 113,104 113,195 Current assets Investments 18 2,380 5,239 – – Properties under development 6,978 6,572 – – Accounts receivable 976 1,256 – – Amount due from subsidiary – – 2,898 1,805 Prepayments, deposits and other receivables
3,784 3,504 79 70
Tax recoverable 40 322 – – Asset held for sale 7 – 9,393 – – Deposits pledged as collateral 1,000 – – – Cash and bank balances 32,286 35,477 518 626
Total current assets 47,444 61,763 3,495 2,501
Total assets 231,938 249,468 116,599 115,696

- 4 -
Condensed Interim Statements of Financial Positions (cont’d) As At 30 June 2021
The Group The Company 30 June 31 December 30 June 31 December
2021 2020 2021 2020 Note US$’000 US$’000 US$’000 US$’000 EQUITY Equity attributable to owners of the parent
Share capital 8 113,174 113,174 113,174 113,174 Retained earnings 10,505 5,086 36 678 Hedging reserve (216) (684) – – Exchange reserve 1,691 3,744 – – Capital reserve (2,854) (2,856) – –
Total equity attributable to owners of the parent
122,300 118,464 113,210 113,852
Non-controlling interests 444 878 – –
Total equity 122,744 119,342 113,210 113,852 LIABILITIES Non-current liabilities Borrowings 9 62,965 69,538 – – Lease liabilities 1,575 3,163 – – Derivative financial instruments 263 379 – – Amount due to subsidiary – – 1,000 1,000 Deferred tax liabilities 542 536 – – Other payables 55 59 – –
Total non-current liabilities 65,400 73,675 1,000 1,000 Current liabilities Borrowings 9 32,239 44,435 585 – Lease liabilities 3,300 3,546 82 174 Due to Tokumei Kumiai investors 1,782 1,972 – – Derivative financial instruments 552 618 – – Accounts payable 218 241 – – Amount due to subsidiary – – 11 3 Other payables and accruals 4,335 5,011 442 468 Income tax payable 199 628 100 199 Dividend payable 14 1,169 – 1,169 –
Total current liabilities 43,794 56,451 2,389 844 Total liabilities 109,194 130,126 3,389 1,844 Total equity and liabilities 231,938 249,468 116,599 115,696

- 5 -
Condensed Interim Consolidated Statement of Changes in Equity For The Six Months Ended 30 June 2021 Attributable to the owners of the parent
Share capital (Note 8)
Retained earnings
Hedging reserve
Exchange reserve
Capital reserve Total
Non-controlling interests
Total equity
The Group Note US$’000 US$’000 US$’000 US$’000 US$’000 US$’000 US$’000 US$’000
At 1 January 2020 113,174 14,055 (487) 1,734 (2,877) 125,599 469 126,068 Loss for the period – (3,827) – – – (3,827) (78) (3,905) Other comprehensive (expense)/income for the period – – (665) 571 – (94) (6) (100) Total comprehensive (expense)/income for the period – (3,827) (665) 571 – (3,921) (84) (4,005) Disposal of interests in a subsidiary – – – – – – 228 228 Distributions to owners: Final dividend in respect of 2019 14 – (1,224) – – – (1,224) – (1,224) Payment to non-controlling interests – – – – – – (27) (27) At 30 June 2020 113,174 9,004 (1,152) 2,305 (2,877) 120,454 586 121,040 At 1 January 2021 113,174 5,086 (684) 3,744 (2,856) 118,464 878 119,342
Profit/(loss) for the period – 7,180 – – – 7,180 (147) 7,033 Other comprehensive income/(expense) for the period – – 468 (2,053) – (1,585) 5 (1,580) Total comprehensive income/(expense) for the period – 7,180 468 (2,053) – 5,595 (142) 5,453 Acquisition of additional interests in a subsidiary – – – – – – (52) (52) Distributions to owners: Final dividend in respect of 2020 14 – (592) – – – (592) – (592) Interim dividend in respect of 2021 14 (1,169) – – – (1,169) – (1,169) Transfer to capital reserve – – – – 2 2 (2) – Payment to non-controlling interests – – – – – – (238) (238) At 30 June 2021 113,174 10,505 (216) 1,691 (2,854) 122,300 444 122,744

- 6 -
Condensed Interim Statement of Changes in Equity For The Six Months Ended 30 June 2021
Share capital (Note 8)
Retained earnings
Total equity
The Company Note US$’000 US$’000 US$’000 At 1 January 2020 113,174 2,470 115,644
Loss for the period, representing total comprehensive expense for the period – (962) (962)
Distribution to owners: Final dividend in respect of 2019 14 – (1,224) (1,224)
At 30 June 2020 113,174 284 113,458 At 1 January 2020 113,174 678 113,852
Loss for the period, representing total comprehensive expense for the period – 1,119 1,119
Distribution to owners: Final dividend in respect of 2020 14 – (592) (592)
Interim dividend in respect of 2021 14 – (1,169) (1,169) At 30 June 2021 113,174 36 113,210

- 7 -
Condensed Interim Consolidated Statement of Cash Flows For The Six Months Ended 30 June 2021
The Group 6 months ended 30 June 2021 2020 Note US$’000 US$’000 Cash flows from operating activities
Profit/(loss) before tax from continuing operations 7,358 (9,648) Loss from discontinued operation before tax – (18,252) Gain from deconsolidation of subsidiary – 24,435 Profit/(loss) before tax 7,358 (3,465) Adjustments for:
Investment returns 12 (2,505) (2,206) Amortisation and depreciation 4,518 5,560 Depreciation of right-of-use assets 801 13,984 Gain on deconsolidation of subsidiary – (24,435) Loss on written off of property, plant and equipment 6 – Impairment of property, plant and equipment 6 – 7,920 Gain on disposal of asset held for sale 7 (365) – (Reversal of impairment)/impairment of loan receivables (1,050) 1,050 Impairment of receivables 3 75 Net foreign exchange (gain)/loss (1,179) 64 Interest income (70) (487) Finance costs – interest expense 1,487 2,284 Finance costs – lease interest 139 3,114 Finance costs – others 79 103 Share of results of associate (11) 3 Allocation to Tokumei Kumiai investors 96 (90)
Operating cash flows before changes in working capital 9,307 3,474 Changes in working capital:
Net change in properties under development (874) (3,376) Net change in accounts receivable 404 4,116 Net change in prepayments, deposits and other receivables (50) 1,507 Net change in accounts payable (12) (1,151) Net change in other payables and accruals (198) (2,749)
Cash flows generated from operations 8,577 1,821
Interest received on bank balances 15 91 Tax paid (466) (73) Net cash flows generated from operating activities 8,126 1,839

- 8 -
Condensed Interim Consolidated Statements of Cash Flow (cont’d) For The Six Months Ended 30 June 2021
The Group 6 months ended 30 June 2021 2020 Note US$’000 US$’000 Cash flows from investing activities
Purchase of investment properties (2,094) (5,337) Purchase of investments (2,294) (14,296) Proceeds from sale of investment property – 8,329 Proceeds from redemption/sale of investments 5,359 3,287 Deconsolidation of consolidated entities (2) (9,983) Proceeds from finance lease – 122 Hotel lease deposit payment – (1,270) Deposits (paid)/refunded for small residential projects (6) 75 Purchase of property, plant and equipment (917) (1,722) Proceeds from disposal of asset held for sale 9,758 – Net (redemption)/contribution from Tokumei Kumiai investors (156) 318 Net loans repaid/(advanced) 1,050 (100) Interest received from loans and finance lease 52 373 Net (increase)/decrease in deposits pledged as collateral (1,000) 955 Income proceeds from investments 1,126 141 Proceeds from property rental 341 261 Net cash flows generated from/(used in) investing
activities 11,217 (18,847) Cash flows from financing activities
Proceeds from borrowings 9,397 39,063 Repayment of borrowings (26,503) (27,505) Interests and other finance cost paid on borrowings (1,617) (2,797) Lease principal paid (1,811) (12,976) Lease interest paid (139) (2,699) Dividends paid 14 (592) (1,224) Payment to non-controlling interests (238) (27) Net cash flows used in financing activities (21,503) (8,165) Net decrease in cash and cash equivalents (2,160) (25,173) Movements in cash and cash equivalents:
Cash and cash equivalents at beginning of the period 35,477 56,089 Net decrease in cash and cash equivalents (2,160) (25,173) Effects of foreign exchange rate changes, net (1,031) 168 Cash and cash equivalents at end of the period 32,286 31,084

- 9 -
Notes To The Condensed Interim Consolidated Financial Information For The Six Months Ended 30 June 2021 1. Corporate information
Uni-Asia Group Limited (the “Company”) is a limited liability company incorporated in Singapore on 12 January 2017 and its shares are listed and publicly traded on the Mainboard of the Singapore Exchange. The registered office and principal place of business of the Company is located at 8 Shenton Way, #37-04 AXA Tower, Singapore 068811. The principal activities of Company and its subsidiaries (collectively, the “Group”) are finance arrangement, investment and investment management of alternative assets including shipping and real estates in Japan, Hong Kong and China.
2. Basis of preparation
These unaudited condensed interim consolidated financial statements as at and for the six months ended 30 June 2021 have been prepared in accordance with IAS 34 Interim Financial Reporting issued by the International Accounting Standards Board (“IASB”) and SFRS(I) 1-34 Interim Financial Reporting issued by the Accounting Standards Council Singapore (“ASC”). The condensed interim financial statements do not include all the information required for a complete set of financial statements. However, selected explanatory notes are included to explain events and transactions that are significant to an understanding of the changes in the Group’s financial position and performance of the Group since the last annual financial statements for the year ended 31 December 2020. The accounting policies adopted are consistent with those of the previous financial year which were prepared in accordance with International Financial Reporting Standards (“IFRSs”) issued by the IASB and Singapore Financial Reporting Standards (International) (SFRS(I)s) issued by the ASC (collectively, the “Standards”), except for the adoption of new and amended standards as set out in Note 2.1. The condensed interim financial statements are presented in United States dollars (“USD” or “US$”) which is the Company’s functional currency, and all values are rounded to the nearest thousand (“US$’000”), except when otherwise indicated.
2.1. New and amended standards adopted by the Group
A number of amendments to Standards have become applicable for the current reporting period. The Group did not have to change its accounting policies or make retrospective adjustments as a result of adopting these standards.
2.2. Use of judgements and estimates
The preparation of the condensed interim financial statements requires management to make judgements, estimates and assumptions that affect the reported amounts of revenues, expenses, assets and liabilities, and the disclosure of contingent liabilities at the end of each reporting period. Uncertainty about these assumptions and estimates could result in outcomes that require a material adjustment to the carrying amount of the assets or liabilities affected in future periods. The significant judgements made by management in applying the Group’s accounting policies and the key sources of estimation uncertainty were the same as those that applied to the consolidated financial statements as at and for the year ended 31 December 2020.

- 10 -
Notes To The Condensed Interim Consolidated Financial Information For The Six Months Ended 30 June 2021 2. Basis of preparation (cont’d) 2.2. Use of judgements and estimates (cont’d)
Judgements made in applying accounting policies In the process of applying the Group’s accounting policies, management has made the following judgements, which have the most significant effect on the amounts recognised in the condensed interim financial statements:
Determination of functional currency The Group measures foreign currency transactions in the respective functional currencies of the Company and its subsidiaries. In determining the functional currencies of the entities in the Group, judgement is required to determine the currency that mainly influences sales prices for goods and services and of the country whose competitive forces and regulations mainly determines the sales prices of its goods and services. The functional currencies of the entities in the Group are determined based on management’s assessment of the economic environment in which the entities operate and the entities’ process of determining sales prices. Estimates and assumptions The key assumptions concerning the future and other key sources of estimation uncertainty at the end of the reporting period, that have a significant risk of causing a material adjustment to the carrying amounts of assets and liabilities within the next financial year are described below: (a) Impairment of vessels held as property, plant and equipment The Group owns vessels held as property, plant and equipment for ship chartering business. Indicators of impairment on the vessels was assessed annually to identify whether the vessels may be impaired. The Group computed the vessels’ recoverable amount using value in use and compared with its carrying amounts to identify impairment losses when indicators of impairment existed, including impact arising from the COVID-19 pandemic. The key assumptions used in the value in use computation comprise of daily charter rates, disposal values, operational expenses, and the discount rate. The carrying amount of the vessels held as property, plant and equipment as at 30 June 2021 is US$139.2 million (31 December 2020: US$143.6 million). (b) Fair value of unlisted shares in shipping companies The Group invested in unlisted shares of special purpose companies that own and charter ships which were carried at fair value through profit or loss. The Group generally used external valuation reports in the fair valuation of the unlisted shares. The key assumptions used in the valuation are daily charter rates, terminal values, operational expenses, and the discount rate. The carrying amount of the unlisted shares in shipping companies as at 30 June 2021 and 31 December 2020 and significant unobservable inputs used in fair valuation including its sensitivity analysis are disclosed in Note 18.

- 11 -
Notes To The Condensed Interim Consolidated Financial Information For The Six Months Ended 30 June 2021 2. Basis of preparation (cont’d) 2.2. Use of judgements and estimates (cont’d)
Estimates and assumptions (cont’d) (c) Fair value of investment properties and unlisted shares in commercial office and industrial buildings and small residential property developments The Group held commercial office buildings and small residential properties as investment properties measured at fair value. In addition, the Group invested in unlisted shares of special purpose companies that held commercial office and industrial buildings and small residential properties measured at fair value through profit or loss. The Group generally used external valuation reports and performed internal valuations in determining fair value of commercial office buildings held as investment properties and commercial office and industrial buildings held through unlisted shares. For small residential property development held through unlisted shares and held as investment properties, the Group used internal valuation in estimating the fair value of the unlisted shares and investment properties. The key assumptions used in the valuations are gross development value, development cost, rental yield, vacancy rate, gross capitalisation rates, expense ratio and discount rate, including impact arising from the COVID-19 pandemic. The carrying amount of the investment properties and unlisted shares in commercial office and industrial buildings and small residential property developments as at 30 June 2021 and 31 December 2020 are disclosed in Note 18.
(d) Leases – Estimating the incremental borrowing rate The Group cannot readily determine the interest rate implicit in the lease, therefore, it uses its incremental borrowing rate (IBR) to measure lease liabilities. The IBR is the rate of interest that the Group would have to pay to borrow over a similar term, and with a similar security, the funds necessary to obtain an asset of a similar value to the right-of-use asset in a similar economic environment. The IBR therefore reflects what the Group ‘would have to pay’, which requires estimation when no observable rates are available (such as for subsidiaries that do not enter into financing transactions) or when they need to be adjusted to reflect the terms and conditions of the lease (for example, when leases are not in the subsidiary’s functional currency). The Group estimates the IBR using observable inputs (such as market interest rates) when available and is required to make certain entity-specific estimates (such as the subsidiary’s stand-alone credit rating).
3. Seasonal operations
The Group’s businesses are not affected significantly by seasonal or cyclical factors during the financial period.

- 12 -
Notes To The Condensed Interim Consolidated Financial Information For The Six Months Ended 30 June 2021 4. Segment information
Management monitors the operating results of its business units separately for the purpose of making decisions about resource allocation and performance assessment. Segment performance is evaluated based on reportable segment profit before tax from continuing operations. (a) Operating segments At 30 June 2021, the Group is organised on a worldwide basis into six (31 December 2020: six excluding operating segment discontinued in June 2020) main reportable segments (activities):
(i) Ship Owning and Chartering is the Group’s ship owning and chartering business. (ii) Maritime Asset Management (“MAM”) comprises of the Group’s ship investment activity as a
venture capital/asset management as well as finance arrangement business; (iii) Maritime Services is the Group’s ship commercial/technical management business, as well
as ship related brokerage service business; (iv) Property Investment (ex-Japan) includes the Group’s ex-Japan property investment, venture
capital/asset management and related business; (v) Property Investment (in-Japan) is the Group’s in-Japan property investment/asset
management and related business; and (vi) Headquarters’ (“HQ”) expenses
No operating segments have been aggregated to form the above reportable operating segments. Transfer prices between operating segments are on an arm’s length basis in a manner similar to transactions with third parties.

- 13 -
Notes To The Condensed Interim Consolidated Financial Information For The Six Months Ended 30 June 2021
4. Segment information (cont’d)
(a) Operating segments (cont’d)
The segment results for the six months ended 30 June 2021 were as follows: Shipping Property
For the 6 months ended 30 June 2021
Ship owning and chartering MAM Maritime
services Property
investment (ex-Japan)
Property investment (in-Japan)
HQ Eliminations(1) Total
US$’000 US$’000 US$’000 US$’000 US$’000 US$’000 US$’000 US$’000 Total income External customers 21,882 1,697 708 132 7,148 24 – 31,591 Interest income 1 52 3 10 – 4 – 70 Inter-segment – 187 401 – 70 – (658) –
21,883 1,936 1,112 142 7,218 28 (658) 31,661
Results Amortisation and depreciation (4,480) – (3) – (39) (3) 7 (4,518) Depreciation of right-of-use assets (414) – – – (101) (286) – (801) Reversal of impairment of loans
receivable – 1,050 – – – – – 1,050 Finance costs – interest expenses (1,451) (21) – – (69) (58) 112 (1,487) Finance costs – lease interest (130) – – – (2) (7) – (139) Finance costs – others (51) – – – (26) (2) – (79) Share of results of associates – – – – 11 – – 11 Allocation to Tokumei Kumiai investors – – – – (96) – – (96) Profit/(loss) before tax 6,331 2,315 399 50 993 (2,711) (19) 7,358
Other segment items are as follows: Capital expenditure 39 – 2 – 7,490 – – 7,531
(1) Inter-segment transactions are eliminated on consolidation.

- 14 -
Notes To The Condensed Interim Consolidated Financial Information For The Six Months Ended 30 June 2021
4. Segment information (cont’d)
(a) Operating segments (cont’d)
The segment results for the six months ended 30 June 2020 were as follows:
Continuing operations Discontinued
operation
Shipping Property
For the 6 months ended 30 June 2020
Ship owning and chartering MAM Maritime
services Property
investment (ex-Japan)
Property investment (in-Japan)
HQ Eliminations(1) Sub-total Hotel operation Total
US$’000 US$’000 US$’000 US$’000 US$’000 US$’000 US$’000 US$’000 US$’000 US$’000 Total income External customers 13,828 1,362 534 1,276 3,904 168 – 21,072 41,746 62,818 Interest income 16 68 5 63 305 30 – 487 – 487 Inter-segment – 256 521 – 98 – (875) – – – 13,844 1,686 1,060 1,339 4,307 198 (875) 21,559 41,746 63,305 Results Amortisation and depreciation (5,451) – (3) – (24) (7) 7 (5,478) (82) (5,560) Depreciation of right-of-use
assets (414) – – – 1 (286) – (699) (13,285) (13,984) Impairment of property, plant
and equipment (7,920) – – – – – – (7,920) – (7,920) Impairment of loans receivable – (1,050) – – – – – (1,050) – (1,050) Finance costs – interest
expenses (2,052) (9) – – (162) (137) 181 (2,179) (105) (2,284) Finance costs – lease interest (184) – – – (3) (20) – (207) (2,907) (3,114) Finance costs – others (46) – – – (29) (2) 2 (75) (28) (103) Share of results of associates – – – – (3) – – (3) – (3) Allocation to Tokumei Kumiai
investors – – – – 90 – – 90 – 90 (Loss)/profit before tax (11,476) (71) 349 811 2,370 (1,646) 15 (9,648) 6,183 (3,465) Other segment items are as
follows: Capital expenditure 1,937 – 2 – 8,725 9 – 10,673 21 10,694 Investment in associate – – – – 24 – – 24 – 24
(1) Inter-segment transactions are eliminated on consolidation.

- 15 -
Notes To The Condensed Interim Consolidated Financial Information For The Six Months Ended 30 June 2021
4. Segment information (cont’d)
(a) Operating segments (cont’d)
The segment assets and liabilities as at 30 June 2021 and 31 December 2020 were as follows: Shipping Property
Ship owning and chartering MAM Maritime
services Property
investment (ex-Japan)
Property investment (in-Japan)
HQ Eliminations(1) Total
US$’000 US$’000 US$’000 US$’000 US$’000 US$’000 US$’000 US$’000
As at 30 June 2021
Segment assets:
Total assets 152,882 2,952 2,561 30,544 37,069 6,182 (252) 231,938 Segment liabilities:
Total liabilities 100,849 37 631 5,312 13,426 2,040 (13,101) 109,194
As at 31 December 2020
Segment assets:
Total assets 167,113 2,409 1,992 32,330 39,582 6,304 (262) 249,468 Segment liabilities:
Total liabilities 124,282 32 403 5,324 13,377 5,237 (18,529) 130,126 (1) Inter-segment transactions are eliminated on consolidation.
Segment assets consist primarily of investment properties, properties under development, asset held for sale, property, plant and equipment, right-of-use assets, receivables, investments, deposits pledged as collateral and cash and bank balances. Segment liabilities consist primarily of borrowings, lease liabilities, payables, accruals and derivative financial instruments.

- 16 -
Notes To The Condensed Interim Consolidated Financial Information For The Six Months Ended 30 June 2021
4. Segment information (cont’d)
(b) Geographical information The Group’s six (31 December 2020: six excluding operating segment discontinued in June 2020) operating segments operate in three main geographical areas, even though they are managed on a worldwide basis. Global - the Global segment represents activities with assets or customers with no fixed location, which include ship finance arrangement, investments and asset management of ships, ship owning and chartering. Asia (ex-Japan) - the Asia (ex-Japan) segment represents activities with assets or customers located in Asia (ex-Japan), which include ship finance arrangement, investments and asset management of properties. Japan - the Japan segment represents activities with assets or customers located in Japan, which include ship finance arrangement, investments and asset management of properties.
The Group For the 6 months ended 30 June 2021 30 June 2020 US$’000 US$’000 Total income:
Global 23,724 15,513 Asia (ex-Japan) 786 1,662 Japan 7,151 4,384
31,661 21,559
During the period, total revenue of US$11.1 million (30 June 2020: no revenue) were with customers where transactions with each of the customer amounted to ten per cent (10%) or more of the Group’s revenue.
The Group As at 30 June 2021 As at 31 December 2020 US$’000 US$’000 Non-current assets:
Global 143,398 147,703 Asia (ex-Japan) 28,060 28,471 Japan 13,036 11,531
184,494 187,705
Income and non-current assets attributable to operating segments are based on the countries in which the customers are located. There is no sale between the geographical segments.

- 17 -
Notes To The Condensed Interim Consolidated Financial Information For The Six Months Ended 30 June 2021 5. Investment properties
The Group 30 June 2021 31 December 2020 US$’000 US$’000 Beginning of period 9,853 16,397
Additions 2,176 7,251 Disposals – (14,370) Currency translation differences (666) 575
End of period 11,363 9,853
The following amounts are recognised in profit or loss:
The Group
6 months ended 30 June 2021 2020 US$’000 US$’000 Rental income 198 245 Direct operating expenses arising from: - Investment properties that generated rental income 30 58
The Group has no restrictions on the realisability of its investment properties and no contractual obligations to purchase, construct or develop investment property or for repairs, maintenance or enhancements. Further particulars of the Group’s investment properties as at 30 June 2021 are detailed below:
Location Use Tenure Unexpired
lease term
Rooms 712-715, 7/F, China Shine Plaza, 9 Lin He Xi Road, Tianhe District, Guangzhou, PRC (1)
Offices Leasehold 34 years
1-7-12 Shimoochiai, Shinjuku-ku, Tokyo (2) Residential Freehold – 1-173-18, Takadanobaba Shinjuku-ku, Tokyo (3) Residential Freehold –
(1) The Group uses management’s valuation in the fair valuation of investment property.
Discounted cash flow method is used which makes reference to the estimated or actual market rental values and equivalent yields.
(2) The Group uses management’s valuation in the fair valuation of the investment property.
Discounted cash flow method is used which makes reference to the estimated or actual market rental values and equivalent yields. This investment property amounting to US$5.2 million (31 December 2020: US$5.6 million) is mortgaged to secure bank borrowing of US$3.4 million (31 December 2020: US$3.7 million) in the interim period ended 30 June 2021.
(3) The Group uses management’s valuation in the fair valuation of the investment property. Capitalisation rate method is used which makes reference to the capitalisation rates of similar investment properties in the market. This investment property amounting to US$4.3 million (31 December 2020: US$2.5 million) is mortgaged to secure bank borrowing of US$2.5 million (31 December 2020: US$2.0 million).

- 18 -
Notes To The Condensed Interim Consolidated Financial Information For The Six Months Ended 30 June 2021
6. Property, plant and equipment
During the six months ended 30 June 2021, the Group acquired assets amounting to US$0.2 million (31 December 2020: acquired assets amounting to US$2.6 million and taken US$7.9 million impairment loss).
7. Asset held for sale
During the six months ended 30 June 2021, the Group disposed of a vessel classified as an asset held for sale of US$9.4 million (31 December 2020: US$Nil), and recorded a US$0.4 million gain on disposal of asset held for sale (31 December 2020: US$Nil).
8. Share capital
The Group and the Company 30 June 2021 31 December 2020
Number of
shares Share capital
Number of shares
Share capital
’000 US$’000 ’000 US$’000 Issued and fully paid:
Beginning of period 78,600 113,174 78,600 113,174 End of period 78,600 113,174 78,600 113,174
The Company did not hold any treasury shares nor have any outstanding convertibles as at 30 June 2021. The Company’s subsidiaries do not hold any shares in the Company as at 30 June 2021 and 31 December 2020.

- 19 -
Notes To The Condensed Interim Consolidated Financial Information For The Six Months Ended 30 June 2021 9. Borrowings
The Group The Company
30 June
2021 31 December
2020 30 June
2021 31 December
2020 US$’000 US$’000 US$’000 US$’000 Non-current
Repayable per terms of loan facilities:
Secured 59,965 69,538 – – Unsecured 3,000 – – – 62,965 69,538 – – Current
Repayable per terms of loan facilities:
Secured 29,421 29,154 – – Unsecured 2,818 15,281 585 – 32,239 44,435 585 –
The Group’s borrowings are secured by means of investment properties (Note 5), property, plant and equipment, properties under development and cash deposits (31 December 2020: investment properties; property, plant and equipment; and properties under development).
10. Charter income
The Group
6 months ended 30 June 2021 2020 US$’000 US$’000 Lease 10,798 5,423 Non-lease 9,200 8,320 Total charter income 19,998 13,743
11. Fee income
The Group
6 months ended 30 June 2021 2020 US$’000 US$’000 Asset management and administration fee 1,581 1,668 Arrangement and agency fee 1,011 1,753 Brokerage commission 333 1,211 Incentive fee – 196 Total fee income 2,925 4,828

- 20 -
Notes To The Condensed Interim Consolidated Financial Information For The Six Months Ended 30 June 2021 12. Investment returns
The Group 6 months ended 30 June
2021 2020 US$’000 US$’000
Realised gain on investment property – 1,403 Realised gain/(loss) on investments: - Shipping 915 76 - Small residential property developments 643 92 - Listed shares 527 15 - Others – (31) Property rental income 328 245 Fair value adjustment on investments: - Shipping 151 (224) - Commercial office/industrial buildings (41) 871 - Small residential property developments 104 34 - Listed shares – (362) - Others (122) – Net adjustments on derivative financial instruments – 87
2,505 2,206 13. Income tax
The Group calculates the period income tax expense using tax rates prevailing in the countries in which the Group operates, based on existing legislation, interpretations and practices in respect thereof, that would also be applicable to the expected total annual earnings.
The Group
6 months ended 30 June 2021 2020 US$’000 US$’000
Current income taxation 322 386 Deferred income tax expense relating to origination and
reversal of temporary differences 3 2 Income tax expense recognised in profit or loss 325 388

- 21 -
Notes To The Condensed Interim Consolidated Financial Information For The Six Months Ended 30 June 2021 14. Dividends
The Group and the Company
6 months ended 30 June 2021 2020 US$’000 US$’000
Paid during the interim period:
Dividends on ordinary shares:
- Final dividend for 2020: SG cents 1.00 per share (S$0.79 million) (2019: SG cents 2.20 per share (S$1.73 million)) 592 1,224
Proposed but not paid as at 30 June: Dividends on ordinary shares - Interim dividend for 2021: SG cents 2.00 per share (S$1.57
million) (2020: S$Nil) 1,169 – 15. Profit/(loss) per share
Basic and diluted profit/(loss) per share is calculated by dividing the profit/(loss) attributable to owners of the parent by the weighted average number of ordinary shares in issue during the interim period. The following table reflects the profit/(loss) and share data used in computation of basic and diluted profit per share for the interim period ended 30 June:
The Group
6 months ended 30 June 2021 2020 Weighted average number of ordinary shares in issue (‘000) 78,600 78,600 Continuing operations Profit/(loss) from continuing operations attributable to owners of
the parent (US$’000) 7,180 (10,143) Profit/(loss) per share (US cents per share) from continuing
operations - basic and diluted 9.13 (12.90) Discontinued operation Profit from discontinued operation attributable to owners of the
parent (US$’000) – 6,316 Profit per share (US cents per share) from discontinued operation
- basic and diluted – 8.04 Total Profit/(loss) attributable to owners of the parent (US$’000) 7,180 (3,827) Profit/(loss) per share (US cents per share) - basic and diluted 9.13 (4.87)

- 22 -
Notes To The Condensed Interim Consolidated Financial Information For The Six Months Ended 30 June 2021 16. Net asset value
The Group The Company
30 June
2021 31 December
2020 30 June
2021 31 December
2020 Total number of ordinary
shares in issue (‘000) 78,600 78,600 78,600 78,600
Net asset value per ordinary share (US$) 1.56 1.52 1.44 1.45
17. Deconsolidation of consolidated entities
During the interim period ended 30 June 2021, the Group dissolved the investment in GK Alero 33 (2020: GK Alero 3 and GK Alero 20). The consolidated entities were dormant following the disposal of their investment in small residential properties.
In addition, wholly-owned Florida Containership S.A. was liquidated and deconsolidated during the interim period ended 30 June 2021 following the disposal of its containership investment.
No gain or loss arose from the deconsolidation of consolidated entities for the current interim financial period and the corresponding interim period in 2020.
18. Assets and liabilities measured at fair value
(a) Fair value hierarchy The Group categorises fair value measurements using a fair value hierarchy that is depended on the valuation inputs used as follows:
Level 1 - Quoted prices (unadjusted) in active markets for identical assets or liabilities; Level 2 - Inputs other than quoted prices included within Level 1 that are observable for the assets
or liabilities, either directly (i.e., as prices) or indirectly (i.e., derived from prices); and Level 3 - Inputs for the assets or liabilities that are not based on observable market data (i.e.,
unobservable inputs).

- 23 -
Notes To The Condensed Interim Consolidated Financial Information For The Six Months Ended 30 June 2021
18. Assets and liabilities measured at fair value (cont’d)
(a) Fair value hierarchy (cont’d)
Analysis of each class of assets and liabilities measured at fair value by level of fair value hierarchy as at the end of the reporting period was as follows:
The Group Level 1 Level 2 Level 3 Total US$’000 US$’000 US$’000 US$’000 As at 30 June 2021
Recurring fair value measurements Financial assets
Fair value through profit or loss Unlisted shares
- Shipping – – 3,055 3,055 - Residential – – 71 71 - Commercial office/industrial buildings – 4,340 21,910 26,250 - Small residential property
developments – – 3,127 3,127 - Others – – 909 909
– 4,340 29,072 33,412 Non-financial assets
Investment properties – – 11,363 11,363 – 4,340 40,435 44,775 Financial liabilities
Derivatives designated as hedges Interest rate swaps – (512) – (512) Cross currency rate swaps – (303) – (303) – (815) – (815)
Investments in unlisted shares of special purpose companies that hold ships, residential projects, commercial office/industrial buildings, small residential property developments and other projects are measured at fair value through profit or loss. The fair values of these investments are assessed with reference to the fair values of the underlying assets.

- 24 -
Notes To The Condensed Interim Consolidated Financial Information For The Six Months Ended 30 June 2021
18. Assets and liabilities measured at fair value (cont’d)
(a) Fair value hierarchy (cont’d)
The Group Level 1 Level 2 Level 3 Total US$’000 US$’000 US$’000 US$’000 As at 31 December 2020
Recurring fair value measurements Financial assets
Fair value through profit or loss Unlisted shares
- Shipping – – 2,520 2,520 - Residential – – 66 66 - Commercial office/industrial buildings – 16,004 11,401 27,405 - Small residential property
developments – – 3,649 3,649 - Others – – 997 997 Unlisted performance notes - Distressed asset – – 100 100
Listed shares 1,051 – – 1,051 1,051 16,004 18,733 35,788
Non-financial assets
Investment properties – – 9,853 9,853 1,051 16,004 28,586 45,641 Financial liabilities
Derivatives designated as hedges Interest rate swaps – (839) – (839) Cross currency rate swaps – (158) – (158) – (997) – (997)

- 25 -
Notes To The Condensed Interim Consolidated Financial Information For The Six Months Ended 30 June 2021
18. Assets and liabilities measured at fair value (cont’d) (a) Fair value hierarchy (cont’d) The movements in fair value measurements in Level 3 during the periods were as follows:
The Group Unlisted shares
Investment properties Total
US$’000 US$’000 US$’000 At 1 January 2020 11,128 16,397 27,525
Fair value adjustment recognised in profit or loss 2,040 – 2,040 Purchases 6,188 7,251 13,439 Disposals (3,765) (14,370) (18,135) Deconsolidation of subsidiary (6) – (6) Income proceeds from investment (522) – (522) Transfers into level 3 3,464 – 3,464 Currency translation differences 206 575 781
At 31 December 2020 and at 1 January 2021 18,733 9,853 28,586 Fair value adjustment recognised in profit or loss 98 – 98 Purchases 2,241 2,176 4,417 Disposals (3,341) – (3,341) Transfers into level 3 11,657 11,657 Currency translation differences (316) (666) (982)
At 30 June 2021 29,072 11,363 40,435 There was no transfer of fair value measurements between Level 1 and Level 2 during the periods. (b) Level 2 fair value measurements The following is a description of the valuation techniques and inputs used in the fair value measurement for assets and liabilities that are categorised within Level 2 of the fair value hierarchy: Derivative financial instruments Forward currency contracts and interest rate swap contracts are valued using a valuation technique with market observable inputs. The most frequently applied valuation techniques include forward pricing and swap models, using present value calculations. The models incorporate various inputs including the credit quality of counterparties, foreign exchange spot and forward rates, interest rate curves and forward rate curves.

- 26 -
Notes To The Condensed Interim Consolidated Financial Information For The Six Months Ended 30 June 2021
18. Assets and liabilities measured at fair value (cont’d)
(c) Level 3 fair value measurements Description of significant unobservable inputs used in Level 3 fair value measurements are as follows:
Descriptions Note
Fair value at Valuation
techniques
Significant unobservable
inputs
Range 30
June 2021
31 December
2020 30 June
2021 31 December
2020 US$’000 US$’000
Commercial office/industrial building: - Unlisted shares (i) 20,299 8,674 Income
approach Gross development
value per square foot
HK$11,500 – HK$17,000
HK$11,500 – HK$17,000
Discount rate 5.0% 5.0%
Development cost
per square foot HK$1,400 –
HK$2,100 HK$1,400 –
HK$2,100
1,612 2,727 Market comparable approach
Adjustments on market transaction
price based on valuer’s
assumption1
5.0 - 20.0% 5.0 - 20.0%
- Investment properties
1,819 1,798 Income approach
Long term sustainable growth
rate
1% 1%
Capitalisation rate 3.35% 3.35%
Shipping: - Unlisted shares (ii) 2,946 2,403 Income
approach Daily charter rate US$8,000 -
US$21,000 US$8,000 - US$27,000
Terminal value US$Nil US$7 million Discount rate 6.0% - 6.6% 4.6% - 6.6%
Small residential property developments: - Investment
properties 9,544 8,055 Income
approach
Property completed:
Discount rate/Gross capitalisation rate
5% 5%
Monthly rental per
square meter JPY4,000 JPY4,000
Income approach
Property under construction:
Gross development value per square
meter
– JPY1.2 million
Development cost per square meter
– JPY0.5 million
Discount rate – 5% 1 the adjustments are made for any difference in the nature, location or condition of the specific property

- 27 -
Notes To The Condensed Interim Consolidated Financial Information For The Six Months Ended 30 June 2021 18. Assets and liabilities measured at fair value (cont’d)
(c) Level 3 fair value measurements (cont’d) The following table shows the impact on the Level 3 fair value measurement of assets and liabilities that are sensitive to changes in unobservable inputs that reflect reasonably possible alternative assumptions. The positive and negative effects are approximately the same unless stated otherwise.
Note Descriptions Significant unobservable inputs
Percentage change
Impact of percentage change in inputs on profit before tax
30 June 2021
31 December 2020
US$‘000 US$‘000 Commercial office/industrial building:
(i) - Unlisted shares Gross development value per square foot
(15%)
(4,975) (1,787)
Discount rate (2%) 482 109
Development cost per square
foot (5%) 307 106
Adjustments on market transaction price based on
valuer’s assumption
(20%)
(323)
(513) Shipping:
(ii) - Unlisted shares Daily charter rate 5% 1,470 1,336
Selling price at end of lease term1
15% – –
Discount rate 1% (110) (68) 1 There are no negative effect as the investments with this input are already nil balance. (d) Valuation policies and procedures Management oversees the Group’s financial reporting valuation process and is responsible for setting and documenting the Group’s valuation policies and procedures. For valuation performed by external valuation experts, management reviews the appropriateness of the valuation methodologies and assumptions adopted as well as evaluates the appropriateness and reliability of the inputs (including those developed internally by the Group) used in the valuations. In selecting the appropriate valuation models and inputs to be adopted for each valuation that uses significant non-observable inputs, external valuation experts are requested to calibrate the valuation models and inputs to actual market transactions (which may include transactions entered into by the Group with third parties as appropriate) that are relevant to the valuation if such information are reasonably available. Significant changes in fair value measurements from period to period are evaluated by management for reasonableness. Key drivers of the changes are identified and assessed for reasonableness against relevant information from independent sources or internal sources if necessary and appropriate. Management documents and reports its analysis and results of the external valuations to the Board of Directors on a periodic basis.

- 28 -
Notes To The Condensed Interim Consolidated Financial Information For The Six Months Ended 30 June 2021
18. Assets and liabilities measured at fair value (cont’d) (e) Fair value of financial instruments by classes that are not carried at fair value and
whose carrying amounts are reasonable approximation of fair value Accounts receivable, amounts due from subsidiary, other receivables, deposits pledged as collateral, cash and bank balances, borrowings, due to Tokumei Kumiai investors, accounts payable, amounts due to subsidiaries, other payables and accruals. The carrying amounts of these financial assets and liabilities other than borrowings at fixed rate are reasonable approximation of fair values due to their short-term nature or that they are floating rate instruments that are re-priced to market interest rates on or near the end of the reporting period. The carrying amount of borrowings at fixed rate are reasonable approximation of fair values, either due to their short-term nature or that they are fixed rate instruments, which the fixed interest rate are reasonable approximation of market floating rates on or near the end of the reporting period.
19. Capital commitments
Capital expenditure contracted for at the end of the reporting period but not recognised in the consolidated financial statements of the Group was as follows:
The Group 30 June 2021 31 December 2020 US$’000 US$’000 Capital commitments in respect of:
Investment properties under construction – 2,313 Properties under development 1,303 –

- 29 -
Notes To The Condensed Interim Consolidated Financial Information For The Six Months Ended 30 June 2021 20. Related party transactions
In addition to the information disclosed elsewhere in the consolidated financial statements, the following transactions took place between the Group and related parties in the normal course of business:
The Group For the 6 months ended June 2021 2020
Associates Investee
companies Other related companies Associates
Investee companies
Other related companies
US$’000 US$’000 US$’000 US$’000 US$’000 US$’000 Consolidated income statement
Fee income:
Asset management and administration fee 67 1,182 – 55 1,219 –
Arrangement and agency fee – 794 142 – 502 576 Brokerage commission – 209 – – 263 – Incentive fee – – – – 196 –
Investment returns:
Realised gain on investments - Shipping – 915 – – 76 –
Property rental income – 117 – – – –
Interest income – 55 – – 68 –
The Group As at 30 June 2021 As at 31 December 2020
Associates Investee
companies Other related companies Associates
Investee companies
Other related companies
US$’000 US$’000 US$’000 US$’000 US$’000 US$’000 Consolidated balance sheets Current
Accounts receivable 42 262 9 32 432 9 Other receivable – 23 – 28 – – Accounts payable – 2 – 3 1 – Other payable – 48 – 23 10 –
Corporate guarantees provided to lenders – – – – 4,538 –
Other related companies refer to shareholders of the Group, who fit the definition of related parties and entities invested by an investee company.
21. Events occurring after the reporting period
There are no known subsequent events which have led to adjustments to this set of interim financial statements.

- 30 -
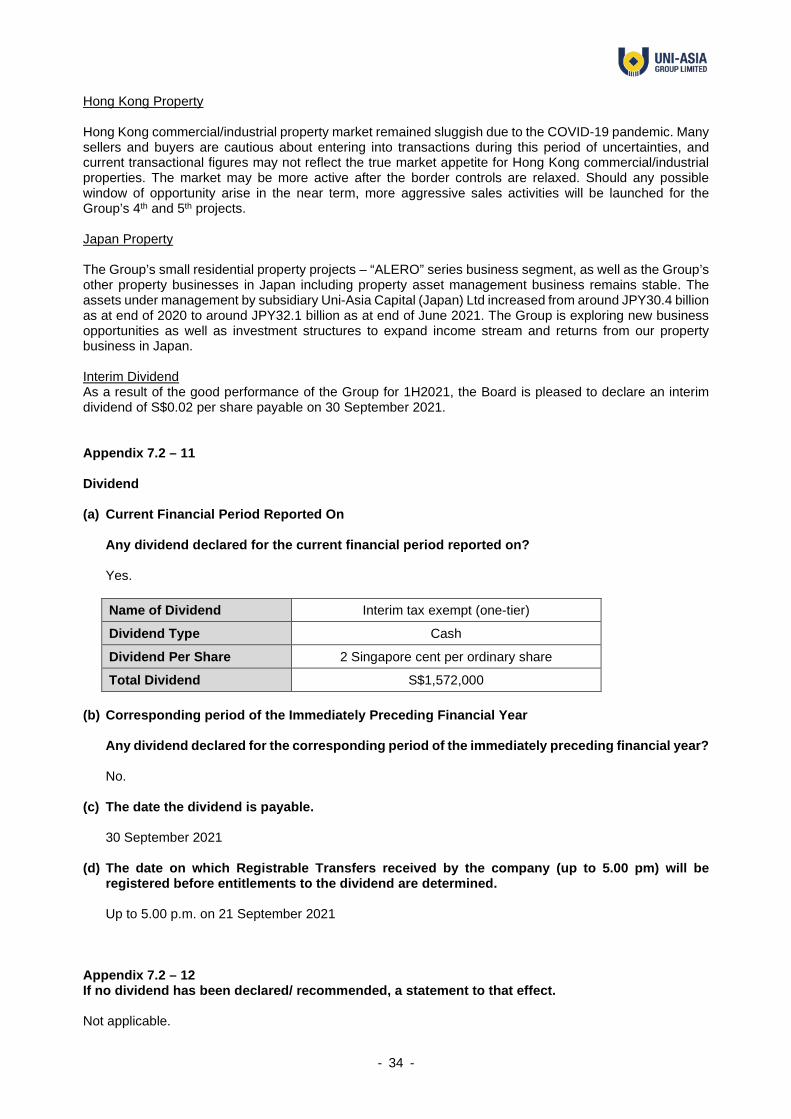
Other Information Required by Listing Rule Appendix 7.2 Appendix 7.2 – 2 Whether the figures have been audited or reviewed and in accordance with which auditing standard or practice. The figures have not been audited or reviewed. Appendix 7.2 – 3 Where the figures have been audited or reviewed, the auditors’ report (including any qualifications or emphasis of a matter). Not applicable. Appendix 7.2 – 8 A review of the group performance, to the extent necessary for a reasonable understanding of the group’s business. It must include discussion of any significant factors that affected the turnover, costs, and earnings for the current financial period report on, including (where applicable) seasonal or cyclical factors; and any material factors that affected the cash flow, working capital, assets or liabilities of the group during current financial period reported on. Review of Consolidated Profit or Loss Statement Total Income Total income of the Group was US$31.7 million for the interim period ended 30 June 2021 (“1H2021”), a 47% increase from US$21.6 million for the 6 months ended 30 June 2020 (“1H2020”). Changes in major components of total income, including charter income, fee income, sale of property under development, investment returns and other income are explained below. (i) Charter Income Charter income increased by 46% from US$13.7 million in 1H2020 to US$20.0 million in 1H2021, notwithstanding that the Group had disposed of one wholly-owned containership in the first quarter of 2021, i.e. there was one less ship contributing to charter income in 1H2021 compared to 1H2020. Following a disappointing year in 2020 as a result of the COVID-19 pandemic, the shipping market bounced back strongly in 1H2021 due to various factors including increased cross-border trade (increasing demand) and port congestion (decreasing supply). While the Baltic Handysize Index (“BHSI”) never crossed the level of 700 for the whole of 2020, BHSI averaged 1,084 for 1H2021. As can be seen from Chart (i) below, BHSI for 1H2021 (blue line) performed much better than that in 1H2020 (orange line). The Group’s wholly-owned dry bulk ships had benefited from the strong market in 1H2021.
Chart (i) – BHSI for 1H2021 (blue line) vis-à-vis BHSI for 1H2020 (orange line)
Source: Bloomberg

- 31 -
(ii) Fee Income Total fee income was US$2.9 million in 1H2021, a decrease of 39% from US$4.8 million in 1H2020. Recurring asset management and administration fee income reduced by 5% in 1H2021 compared to 1H2020 mainly due to less administration fee income following the disposal of 2 joint-investment containership investments which contributed to administration fee income. Arrangement and agency fee as well as brokerage commission decreased in 1H2021 due to less arrangement and brokerage commission deals closed in 1H2021. No incentive fees were recorded in 1H2021. Please refer to Note 11 of Notes to the Condensed Interim Consolidated Financial Information for breakdown of Fee Income for 1H2021 and 1H2020. (iii) Sale of property under development A property under development was sold for US$5.1 million in 1H2021. No property categorised as property under development was sold in 1H2020. (iv) Investment Returns Investment returns for 1H2021 was a gain of US$2.5 million compared to US$2.2 million for 1H2020. Realised gain of US$0.9 million was recognised for a joint-investment containership sold during 1H2021. Realised gain from sale of small residential property development projects was US$0.6 million while realised gain from sale of listed shipping shares was US$0.5 million for 1H2021. Property rental income was US$0.3 million for 1H2021 compared to US$0.2 million for 1H2020. Total net fair valuation gain from the Group’s shipping, property and other investments were US$0.09 million for 1H2021. Please refer to Note 12 of Notes to the Condensed Interim Consolidated Financial Information for breakdown of Investment Returns for 1H2021 and 1H2020. (v) Other Income Other income was US$1.1 million for 1H2021 compared to US$0.3 million in 1H2020 mainly due to various one-off miscellaneous receipts in 1H2021. Total Operating Expenses Employee benefits expenses increased by 35% from US$3.1 million in 1H2020 to US$4.2 million in 1H2021 due to accrual of variable component associated with performance of the Group. Amortisation and depreciation decreased by 18% from US$5.5 million in 1H2020 to US$4.5 million in 1H2021 as a result of impairment of property, plant and equipment in 2020. Vessel operating expenses increased by 13% from US$8.3 million in 1H2020 to US$9.4 million in 1H2021 mainly due to increase in pandemic-related vessel operating expenses, including additional costs incurred for crew change and crew-related costs. Notwithstanding the aforementioned, the 13% increase of vessel operating expenses was at a much lower rate than the 46% increase of charter income from 1H2020 to 1H2021. Costs of property under development sold was US$4.5 million for 1H2021. In 1H2021, the Group completed the sale of (i) one wholly-owned containership and (ii) one 50% owned containership. The sale of (i) the wholly-owned containership resulted in a gain from disposal of asset held for sale of US$0.4 million in 1H2021. The sale of (ii) the 50% owned containership resulted in the receipt of a US$1.1 million loan previously impaired, hence the reversal of impairment of loan receivable. Net foreign exchange gain of US$1.2 million was due to unrealised translation gain from unhedged portion of Japanese Yen loans arising from weakening of Japanese Yen against US Dollars in 1H2021. Net operating expenses was US$22.5 million for 1H2021 compared to US$28.8 million for 1H2020, a decrease of 22%.

- 32 -
Operating Profit The Group recorded an operating profit of US$9.1 million for 1H2021 compared to an operating loss of US$7.3 million for 1H2020. Finance Costs and Other Costs Interest on borrowings was US$1.5 million for 1H2021, a 32% decrease from US$2.2 million for 1H2020 following decrease in total borrowings as part of the Group’s deleveraging strategy. Net Profit After Tax Net profit after tax for 1H2021 for the Group after factoring in the above was US$7.0 million, compared to a loss of US$3.9 million in 1H2020, and was higher than the profit of US$6.8 million recorded during pre-COVID-19 pandemic 1H2019. Review of Statement of Financial Positions Non-current assets The Group’s non-current assets decreased by US$3.2 million from US$187.7 million on 31 December 2020 to US$184.5 million on 30 June 2021. Material variances are as follows: 1) Increase in investment properties by US$1.5 million mainly due to additional investment in existing
investment properties; 2) Increase in investments of US$0.5 million mainly due to investment in small residential property
investments; and 3) Decrease in property, plant and equipment of US$4.3 million and decrease in right-of-use assets of
US$0.8 million mainly due to depreciation. Current assets The Group’s current assets decreased by US$14.3 million from US$61.8 million on 31 December 2020 to US$47.4 million on 30 June 2021. Material variances are as follows: 1) Decrease in investments of US$2.9 million mainly due to disposal of small residential property
investments; 2) Increase in properties under development of US$0.4 million from US$6.6 million on 31 December 2020
to US$7.0 million on 30 June 2021 due to net additional investment in the Group’s ALERO develop-for-sale projects;
3) Asset held for sale was US$9.4 million on 31 December 2020 compared to US$Nil on 30 June 2021 as the containership investment classified under asset held for sale on 31 December 2020 had been disposed of in 1H2021;
4) US$1 million deposits pledged as collateral for borrowings as at 30 June 2021 compared to US$Nil on 31 December 2021; and
5) Decrease in cash and bank balances by US$3.2 million. Please see the following notes to statement of cash flows for further information.
Total liabilities Total liabilities decreased by US$20.9 million from US$130.1 million on 31 December 2020 to US$109.2 million on 30 June 2021. Material variances are as follows: 1) Decrease in total borrowings (including both current and non-current) of the Group by US$18.8 million
mainly due to scheduled repayment of long-term borrowings as well as repayment of short-term borrowings as part of the Group’s deleveraging strategy; and
2) Increase in dividend payable by US$1.2 million following the accrual of interim dividend for FY2021.

- 33 -
Review of Statement of Cash Flows The Group’s cash and bank balances decreased by US$3.2 million in 1H2021 after the effects of foreign exchange rate changes. Material items are listed below. [A] In 1H2021, due mainly to good shipping market as well as sale of property under development, US$8.1
million was generated from operating activities, an increase of US$6.3 million from 1H2020. [B] Cash flows generated from investing activities were US$11.2 million for 1H2021. Main cash inflows from investing activities include: i) proceeds from redemption/sale of investments of US$5.4 million, of which US$2.9 million pertained to
small residential property projects (ALERO projects), US$0.9 million pertained to redemption of capital from containership investee company, and US$1.6 million pertained to proceeds from sale of shipping-related listed investment;
ii) proceeds from disposal of a containership of US$9.8 million (proceeds from disposal of asset held for sale);
iii) repayment of loan by ship investee company of US$1.1 million; and iv) income proceeds from investments of US$1.1 million mainly from property investment in Hong Kong. Main cash outflows from investing activities include: i) additional capital injection into an existing investment property (ALERO project) of US$2.1 million; ii) purchase of investments of US$2.3 million of which US$1.9 million pertained to small residential property
investments (ALERO projects) and US$0.4 million pertained to funding of an existing ship investment; iii) increase in property, plant and equipment of US$0.9 million mainly due to capitalisation of drydocking-
related expenses; and iv) increase in deposits pledged as collateral of US$1.0 million. [C] Cash flows used in financing activities were US$21.5 million in 1H2021. Main cash outflows from financing activities include: i) repayments of borrowings of US$26.5 million offset by proceeds from borrowings of US$9.4 million; ii) interest and other finance cost paid of US$1.6 million; iii) fixed lease payments classified as lease principal paid (amounting to US$1.8 million) and lease interest
paid (amounting to US$0.1 million); and iv) final dividend of US$0.6 million for FY2020 approved in AGM was paid in 1H2021. Appendix 7.2 – 9 Where a forecast, or a prospect statement, has been previously disclosed to shareholders, and variance between it and the actual results. Not applicable. The Group has not provided a forecast. Appendix 7.2 – 10 A commentary at the date of the announcement of the significant trends and competitive conditions of the industry in which the group operates and any known factors or events that may affect the group in the next reporting period and the next 12 months. Dry Bulk After a generally challenging 2020 as a result of the impact of the COVID-19 pandemic, shipping market rebounded strongly in 2021. The combination of several favourable factors – including surging demand for commodity, strong demand for cross-border trades, disruption (such as port congestion), limited new supply of ships (in particular handysize bulk carriers) in coming few years arising from historical low newbuilding orderbook – boosted the dry bulk market. Dry bulk market freight rates reached levels not seen in a decade. As the fundamentals of the dry bulk market are still strong, the general market consensus is that the current positive market could extend till the next year. The Group’s 10 wholly-owned dry bulk carriers are currently on relatively short charter periods due either in 2H2021 or in 2022, and would be able to reap favourable returns from the ongoing bullish shipping market.
- 34 -
Hong Kong Property Hong Kong commercial/industrial property market remained sluggish due to the COVID-19 pandemic. Many sellers and buyers are cautious about entering into transactions during this period of uncertainties, and current transactional figures may not reflect the true market appetite for Hong Kong commercial/industrial properties. The market may be more active after the border controls are relaxed. Should any possible window of opportunity arise in the near term, more aggressive sales activities will be launched for the Group’s 4th and 5th projects. Japan Property The Group’s small residential property projects – “ALERO” series business segment, as well as the Group’s other property businesses in Japan including property asset management business remains stable. The assets under management by subsidiary Uni-Asia Capital (Japan) Ltd increased from around JPY30.4 billion as at end of 2020 to around JPY32.1 billion as at end of June 2021. The Group is exploring new business opportunities as well as investment structures to expand income stream and returns from our property business in Japan. Interim Dividend As a result of the good performance of the Group for 1H2021, the Board is pleased to declare an interim dividend of S$0.02 per share payable on 30 September 2021. Appendix 7.2 – 11 Dividend (a) Current Financial Period Reported On
Any dividend declared for the current financial period reported on?
Yes. Name of Dividend Interim tax exempt (one-tier)
Dividend Type Cash
Dividend Per Share 2 Singapore cent per ordinary share
Total Dividend S$1,572,000 (b) Corresponding period of the Immediately Preceding Financial Year
Any dividend declared for the corresponding period of the immediately preceding financial year? No.
(c) The date the dividend is payable.
30 September 2021
(d) The date on which Registrable Transfers received by the company (up to 5.00 pm) will be registered before entitlements to the dividend are determined.
Up to 5.00 p.m. on 21 September 2021
Appendix 7.2 – 12 If no dividend has been declared/ recommended, a statement to that effect. Not applicable.

- 35 -
Appendix 7.2 – 13 If the Group has obtained a general mandate from shareholders for IPTs, the aggregate value of such transactions as required under Rule 920(1)(a)(ii). If no IPT mandate has been obtained, a statement to that effect.
Name of Interested Person Aggregate value of all interested person transactions
conducted under the Shareholders’ Mandate (excluding transactions less than S$100,000)
pursuant to Rule 920 US$’000
Yamasa Co., Ltd (and its associates) 1,110.9
Appendix 7.2 – 14 Confirmation that the issuer has procured undertakings from all its directors and executive officers (in the format set out in Appendix 7.7) under Rule 720(1). The Company confirms that the undertakings under Rule 720(1) of the Listing Manual have been obtained from all its directors and executive officers in the format set out in Appendix 7.7.

- 36 -
CONFIRMATION BY THE BOARD PURSUANT TO RULE 705(5) OF THE LISTING MANUAL
On behalf of the Board of Directors of the Company, we hereby confirm to the best of our knowledge that nothing has come to the attention of the Board of Directors of the Company which may render the interim financial statements for the half-year ended 30 June 2021 to be false or misleading in any material aspect.
On behalf of the Board of Directors
Michio Tanamoto Executive Chairman
Date: 13 August 2021
Kenji Fukuyado Chief Executive Officer