UNHCR Health Information Systemiawg.net/.../08/UNHCR-Health-Information-System-Final.pdfUNHCR Health...
18
UNHCR Health Information System Retrospective analysis of Reproductive health indicators in post-emergency refugee camps Sathya Doraiswamy, UNHCR
Transcript of UNHCR Health Information Systemiawg.net/.../08/UNHCR-Health-Information-System-Final.pdfUNHCR Health...

UNHCR Health Information System
Retrospective analysis of Reproductive health
indicators in post-emergency refugee camps
Sathya Doraiswamy, UNHCR

Background
2014: Global Evaluation of RH in Crises
2006: UNHCR Health Information System (HIS)

http://twine.unhcr.org/app/
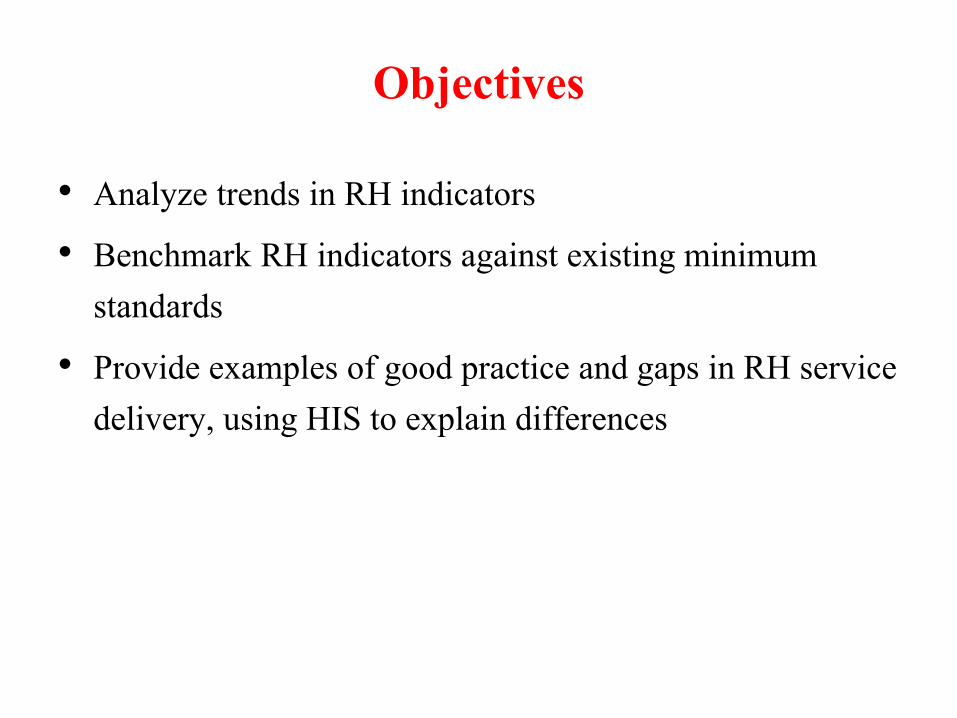
Objectives
• Analyze trends in RH indicators
• Benchmark RH indicators against existing minimum standards
• Provide examples of good practice and gaps in RH service delivery, using HIS to explain differences

Methods
• Monthly camp data 2007-2013 from Twine database
• 10 countries / 56 camps
• 7 RH indicators

Methods (cont’d)
Country and camp inclusion:
- Completeness – 90% of its monthly reports
- Total reporting months – At least 6 months
RH indicator inclusion:
- MISP objectives
- Plausibility

Methods (cont’d)
Indicator Formula
Maternal mortality rate Number of pregnancy-related deaths / Total number of live births x 100000
Neonatal mortality rate Number of deaths for newborns < 28 days of life / Total number of live births x 1000
Proportion of births attended by skilled health worker
Number of deliveries attended by trained health workers / Number of deliveries x 100
Proportion of live births performed by caesarian section
Number of live births performed by caesarian section / Number of live births x 100
Proportion of ANC mothers who were screened for syphilis during pregnancy
Number of pregnant women who had been screened for syphilis during the antenatal period at the time of delivery / Total number of live births x 100
Rate of condom distribution among the population
Number of condoms distributed per month (male and female) / Total population
Proportion of rape survivors who receive post-exposure prophylaxis (PEP) within 72 hours of an incident occurring
Number of rape survivors who receive PEP within 72 hours of an incident / Total number of rape cases reported x100

ResultsCountry No. of
campsNo. of months of data
HIS imp.yr
Monthly Camp Population Monthly Camp Live Births
Mean Std Dev Median IQR Mean Std Dev Median IQR
Bangladesh 2 154 2007 14,529 3,037 14,510 6,018 43.1 12.8 43 21
Chad 16 994 2007 17,953 7,960 17,362 9,505 57.1 47.6 53.5 49
Djibouti 1 71 2008 13,565 4,031 13,133 8,240 23.1 7.3 22 10
Kenya 5 412 2007 81,723 33,470 48,529 48,529 185.9 83.9 186.5 113
Nepal 2 105 2007 19,291 8,961 18,236 14,854 29.8 17.3 26 19
Tanzania 1 96 2007 57,850 8,262 60,591 12,320 177.8 35.6 174.5 45
Thailand 9 648 2008 15,907 11,474 15,825 10,274 36.4 27.7 33 26
Uganda 13 740 2007 15,333 16,884 8,302 16,380 39.2 51.8 15 51.5
Yemen 3 197 2008 20,314 7,307 21,770 7,965 40.3 17.8 39 17
Zambia 4 149 2008 11,864 4,245 10,687 5,335 49.2 109.2 31 31

Results: MMR
Djibouti - 526.3
416.7
0 0 0 00
200
400
600
800
1000
1200
2006 2007 2008 2009 2010 2011 2012 2013 2014
Bangladesh
Chad
Djibouti
Kenya
Nepal
Tanzania
Thailand
Uganda
Yemen
Zambia
Bangladesh- Host
Chad- Host
Djibouti- Host
Kenya- Host
Nepal- Host
Tanzania- Host
Thailand- Host
Uganda- Host
Yemen- Host
Zambia- Host
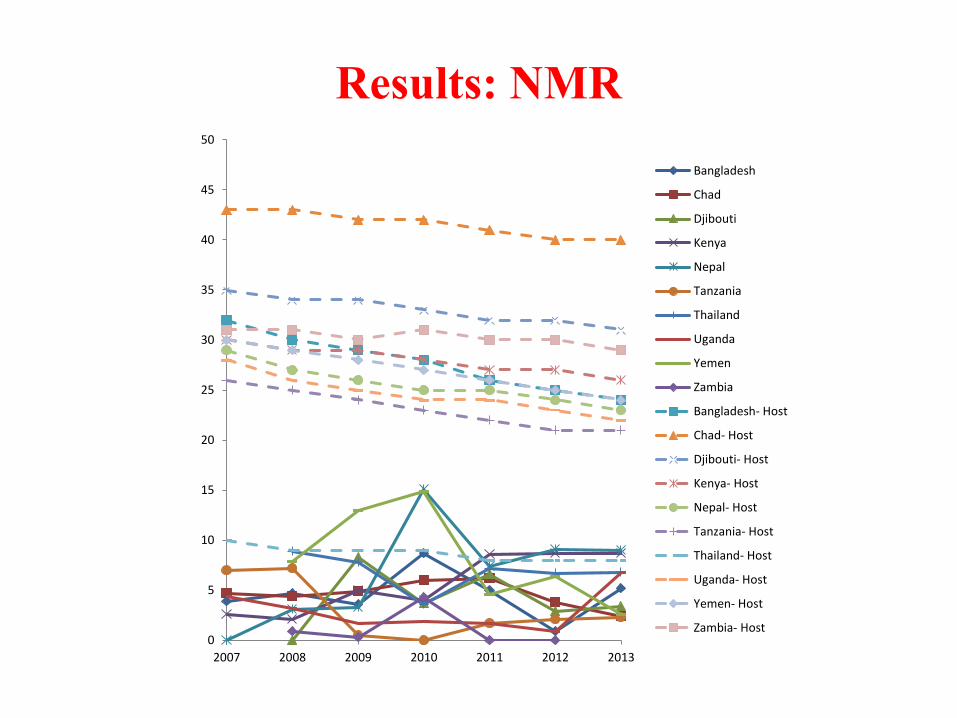
Results: NMR
0
5
10
15
20
25
30
35
40
45
50
2007 2008 2009 2010 2011 2012 2013
Bangladesh
Chad
Djibouti
Kenya
Nepal
Tanzania
Thailand
Uganda
Yemen
Zambia
Bangladesh- Host
Chad- Host
Djibouti- Host
Kenya- Host
Nepal- Host
Tanzania- Host
Thailand- Host
Uganda- Host
Yemen- Host
Zambia- Host

Results: SBA at delivery
0.0%
10.0%
20.0%
30.0%
40.0%
50.0%
60.0%
70.0%
80.0%
90.0%
100.0%
2007 2008 2009 2010 2011 2012 2013
Bangladesh
Chad
Djibouti
Kenya
Nepal
Tanzania
Thailand
Uganda
Yemen
Zambia
Target 100%

Results: C-section rates
0.0%
5.0%
10.0%
15.0%
20.0%
25.0%
30.0%
35.0%
2007 2008 2009 2010 2011 2012 2013
Year
Bangladesh Chad Djibouti Kenya
Nepal Tanzania Thailand Uganda
Yemen Zambia Standard lower Standard Upper
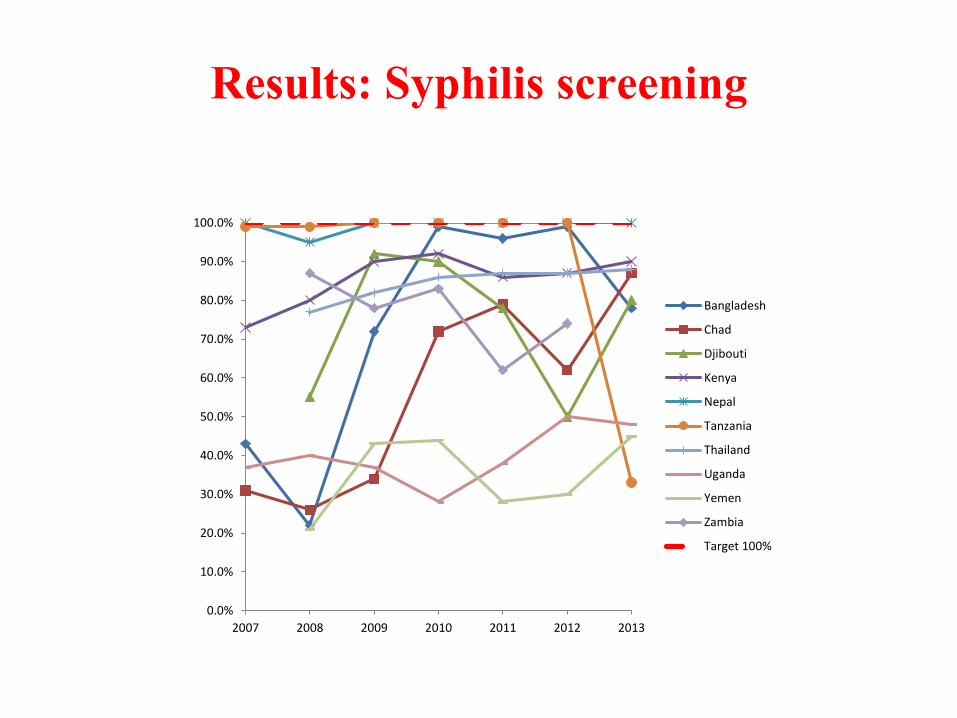
Results: Syphilis screening
0.0%
10.0%
20.0%
30.0%
40.0%
50.0%
60.0%
70.0%
80.0%
90.0%
100.0%
2007 2008 2009 2010 2011 2012 2013
Bangladesh
Chad
Djibouti
Kenya
Nepal
Tanzania
Thailand
Uganda
Yemen
Zambia
Target 100%

Results: Condom distribution
0%
10%
20%
30%
40%
50%
60%
70%
80%
90%
100%
110%
120%
130%
140%
2007 2008 2009 2010 2011 2012 2013
Bangladesh
Chad
Djibouti
Kenya
Nepal
Tanzania
Thailand
Uganda
Yemen
Zambia
Target 50%

Results: Access to PEP
0.0%
10.0%
20.0%
30.0%
40.0%
50.0%
60.0%
70.0%
80.0%
90.0%
100.0%
2009 2010 2011 2012 2013
Bangladesh
Chad
Djibouti
Kenya
Nepal
Tanzania
Thailand
Uganda
Yemen
Zambia
Target 100%

Limitations
Not representative of all refugee camps
Same country – changing contexts
Under-reporting of mortality
Lack of decentralized data at sub-national levels for host
Data quality
Work in progress

Conclusions
Improvements in key RH indicators seen over years
Achievements in some indicators better than the others
More needs to be done to reach set targets
Data quality needs to be assured
Mortality reporting needs review

Acknowledgements• United Nations High Commissioner for Refugees
– Ms. Cornier– Ms. Schilperoord– Dr. Spiegel– Dr. Haskew– Mr. Pike
• US Centers for Disease Control and Prevention– Ms. Whitmill– Mr. Blanton– Dr. Tomczyk
• UNHCR country HIS programs