UNESCO-IHE INSTITUTE FOR WATER EDUCATION - …€¦ · UNESCO-IHE Institute for Water Education,...
102
UNESCO-IHE INSTITUTE FOR WATER EDUCATION INTEGRATED SUSTAINABILITY ASSESSMENT OF STORMWATER MANAGEMENT STRATEGIES – A CASE STUDY OF THE CATCHMENT UPPER REA MAIN, BIRMINGHAM CITY, THE UNITED KINGDOM Thuy T. P. MAI MSc Thesis ES-EPM – ES 09.07 June 2009
-
Upload
truongnguyet -
Category
Documents
-
view
222 -
download
0
Transcript of UNESCO-IHE INSTITUTE FOR WATER EDUCATION - …€¦ · UNESCO-IHE Institute for Water Education,...

UNESCO-IHE INSTITUTE FOR WATER EDUCATION
INTEGRATED SUSTAINABILITY ASSESSMENT OF STORMWATER
MANAGEMENT STRATEGIES – A CASE STUDY OF THE CATCHMENT UPPER REA MAIN,
BIRMINGHAM CITY, THE UNITED KINGDOM
Thuy T. P. MAI MSc Thesis ES-EPM – ES 09.07 June 2009
INTEGRATED SUSTAINABILITY ASSESSMENT OF
STORMWATER MANAGEMENT STRATEGIES - A CASE STUDY OF THE CATCHMENT UPPER REA MAIN,
BIRMINGHAM CITY, UNITED KINGDOM
Master of Science Thesis
by Thuy T.P. Mai
Supervisors
Professor, Dr. Kala Vairavamoorthy (UNESCO-IHE) Dr. Peter van der Steen (UNESCO-IHE)
Associate Professor, Dr. Zoran Vojinovic (UNESCO-IHE)
Examination Committee
Professor, Dr. Kala Vairavamoorthy (UNESCO-IHE), Chairman Dr. Peter van der Steen (UNESCO-IHE)
Associate Professor, Dr. Zoran Vojinovic (UNESCO-IHE) Mr. Frank Grimshaw, Business Strategy Manager (STWL)
"The work in this report received funding from the EU 6th Framework SWITCH project (no.018530)”
This research is done for the partial fulfillment of requirements for the Master of Science degree at the UNESCO-IHE Institute for Water Education, Delft, the Netherlands
Delft June 2009

The findings, interpretations and conclusions expressed in this study do neither necessarily reflect the views of the UNESCO-IHE Institute for Water Education, nor of the individual members of the MSc committee, nor of their respective employers.

- i -
ACKNOWLEDGEMENT
It has been a great opportunity to develop my thesis in the SWITCH project with the
challenging but interesting topic.
First of all, I would like to express my deep gratitude to my supervisor, Professor Kala
Vairavamoorthy for his great guidance and supports. I have come a long way with data
collection and scientific visit thank to Professor Vairavamoorthy’s special helps. I would
also like to express my strong appreciations to my mentors, Dr. Peter van der Steen and
Associate Professor, Dr. Zoran Vojinovic for their ideas and time, reviewing and giving
comments for this paper and all the necessities to develop my work.
I have received a great help from Dr. Christos Makropoulos, author of UWOT model
which is an important part for my work development. He was willing to provide the
model and gave me a very valuable guidance.
In the period of doing my thesis, I have also received significant supports and nice
welcome from Mr. Frank Grimshaw, Business Strategic Manager, Mr. Paul Hurcombe
and the Wastewater Strategy Team of Severn Trent Water Limited, Birmingham, the
United Kingdom.
I would like to thank all staffs of my school, UNESCO-IHE for their kindness during my
Master study in Environmental Planning and Management.
I wish to acknowledge the NFP and SWITCH project for providing all the supports to
make my study and research possible.
Finally, I would like to thank to Solomon D. Seyoum to his technical helps and my close
friend, Duong Tong to her nice friendship supports. My parents and brother always give
me a lot of love and caring for this important time.
Thuy T.P. Mai.

- ii -
ABSTRACT
Due to climate change, urbanization and population growth, many cities in the world are faced with flooding problem. The issue is more critical in United Kingdom recently.
Conventional method for flood mitigation and prevention is to upgrade the pipe network system with diameters that will allow conveyance of design storm discharges. However, this method might be expensive and time consuming.
This thesis is developed with more sustainable and environmental-friendly ways to mitigate and prevent urban flooding. Modern approach considers stormwater nowadays as a valuable resource of urban water cycle. Different urban water management strategies such as stormwater re-use and SUDS are selected as alternative solutions. Decision support tools Urban Water Optioneering Tool and mDSS4 are introduced for the assessment in a broader context for sustainable urban water.
Birmingham is one of the demonstration cities in SWITCH project. The catchment Upper Rea Main in the city is selected as a case study for the thesis development. This area has the history of flooding, especially in recent years with more rainfall in summer. Upper Rea Main is studied to be a feasible application of technical and management solutions. Results of the pipe upgrade and stormwater harvesting with SUDS for flood mitigation and controls are discussed and compared as well as recommendations about flooding prevention are summarized and proposed to appropriate with sustainable developments of municipalities worldwide. Suggestions are also brought about for other cities in SWITCH project.
Keywords: Urban flooding, Infoworks CS, stormwater system, UWOT, mDSS4, integrated urban water management.

- iii -
ABBREVIATIONS
AM Analysis Matrix
ASTM International Standards Organization for Testing and Materials
BMPs Best Management Practices
BCC Birmingham City Council
CSM Creative System Modeling
DAP Drainage Area Plan
DM Decision Maker
DSS Decision Support System
DPSIR Driving Forces-Pressures-State-Impacts-Responses
EC European Commission
Infoworks CS Infoworks Combined Sewer System
IUSM Integrated Urban Stormwater Management
IUWM Integrated Urban Water Management
LAAP Longbridge Area Action Plan
MADM Multi Attribute Decision Making
MCA Multicriteria Decision Aid
mDSS4 Multi Decision Support System, Version 4
MODM Multi Objective Decision Making
SA Sustainability Appraisal
SNA Social Network Analysis
STWL Severn Trent Water Limited
SUDS Sustainable Urban Drainage Systems
SWITCH Sustainable Water Management Improves Tomorrow’s Cities Health
UVQ Urban Velocity and Quantity Model
UWOT Urban Water Optioneering Tool

- iv -
VBA Visual Basic Application
WFD Water Framework Directive
WWTP Wastewater Treatment Plant
- v -
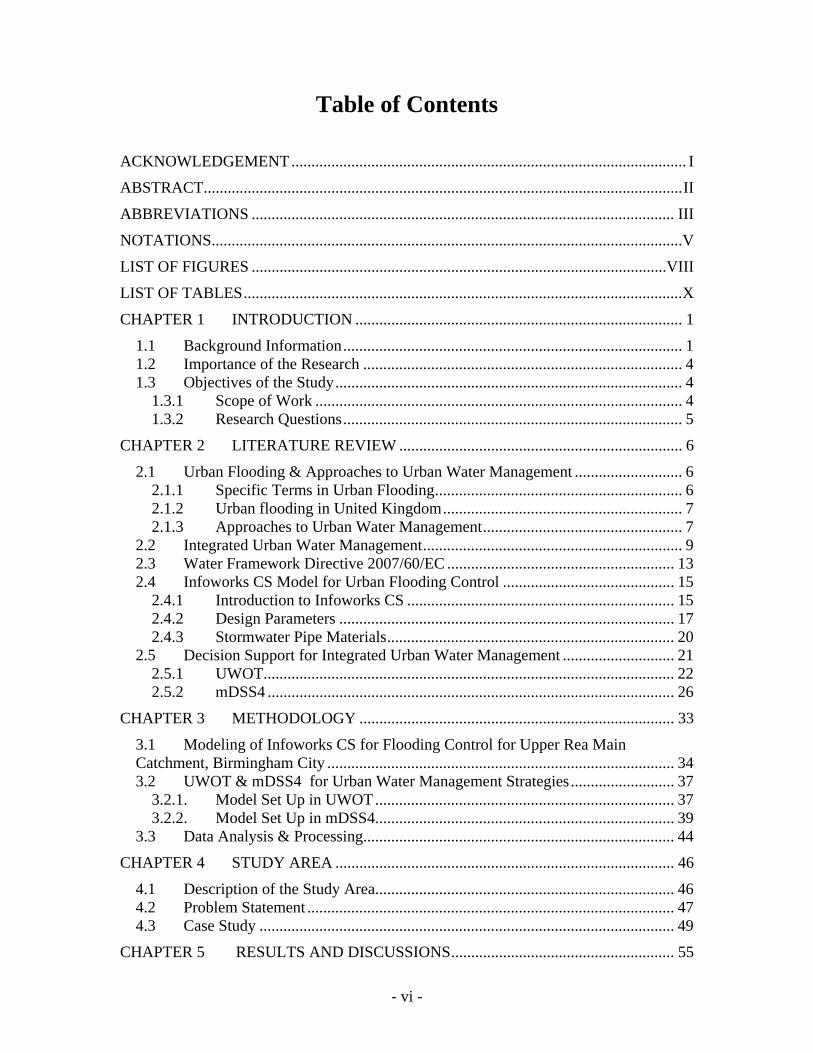
NOTATIONS
AOD Above Ordnance Datum
CMP Corrugated Metal Pipe
CSO Combined Sewer Overflow
D Driving Force
DS Downstream
DWF Dry Weather Flow
GA Genetic Algorithm
HDPE High Density Polyethylene
I Indicators
ID Identification
NRCP Non-reinforced Concrete Pipe
OWA Order Weighting Average
RCP Reinforced Concrete Pipe
RP Return Period
P Pressure
S State
SAW Simple Additive Weighting
US Upstream
- vi -
Table of Contents
ACKNOWLEDGEMENT................................................................................................... I
ABSTRACT........................................................................................................................II
ABBREVIATIONS .......................................................................................................... III
NOTATIONS......................................................................................................................V
LIST OF FIGURES ........................................................................................................VIII
LIST OF TABLES..............................................................................................................X
CHAPTER 1 INTRODUCTION .................................................................................. 1
1.1 Background Information..................................................................................... 1 1.2 Importance of the Research ................................................................................ 4 1.3 Objectives of the Study....................................................................................... 4
1.3.1 Scope of Work ............................................................................................ 4 1.3.2 Research Questions..................................................................................... 5
CHAPTER 2 LITERATURE REVIEW ....................................................................... 6
2.1 Urban Flooding & Approaches to Urban Water Management ........................... 6 2.1.1 Specific Terms in Urban Flooding.............................................................. 6 2.1.2 Urban flooding in United Kingdom............................................................ 7 2.1.3 Approaches to Urban Water Management.................................................. 7
2.2 Integrated Urban Water Management................................................................. 9 2.3 Water Framework Directive 2007/60/EC ......................................................... 13 2.4 Infoworks CS Model for Urban Flooding Control ........................................... 15
2.4.1 Introduction to Infoworks CS ................................................................... 15 2.4.2 Design Parameters .................................................................................... 17 2.4.3 Stormwater Pipe Materials........................................................................ 20
2.5 Decision Support for Integrated Urban Water Management ............................ 21 2.5.1 UWOT....................................................................................................... 22 2.5.2 mDSS4 ...................................................................................................... 26
CHAPTER 3 METHODOLOGY ............................................................................... 33
3.1 Modeling of Infoworks CS for Flooding Control for Upper Rea Main Catchment, Birmingham City ....................................................................................... 34 3.2 UWOT & mDSS4 for Urban Water Management Strategies.......................... 37
3.2.1. Model Set Up in UWOT........................................................................... 37 3.2.2. Model Set Up in mDSS4........................................................................... 39
3.3 Data Analysis & Processing.............................................................................. 44
CHAPTER 4 STUDY AREA ..................................................................................... 46
4.1 Description of the Study Area........................................................................... 46 4.2 Problem Statement ............................................................................................ 47 4.3 Case Study ........................................................................................................ 49
CHAPTER 5 RESULTS AND DISCUSSIONS........................................................ 55

- vii -
5.1 Flood map and the current water usage in the catchment ................................. 55 5.1.1 Flood maps produced from Infoworks CS................................................ 55 5.1.2 Current water usage in the study area ....................................................... 57
5.2 Results for pipeline optimization by Infoworks CS.......................................... 59 5.3 Results for stormwater harvesting produced by UWOT................................... 61 5.4 Results comparisons between the two methods................................................ 64 5.5 Policy making by mDSS4 for the two methods................................................ 69 5.6 Discussions ....................................................................................................... 71
CHAPTER 6 CONCLUSIONS & RECOMMENDATIONS..................................... 74
6.1 Conclusions....................................................................................................... 74 6.2 Recommendations............................................................................................. 74
ANNEXES........................................................................................................................ 76
REFERENCES ................................................................................................................. 88
- viii -
LIST OF FIGURES
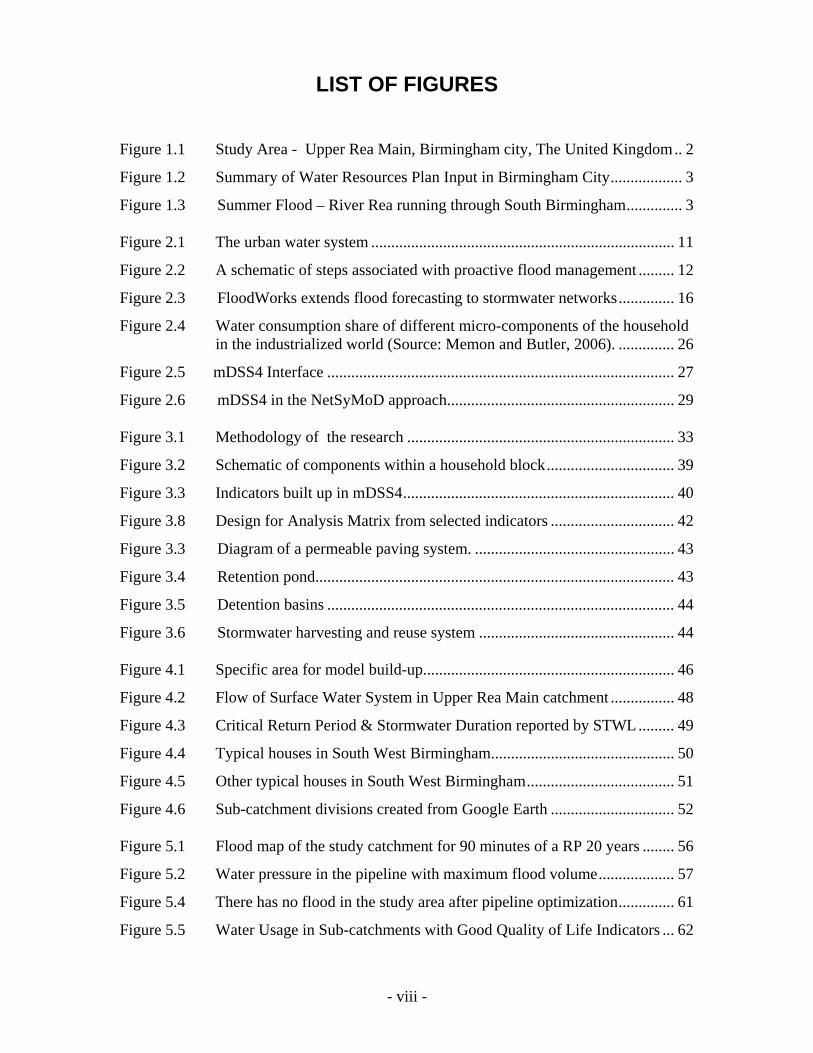
Figure 1.1 Study Area - Upper Rea Main, Birmingham city, The United Kingdom.. 2
Figure 1.2 Summary of Water Resources Plan Input in Birmingham City.................. 3
Figure 1.3 Summer Flood – River Rea running through South Birmingham.............. 3
Figure 2.1 The urban water system ............................................................................ 11
Figure 2.2 A schematic of steps associated with proactive flood management ......... 12
Figure 2.3 FloodWorks extends flood forecasting to stormwater networks.............. 16
Figure 2.4 Water consumption share of different micro-components of the household in the industrialized world (Source: Memon and Butler, 2006). .............. 26
Figure 2.5 mDSS4 Interface ....................................................................................... 27
Figure 2.6 mDSS4 in the NetSyMoD approach......................................................... 29
Figure 3.1 Methodology of the research ................................................................... 33
Figure 3.2 Schematic of components within a household block................................ 39
Figure 3.3 Indicators built up in mDSS4.................................................................... 40
Figure 3.8 Design for Analysis Matrix from selected indicators ............................... 42
Figure 3.3 Diagram of a permeable paving system. .................................................. 43
Figure 3.4 Retention pond.......................................................................................... 43
Figure 3.5 Detention basins ....................................................................................... 44
Figure 3.6 Stormwater harvesting and reuse system ................................................. 44
Figure 4.1 Specific area for model build-up............................................................... 46
Figure 4.2 Flow of Surface Water System in Upper Rea Main catchment ................ 48
Figure 4.3 Critical Return Period & Stormwater Duration reported by STWL......... 49
Figure 4.4 Typical houses in South West Birmingham.............................................. 50
Figure 4.5 Other typical houses in South West Birmingham..................................... 51
Figure 4.6 Sub-catchment divisions created from Google Earth ............................... 52
Figure 5.1 Flood map of the study catchment for 90 minutes of a RP 20 years ........ 56
Figure 5.2 Water pressure in the pipeline with maximum flood volume................... 57
Figure 5.4 There has no flood in the study area after pipeline optimization.............. 61
Figure 5.5 Water Usage in Sub-catchments with Good Quality of Life Indicators ... 62
- ix -
Figure 5.6 Water Usages in Sub-catchments with Average Quality of Life Indicators. ................................................................................................................... 62
Figure 5.5 Flood map produced by Infoworks with Stormwater Harvesting Application................................................................................................ 63
Figure 5.6 Runoff Results in the Sub-catchment 3 .................................................... 66
Figure 5.7 Water depth at Node in the Sub-catchment 3 ........................................... 66
Figure 5.8 Water volume at Node in the Sub-catchment 3 ........................................ 66
Figure 5.9 Runoff Results in the Sub-catchment 10 .................................................. 67
Figure 5.10 Water depth at Node in the Sub-catchment 10 ......................................... 67
Figure 5.11 Water volume at Node in the Sub-catchment 10 ...................................... 67
Figure 5.12 Runoff Results in the Sub-catchment 13 .................................................. 68
Figure 5.13 Water depth at Node in the Sub-catchment 13 ......................................... 68
Figure 5.14 Water volume at Node in the Sub-catchment 13 ...................................... 68
Figure 5.15 Choice for value function for the flood management solutions................ 70
Figure 5.16 Sustainability Analysis of the two solutions............................................. 71
- x -
LIST OF TABLES
Table 2.1 Recommended design frequencies in EN 752 ................................................ 6
Table 2.2 Capital, criteria and indicators used in UWOT for the assessment of sustainability ................................................................................................. 23
Table 3.1 Design of pipe size........................................................................................ 36
Table 3.2 Ideal manhole size......................................................................................... 36
Table 3.3 Indicators developed in mDSS4.................................................................... 41
Table 4.1 Cluster characteristics of the study area........................................................ 52
Table 4.2 House divisions in clusters........................................................................... 54
Table 5.1 Flood volume for design storm of 20 years return period ........................... 55
Table 5.2 Household technologies in sub-catchment with good quality of life........... 58
Table 5.3 Household technologies in sub-catchment with average quality of life ...... 58
Table 5.4 Cost benefit analysis with pipe upgrade solution ........................................ 60
Table 5.5 Household technologies in whole catchment with optimization scenario ... 64
Table 5.6 Total costs of the different methods for flood control ................................. 73

Chapter 1: Introduction
- 1 -
CHAPTER 1 INTRODUCTION
1.1 Background Information Water is one of the most essential resources to life. Due to expanding population, economic growth together with climate change pressures, many cities in the world are facing urban water shortage, inadequacy, risk and unsustainability. Therefore, urban water management is of much concern in many municipalities.
Conventional urban water management practices aim to meet water supply-demands while conveying wastewater and stormwater away from urban settings. Alternative approaches which consider water demands to be manageable and wastewater and stormwater as valuable resources, although being increasingly sought, still lack reliable site specific implementation methodologies (Makropoulos, Natsis et al. 2008).
Based on the need for urban water management strategies, the SWITCH project has been established. It is the name of a five year action research program, co-funded by the European Commission and implemented by a cross-disciplinary team of 33 partners and 13 cities in 15 countries around the world. The main objectives of SWITCH project are the development, application and demonstration of a range of tested scientific, technological and socio-economic approaches and solutions that contribute to sustainable and effective urban water management. SWITCH is needed as our population is increasing (with most growth occurring in urban areas), the urban population now exceeds that of the rural and although only 2% of the earth’s surface is occupied by cities, they consume 75% of the total resources. With the additional problems that a changing climate brings, there is clearly going to be water management issues with increasing pressure on our cities, due to both the climate and demographic changes. The vision of SWITCH is for sustainable integrated urban water management in the ‘City of the Future’.
Birmingham is a demonstration city of the SWITCH project. It is often referred to as the second city of the United Kingdom with a population of approximately 1 million. It is part of the West Midlands conurbation which accounts for almost 5 million inhabitants.
Today it is building a reputation as a commercial centre and tourist destination. In the future, most new developments will be built at much higher density than previously experienced. This will cause a “hardening” of the urban landscape with potentially 70 dwellings per hectare (mainly flats and terraced housing). This will therefore increase the need to control runoff from rainfall events and attenuate localized flooding risk.
Chapter 1: Introduction
- 2 -
Water resources, pressures and issues affecting Birmingham
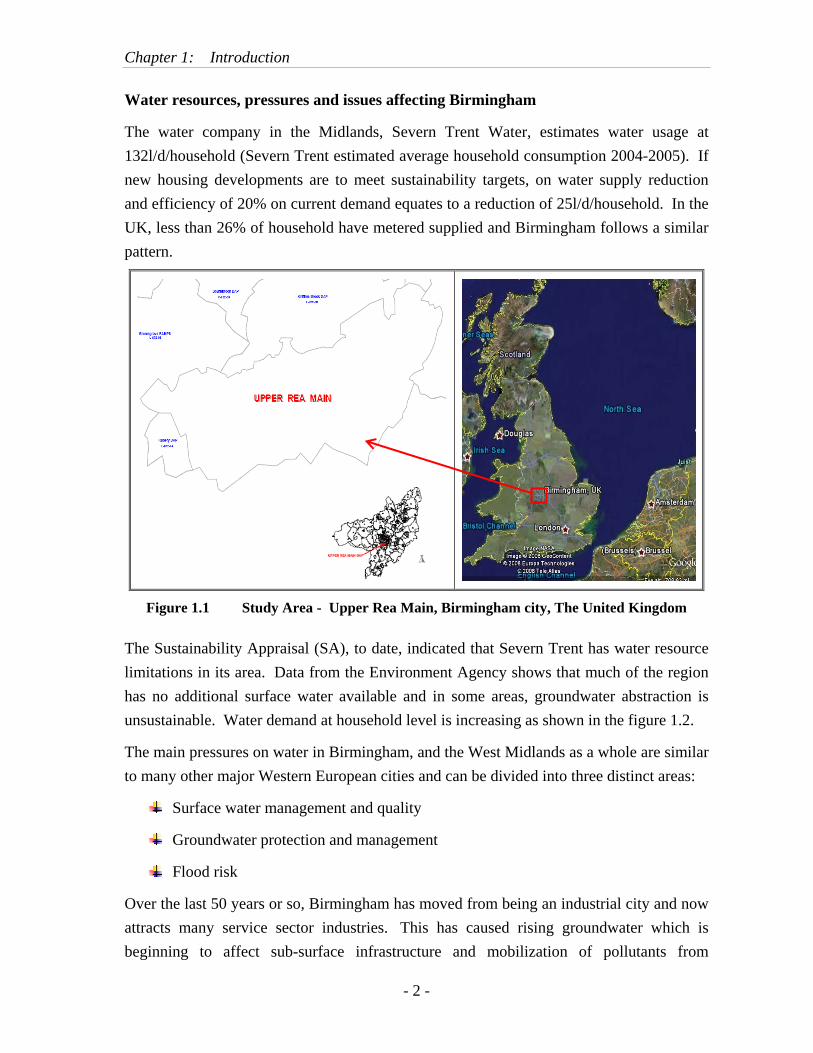
The water company in the Midlands, Severn Trent Water, estimates water usage at 132l/d/household (Severn Trent estimated average household consumption 2004-2005). If new housing developments are to meet sustainability targets, on water supply reduction and efficiency of 20% on current demand equates to a reduction of 25l/d/household. In the UK, less than 26% of household have metered supplied and Birmingham follows a similar pattern.
Figure 1.1 Study Area - Upper Rea Main, Birmingham city, The United Kingdom
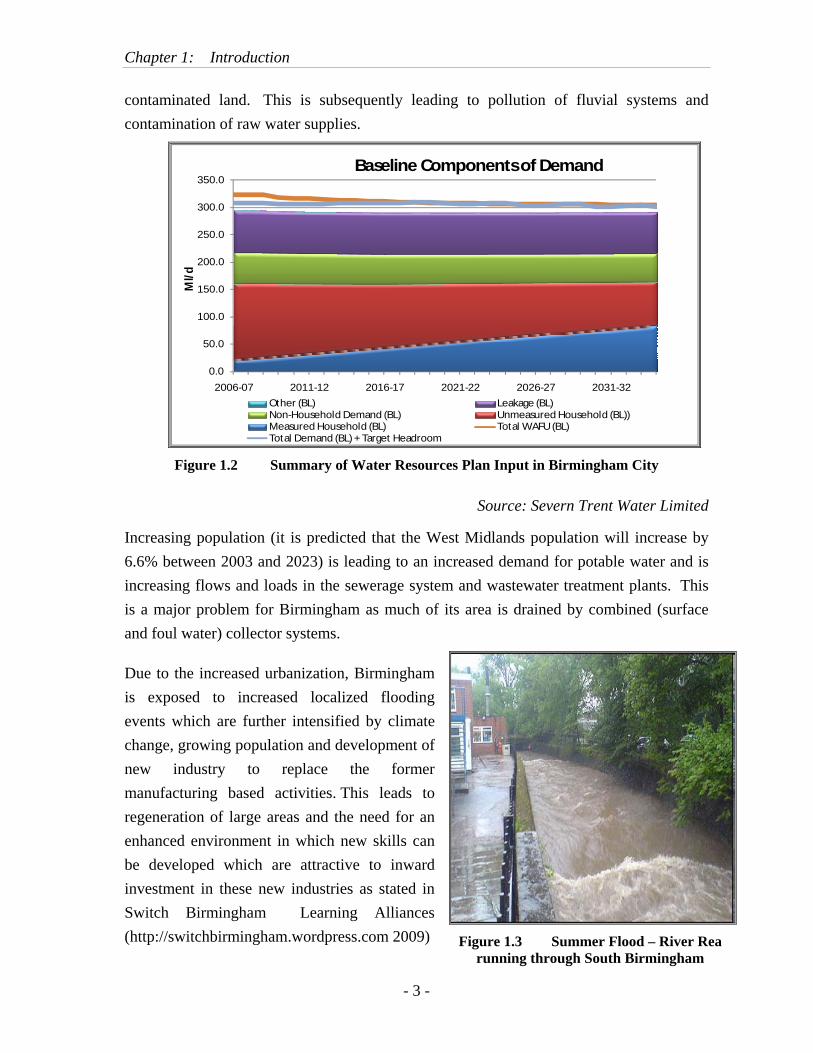
The Sustainability Appraisal (SA), to date, indicated that Severn Trent has water resource limitations in its area. Data from the Environment Agency shows that much of the region has no additional surface water available and in some areas, groundwater abstraction is unsustainable. Water demand at household level is increasing as shown in the figure 1.2.
The main pressures on water in Birmingham, and the West Midlands as a whole are similar to many other major Western European cities and can be divided into three distinct areas:
Surface water management and quality
Groundwater protection and management
Flood risk
Over the last 50 years or so, Birmingham has moved from being an industrial city and now attracts many service sector industries. This has caused rising groundwater which is beginning to affect sub-surface infrastructure and mobilization of pollutants from
Chapter 1: Introduction
- 3 -
contaminated land. This is subsequently leading to pollution of fluvial systems and contamination of raw water supplies.
0.0
50.0
100.0
150.0
200.0
250.0
300.0
350.0
2006-07 2011-12 2016-17 2021-22 2026-27 2031-32
Ml/d
Baseline Components of Demand
Other (BL) Leakage (BL)Non-Household Demand (BL) Unmeasured Household (BL))Measured Household (BL) Total WAFU (BL)Total Demand (BL) + Target Headroom
Figure 1.2 Summary of Water Resources Plan Input in Birmingham City
Source: Severn Trent Water Limited
Increasing population (it is predicted that the West Midlands population will increase by 6.6% between 2003 and 2023) is leading to an increased demand for potable water and is increasing flows and loads in the sewerage system and wastewater treatment plants. This is a major problem for Birmingham as much of its area is drained by combined (surface and foul water) collector systems.
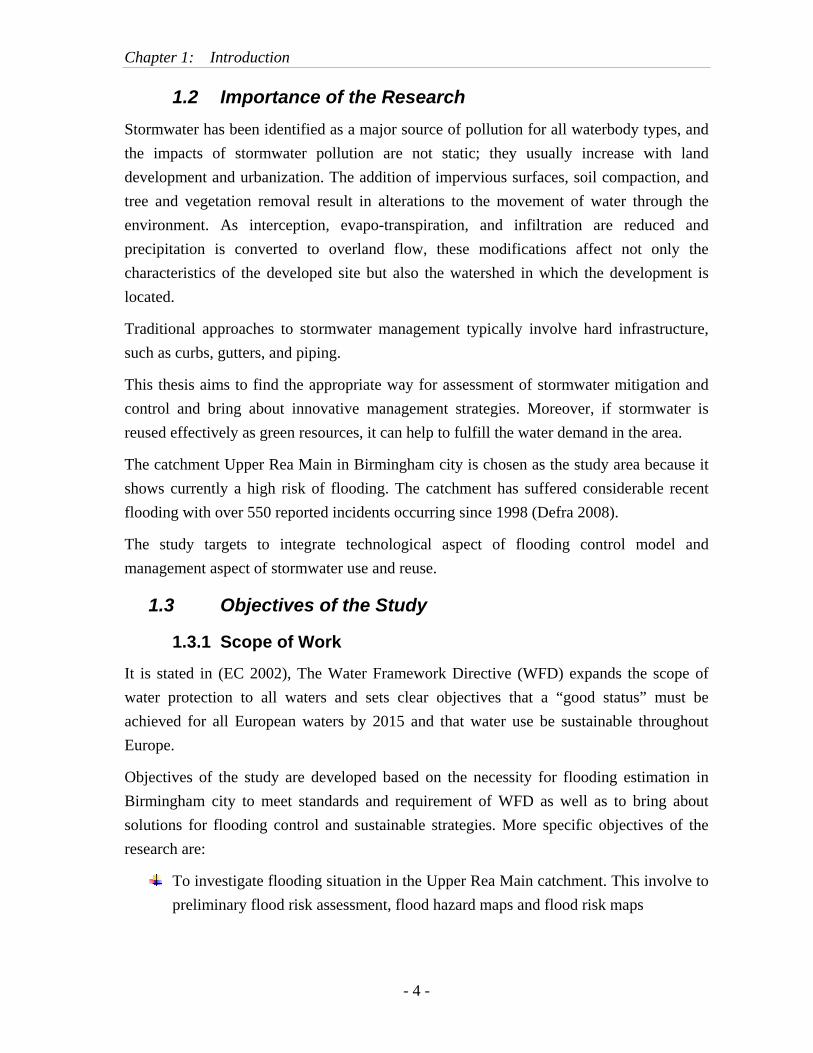
Due to the increased urbanization, Birmingham is exposed to increased localized flooding events which are further intensified by climate change, growing population and development of new industry to replace the former manufacturing based activities. This leads to regeneration of large areas and the need for an enhanced environment in which new skills can be developed which are attractive to inward investment in these new industries as stated in Switch Birmingham Learning Alliances (http://switchbirmingham.wordpress.com 2009) Figure 1.3 Summer Flood – River Rea
running through South Birmingham
Chapter 1: Introduction
- 4 -
1.2 Importance of the Research Stormwater has been identified as a major source of pollution for all waterbody types, and the impacts of stormwater pollution are not static; they usually increase with land development and urbanization. The addition of impervious surfaces, soil compaction, and tree and vegetation removal result in alterations to the movement of water through the environment. As interception, evapo-transpiration, and infiltration are reduced and precipitation is converted to overland flow, these modifications affect not only the characteristics of the developed site but also the watershed in which the development is located.
Traditional approaches to stormwater management typically involve hard infrastructure, such as curbs, gutters, and piping.
This thesis aims to find the appropriate way for assessment of stormwater mitigation and control and bring about innovative management strategies. Moreover, if stormwater is reused effectively as green resources, it can help to fulfill the water demand in the area.
The catchment Upper Rea Main in Birmingham city is chosen as the study area because it shows currently a high risk of flooding. The catchment has suffered considerable recent flooding with over 550 reported incidents occurring since 1998 (Defra 2008).
The study targets to integrate technological aspect of flooding control model and management aspect of stormwater use and reuse.
1.3 Objectives of the Study
1.3.1 Scope of Work
It is stated in (EC 2002), The Water Framework Directive (WFD) expands the scope of water protection to all waters and sets clear objectives that a “good status” must be achieved for all European waters by 2015 and that water use be sustainable throughout Europe.
Objectives of the study are developed based on the necessity for flooding estimation in Birmingham city to meet standards and requirement of WFD as well as to bring about solutions for flooding control and sustainable strategies. More specific objectives of the research are:
To investigate flooding situation in the Upper Rea Main catchment. This involve to preliminary flood risk assessment, flood hazard maps and flood risk maps
Chapter 1: Introduction
- 5 -
To propose flood risk mitigation and management program, implementing measures following Directive 2007/60/EC of the European Parliament and of the Council of 23 October 2007 compatible with infrastructural planning.
To study the effect of different urban flood management strategies (green roofs, stormwater use, etc.) on urban flooding in the selected catchment above.
To evaluate the strategies by using decision support tools (termed the Urban Water Optioneering Tool, UWOT & mDSS4) for the assessment in a broader context of sustainable urban water.
Propose urban flood strategies appropriate with sustainable environmental planning
1.3.2 Research Questions
What is the state of urban flooding in Birmingham city?
What are the flood impacts to urban area?
What is the appropriate modeling framework to evaluate flooding issue to quantify the problem?
Is the conventional way of flood management (pipe upgrade) less cost effective than the stormwater harvesting and SUDS approach?
Chapter 2: Literature Review
- 6 -
CHAPTER 2 LITERATURE REVIEW
2.1 Urban Flooding & Approaches to Urban Water Management
2.1.1 Specific Terms in Urban Flooding
Floods are natural phenomena which cannot be prevented (EC 23 October 2007). ‘Flooding’ is described as a ‘condition where wastewater and/or surface water escapes from or cannot enter a drain or sewer system and either remains on the surface or enters buildings’. However, some human activities (such as increasing human settlements and economic assets in floodplains and the reduction of the natural water retention by land use) and climate change contribute to an increase in the likelihood and adverse impacts of flood events.
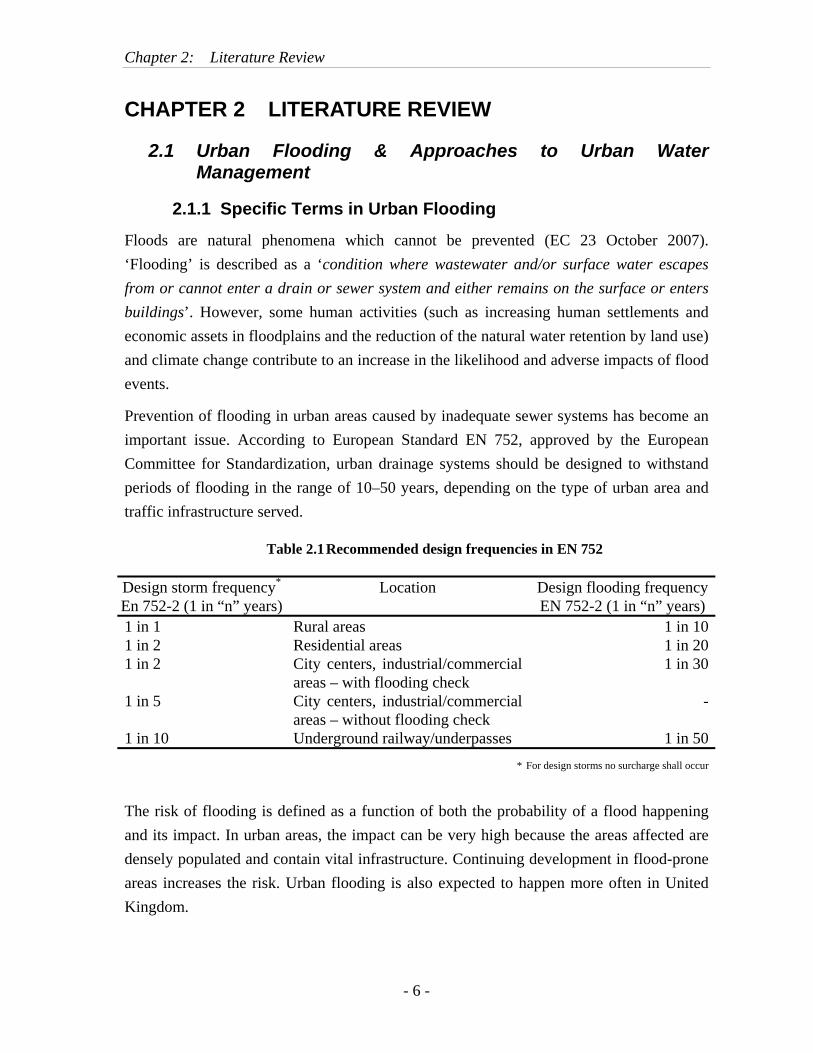
Prevention of flooding in urban areas caused by inadequate sewer systems has become an important issue. According to European Standard EN 752, approved by the European Committee for Standardization, urban drainage systems should be designed to withstand periods of flooding in the range of 10–50 years, depending on the type of urban area and traffic infrastructure served.
Table 2.1 Recommended design frequencies in EN 752
Design storm frequency* En 752-2 (1 in “n” years)
Location Design flooding frequency EN 752-2 (1 in “n” years)
1 in 1 Rural areas 1 in 101 in 2 Residential areas 1 in 201 in 2 City centers, industrial/commercial
areas – with flooding check 1 in 30
1 in 5 City centers, industrial/commercial areas – without flooding check
-
1 in 10 Underground railway/underpasses 1 in 50* For design storms no surcharge shall occur
The risk of flooding is defined as a function of both the probability of a flood happening and its impact. In urban areas, the impact can be very high because the areas affected are densely populated and contain vital infrastructure. Continuing development in flood-prone areas increases the risk. Urban flooding is also expected to happen more often in United Kingdom.
Chapter 2: Literature Review
- 7 -
2.1.2 Urban flooding in United Kingdom
Urban flooding due to drainage systems being overwhelmed by rainfall is estimated to cost £270 million a year in England and Wales; 80,000 homes are at risk. Its impacts are expected to increase if no policy changes are made. From the Postnote of (Parliament Office of Science and Technology 2007), factors that tend to increase the urban flooding risk include:
Ageing drainage infrastructure: A lot of the sewerage and drainage network is old and its condition is unknown.
More buildings: As new developments cover previously permeable ground, the amount of rainwater running off the surface into drains and sewers increases dramatically.
Increase in paving: The proportion of impermeable ground in existing developments is increasing as people build patios and pave over front gardens.
Climate change: Wetter winters and heavier summer showers are expected to put more pressure on urban drainage. Climate models predict that winter rainfall will increase by 20-30% by the 2080s. Such an increase could lead to a much larger (up to 200%) increase in flood risk.
Urban drainage: The conventional way of dealing with rainfall and waste water in urban areas has been to carry it away as quickly as possible via underground pipes and sewers. Older (pre 1940s) areas normally have a combined sewer system, where rainfall drains into sewers carrying foul water and both are transferred to sewage treatment works.
Most newer developments have separate sewer systems: water from gutters and roads is carried to soakaways, through pipes to the nearest watercourse, but often simply joins a combined sewer. Foul water travels by foul sewer either directly to a sewage treatment works, or also connects to the existing combined sewer network. Most modern drainage systems are also designed to cope with rainfall events that occur with a one in thirty year probability. Older parts of the system may be operating to a lower standard. It is inevitable that the capacities of sewers, covered urban water courses and other piped systems will sometimes be exceeded.
2.1.3 Approaches to Urban Water Management
According to (AWDO 2007), urban water management consists of three fundamental, but interrelated, services. First is the provision to households of clean water that is drinkable without additional treatment. Second is the collection of wastewater from all households

Chapter 2: Literature Review
- 8 -
and from industrial and commercial sources, which thereafter requires proper treatment and disposal in an environment-friendly way. Third is the efficient disposal of storm water, especially during the monsoon seasons. The other two services receive inadequate attention.
Urban water problems are growing around the world. Widespread mismanagement of water resources, growing competition for the use of freshwater, degraded sources – sometimes by pollutants of unpredictable effects – only heighten the depth of these problems (Tejada-Guibert 2006).
Urban water management facilitates the sustainable provision of specific services, including water supply, flood protection and drainage, wastewater treatment and disposal, and maintenance of water-based amenities. While in developing countries there is a need for enlarging the supply capacity, in developed countries the focus tends to be on reducing further growth of withdrawals by demand management, water saving, and wastewater reuse and recycling. Urban water management has to accommodate the relatively new function of protecting receiving waters as a recreational, aesthetic, environmental and ecological amenity.
Main Challenges
- Climate change: Climate change is likely to affect all urban centers, either with increasingly heavy storms or with prolonged droughts, or both. To address the gigantic challenges, it is crucial to develop good approaches, so that policy development and planning are directed towards addressing these global change pressures, and to achieving truly sustainable urban water systems.
- Population growth and urbanisation: An unprecedented growth of the urban population is a major driver for urban water management, especially in the developing world. Increased urban water demand may lead to large infrastructural works to transport water from longer and longer distances, creating environmental damage in the cities hinterland.
- Deterioration of infrastructure systems: In those cities where major water infrastructure was put in place during the previous century, urban water managers will increasingly be confronted with deterioration of infrastructure, especially pipe networks. In many parts of Europe, pipes are over 100 years old and the cost of rehabilitation of water infrastructure system is increasing substantially. Infrastructure deterioration will impact on the public health, environment, and institutions in various ways.
- Governance and policies: No longer are only government institutions providing water services to cities. Decisions and plans are no longer made top-down, but joint decision making involving citizens ‘of age’ is likely to increase.
Chapter 2: Literature Review
- 9 -
- Energy costs: Recently energy costs have surged to unimaginable heights and this will only increase the realisation that the urban water system is a small but significant energy consumer. Water supply and wastewater management consume energy to the equivalent of about 5-10 % of total domestic electricity consumption. The water sector can therefore not be ignored in initiatives to reduce overall energy consumption, such as the EU ambition to reduce energy consumption by 20% in 2020 as compared to its use in 1990 or the ambition of some cities to become ‘carbon neutral’.
- Increasing complexity and risks of infrastructure systems: The vulnerability of many cities to various ‘system failures’ has undoubtedly increased. The inter-linkage between energy supply, the transport sector, IT systems and the water sector infrastructure is strong.
Water sector institutions need to prepare themselves to cope with the changes that are on-going, but also with future changes that are not known yet, or the extent of which is not yet known. This uncertainty needs to be included in planning and decision making. The uncertainty also requires strategic thinking, translated into strategic and flexible planning, rather than conventional blue-print planning.
2.2 Integrated Urban Water Management Based on the increasing global pressures on urban water utility, there is a necessity for an innovative development in planning and management. Integrated Urban Water Management (IUWM) has been established for sustainable water. IUWM takes a comprehensive approach to urban water services, viewing water supply, stormwater and wastewater as components of an integrated physical system and recognizes that the physical system sits within an organizational framework and a broader natural landscape (Mitchell 2006).
IUWM recognizes that the whole urban region, down to the site scale, needs to be considered, as urban water systems are complex and inter-related. Changes to a system will have downstream or upstream impacts that will affect cost, sustainability or opportunities. Therefore, proposed changes to a particular aspect of the urban water system must include a comprehensive view of the other items and consider the influence on them.
There are a broad range of tools which are employed within IUWM, including, but not limited to water conservation and efficiency; water sensitive planning and design, including urban layout and landscaping; utilization of non-conventional water sources including roof runoff, stormwater, greywater and wastewater; the application of fit-for-purpose principles; stormwater and wastewater source control and pollution prevention; stormwater flow and quality management; the use of mixtures of soft (ecological) and hard

Chapter 2: Literature Review
- 10 -
(infrastructure) technologies; and non-structural tools such as education, pricing incentives, regulations and restriction regimes.
During the SWITCH project the City Learning Alliances (LAs) in 9 (planned) cities went through a strategic planning exercise and a number of communalities emerged and these were merged into the “SWITCH Vision and Strategy for Integrated Urban Water Management”. The SWITCH vision for 2035 for a truly sustainable urban water system was formulated in the form of a set of sustainability objectives. A city that wishes to achieve sustainability for its urban water system in stormwater management and reuse should set itself the following objectives (SWITCH-Deliverable-Briefing-Note-Template 2008):
To reduce the risk of flooding in vulnerable areas to levels acceptable to all stakeholders, even under future climate change scenarios
To protect and enhance the water quality and ecological status of urban receiving waters, both surface and ground waters
To apply source control techniques to enable stormwater contributing to the quality of life in the urban environment.
To harvest rainwater and stormwater for non-potable reuse purposes.
To utilise stormwater for re-establishing a balanced natural water cycle (in conjunction with landscape development).
An in-depth analysis of a particular city is necessary to arrive at the best strategy. Still, on a more general level one could formulate strategic directions which are valid for basically all cities in the world. These strategic directions are the following:
UWM strategies need to be aimed at increasing overall sustainability, which means simultaneously satisfying social, environmental and economic boundary conditions.
UWM strategies need to aim at increasing the sustainability of the overall urban water system. Optimisation of the entire system will result in more sustainable systems than optimisation of separate elements (sub-systems).
UWM has the highest chance of success, when based on a learning process in which all water sector institutions are taking part. The City Learning Alliance (LA) is a multi-stakeholder platform that is meant to steer the city towards sustainability or to advise the responsible organisations on how to achieve sustainability. The steps undertaken in this process include a) agreeing on a vision for a sustainable urban water system, b) guiding demand-led research to develop innovations that are
Chapter 2: Literature Review
- 11 -
Water treatment
Reservoirs
STP
Dams
Climate
Greywatercollection and
treatment
HouseholdsCities
Industry
Districts
Ocean outfall
PipelinesPipelinesPipelinesPipelines
AgricultureAgricultureAgricultureAgriculture
Natural system –rivers, oceans, aquifers
Natural system –rivers, oceans, aquifers
Natural system –rivers, oceans, aquifers
Natural system –rivers, oceans, aquifers
Natural system –rivers, oceans, aquifers
Natural system –rivers, oceans, aquifers
Source: CSIRO
required to achieve the vision, and c) upscaling successful innovations to the city level.
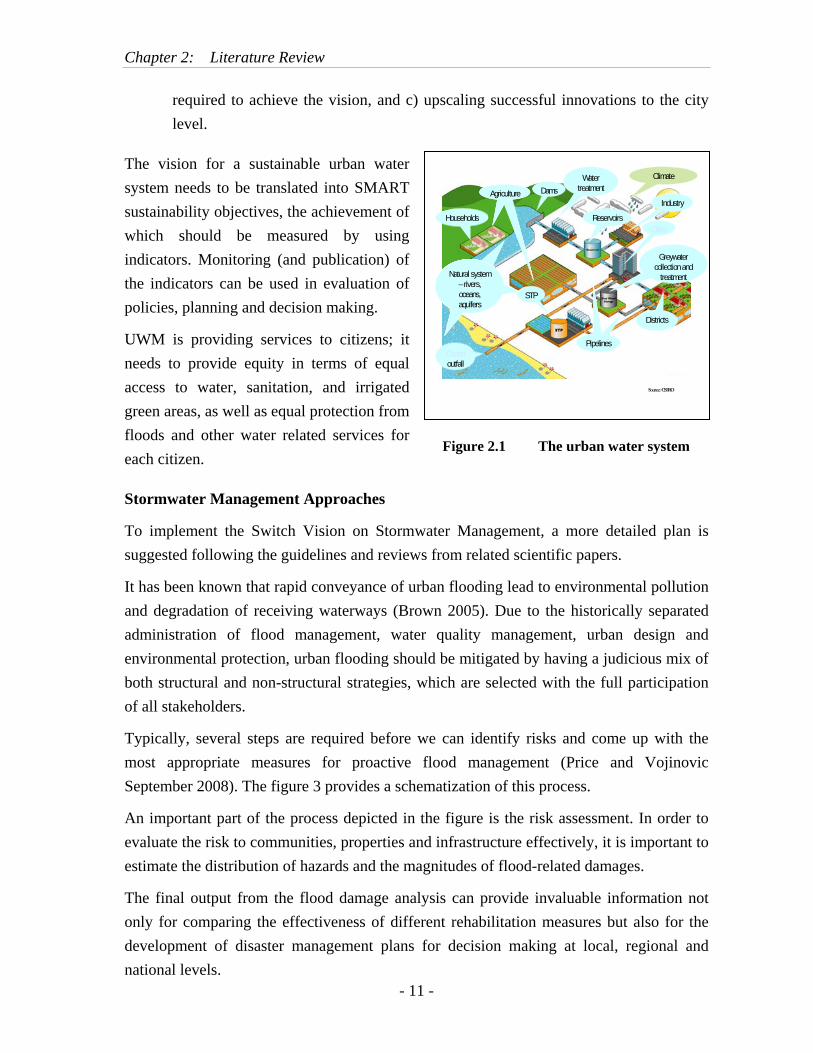
The vision for a sustainable urban water system needs to be translated into SMART sustainability objectives, the achievement of which should be measured by using indicators. Monitoring (and publication) of the indicators can be used in evaluation of policies, planning and decision making.
UWM is providing services to citizens; it needs to provide equity in terms of equal access to water, sanitation, and irrigated green areas, as well as equal protection from floods and other water related services for each citizen.
Figure 2.1 The urban water system
Stormwater Management Approaches
To implement the Switch Vision on Stormwater Management, a more detailed plan is suggested following the guidelines and reviews from related scientific papers.
It has been known that rapid conveyance of urban flooding lead to environmental pollution and degradation of receiving waterways (Brown 2005). Due to the historically separated administration of flood management, water quality management, urban design and environmental protection, urban flooding should be mitigated by having a judicious mix of both structural and non-structural strategies, which are selected with the full participation of all stakeholders.
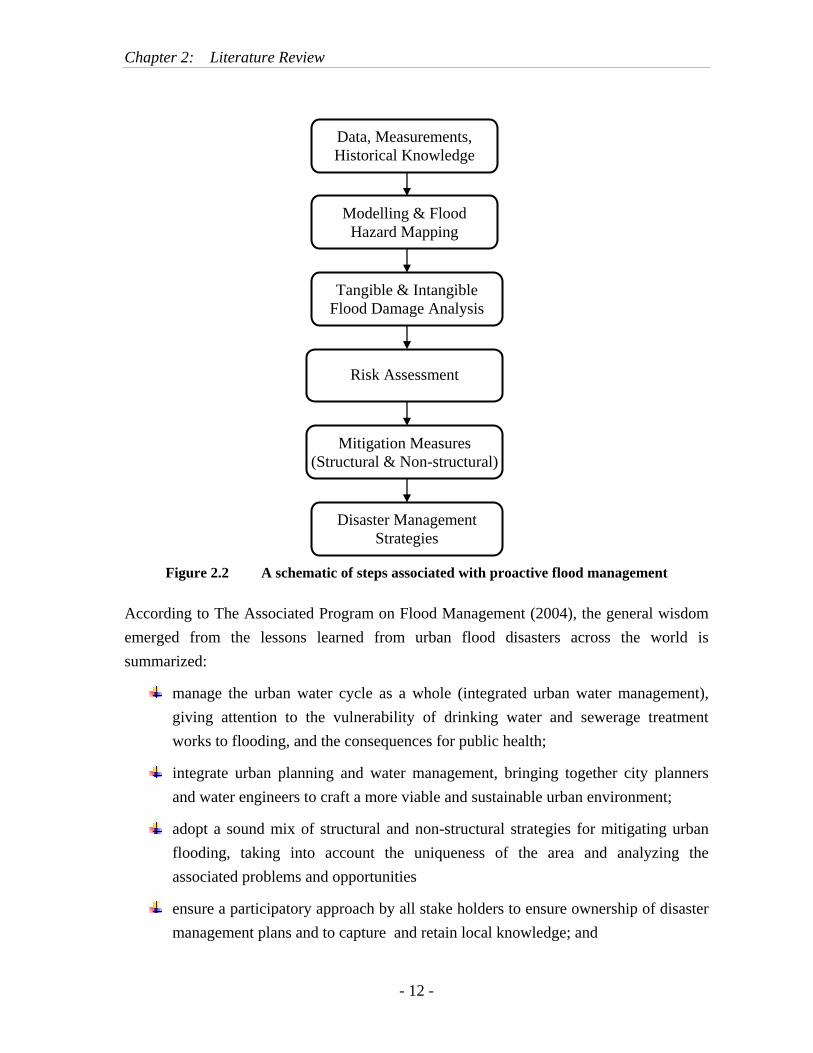
Typically, several steps are required before we can identify risks and come up with the most appropriate measures for proactive flood management (Price and Vojinovic September 2008). The figure 3 provides a schematization of this process.
An important part of the process depicted in the figure is the risk assessment. In order to evaluate the risk to communities, properties and infrastructure effectively, it is important to estimate the distribution of hazards and the magnitudes of flood-related damages.
The final output from the flood damage analysis can provide invaluable information not only for comparing the effectiveness of different rehabilitation measures but also for the development of disaster management plans for decision making at local, regional and national levels.
Chapter 2: Literature Review
- 12 -
Figure 2.2 A schematic of steps associated with proactive flood management
According to The Associated Program on Flood Management (2004), the general wisdom emerged from the lessons learned from urban flood disasters across the world is summarized:
manage the urban water cycle as a whole (integrated urban water management), giving attention to the vulnerability of drinking water and sewerage treatment works to flooding, and the consequences for public health;
integrate urban planning and water management, bringing together city planners and water engineers to craft a more viable and sustainable urban environment;
adopt a sound mix of structural and non-structural strategies for mitigating urban flooding, taking into account the uniqueness of the area and analyzing the associated problems and opportunities
ensure a participatory approach by all stake holders to ensure ownership of disaster management plans and to capture and retain local knowledge; and
Data, Measurements, Historical Knowledge
Modelling & Flood Hazard Mapping
Tangible & Intangible Flood Damage Analysis
Risk Assessment
Mitigation Measures (Structural & Non-structural)
Disaster Management Strategies
Chapter 2: Literature Review
- 13 -
break the poverty cycle through improved risk management that recognizes the vulnerability of the poor
Following this guideline, model building is established to come up with flooding issues as well as set up integrated urban water strategies for a selected catchment in Birmingham city.
2.3 Water Framework Directive 2007/60/EC As a member of European Union, United Kingdom and Birmingham City are advised to follow the guidelines published by DG Environment, European Commission. For this study, Directive 2007/60/EC for assessment and management of flood risks is referred.
The purpose of this Directive is to establish a framework for the assessment and management of flood risks, aiming at the reduction of the adverse consequences for human health, the environment, cultural heritage and economic activity associated with floods in the Community.
The Directive also states that “Flood risk management – Flood prevention, protection and mitigation” sets out its analysis and approach to managing flood risks at Community level, and states that concerted and coordinated action at Community level would bring considerable added value and improve the overall level of flood protection. The main parts which are suitable for the study area are listed as below:
- In developing policies referring to water and land uses Member States and the Community should consider the potential impacts that such policies might have on flood risks and the management of flood risks.
- Objectives regarding the management of flood risks should be determined by the Member States themselves and should be based on local and regional circumstances.
- In order to have available an effective tool for information, as well as a valuable basis for priority setting and further technical, financial and political decisions regarding flood risk management, it is necessary to provide for the establishing of flood hazard maps and flood risk maps showing the potential adverse consequences associated with different flood scenarios, including information on potential sources of environmental pollution as a consequence of floods. In this context, Member States should assess activities that have the effect of increasing flood risks.
- With a view to avoiding and reducing the adverse impacts of floods in the area concerned it is appropriate to provide for flood risk management plans. The causes and consequences of flood events vary across the countries and regions of the

Chapter 2: Literature Review
- 14 -
Community. Flood risk management plans should therefore take into account the particular characteristics of the areas they cover and provide for tailored solutions according to the needs and priorities of those areas, whilst ensuring relevant coordination within river basin districts and promoting the achievement of environmental objectives laid down in Community legislation. In particular, Member States should refrain from taking measures or engaging in actions which significantly increase the risk of flooding in other Member States, unless these measures have been coordinated and an agreed solution has been found among the Member States concerned.
- Flood risk management plans should focus on prevention, protection and preparedness. With a view to giving rivers more space, they should consider where possible the maintenance and/or restoration of floodplains, as well as measures to prevent and reduce damage to human health, the environment, cultural heritage and economic activity. The elements of flood risk management plans should be periodically reviewed and if necessary updated, taking into account the likely impacts of climate change on the occurrence of floods.
- The solidarity principle is very important in the context of flood risk management. In the light of it Member States should be encouraged to seek a fair sharing of responsibilities, when measures are jointly decided for the common benefit, as regards flood risk management along water courses.
- To prevent duplication of work, Member States should be entitled to use existing preliminary flood risk assessments, flood hazard and risk maps and flood risk management plans for the purposes of achieving the objectives and satisfying the requirements of this Directive.
- Member States should base their assessments, maps and plans on appropriate ‘best practice’ and ‘best available technologies’ not entailing excessive costs in the field of flood risk management.
- This Directive respects the fundamental rights and observes the principles recognized in particular by the Charter of Fundamental Rights of the European Union. In particular, it seeks to promote the integration into Community policies of a high level of environmental protection in accordance with the principle of sustainable development as laid down in Article 37 of the Charter of Fundamental Rights of the European Union.
- Since the objective of this Directive, namely the establishment of a framework for measures to reduce the risks of flood damage, cannot be sufficiently achieved by
Chapter 2: Literature Review
- 15 -
the Member States and can by reason of scale and effects of actions be better achieved at Community level, the Community may adopt measures, in accordance with the principle of subsidiarity as set out in Article 5 of the Treaty. In accordance with the principle of proportionality, as set out in that Article, this Directive does not go beyond what is necessary in order to achieve that objective.
- In accordance with the principles of proportionality and subsidiarity and the Protocol on the application of the principles of subsidiarity and proportionality attached to the Treaty, and in view of existing capabilities of Member States, considerable flexibility should be left to the local and regional levels, in particular as regards organization and responsibility of authorities.
- Member States are encouraged to draw up, for themselves and in the interest of the Community, their own tables illustrating, as far as possible, the correlation between this Directive and the transposition measures, and to make them public
Therefore, the thesis development aim at following the Directive guideline as well as bringing the most appropriate way for urban flood control and management in Birmingham city.
2.4 Infoworks CS Model for Urban Flooding Control
2.4.1 Introduction to Infoworks CS
To evaluate the urban flooding as well as to get flooding prediction and management, a stormwater model called Infoworks CS is chosen. The InfoWorks suite of products embraces the whole water cycle, from supply and distribution, urban drainage and wastewater management. The software combines source data and hydraulic modelling allowing planners and engineers to generate fast, accurate models. InfoWorks is comprehensive, easy-to-use and flexible. Data can be imported from a wide range of sources or created within the system; source and model data are stored in a master database and may be edited at any time. The system provides full model management, allowing you to maintain a complete audit trail of the modelling process from source data to final outputs ((Wallingtonfordsoftware 2009).
A range of reporting tools is provided for analyzing the results. Interactive views of data are available using geographical plan views, sectional views, long sections, data grids and time-varying graphs. The underlying data can be accessed from any graphical or geographical view. Animated presentation of results is available in the geographical plan view.
Chapter 2: Literature Review
- 16 -
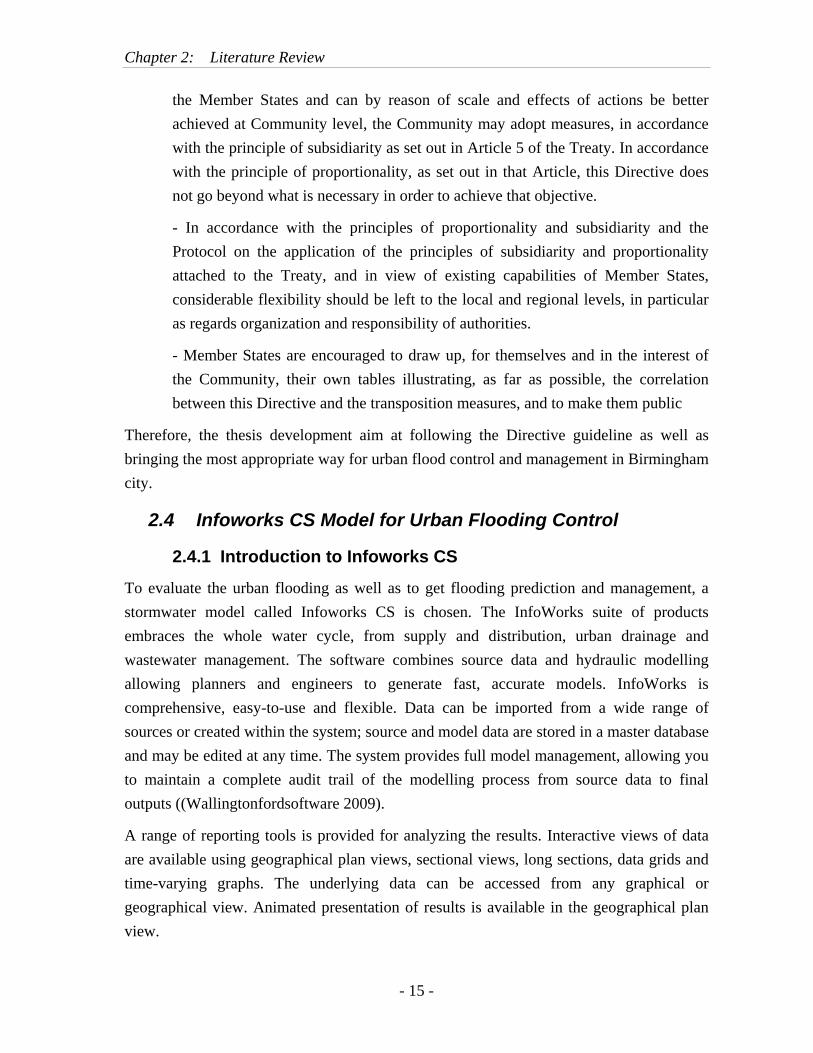
The software also contains extensive diagnostic error checking and warning, and rapid access to full on-line documentation.
Figure 2.3 FloodWorks extends flood
forecasting to stormwater networks
InfoWorks CS manages sewer network models, containing both network and hydraulic data. When a model has been created, the behaviour of the network can be stimulated under a range of conditions. Above ground hydrology and below ground hydraulics are both modelled within InfoWorks CS and the software is able to switch between pressurized and free surface flow conditions
Workgroup Model Management
- Manages multiple modelers on multiple projects
- Supports both Local and Network Dongles for license authentication
- Controls access permissions to models by user login details
Data Integration
- Seamless exchange of data and results to and from GIS and other third party applications - Import models and export results to any data source using InfoWorks Open Data Import/Export Centre
- Import asset data directly from Microsoft databases (Excel / Access), and manhole databases such as STC25, STC26, FastSTC and Thesis - Import network survey information directly from Examiner CCTV export data
Model Building Tool
- Automatic inference of missing model data and assignment of headloss coefficients
- Engineering validation checks ensure consistency with expected engineering values
- Interactive network simplification through query analysis and SQL assignment
Chapter 2: Literature Review
- 17 -
- Automatic compensation for 'lost' storage when pruning and merging network data
- Ability to perform sub-catchment area take-off and population count directly from the GIS mapping data
- Tracing tools to help identify, view and modify network paths and links
- Carry out network comparisons and apply differences to any network
- Consolidates modeling data from multiple sources in one coherent interface
Powerful Hydraulic Simulation
- Exceptionally fast, robust and efficient with large networks
- Real life modeling of complex ancillary and pump behavior
- Fully Integrated Water Quality and Real Time Control capability
- Unlimited ´Time Series´ capability
- Infiltration Module for Slow Response surfaces and Groundwater influences
- Support for SUDS structures such as Soakaways, Infiltration Trenches, Swales and Permeable Pavements Structures which are commonly found in all
- Flexible sediment modeling with feedback to the Hydraulic Model.
Result Interpretation
- Fully dynamic thematic displays with simulation replays in Plan View
- Time varying Longitudinal Sections with dynamic Water Levels
- Database grid reports for all results
- Time varying graphical data
- 3D Terrain View for viewing ground surface of networks with ability to shade hill contours.
2.4.2 Design Parameters
Contributing area
Storm sewers and combined sewers collect (part of) the rain water that runs off a catchment surface. Hence, a sewer pipe will have to be able to convey the runoff of a given (contributing) area. Regarding sewer system design, the following aspects of the contributing area are of importance: area, shape, slope, soil type and cover, land use,

Chapter 2: Literature Review
- 18 -
roughness, humidity and storage capacity. Of these, the area and the land use are primordial to obtain a good estimation of the amount of runoff.
Land use
Once the contributing area has been determined, estimation has to be made of the size and the characteristics of the area from which the runoff is transported to the sewer system. The size of the impervious area (such as streets, roofs and other paved areas) can be determined manually by means of maps or automatically using aerial photographs and a number GIS-applications.
Runoff coefficient
The dimensionless runoff coefficient is defined as the part of the rainfall that contributes to surface runoff. The runoff coefficient accounts for the initial losses (e.g. interception and wetting losses), continuing losses (e.g. evapo-transpiration and infiltration) and implicitly also accounts for the hydrodynamic effects of the surface runoff flow.
Time of concentration
An important parameter in sewer system design is the time of concentration TC. The time of concentration in a point of the sewer system is the defined as the time that a raindrop needs to flow from the most remote part of the catchment to the point of the sewer network under consideration (most remote in time, not in distance). As a consequence each point in the sewer system has its own time of concentration. The time of concentration TC in a design point can be calculated as the sum of the inlet time Ti (i.e. the time it takes for a rain drop to flow from the most remote part of the network to reach the inlet of the sewer system) and the flow time TL (i.e. the maximal time it takes for a rain drop to flow from the inlet of the sewer system to the design point. Hence, the time of concentration can be written as:
TC = Ti + TL
In sewer system design the time of concentration is always calculated as the time to travel to the most downstream part of a conduit. In other words, when designing a sewer pipe, the design point is situated at the end of a conduit.
Inlet time Ti
The inlet time varies with the characteristics of the contributing area and is a function of the average catchment slope, the type of soil cover, the path the rain water follows, the antecedent rainfall (soil saturation), soil permeability, superficial storage and the rain intensity. E.g. less frequent, more intense rain storms will result in more water on the catchment area and consequently to a faster surface runoff.

Chapter 2: Literature Review
- 19 -
Flow time TL
The flow velocity in a (circular) sewer pipe can be calculated based on the hydraulic properties of the pipe. The flow velocity when a pipe is full-flowing can be used as a good (average) approximation for the flow velocity at different water levels in the sewer system.
2/10
3/23/24
11 SDn
U ×××=
where
U flow velocity [m/s]
n Manning coefficient [sm-1/3] (= 0,013 sm-1/3 for concrete sewer pipes)
D pipe diameter [m]
S0 pipe bottom slope [m/m]
When the length of a sewer pipe j is known, the flow time through that pipe, TL,j , can be calculated as:
j
jjL U
LT =,
where
Lj length of the pipe [m]
Uj mean flow velocity [m/s]
In order to calculate the flow time through the sewer network to the design point, a summation for the flow time through the upstream links has to be made (starting at the most remote inlet point to the design point).
A first approximation of the flow time (i.e. when pipe diameter and slope are not known) can be made by assuming the mean flow velocity to be equal to 1 m/s (for flat regions).
Foul flow discharges
The design value of the dry weather flow rate (QDWF) is calculated as:
QDWF = p × q × N
where p peak factor [ -] q (potable) water consumption per inhabitant [m3/s]
N number of inhabitants [ -]
Rainfall – Stormwater flows
Chapter 2: Literature Review
- 20 -
Sewer systems are designed to be able to convey a storm that occurs on average once every of a return period.
- IDF-relationships: Rainfall intensity is a function of the duration of the rain event t and the return period T (or the frequency f = 1/T). Based on rainfall measurements intensity - duration- frequency relationships (IDF-relationships) are established.
- Composite storms: In detailed, hydrodynamic modeling composite storms are used as design rainfall. These composite storms are based on the IDF-relationships. For every return period (or frequency) a composite storms contains all IDF-relationships for all storm durations
Design Restricts
- Pipe diameter:
+ The minimal pipe diameter is 100 mm.
+ Only commercially available pipe diameters can be used
+ The diameter of a downstream conduit should be equal to, or larger than the diameter of an upstream pipe.
Pipe bottom slope
A minimal shear stress (3 N/m2 for combined sewer systems) is needed to guarantee that the sewer pipes are self-cleansing in order to avoid undesirable sedimentation in the sewer. In practice often a minimal velocity is used as an alternative to the shear stress criterion. The relationship between shear stress and flow velocity is however variable (i.e. a function of the pipe diameter). Requiring a minimal shear stress leads to minimal bottom slopes that have to be attained as a function of the pipe diameter.
2.4.3 Stormwater Pipe Materials
Following the guidelines from the International Standards Organization for Testing and Materials (ASTM), in order to reduce flooding, promote adequate drainage, and reduce maintenance, certain pipe materials depending upon usage and location of the pipes. Material for pipe used for conveyance of stormwater shall be in accordance with the following (ASTM 2008):
- Reinforced concrete pipe (RCP), double-walled high-density polyethylene pipe (HDPE), corrugated double-walled polyvinyl chloride pipe (PVC), corrugated metal pipe (CMP) and non-reinforced concrete pipe (NRCP) may be used to convey onsite stormwater runoff (stormwater runoff generated by the subject property including areas such as buildings, parking lots, etc.).
Chapter 2: Literature Review
- 21 -
- Reinforced concrete pipe (RCP) is required for all detention basin outlet structures and outlet pipes.
- Reinforced concrete pipe (RCP) is required when stormwater systems carry water from offsite areas (stormwater runoff generated by areas other than the subject property, where the runoff drains across the subject property) or when there is a potential to cause flooding or damage to adjacent properties. RCP is also required for all stormwater systems located within new residential developments (includes residential condominium developments).
- Stormwater pipes installed under city streets shall be reinforced concrete pipe (RCP). Stormwater pipes within the roadway prism of city streets and JPEs, but not under the pavement, shall also be of RCP.
- Any stormwater pipe/system that is installed with intent of dedicating to the City, whether inside or outside of the right-of-way, shall be constructed with reinforced concrete pipe (RCP).
- Existing residential subdivisions that have a roadside ditch and driveway pipe stormwater system may use reinforced concrete pipe (RCP), double-walled high-density polyethylene pipe (HDPE), corrugated double-walled polyvinyl chloride pipe (PVC), corrugated metal pipe (CMP) and non-reinforced concrete pipe (NRCP) as desired by the responsible agency, corporation, or individual. RCP is required underneath any driveways or entrances that are heavily traveled.
For the situations referred to above where reinforced concrete pipe (RCP) is required, ductile iron pipe (DI) might be allowed to be substituted for RCP when site limitations exist.
Installation Standards
All stormwater pipes must be installed correctly with adequate pipe bedding, backfill and stormwater joint techniques.
All installations must be per ASTM standard or the manufacturers specifications, which ever is more stringent. At a minimum, all pipe installations must have soil tight gasketed joints.
2.5 Decision Support for Integrated Urban Water Management
Integrated urban water management established then promotes the concept of the total urban water cycle, that is, the holistic view of water supply, stormwater and wastewater.
Chapter 2: Literature Review
- 22 -
The most important benefit of a total water cycle view of the urban water system is increased range of opportunities available to develop more sustainable systems. Just as the robustness of ecological systems is improved through increased diversity, so too will be the sustainability of urban water systems if an increased range of options deriving from a more holistic view of the urban water cycle is made available. This will enable solutions to be tailored to local circumstances.
Quantifying the urban water and contaminant balance (or budget), and detailing the flow paths and contaminant concentrations within the urban water system, is a way of moving towards the goal of more sustainable systems. Urban water balances have increasingly been employed in recent years as water professionals undertake more holistic evaluations of urban water systems. Due to the dominance of water in urban materials budgets, it is a vital component in sustainable urban systems (Mitchell and Diaper 2003).
To model cycle and sustainable planning of urban water Birmingham city, decision support tools termed the UWOT and mDSS4 are selected.
2.5.1 UWOT
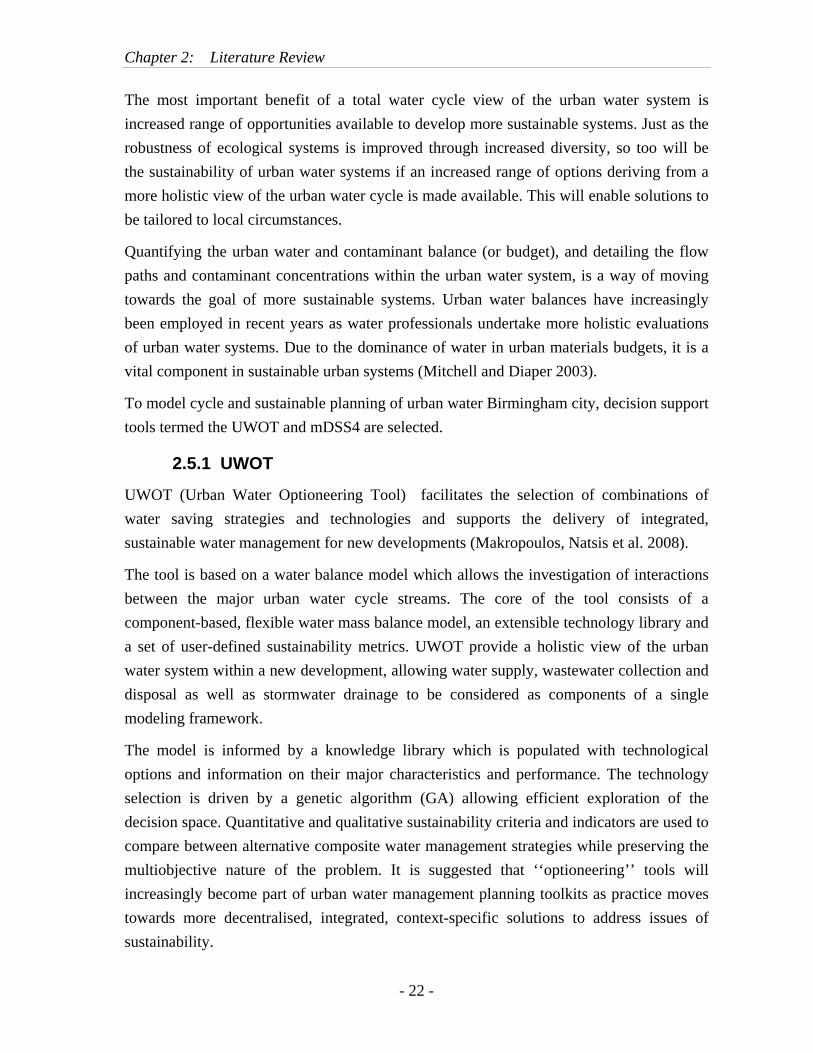
UWOT (Urban Water Optioneering Tool) facilitates the selection of combinations of water saving strategies and technologies and supports the delivery of integrated, sustainable water management for new developments (Makropoulos, Natsis et al. 2008).
The tool is based on a water balance model which allows the investigation of interactions between the major urban water cycle streams. The core of the tool consists of a component-based, flexible water mass balance model, an extensible technology library and a set of user-defined sustainability metrics. UWOT provide a holistic view of the urban water system within a new development, allowing water supply, wastewater collection and disposal as well as stormwater drainage to be considered as components of a single modeling framework.
The model is informed by a knowledge library which is populated with technological options and information on their major characteristics and performance. The technology selection is driven by a genetic algorithm (GA) allowing efficient exploration of the decision space. Quantitative and qualitative sustainability criteria and indicators are used to compare between alternative composite water management strategies while preserving the multiobjective nature of the problem. It is suggested that ‘‘optioneering’’ tools will increasingly become part of urban water management planning toolkits as practice moves towards more decentralised, integrated, context-specific solutions to address issues of sustainability.
Chapter 2: Literature Review
- 23 -
The approach adopted here is the selection of appropriate criteria linked to specific indicators.
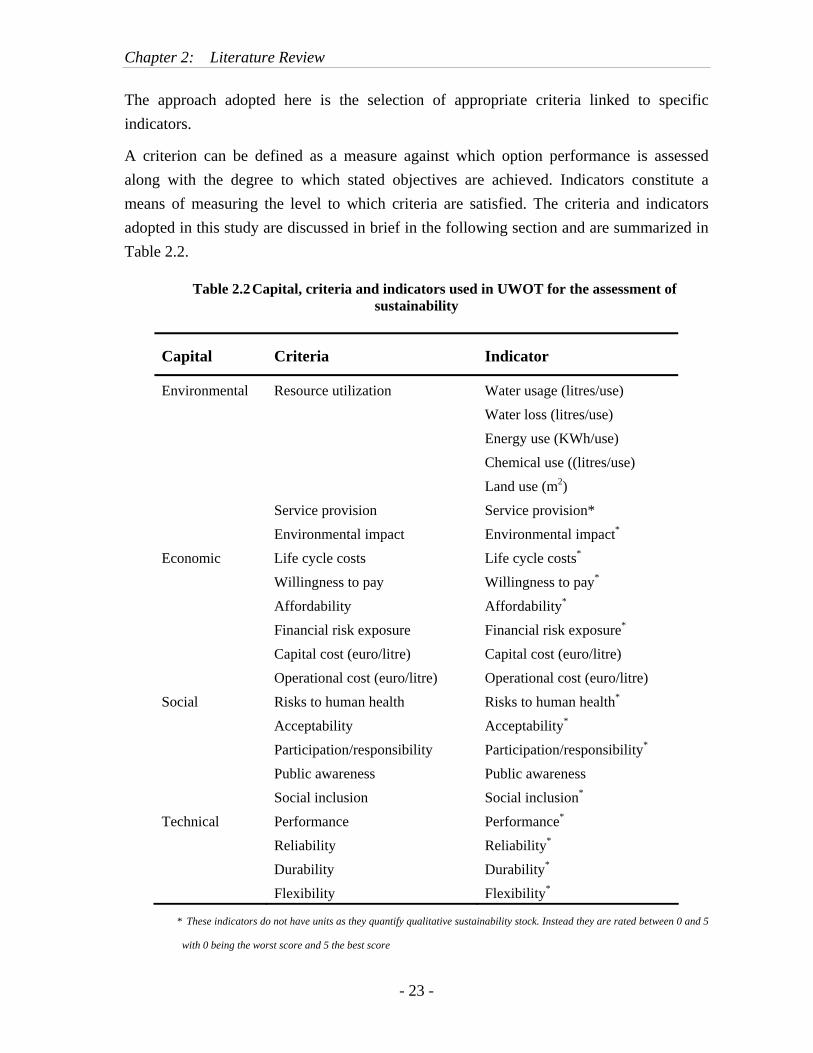
A criterion can be defined as a measure against which option performance is assessed along with the degree to which stated objectives are achieved. Indicators constitute a means of measuring the level to which criteria are satisfied. The criteria and indicators adopted in this study are discussed in brief in the following section and are summarized in Table 2.2.
Table 2.2 Capital, criteria and indicators used in UWOT for the assessment of sustainability
Capital Criteria Indicator
Environmental Resource utilization Water usage (litres/use) Water loss (litres/use) Energy use (KWh/use) Chemical use ((litres/use) Land use (m2) Service provision Service provision* Environmental impact Environmental impact*
Economic Life cycle costs Life cycle costs*
Willingness to pay Willingness to pay*
Affordability Affordability*
Financial risk exposure Financial risk exposure*
Capital cost (euro/litre) Capital cost (euro/litre) Operational cost (euro/litre) Operational cost (euro/litre) Social Risks to human health Risks to human health*
Acceptability Acceptability* Participation/responsibility Participation/responsibility* Public awareness Public awareness Social inclusion Social inclusion* Technical Performance Performance* Reliability Reliability* Durability Durability* Flexibility Flexibility*
* These indicators do not have units as they quantify qualitative sustainability stock. Instead they are rated between 0 and 5
with 0 being the worst score and 5 the best score

Chapter 2: Literature Review
- 24 -
The UWOT is structured as follows: the first section deals with sustainability objectives and the use of sustainability indicators as a means of supporting sustainable option selection. The following section deals with the urban water cycle, its distinct components and provides examples of urban water management technologies, included in the tool. The third section describes in detail the generic structure of the water mass balance model, developed in Simulink, which forms the core of the Decision Support Tool (DST) as well as the Technology Library which contains the different technological options for UWM and their key characteristics.
Potable water
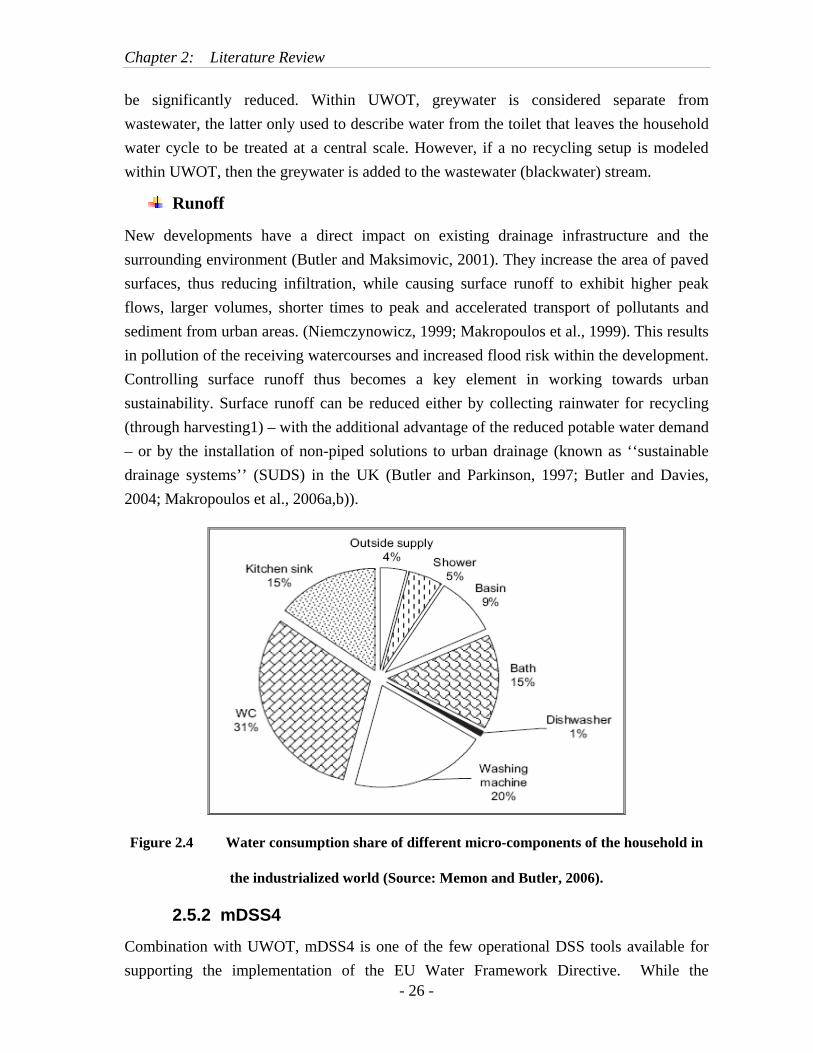
Potable water is by definition water whose quality meets drinking water standards. Treating water to potable standards is an expensive and energy consuming process. However, as can be seen from Figure 2.4, only a small proportion (approximately 15–20%) of in-house water demand is actually used for purposes requiring drinking water quality (incl. water used for drinking, cooking and cleaning dishes).
Water consumption patterns can vary significantly from house to house, depending on the household occupancy, the social and cultural conditions as well as on the type of the water consuming appliances installed in the houses (Butler and Davies, 2004).
Grey water
Greywater is the dilute wastewater stream originating from domestic activities such as showering, bathing, washing hands, tooths brushing, dishwashing, washing clothes, cleaning and food preparation. The water contains some organic material, for example, food remains, with pathogens, and inorganic material, such as detergents, sand and salt (Balkema, 2003). The advantage of reusing greywater is that the supply is regular and not dependent on external phenomena (such as rain). As a result, the storage space required could be substantially smaller than in the case of rainwater systems. Moreover, the substitution of potable water with greywater used for purposes other than drinking, e.g., toilet flushing and garden irrigation, reduces demand and thus assists the preservation of valuable water resources (Nolde, 2000).
The main issues, relevant to the applicability of greywater systems include social acceptability and water quality. A freshly produced greywater usually does not have any objectionable odor. However, it requires early treatment after collection. If stored untreated for long periods, oxygen deficient conditions will develop and scum will be formed that can float or sink in the collection tank (Memon and Butler, 2005). Moreover, the bacterial population tends to increase with increased storage duration (Dixon et al., 1999). In general, treating greywater prior to recycling is more socially acceptable, and renders it
Chapter 2: Literature Review
- 25 -
suitable for more uses. It should be noted, however, that water quality standards for in-house greywater use (or indeed greenwater – see below) have yet to be defined in the UK.
Greenwater
Greenwater is a term used in this work to denote treated rainwater and treated greywater.
- Rainwater usually carries small pollutant loads (depended interalia on location, roof building materials and collection system construction) and its harvesting system consists of three basic elements: the collection system, the conveyance system and the storage system. The main disadvantage is the unpredictable and often irregular supply which results in large storage space requirements (Dixon et al., 1999). Light treatment and disinfection is generally adequate for rainwater treatment to non-potable standards.
- Greywater requires more treatment than rainwater to reach an acceptable standard. The level of treatment required depends on the scale and purpose of use. At small scale, a two-stage treatment consisting of filtration of coarse pollutants (hair and suspended impurities) followed by disinfection with chlorine, bromine or UV may be sufficient (Memon and Butler, 2005).
Greywater recycling at medium to large scales may be more viable but requires more complex treatment. Options include biological aerated filters, membranes, bioreactors, UV treatment, Titanium Dioxide (TiO2) dosing, membrane aeration bioreactors and coagulation/flocculation with alum or ferric (Memon and Butler, 2005).
Greenwater, regardless of the scale of the recycling scheme or origin, could be a viable alternative water supply, and can potentially substitute potable water in some water uses within the house, with the obvious exception of drinking water or food preparation. Studies have shown (Nolde, 2000) that service (green) water mad available from rainwater or greywater systems can be cost effective and with proper operation presents no hygienic risk or comfort loss for the consumer. The unavailability of water quality standards for greenwater in-house use, however, is an obvious barrier to its adoption as an alternative form of supply, at least in the UK.
Wastewater
In conventional water supply and drainage systems, the whole volume of delivered drinking water becomes wastewater requiring treatment before being released to the environment. Increasing water demand also means that additional wastewater will have to be disposed of, often in areas where existing sewage treatment works may be at capacity or in areas where discharge potential to local watercourse is limited by environmental concerns. If recycling schemes are implemented the volume of wastewater produced can
Chapter 2: Literature Review
- 26 -
be significantly reduced. Within UWOT, greywater is considered separate from wastewater, the latter only used to describe water from the toilet that leaves the household water cycle to be treated at a central scale. However, if a no recycling setup is modeled within UWOT, then the greywater is added to the wastewater (blackwater) stream.
Runoff
New developments have a direct impact on existing drainage infrastructure and the surrounding environment (Butler and Maksimovic, 2001). They increase the area of paved surfaces, thus reducing infiltration, while causing surface runoff to exhibit higher peak flows, larger volumes, shorter times to peak and accelerated transport of pollutants and sediment from urban areas. (Niemczynowicz, 1999; Makropoulos et al., 1999). This results in pollution of the receiving watercourses and increased flood risk within the development. Controlling surface runoff thus becomes a key element in working towards urban sustainability. Surface runoff can be reduced either by collecting rainwater for recycling (through harvesting1) – with the additional advantage of the reduced potable water demand – or by the installation of non-piped solutions to urban drainage (known as ‘‘sustainable drainage systems’’ (SUDS) in the UK (Butler and Parkinson, 1997; Butler and Davies, 2004; Makropoulos et al., 2006a,b)).
Figure 2.4 Water consumption share of different micro-components of the household in
the industrialized world (Source: Memon and Butler, 2006).
2.5.2 mDSS4
Combination with UWOT, mDSS4 is one of the few operational DSS tools available for supporting the implementation of the EU Water Framework Directive. While the
Chapter 2: Literature Review
- 27 -
advantage of UWOT is to support rather than replace managerial judgment and assisting decision-makers to explore possible solutions and outcomes beyond the obvious ones then mDSS4 is a flexible approach aimed at facilitating the involvement of stakeholders in the process of Integrated Water Resources Management and Natural Resources Management in general, to help for targeting the needs of the potential end users in particular water administrations involved in the local implementation. mDSS4 is a perfect complement for UWOT to have policy evaluation of choosing one (or more) policy measure from a set of mutually exclusive alternatives or producing their complete ranking then to make explicit value judgments and access the extent to which different policies contributed to achieve the pursued goals and objectives.
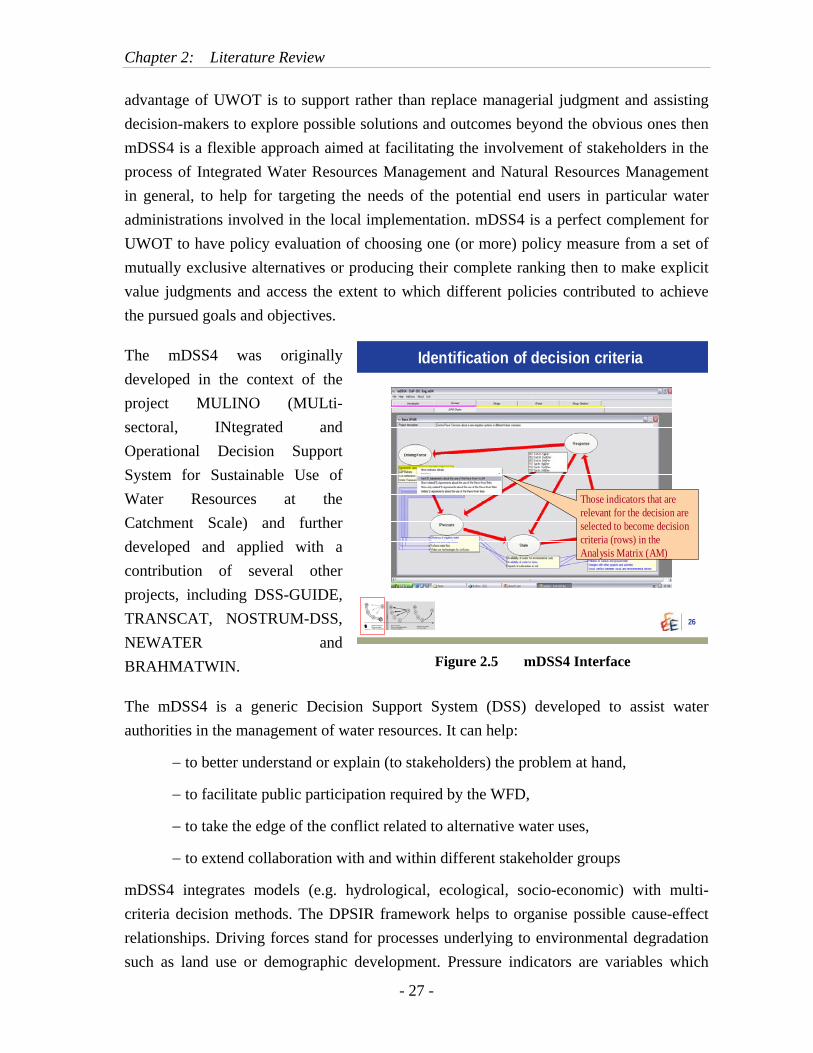
The mDSS4 was originally developed in the context of the project MULINO (MULti-sectoral, INtegrated and Operational Decision Support System for Sustainable Use of Water Resources at the Catchment Scale) and further developed and applied with a contribution of several other projects, including DSS-GUIDE, TRANSCAT, NOSTRUM-DSS, NEWATER and BRAHMATWIN.
26
Identification of decision criteria
Those indicators that are relevant for the decision are selected to become decision criteria (rows) in the Analysis Matrix (AM)
Figure 2.5 mDSS4 Interface
The mDSS4 is a generic Decision Support System (DSS) developed to assist water authorities in the management of water resources. It can help:
− to better understand or explain (to stakeholders) the problem at hand,
− to facilitate public participation required by the WFD,
− to take the edge of the conflict related to alternative water uses,
− to extend collaboration with and within different stakeholder groups
mDSS4 integrates models (e.g. hydrological, ecological, socio-economic) with multi-criteria decision methods. The DPSIR framework helps to organise possible cause-effect relationships. Driving forces stand for processes underlying to environmental degradation such as land use or demographic development. Pressure indicators are variables which
Chapter 2: Literature Review
- 28 -
measures the level of environmental impairment (e.g. total quantity of nitrogen in chemical or biological fertilisers applied per unit of agricultural land). State indicators represent the current condition (or change) of the environment (e.g. average concentration of nitrogen in surface or ground waters). Impacts represent the ultimate effect of changes of State indicators, or the damage caused (e.g. eutrophication of surface water or water becoming unsuitable for alternative plans for ecologically sound production systems, or alternative designs for a water treatment plant) (FEEM 2008).drinking). Responses are the policies and measures to solve the problems. They are represented by a set of alternative options to choose from (e.g.
mDSS4 session is consist of three phases described below:
a) CONCEPTUAL PHASE: identification of the issues and problem exploration.
The DPSIR approach allows the user to conceptualize and structure the decision situation according to the cause-effect relationships, which describe the inherent environmental problem(s) from the perspective of the decision maker (DM). In the real world, after having detected a negative impact which falls within their competences, DMs investigate the possible causes to identify possible actions: i.e. they proceed backwards from Impacts up to the identification of the most likely Driving Forces. This process leads the DM to the formalization of DPS chains, which provide a conceptual description of issues, relations and problems upon which future decisions could be based. This phase represents the start of the decision process, usually followed by the identification of suitable model(s) and the analysis of data in the context of the specific decision. The information collected is then organised in the form of indicators in tabular or geographical formats allocated to nodes of the DPS chains.
b) DESIGN PHASE: option definition and modeling
In the second phase, the possible options - responses in terms of the DPSIR framework – are defined and the criteria useful for the evaluation of their performance are identified, on the basis of the available indicators. Hydrological models can implemented in mDSS4 through a generic interface, which supports a coherent management of Drivers, Pressure and State indicators as distributed (in space and time) catchment variables. Those variables relevant for decision making, either coming from model outcomes or from other sources, are organised in the form of a matrix - the Analysis Matrix (AM) - containing the indicator values of the alternative options for each decision criterion. At this stage the indicator values are measured in different units and scales. In the next phase, indicator values are made comparable by normalisation and/or the application of value functions and used to fill the Evaluation Matrix (EM).

Chapter 2: Literature Review
- 29 -
c) CHOICE PHASE: Multi-criteria decision analysis
The comparison of the alternative options is the final phase of the decision making process adopted by mDSS4. Using Multi-Criteria Analysis (MCA) evaluation techniques, all options are judged, against their contributions to solve the observed impacts expressed through the criterion values stored in the EM. The main aim of MCA is to reduce the "multidimensionality" of decision problems - the multivariate option performances - into a single measure enabling an effective ranking. The heart of any MCA decision rule is therefore an aggregation procedure. Decision rules aggregate partial preferences describing individual criteria into a global preference and rank the alternatives. There is no single method universally suitable for any kind of decision problem; mDSS4 provides four decision rules: (i) Simple Additive Weighting (SAW); (ii) Order Weighting Average (OWA), (iii) the Technique for Order Preference by Similarity to Ideal, and (iv) ELECTRE.
The mDSS4 within the NetSyMoD approach
mDSS4 is a component of a comprehensive approach – NetSyMoD, developed at FEEM-NRM for supporting the process of participatory decision making. It is also one of the few operational DSS tools available for supporting the implementation of the EU Water Framework Directive.
Figure 2.6 mDSS4 in the NetSyMoD approach
The full name of NetSyMoD is Network Analysis – Creative System Modelling – Decision Support and it is a flexible approach aimed at facilitating the involvement of stakeholders in the process of IWRM and NRM in general.
mDSS4 has been designed targeting the needs of the potential end users, in particular water administrations involved in the local implementation of the WFD
a) Design of Decision Problem
- The Analysis Matrix (AM) is a tabular representation of decision outcomes measured in natural units (such as kg/yr, m3, etc.), which are commonly not directly comparable.
Chapter 2: Literature Review
- 30 -
- Choose Pairwise comparison (accessible by clicking on the Set Value From button), the method suggested when no links to external data have been previously identified for the selected D, P, or S indicators. This option is the preferred method for filling the AM from expert judgment. Experts express relative judgments by comparing each option listed in the rows with every other option in the columns and to describe the expected relative performance for the indicator under examination (reported in the upper left corner of the matrix). The choice is made by selecting the best item within a list of levels in accordance with the scale proposed by Saaty between 1/9 (i.e. extremely worse/lower) and 9 (i.e. extremely better/higher. The result is a list of normalised quantitative values to be copied to the corresponding row of the AM. A Consistency index measures the consistency of the relative judgments in the pairwise comparison matrix.
b) Choice
The comparison of the alternative options is the final phase of the decision making process adopted by mDSS4. Using Multi-Criteria Analysis (MCA) evaluation techniques, all options are judged, against their contributions to solve the observed impacts expressed through the criterion values stored in the EM. The main aim of MCA is to reduce the "multidimensionality" of decision problems - the multivariate option performances - into a single measure enabling an effective ranking. The heart of any MCA decision rule is therefore an aggregation procedure. Decision rules aggregate partial preferences describing individual criteria into a global preference and rank the alternatives.
- Normalizing the values: Initially, the evaluation matrix window, on the right of the window, is empty and the user must individually select every row of the AM and press the Send to EM button to build the EM. At the end of this process the EM contains the normalised values of the analysis matrix - the values in each row of the analysis matrix transformed to a common [0, 1] range.
Both the Analysis Matrix and the Evaluation Matrix can be edited by clicking on the table to modify dimensions of rows and columns.
By clicking on “Benefit type)” the user is allowed to transform the AM data (expressed in natural units) through a min-max normalisation by applying a linear transformation to the data stored in the chosen AM row, in which a zero value is given to the minimum value of the row, while 1 is given to the maximum;
- Asssigning weights: Using the Pairwise Comparison Weighting approach.
In the pairwise comparison approach, each criteria pair is compared individually. For each pair, it is indicated how important the criterion in the row is versus the criterion in column. After having compiled the comparison matrix, the associated criteria weights are calculated

Chapter 2: Literature Review
- 31 -
and appear in the first column of the display. Since the process may generate inconsistencies in the pairwise comparison, the consistency index, which appears at the bottom of the display, acts as a guide. If the value of the index is lower than 0.1, the matrix is considered consistent enough. Otherwise the user should revise the comparisons. If the matrix is consistent, clicking on the “OK” button copies the calculated weights into the weight quadrant (sliders) where they may still be interactively changed and their effect visually examined and then saved in a wgt file for further elaboration.
- Decision rules:
+ SAW (Simple Additive Weighting) is a simple sum of the criterion values of every option, weighted by the vector of weights. The results are expressed by means of scores: the option with the highest score should be preferred.
Once that the vector of criterions weight is defined on the right side of the SAW window appears: the Response for SAW. The best option is coloured in yellow and has a score of 100%. The others are ranked in % relative to first position.
+ OWA (Ordered Weighted Averaging): The order weights are multiplied to a criterion according to its rank position, rather than according to its individual importance.
c) Group Decision Analysis
The situation in which several decision makers have to work together and make a common decision is becoming a rule in environmental management. mDSS includes two different approaches when facing such a situation. In the first, the decision makers agree on a common decision model – all members of a decision group are able to find a compromise (through discussion) on a common set of options, criteria and decision rules applied - even though the decision makers may have different judgments with regard to the weights assigned to each criterion. mDSS provides a routine that compares the differences between the weights expressed by different decision makers/interest groups (see Weight discord mode below). When the differences are small, the software proposes compromise weights lying somewhere between the indicated sets.
When the judgments are too different and result in different ranking of options, no compromise solution may be found. In this case the different options are presented and the decision makers or decision group members vote which solution (choice) should be taken (see Compromise mode further below). The voting approach implemented in mDSS is based on three different decision rules: Borda, Extended Borda and Condorcet.
Chapter 2: Literature Review
- 32 -
- Weight discord mode
The mDSS4 allows to compare different sets of weights. The current weights are shown in the first row. To add another previously stored sets of weights, double click on the row head with caption “Load new weights”. A window will appear allowing you to navigate to the directory with the files in which alternative weights are stored.
Once an additional set of weights have been added, two graphs will appear in the bottom part of the screen. The first shows criteria on the x-axis and their weights on the y-axis. The different sets of weights are distinguished by colour.
Further below the difference between two chosen sets of weights are shown in a bar diagram. User may determine which two sets of weights have to be compared from the drop-down list on the right side of the bar diagram. In both diagrams the names of the criteria are abbreviated. The full names of the criteria are listed in the bottom part of the screen.
- Compromise mode
In the compromised mode you can compare and aggregate different rankings of the options. This can help in situations in which the various stakeholders assessed the options separately and with different results. The mDSS4 contains a number of formal aggregation (voting) rules to reconcile the differences in these rankings.
The screen contains a table with the rankings obtained by the most recent aggregation rule applied. The most suitable options is listed first, the options with poorest performance is listed last. The other rankings can be defined manually – by clicking the empty cell of the other rows and choosing from the drop-down menu in which the available, not yet assigned options are listed. Alternatively, you can click on the head of the next empty row bearing caption “Load a new option order” to open a previous saved results.
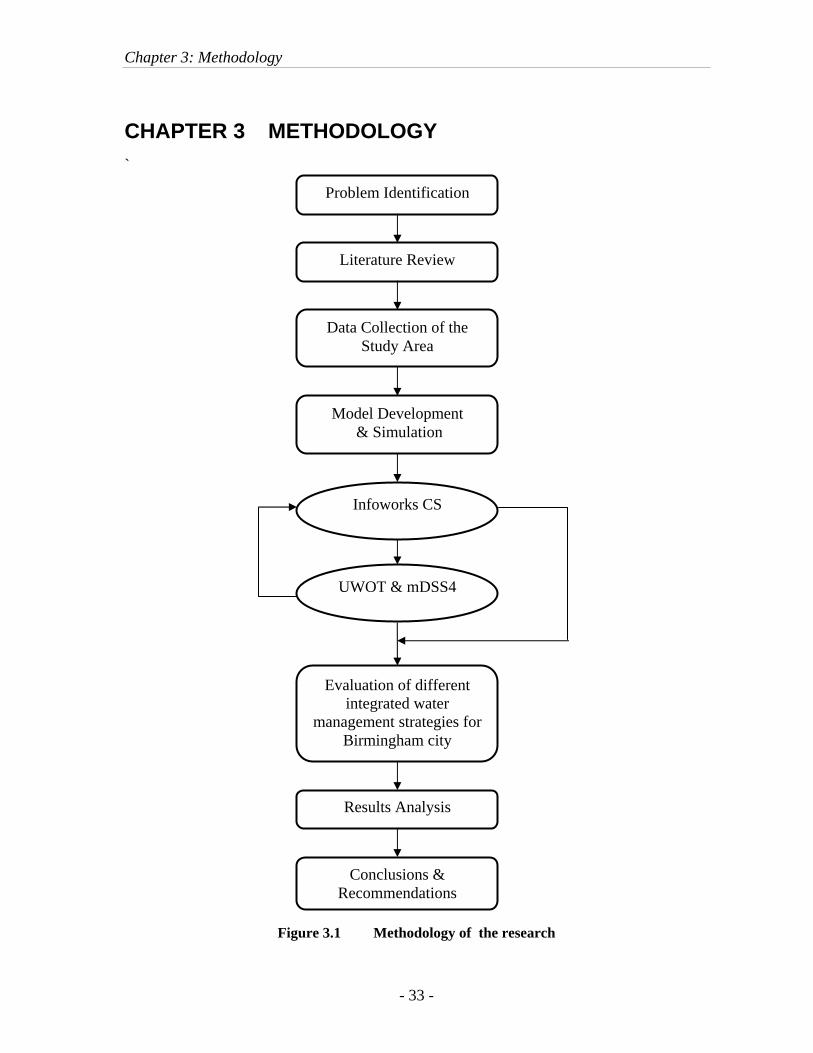
Chapter 3: Methodology
- 33 -
CHAPTER 3 METHODOLOGY `
Figure 3.1 Methodology of the research
Infoworks CS
Problem Identification
Literature Review
Data Collection of the Study Area
Model Development & Simulation
UWOT & mDSS4
Evaluation of different integrated water
management strategies for Birmingham city
Results Analysis
Conclusions & Recommendations

Chapter 3: Methodology
- 34 -
The general methodology of the thesis work is shown in Figure 3.1.
In the early phase, scientific concepts are considered and summarized in Literature Review as the first important part. Knowledge and understanding about urban flooding, stormwater, urban water management, and integrated urban water management are given as basic backgrounds for study development.
In the second phase, collecting data for the study is needed to comprehend the practical problems. STWL had provided significant information for the simulation work.
In order to fulfill the objectives of the study, Infoworks CS is used to simulate the flood situation in the catchment and as a result, sustainable management would be approached.
Finally, analysis and evaluation of model results help to find out the most appropriate and innovative solution for integrated urban water management in the case study as well as to propose a learning alliance for other “cities of future”.
In the thesis progress, modeling parts are very important. These parts decide whether or not the final work can bring about contributions as well as innovative solutions for the study area as well for the general problems as a whole. Therefore, detailed programs for modeling phases are given in this chapter.
From data of existing sewer systems in Upper Rea Main area in Birmingham city, flooding still occur, and it is reported to be more critical recently due to the impact of climate change and urbanization of the new housing developments (Defra 2008). The sewer network has been found not effective enough to carry stormwater flow. One of the targets of the thesis is to upgrade the pipe system so that it could fulfill hydrodynamic aspects and the other target is to develop model of stormwater harvesting combined with SUDS as a new solution for flood mitigation in a sustainable way.
InfoWorks CS software is used to first identify the flood issue and later, is one of the method to solve the problem.
3.1 Modeling of Infoworks CS for Flooding Control for Upper Rea Main Catchment, Birmingham City
The Foul Water System (FWS) and the Surface Water System (SWS) of Upper Rea Main had been built by Severn Trent Water Limited in 2001. However, only Surface Water System will be considered in this study because it has the direct and most urgent impact to flooding in the catchment. Therefore sewer system design is assessed:
a) Validation of the whole sewer system, this including combined, open space, partially separate, totally separate and SWS to FWS.
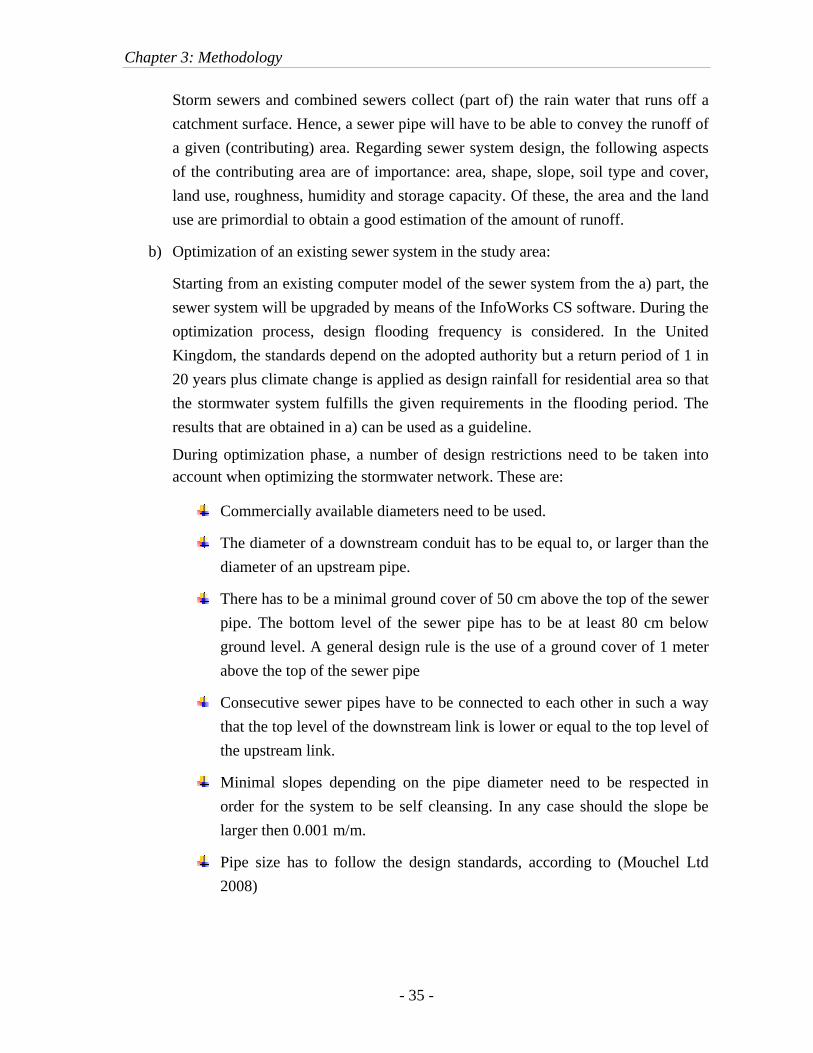
Chapter 3: Methodology
- 35 -
Storm sewers and combined sewers collect (part of) the rain water that runs off a catchment surface. Hence, a sewer pipe will have to be able to convey the runoff of a given (contributing) area. Regarding sewer system design, the following aspects of the contributing area are of importance: area, shape, slope, soil type and cover, land use, roughness, humidity and storage capacity. Of these, the area and the land use are primordial to obtain a good estimation of the amount of runoff.
b) Optimization of an existing sewer system in the study area:
Starting from an existing computer model of the sewer system from the a) part, the sewer system will be upgraded by means of the InfoWorks CS software. During the optimization process, design flooding frequency is considered. In the United Kingdom, the standards depend on the adopted authority but a return period of 1 in 20 years plus climate change is applied as design rainfall for residential area so that the stormwater system fulfills the given requirements in the flooding period. The results that are obtained in a) can be used as a guideline.
During optimization phase, a number of design restrictions need to be taken into account when optimizing the stormwater network. These are:
Commercially available diameters need to be used.
The diameter of a downstream conduit has to be equal to, or larger than the diameter of an upstream pipe.
There has to be a minimal ground cover of 50 cm above the top of the sewer pipe. The bottom level of the sewer pipe has to be at least 80 cm below ground level. A general design rule is the use of a ground cover of 1 meter above the top of the sewer pipe
Consecutive sewer pipes have to be connected to each other in such a way that the top level of the downstream link is lower or equal to the top level of the upstream link.
Minimal slopes depending on the pipe diameter need to be respected in order for the system to be self cleansing. In any case should the slope be larger then 0.001 m/m.
Pipe size has to follow the design standards, according to (Mouchel Ltd 2008)
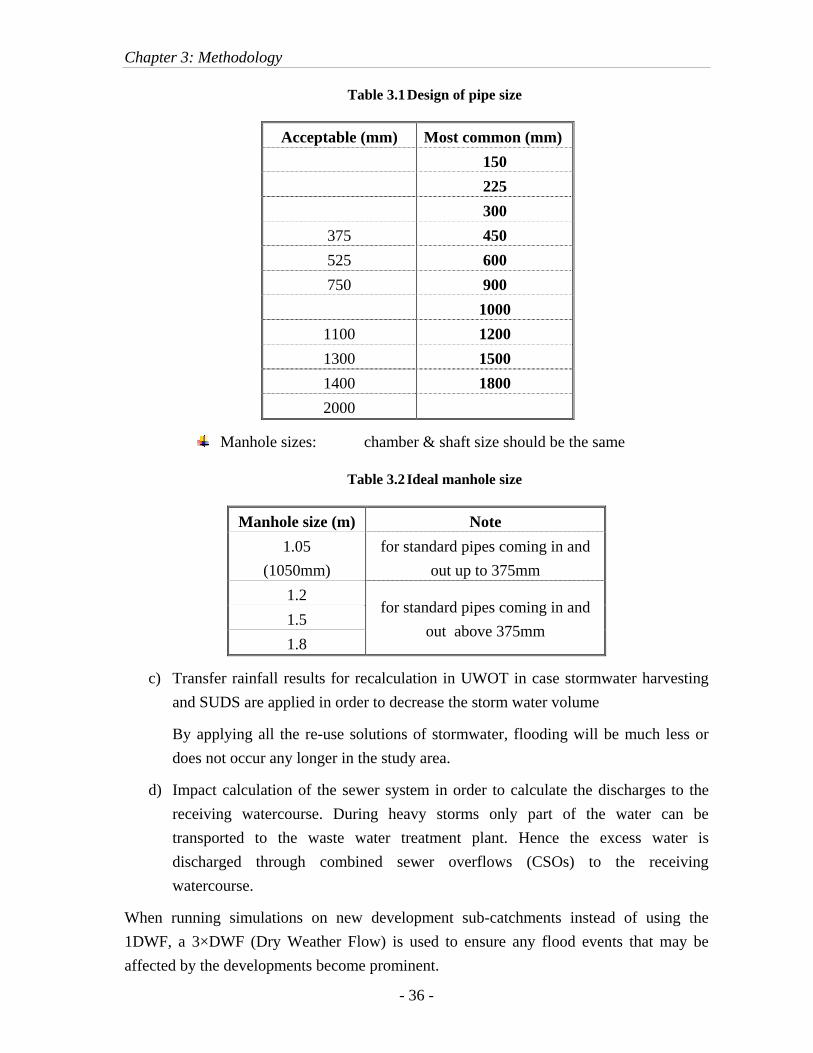
Chapter 3: Methodology
- 36 -
Table 3.1 Design of pipe size
Acceptable (mm) Most common (mm) 150 225 300
375 450 525 600 750 900
1000 1100 1200 1300 1500 1400 1800 2000
Manhole sizes: chamber & shaft size should be the same
Table 3.2 Ideal manhole size
Manhole size (m) Note 1.05
(1050mm) for standard pipes coming in and
out up to 375mm 1.2 1.5 1.8
for standard pipes coming in and out above 375mm
c) Transfer rainfall results for recalculation in UWOT in case stormwater harvesting and SUDS are applied in order to decrease the storm water volume
By applying all the re-use solutions of stormwater, flooding will be much less or does not occur any longer in the study area.
d) Impact calculation of the sewer system in order to calculate the discharges to the receiving watercourse. During heavy storms only part of the water can be transported to the waste water treatment plant. Hence the excess water is discharged through combined sewer overflows (CSOs) to the receiving watercourse.
When running simulations on new development sub-catchments instead of using the 1DWF, a 3×DWF (Dry Weather Flow) is used to ensure any flood events that may be affected by the developments become prominent.
Chapter 3: Methodology
- 37 -
Note: A 1DWF is used when looking at Overflows, Historical Verification models and CSO spill frequency, otherwise a 3DWF is used to observe extreme events, enabling flooding events to be clearly noted.
3.2 UWOT & mDSS4 for Urban Water Management Strategies With Infoworks CS, the existing sewer systems are analyzed and improved. Infoworks CS helps to evaluate the flooding situation in the catchment, producing flood risk assessment and show the flood risk maps.
In the first part, Infoworks calculate the total volume of stormwater which leads to flood in the selected catchment. This volume needs to be transferred to a sustainable way as said by (Mitchell, 2006).
To get the sustainable water management and planning in the most appropriate strategy, UWOT is designed to enable the comparison of a wide variety of water management technologies and schemes (including recycling, treatment and drainage) at different scales. The UWOT help to investigate the effect of different urban water management strategies including green water, grey water reuse and SUDS application.
The methodology developed in this study, supported by the prototype UWOT & mDSS4 softwares, deal with a specific type of urban water management problem: the (technological) option selection problem. It relates to the decision problem of choosing the most suitable technology (Infoworks CS) given case-specific conditions and constraints with respect to technical, environmental, social and economic objectives.
UWOT & mDSS4 are used in this thesis targeting the needs of the potential end users, in particular water administrations involved in the local implementation of the WFD; also specifically targeted to support the development of IUWMs.
3.2.1. Model Set Up in UWOT
UWOT integrates Simulink/MATLAB and Microsoft Excel (via Excel’s Visual Basic for Applications (VBA) programming environment) into a computationally strong and user-friendly decision support tool. Excel is used for data input, storage of technology options characteristics and results visualization. MATLAB/Simulink computes the water mass balance model, for the particular combination of technological options selected for evaluation by the user and processes its outputs in a form suitable for sustainability assessment, optimization and visualization, finally presented in Excel. The details of the mass balance model and its interaction with the technology options at different spatial and temporal scales are presented below.
Chapter 3: Methodology
- 38 -
The Simulink water balance model is at the core of UWOT and was created to investigate the effect of selecting different combinations of technologies (at various scales) on the water cycle of the development. The Simulink model consists of distinct, (drag-n-drop) components. This is facilitated by the Simulink modeling units called ‘‘blocks’’. By developing and linking together various independent blocks, a powerful yet modular application has been built minimizing the effort required for future model extension.
Stormwater can be used for many purposes. UWOT gives advices for stormwater to be collected, treated and used at central and local technologies. Harvested stormwater in public area is treated at central technologies or stored in service reservoir; harvested rain in household is stored in local green tank.
At the initial step, UWOT helps to clarify Supply Grey/Priority Table defining which type of water is used for different purposes. The first priority is put as 1 and the least priority is set as 99 (or do not use) (Makropoulos, Natsis et al. 2008)
To investigate how much the stormwater can be re-used, calculation is made for the household technologies with the appliances for washing machine, toilet, treatment, shower, bath, handbasin, kitchen sink, dish washer, garden and outside use. These technologies are evaluated based on capital, criteria and indicators for the assessment of sustainability. Long term scenarios can be developed by changing technologies. There also includes the SUDS local, it means if there is any SUDS treatment at household level.
In the next step, household data are investigated by clarifying the occupancy, number of houses, total impervious and pervious areas, and total rain harvesting areas. With household switches, grey and stormwater recycling are calculated if harvested rain or grey water in household are stored in local green/grey tank for different usages or harvested rain will be runoff flows only.
All the water used outside household or can not be used at household level then be counted for central technologies which calculate total public impervious areas (including the any rain harvesting areas), the rain on these public areas either infiltrates and/or evaporates and the part of the total public impervious area that is used for rainfall harvesting. The harvested rain tank which collects the harvested rain from households and public areas are also investigated together with grey tank which collects the grey produced from the development. Finally, the service reservoir which stores the green produced by the central grey treatment technology is also mentioned as well as SUDS which are large reservoirs storing and draining the runoff.
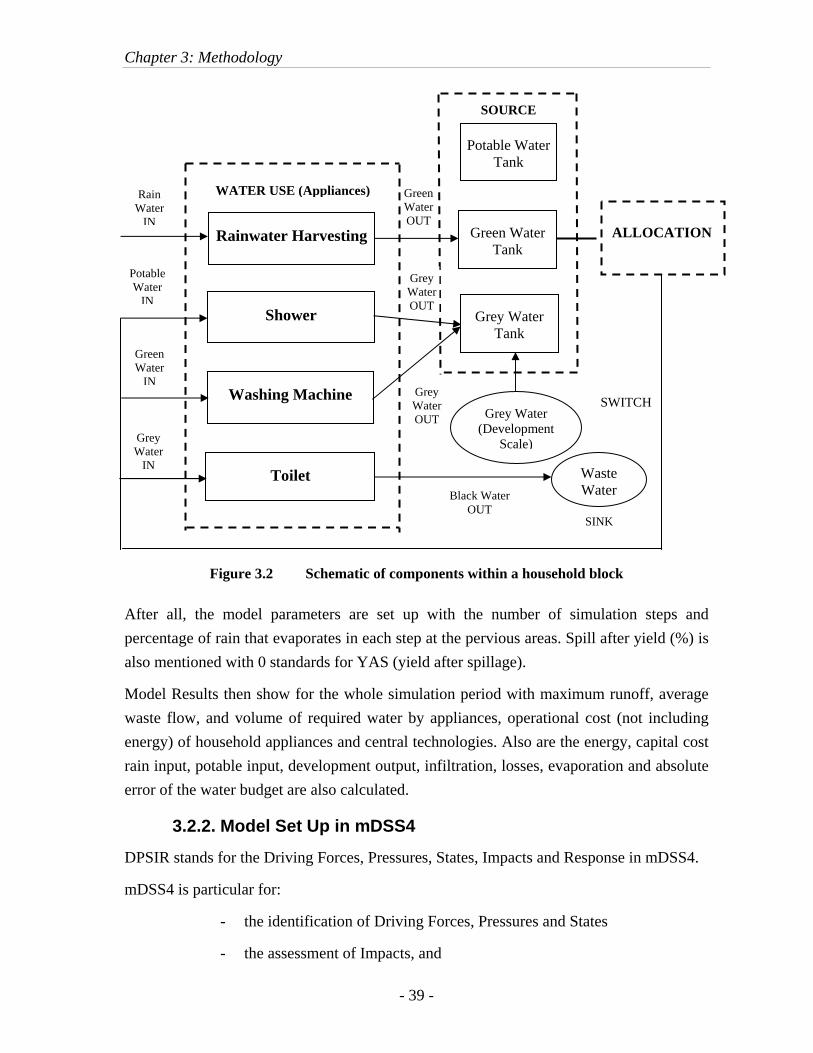
Chapter 3: Methodology
- 39 -
Figure 3.2 Schematic of components within a household block
After all, the model parameters are set up with the number of simulation steps and percentage of rain that evaporates in each step at the pervious areas. Spill after yield (%) is also mentioned with 0 standards for YAS (yield after spillage).
Model Results then show for the whole simulation period with maximum runoff, average waste flow, and volume of required water by appliances, operational cost (not including energy) of household appliances and central technologies. Also are the energy, capital cost rain input, potable input, development output, infiltration, losses, evaporation and absolute error of the water budget are also calculated.
3.2.2. Model Set Up in mDSS4
DPSIR stands for the Driving Forces, Pressures, States, Impacts and Response in mDSS4.
mDSS4 is particular for:
- the identification of Driving Forces, Pressures and States
- the assessment of Impacts, and
Rainwater Harvesting
Shower
Washing Machine
Toilet
Potable Water Tank
Green Water Tank
Grey Water Tank
ALLOCATION
Grey Water (Development
Scale)
SWITCH Grey Water OUT
Grey Water OUT
Green Water OUT
Waste Water Black Water
OUT SINK
Grey Water
IN
Green Water
IN
Potable Water
IN
Rain Water
IN
SOURCE
WATER USE (Appliances)
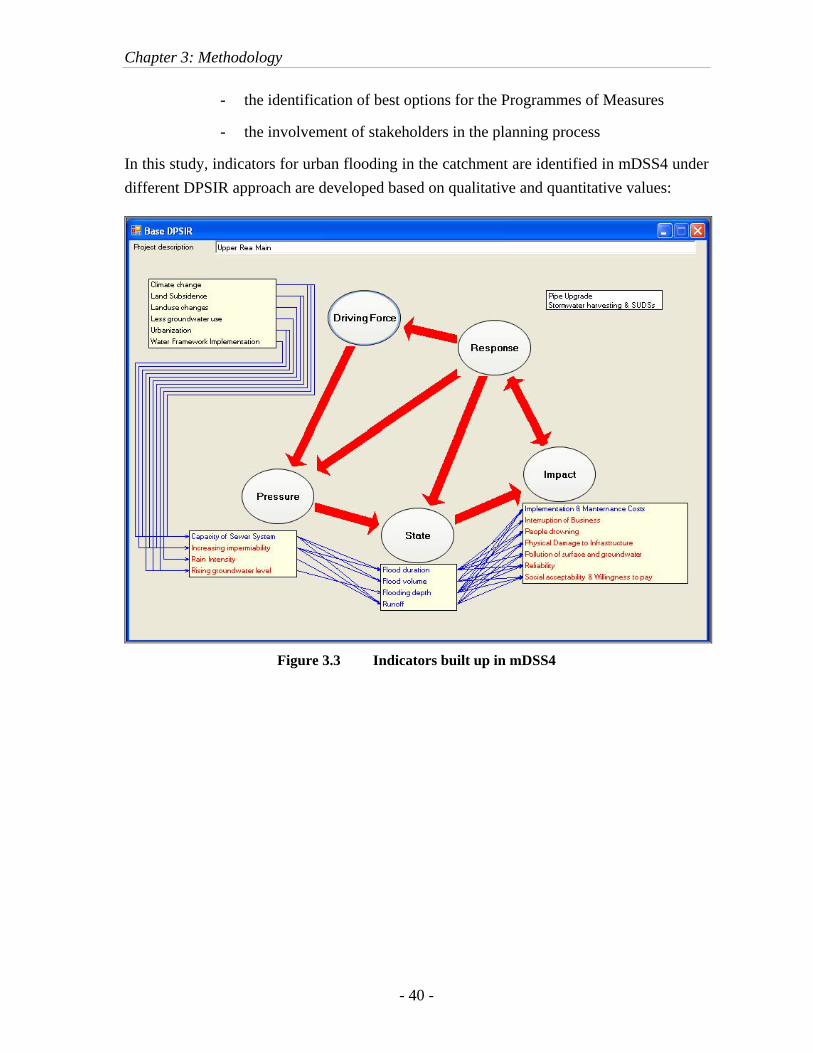
Chapter 3: Methodology
- 40 -
- the identification of best options for the Programmes of Measures
- the involvement of stakeholders in the planning process
In this study, indicators for urban flooding in the catchment are identified in mDSS4 under different DPSIR approach are developed based on qualitative and quantitative values:
Figure 3.3 Indicators built up in mDSS4
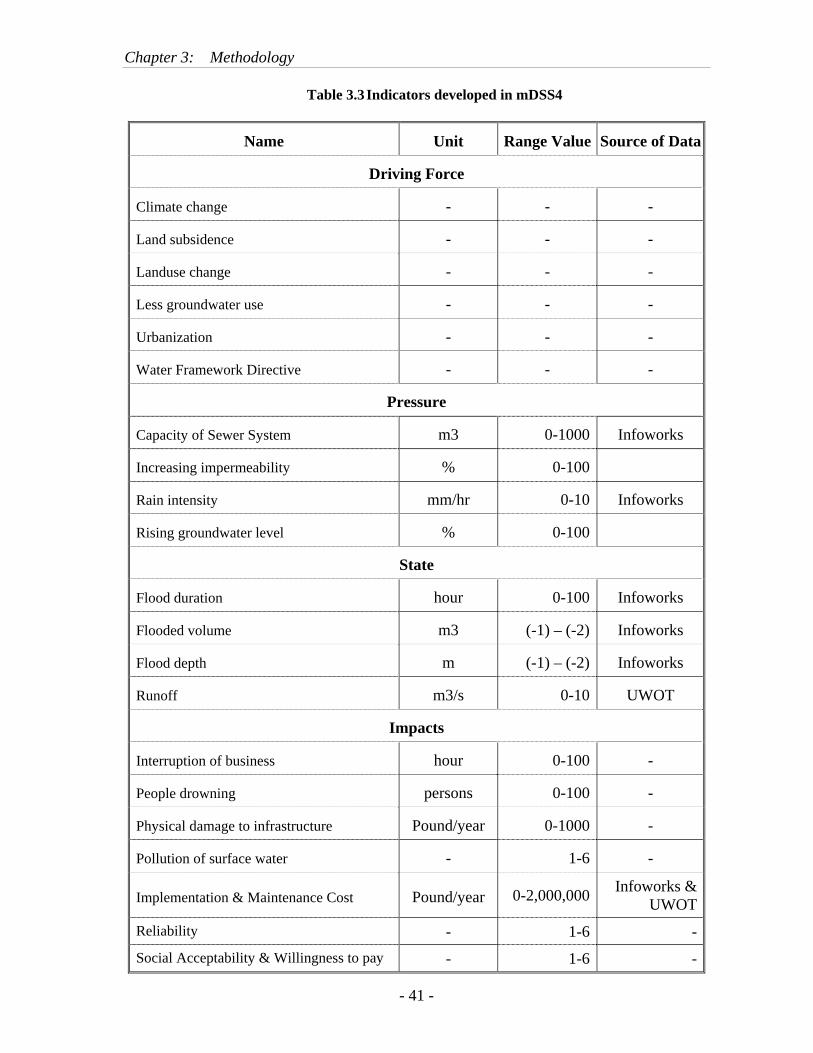
Chapter 3: Methodology
- 41 -
Table 3.3 Indicators developed in mDSS4
Name Unit Range Value Source of Data
Driving Force
Climate change - - -
Land subsidence - - -
Landuse change - - -
Less groundwater use - - -
Urbanization - - -
Water Framework Directive - - -
Pressure
Capacity of Sewer System m3 0-1000 Infoworks
Increasing impermeability % 0-100
Rain intensity mm/hr 0-10 Infoworks
Rising groundwater level % 0-100
State
Flood duration hour 0-100 Infoworks
Flooded volume m3 (-1) – (-2) Infoworks
Flood depth m (-1) – (-2) Infoworks
Runoff m3/s 0-10 UWOT
Impacts
Interruption of business hour 0-100 -
People drowning persons 0-100 -
Physical damage to infrastructure Pound/year 0-1000 -
Pollution of surface water - 1-6 -
Implementation & Maintenance Cost Pound/year 0-2,000,000 Infoworks & UWOT
Reliability - 1-6 -Social Acceptability & Willingness to pay - 1-6 -
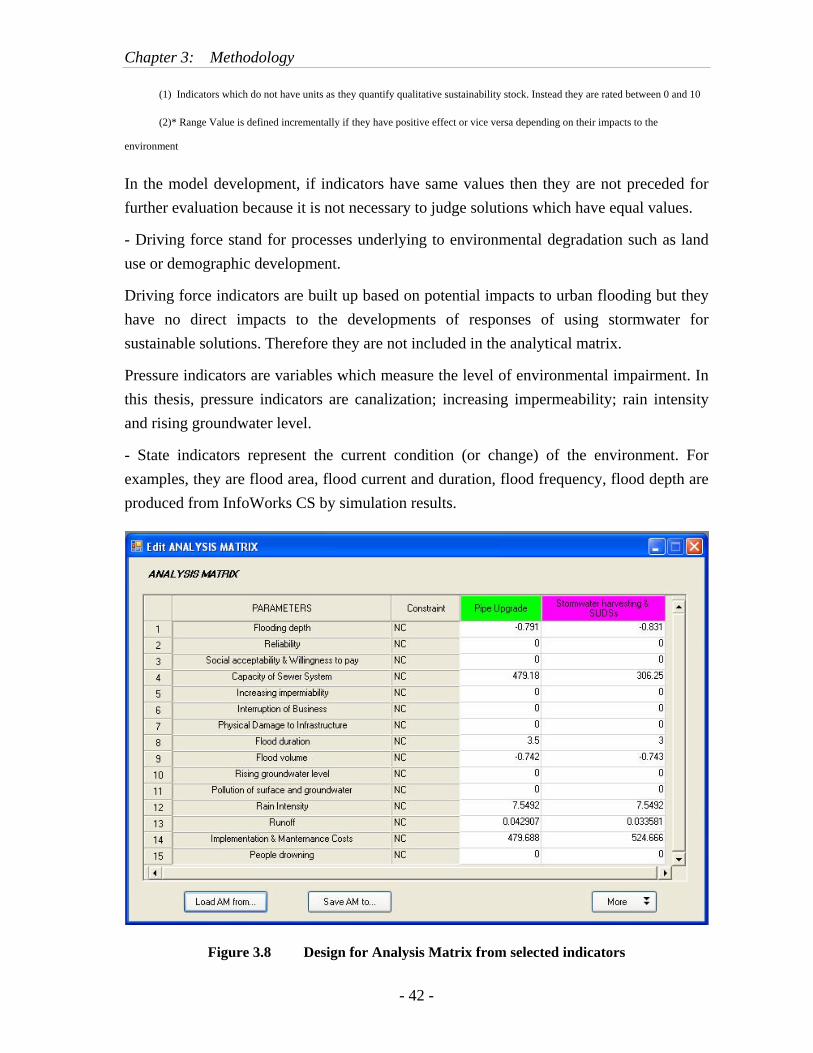
Chapter 3: Methodology
- 42 -
(1) Indicators which do not have units as they quantify qualitative sustainability stock. Instead they are rated between 0 and 10
(2)* Range Value is defined incrementally if they have positive effect or vice versa depending on their impacts to the
environment
In the model development, if indicators have same values then they are not preceded for further evaluation because it is not necessary to judge solutions which have equal values.
- Driving force stand for processes underlying to environmental degradation such as land use or demographic development.
Driving force indicators are built up based on potential impacts to urban flooding but they have no direct impacts to the developments of responses of using stormwater for sustainable solutions. Therefore they are not included in the analytical matrix.
Pressure indicators are variables which measure the level of environmental impairment. In this thesis, pressure indicators are canalization; increasing impermeability; rain intensity and rising groundwater level.
- State indicators represent the current condition (or change) of the environment. For examples, they are flood area, flood current and duration, flood frequency, flood depth are produced from InfoWorks CS by simulation results.
Figure 3.8 Design for Analysis Matrix from selected indicators
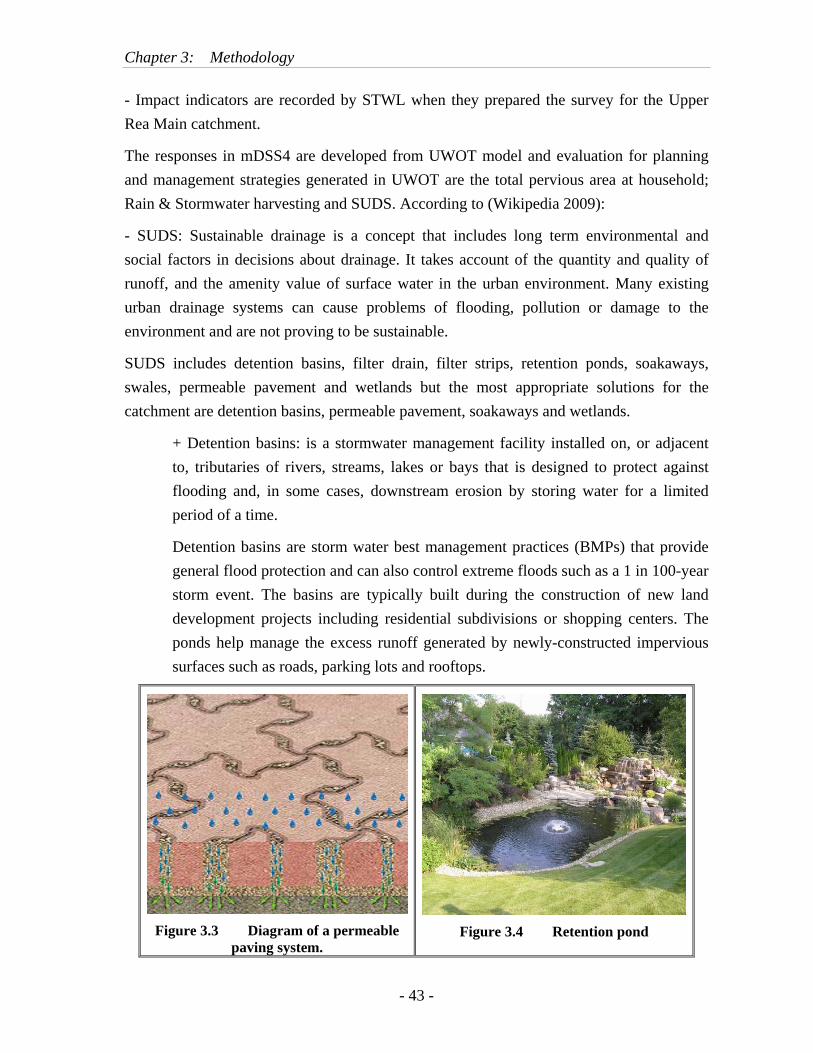
Chapter 3: Methodology
- 43 -
- Impact indicators are recorded by STWL when they prepared the survey for the Upper Rea Main catchment.
The responses in mDSS4 are developed from UWOT model and evaluation for planning and management strategies generated in UWOT are the total pervious area at household; Rain & Stormwater harvesting and SUDS. According to (Wikipedia 2009):
- SUDS: Sustainable drainage is a concept that includes long term environmental and social factors in decisions about drainage. It takes account of the quantity and quality of runoff, and the amenity value of surface water in the urban environment. Many existing urban drainage systems can cause problems of flooding, pollution or damage to the environment and are not proving to be sustainable.
SUDS includes detention basins, filter drain, filter strips, retention ponds, soakaways, swales, permeable pavement and wetlands but the most appropriate solutions for the catchment are detention basins, permeable pavement, soakaways and wetlands.
+ Detention basins: is a stormwater management facility installed on, or adjacent to, tributaries of rivers, streams, lakes or bays that is designed to protect against flooding and, in some cases, downstream erosion by storing water for a limited period of a time.
Detention basins are storm water best management practices (BMPs) that provide general flood protection and can also control extreme floods such as a 1 in 100-year storm event. The basins are typically built during the construction of new land development projects including residential subdivisions or shopping centers. The ponds help manage the excess runoff generated by newly-constructed impervious surfaces such as roads, parking lots and rooftops.
Figure 3.3 Diagram of a permeable paving system.
Figure 3.4 Retention pond
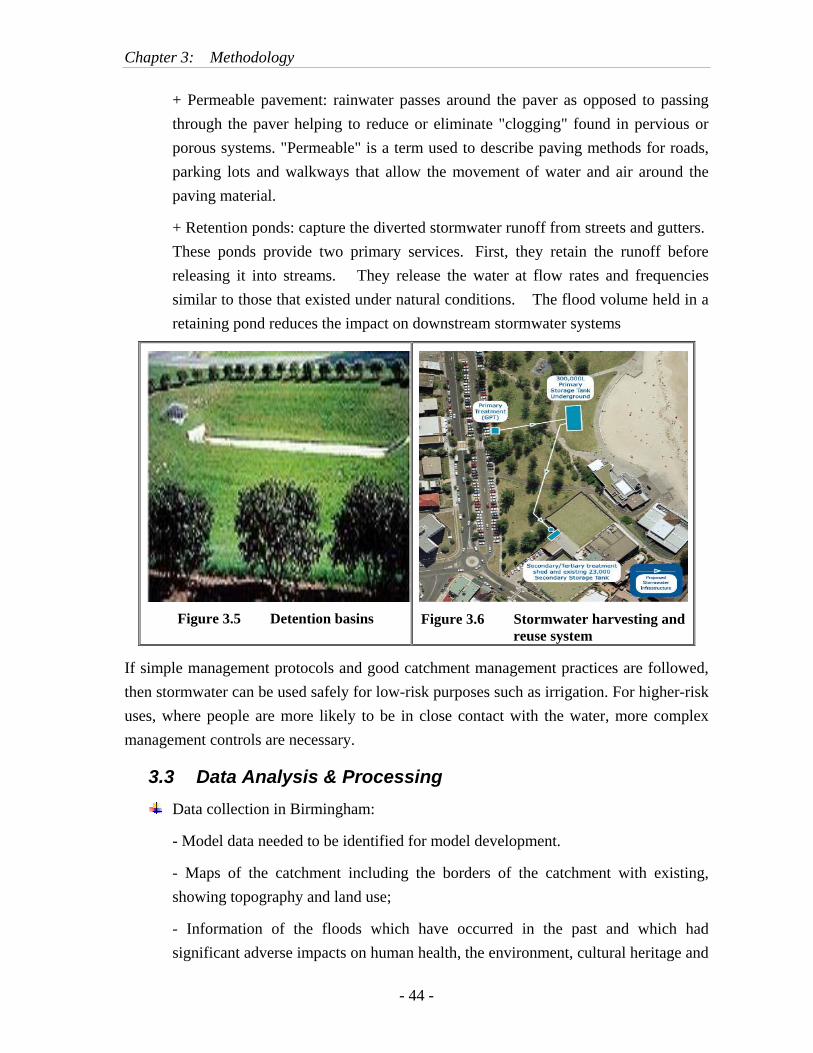
Chapter 3: Methodology
- 44 -
+ Permeable pavement: rainwater passes around the paver as opposed to passing through the paver helping to reduce or eliminate "clogging" found in pervious or porous systems. "Permeable" is a term used to describe paving methods for roads, parking lots and walkways that allow the movement of water and air around the paving material.
+ Retention ponds: capture the diverted stormwater runoff from streets and gutters. These ponds provide two primary services. First, they retain the runoff before releasing it into streams. They release the water at flow rates and frequencies similar to those that existed under natural conditions. The flood volume held in a retaining pond reduces the impact on downstream stormwater systems
Figure 3.5 Detention basins Figure 3.6 Stormwater harvesting and reuse system
If simple management protocols and good catchment management practices are followed, then stormwater can be used safely for low-risk purposes such as irrigation. For higher-risk uses, where people are more likely to be in close contact with the water, more complex management controls are necessary.
3.3 Data Analysis & Processing Data collection in Birmingham:
- Model data needed to be identified for model development.
- Maps of the catchment including the borders of the catchment with existing, showing topography and land use;
- Information of the floods which have occurred in the past and which had significant adverse impacts on human health, the environment, cultural heritage and
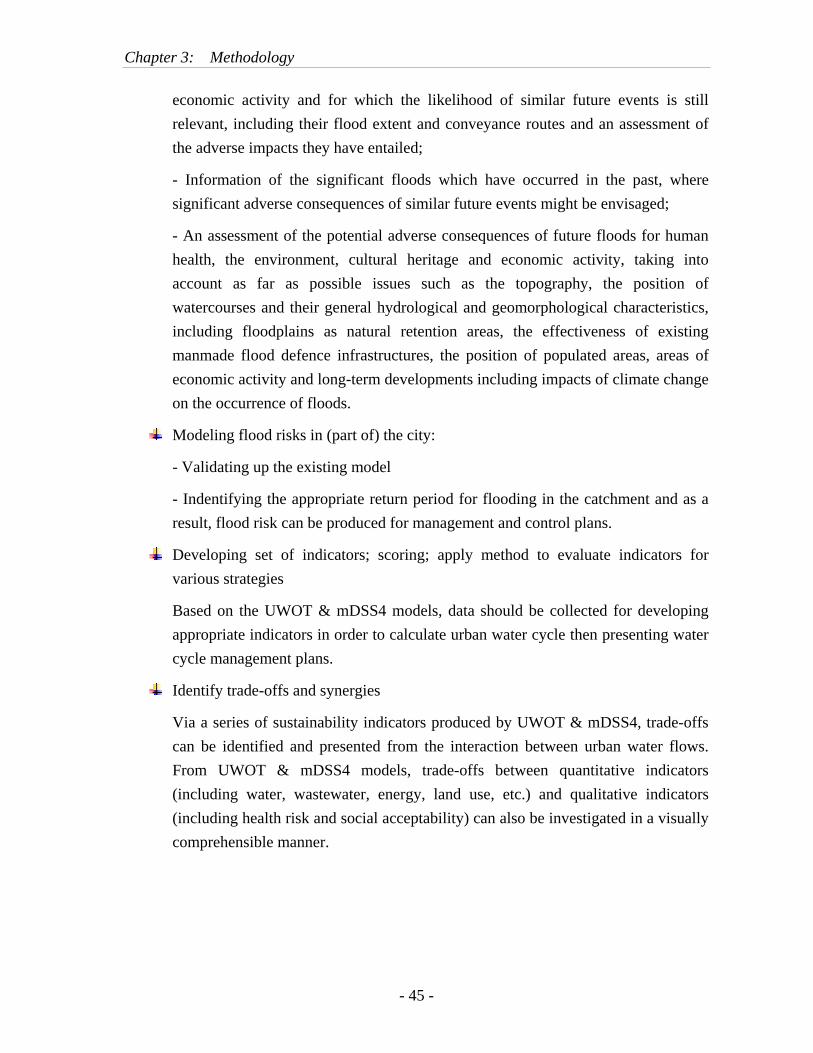
Chapter 3: Methodology
- 45 -
economic activity and for which the likelihood of similar future events is still relevant, including their flood extent and conveyance routes and an assessment of the adverse impacts they have entailed;
- Information of the significant floods which have occurred in the past, where significant adverse consequences of similar future events might be envisaged;
- An assessment of the potential adverse consequences of future floods for human health, the environment, cultural heritage and economic activity, taking into account as far as possible issues such as the topography, the position of watercourses and their general hydrological and geomorphological characteristics, including floodplains as natural retention areas, the effectiveness of existing manmade flood defence infrastructures, the position of populated areas, areas of economic activity and long-term developments including impacts of climate change on the occurrence of floods.
Modeling flood risks in (part of) the city:
- Validating up the existing model
- Indentifying the appropriate return period for flooding in the catchment and as a result, flood risk can be produced for management and control plans.
Developing set of indicators; scoring; apply method to evaluate indicators for various strategies
Based on the UWOT & mDSS4 models, data should be collected for developing appropriate indicators in order to calculate urban water cycle then presenting water cycle management plans.
Identify trade-offs and synergies
Via a series of sustainability indicators produced by UWOT & mDSS4, trade-offs can be identified and presented from the interaction between urban water flows. From UWOT & mDSS4 models, trade-offs between quantitative indicators (including water, wastewater, energy, land use, etc.) and qualitative indicators (including health risk and social acceptability) can also be investigated in a visually comprehensible manner.
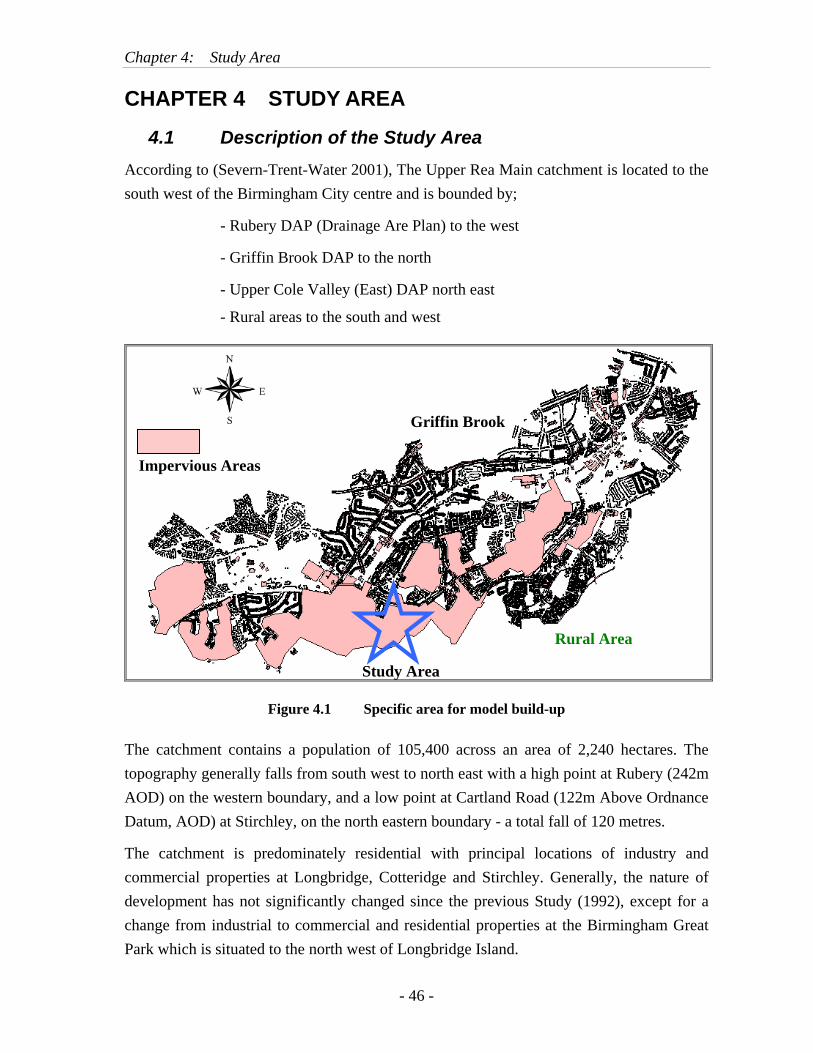
Chapter 4: Study Area
- 46 -
CHAPTER 4 STUDY AREA
4.1 Description of the Study Area According to (Severn-Trent-Water 2001), The Upper Rea Main catchment is located to the south west of the Birmingham City centre and is bounded by;
- Rubery DAP (Drainage Are Plan) to the west
- Griffin Brook DAP to the north
- Upper Cole Valley (East) DAP north east
- Rural areas to the south and west
Figure 4.1 Specific area for model build-up
The catchment contains a population of 105,400 across an area of 2,240 hectares. The topography generally falls from south west to north east with a high point at Rubery (242m AOD) on the western boundary, and a low point at Cartland Road (122m Above Ordnance Datum, AOD) at Stirchley, on the north eastern boundary - a total fall of 120 metres.
The catchment is predominately residential with principal locations of industry and commercial properties at Longbridge, Cotteridge and Stirchley. Generally, the nature of development has not significantly changed since the previous Study (1992), except for a change from industrial to commercial and residential properties at the Birmingham Great Park which is situated to the north west of Longbridge Island.
Impervious Areas
Rural Area
Griffin Brook
Study Area
Chapter 4: Study Area
- 47 -
The catchment is traversed by a number of principal and traffic sensitive roads. From Northfield to Rubery is the Bristol Road South (A38) dual carriageway, and from Longbridge Island Lickey Road (B4120) extends south towards the M5 and M40 Motorways.
There are no Sites of Special Scientific Interest within the catchment but there are a number of;
- Sites of Importance for Nature Conservation
- Sites of Local Importance Nature Reserve
- Wildlife Action Areas
- Wildlife Corridors
These sites generally follow the alignment of the principal waterways namely the River Rea and the Worcester and Birmingham Canal, plus some smaller brook courses. In addition, the Wildlife Corridors also follow the alignment of the railway line that runs between Redditch - Birmingham - Lichfield.
The degree of separation across the Upper Rea Main catchment is extremely varied throughout, with approximately; - Combined = 22%
- Partially Combined = 22%
- Totally Separate = 56%
The basic foul water sewer data contained approximately 3,830 links, of which 1,020 (26.6%) had missing upstream invert levels and 200 (5.2%) missing pipe sizes. In addition, a number of links were totally missing from the network and were added in order to obtain continuity from the head to the outfall of the system. Of the 3,850 nodes, 760 (19.7%) had missing cover levels.
Similarly, the basic surface water sewer data contained approximately 1,910 links, of which 450 (23.5%) had missing upstream invert levels and 190 (9.9%) missing pipe sizes. In addition, a number of links were totally missing from the network and were added in order to obtain continuity from the head to the outfall of the system. Of the 1,930 nodes, 320 (16.6%) had missing cover levels.
4.2 Problem Statement The River Rea has historically been noted for its variability in flow. During the 1700’s watercourse alterations were made so that water mills could be installed. Consequently, significant damage was experienced in the frequent floods and, after large floods in 1852 the River Rea was straightened and deepened.
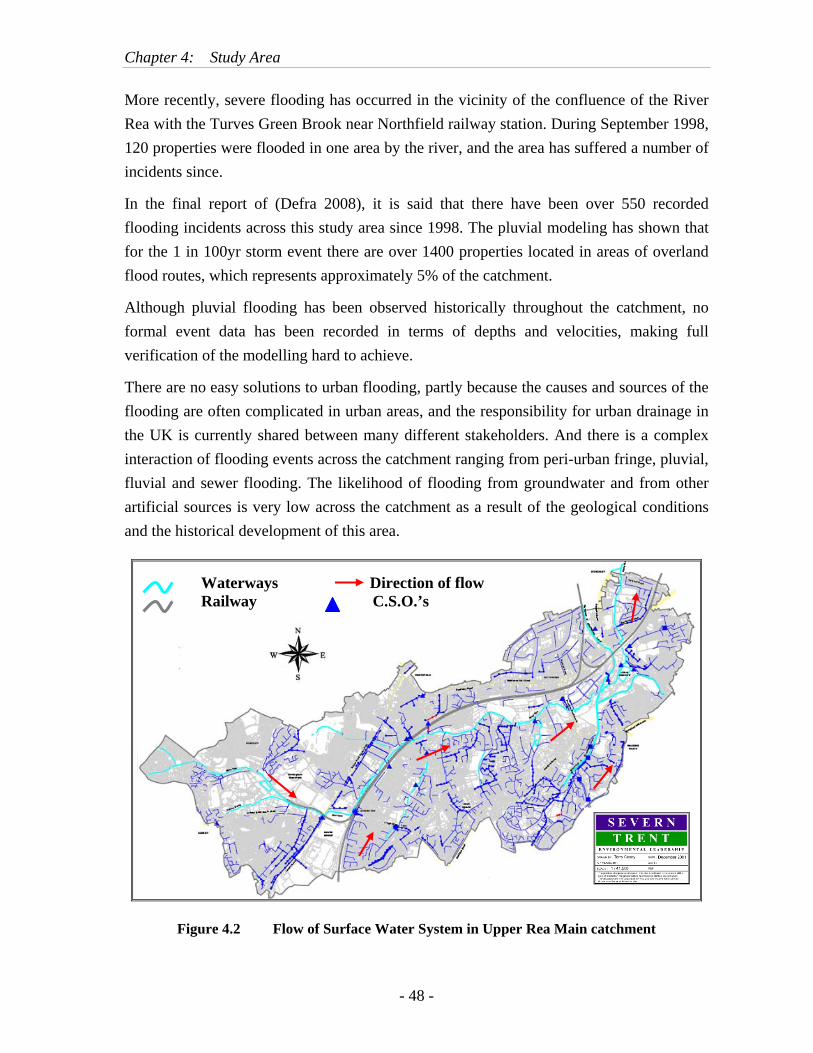
Chapter 4: Study Area
- 48 -
More recently, severe flooding has occurred in the vicinity of the confluence of the River Rea with the Turves Green Brook near Northfield railway station. During September 1998, 120 properties were flooded in one area by the river, and the area has suffered a number of incidents since.
In the final report of (Defra 2008), it is said that there have been over 550 recorded flooding incidents across this study area since 1998. The pluvial modeling has shown that for the 1 in 100yr storm event there are over 1400 properties located in areas of overland flood routes, which represents approximately 5% of the catchment.
Although pluvial flooding has been observed historically throughout the catchment, no formal event data has been recorded in terms of depths and velocities, making full verification of the modelling hard to achieve.
There are no easy solutions to urban flooding, partly because the causes and sources of the flooding are often complicated in urban areas, and the responsibility for urban drainage in the UK is currently shared between many different stakeholders. And there is a complex interaction of flooding events across the catchment ranging from peri-urban fringe, pluvial, fluvial and sewer flooding. The likelihood of flooding from groundwater and from other artificial sources is very low across the catchment as a result of the geological conditions and the historical development of this area.
Figure 4.2 Flow of Surface Water System in Upper Rea Main catchment
Waterways Direction of flow Railway C.S.O.’s
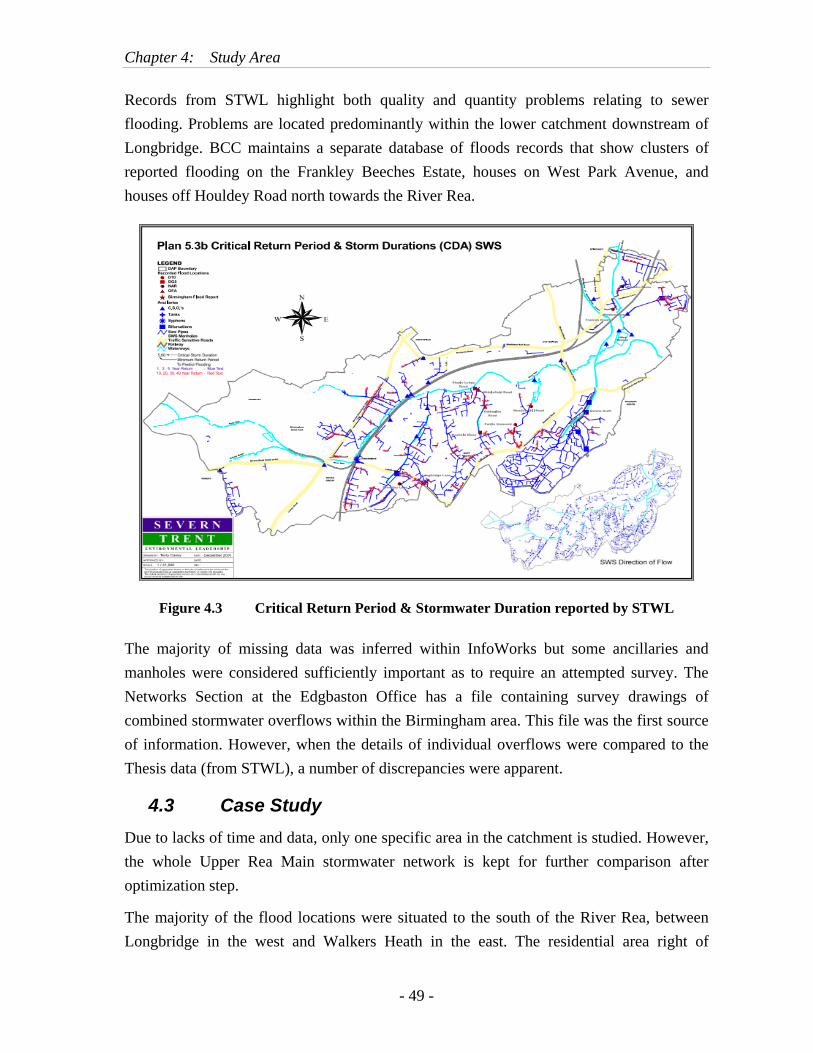
Chapter 4: Study Area
- 49 -
Records from STWL highlight both quality and quantity problems relating to sewer flooding. Problems are located predominantly within the lower catchment downstream of Longbridge. BCC maintains a separate database of floods records that show clusters of reported flooding on the Frankley Beeches Estate, houses on West Park Avenue, and houses off Houldey Road north towards the River Rea.
Figure 4.3 Critical Return Period & Stormwater Duration reported by STWL
The majority of missing data was inferred within InfoWorks but some ancillaries and manholes were considered sufficiently important as to require an attempted survey. The Networks Section at the Edgbaston Office has a file containing survey drawings of combined stormwater overflows within the Birmingham area. This file was the first source of information. However, when the details of individual overflows were compared to the Thesis data (from STWL), a number of discrepancies were apparent.
4.3 Case Study Due to lacks of time and data, only one specific area in the catchment is studied. However, the whole Upper Rea Main stormwater network is kept for further comparison after optimization step.
The majority of the flood locations were situated to the south of the River Rea, between Longbridge in the west and Walkers Heath in the east. The residential area right of
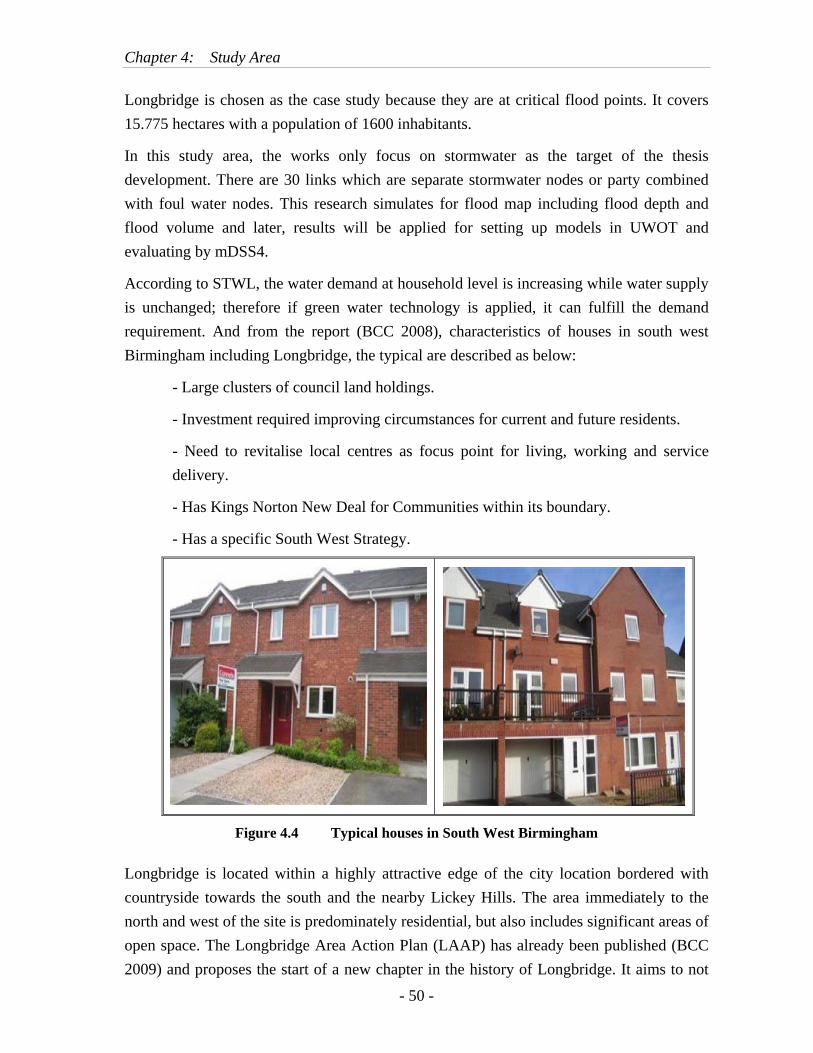
Chapter 4: Study Area
- 50 -
Longbridge is chosen as the case study because they are at critical flood points. It covers 15.775 hectares with a population of 1600 inhabitants.
In this study area, the works only focus on stormwater as the target of the thesis development. There are 30 links which are separate stormwater nodes or party combined with foul water nodes. This research simulates for flood map including flood depth and flood volume and later, results will be applied for setting up models in UWOT and evaluating by mDSS4.
According to STWL, the water demand at household level is increasing while water supply is unchanged; therefore if green water technology is applied, it can fulfill the demand requirement. And from the report (BCC 2008), characteristics of houses in south west Birmingham including Longbridge, the typical are described as below:
- Large clusters of council land holdings.
- Investment required improving circumstances for current and future residents.
- Need to revitalise local centres as focus point for living, working and service delivery.
- Has Kings Norton New Deal for Communities within its boundary.
- Has a specific South West Strategy.
Figure 4.4 Typical houses in South West Birmingham
Longbridge is located within a highly attractive edge of the city location bordered with countryside towards the south and the nearby Lickey Hills. The area immediately to the north and west of the site is predominately residential, but also includes significant areas of open space. The Longbridge Area Action Plan (LAAP) has already been published (BCC 2009) and proposes the start of a new chapter in the history of Longbridge. It aims to not

Chapter 4: Study Area
- 51 -
only deliver tomorrow’s jobs today, through a major new high technology focused Regional Investment Site, but also to break new ground in helping Birmingham prepare for climate change. This means creating sustainable high quality built environments, well designed open spaces and green corridors and taking a leading edge approach to creating mixed-use places, diverse communities and carbon neutral developments.
The submitted LAAP, however, reflects a strategy which would deliver a minimum of 1,450 new dwellings to help meet existing and future housing needs and create a sustainable, mixed use community (Objective 13 of the LAAP). New housing at Longbridge would have good accessibility to new jobs at the RIS and EZ sites, to community facilities in the new local centre, to enhanced infrastructure and services including public transport.
And it can be seen that properties in the study area are not new developed. There are many old buildings. Therefore houses are divided based on the sub-catchments in the area.
Combination with the land-use, impervious and pervious areas in the study location, data about all sub-catchments are clarified. The information also helps to choose technological development in UWOT.
Figure 4.5 Other typical houses in South West Birmingham
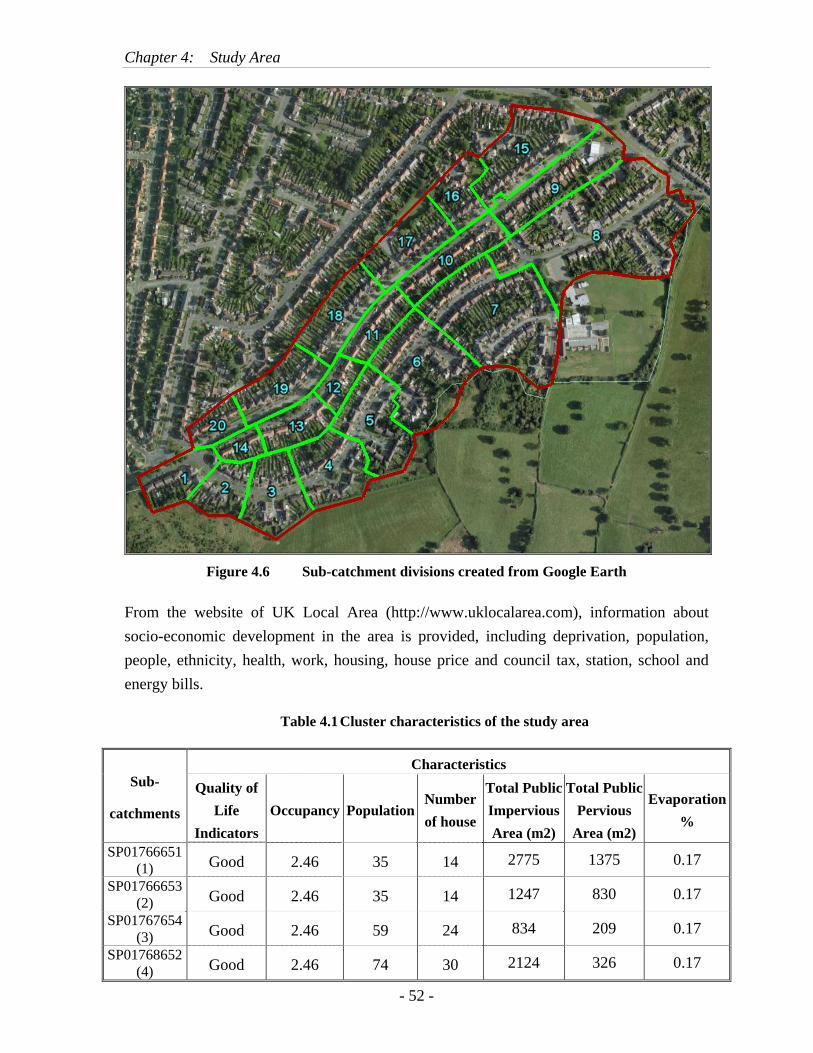
Chapter 4: Study Area
- 52 -
Figure 4.6 Sub-catchment divisions created from Google Earth
From the website of UK Local Area (http://www.uklocalarea.com), information about socio-economic development in the area is provided, including deprivation, population, people, ethnicity, health, work, housing, house price and council tax, station, school and energy bills.
Table 4.1 Cluster characteristics of the study area
Characteristics Sub-
catchments
Quality of Life
Indicators Occupancy Population
Number of house
Total Public ImperviousArea (m2)
Total Public Pervious
Area (m2)
Evaporation%
SP01766651 (1) Good 2.46 35 14 2775 1375 0.17
SP01766653 (2) Good 2.46 35 14 1247 830 0.17
SP01767654 (3) Good 2.46 59 24 834 209 0.17
SP01768652 (4) Good 2.46 74 30 2124 326 0.17
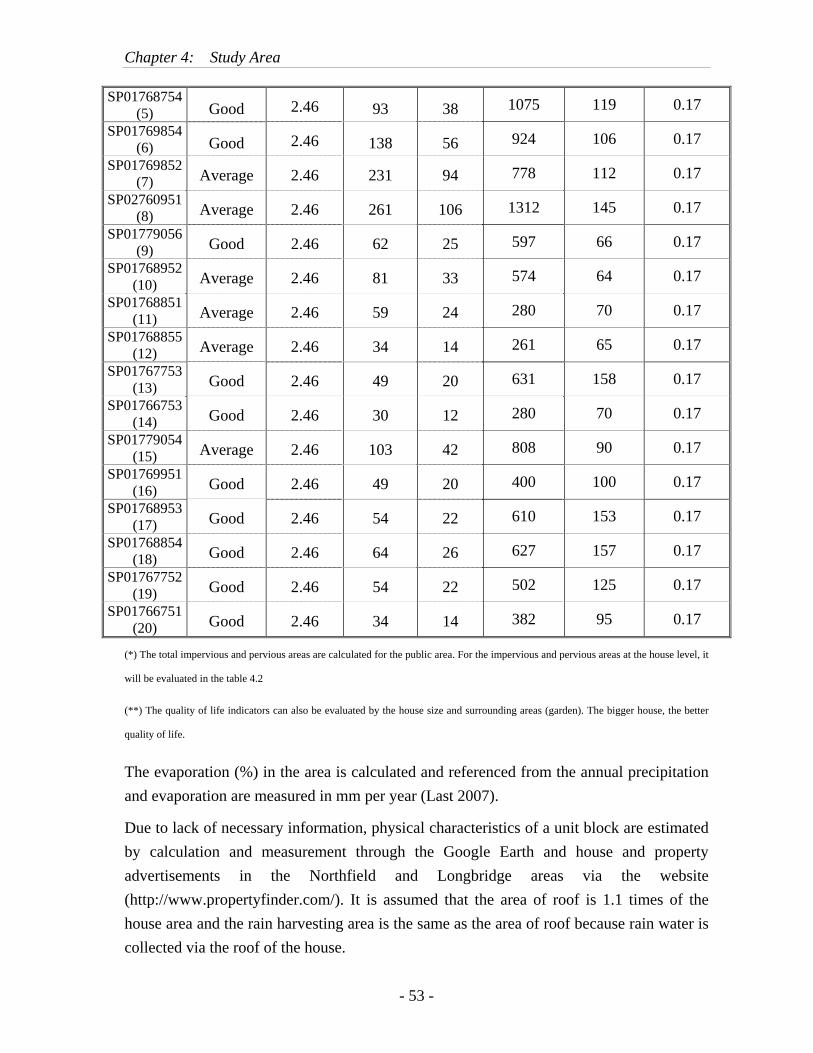
Chapter 4: Study Area
- 53 -
SP01768754 (5) Good 2.46 93 38 1075 119 0.17
SP01769854 (6) Good 2.46 138 56 924 106 0.17
SP01769852 (7) Average 2.46 231 94 778 112 0.17
SP02760951 (8) Average 2.46 261 106 1312 145 0.17
SP01779056 (9) Good 2.46 62 25 597 66 0.17
SP01768952 (10) Average 2.46 81 33 574 64 0.17
SP01768851 (11) Average 2.46 59 24 280 70 0.17
SP01768855 (12) Average 2.46 34 14 261 65 0.17
SP01767753 (13) Good 2.46 49 20 631 158 0.17
SP01766753 (14) Good 2.46 30 12 280 70 0.17
SP01779054 (15) Average 2.46 103 42 808 90 0.17
SP01769951 (16) Good 2.46 49 20 400 100 0.17
SP01768953 (17) Good 2.46 54 22 610 153 0.17
SP01768854 (18) Good 2.46 64 26 627 157 0.17
SP01767752 (19) Good 2.46 54 22 502 125 0.17
SP01766751 (20) Good 2.46 34 14 382 95 0.17
(*) The total impervious and pervious areas are calculated for the public area. For the impervious and pervious areas at the house level, it
will be evaluated in the table 4.2
(**) The quality of life indicators can also be evaluated by the house size and surrounding areas (garden). The bigger house, the better
quality of life.
The evaporation (%) in the area is calculated and referenced from the annual precipitation and evaporation are measured in mm per year (Last 2007).
Due to lack of necessary information, physical characteristics of a unit block are estimated by calculation and measurement through the Google Earth and house and property advertisements in the Northfield and Longbridge areas via the website (http://www.propertyfinder.com/). It is assumed that the area of roof is 1.1 times of the house area and the rain harvesting area is the same as the area of roof because rain water is collected via the roof of the house.
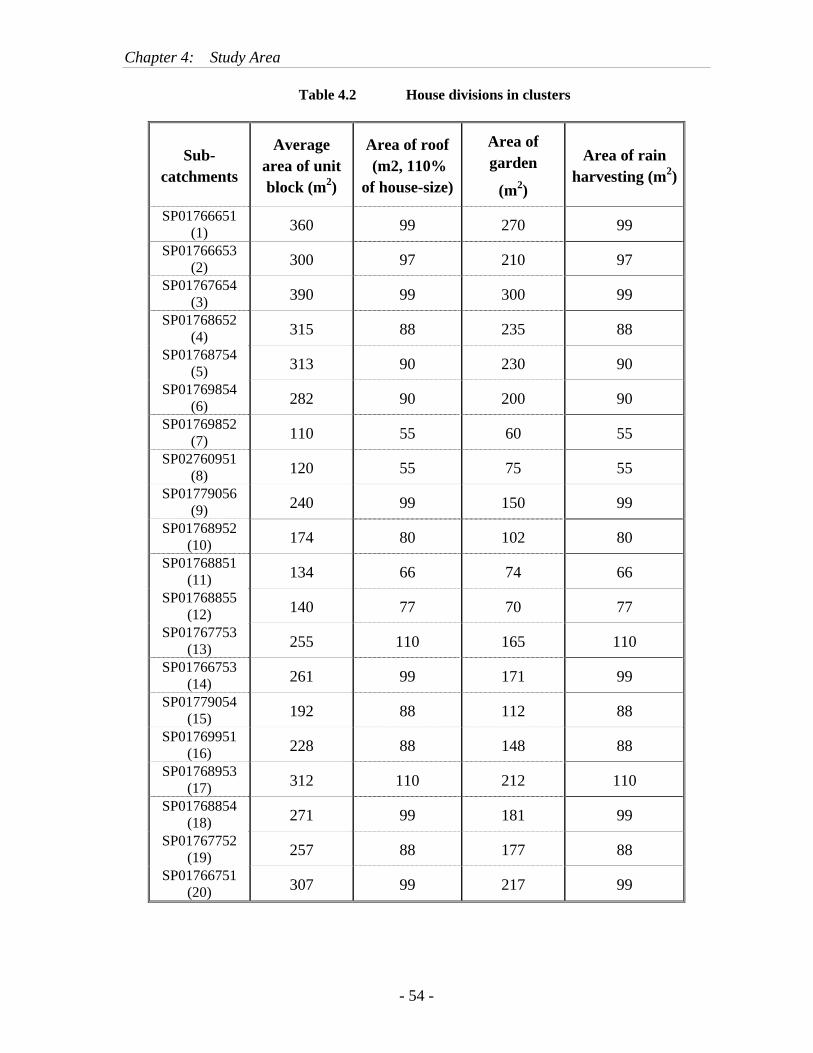
Chapter 4: Study Area
- 54 -
Table 4.2 House divisions in clusters
Sub-catchments
Average area of unit block (m2)
Area of roof (m2, 110%
of house-size)
Area of garden
(m2)
Area of rain harvesting (m2)
SP01766651 (1) 360 99 270 99
SP01766653 (2) 300 97 210 97
SP01767654 (3) 390 99 300 99
SP01768652 (4) 315 88 235 88
SP01768754 (5) 313 90 230 90
SP01769854 (6) 282 90 200 90
SP01769852 (7) 110 55 60 55
SP02760951 (8) 120 55 75 55
SP01779056 (9) 240 99 150 99
SP01768952 (10) 174 80 102 80
SP01768851 (11) 134 66 74 66
SP01768855 (12) 140 77 70 77
SP01767753 (13) 255 110 165 110
SP01766753 (14) 261 99 171 99
SP01779054 (15) 192 88 112 88
SP01769951 (16) 228 88 148 88
SP01768953 (17) 312 110 212 110
SP01768854 (18) 271 99 181 99
SP01767752 (19) 257 88 177 88
SP01766751 (20) 307 99 217 99
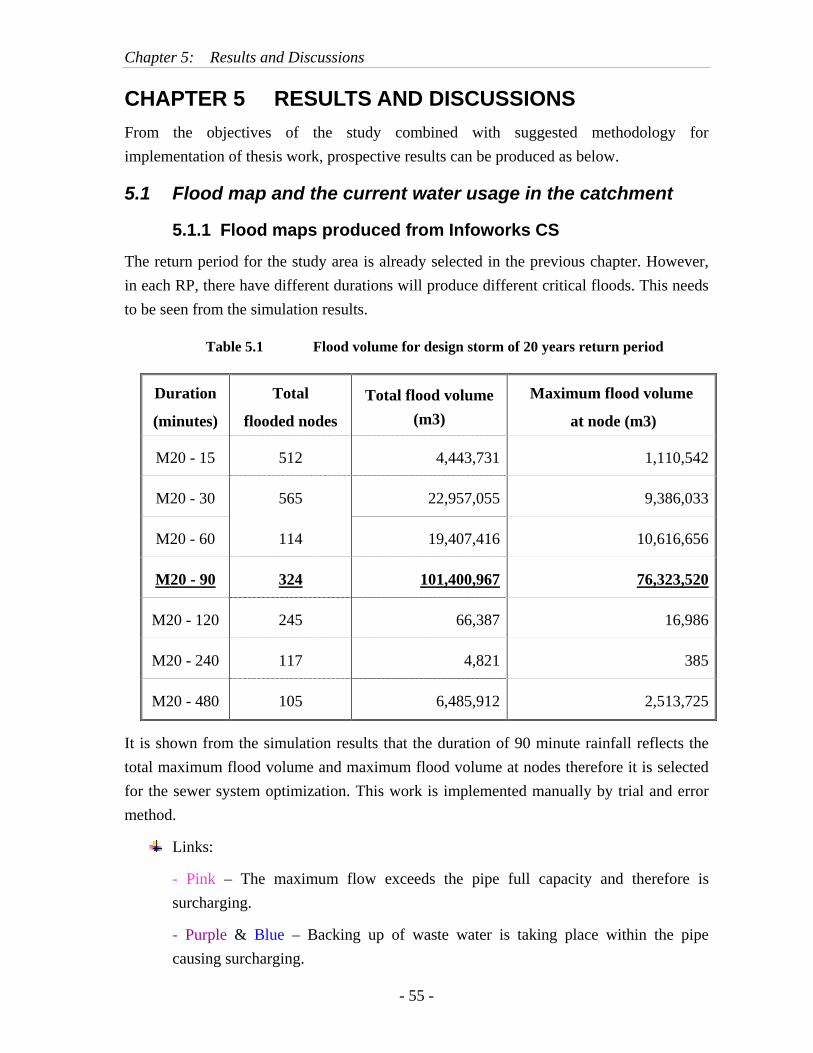
Chapter 5: Results and Discussions
- 55 -
CHAPTER 5 RESULTS AND DISCUSSIONS From the objectives of the study combined with suggested methodology for implementation of thesis work, prospective results can be produced as below.
5.1 Flood map and the current water usage in the catchment
5.1.1 Flood maps produced from Infoworks CS
The return period for the study area is already selected in the previous chapter. However, in each RP, there have different durations will produce different critical floods. This needs to be seen from the simulation results.
Table 5.1 Flood volume for design storm of 20 years return period
Duration
(minutes)
Total
flooded nodes Total flood volume
(m3) Maximum flood volume
at node (m3)
M20 - 15 512 4,443,731 1,110,542
M20 - 30 565 22,957,055 9,386,033
M20 - 60 114 19,407,416 10,616,656
M20 - 90 324 101,400,967 76,323,520
M20 - 120 245 66,387 16,986
M20 - 240 117 4,821 385
M20 - 480 105 6,485,912 2,513,725
It is shown from the simulation results that the duration of 90 minute rainfall reflects the total maximum flood volume and maximum flood volume at nodes therefore it is selected for the sewer system optimization. This work is implemented manually by trial and error method.
Links:
- Pink – The maximum flow exceeds the pipe full capacity and therefore is surcharging.
- Purple & Blue – Backing up of waste water is taking place within the pipe causing surcharging.
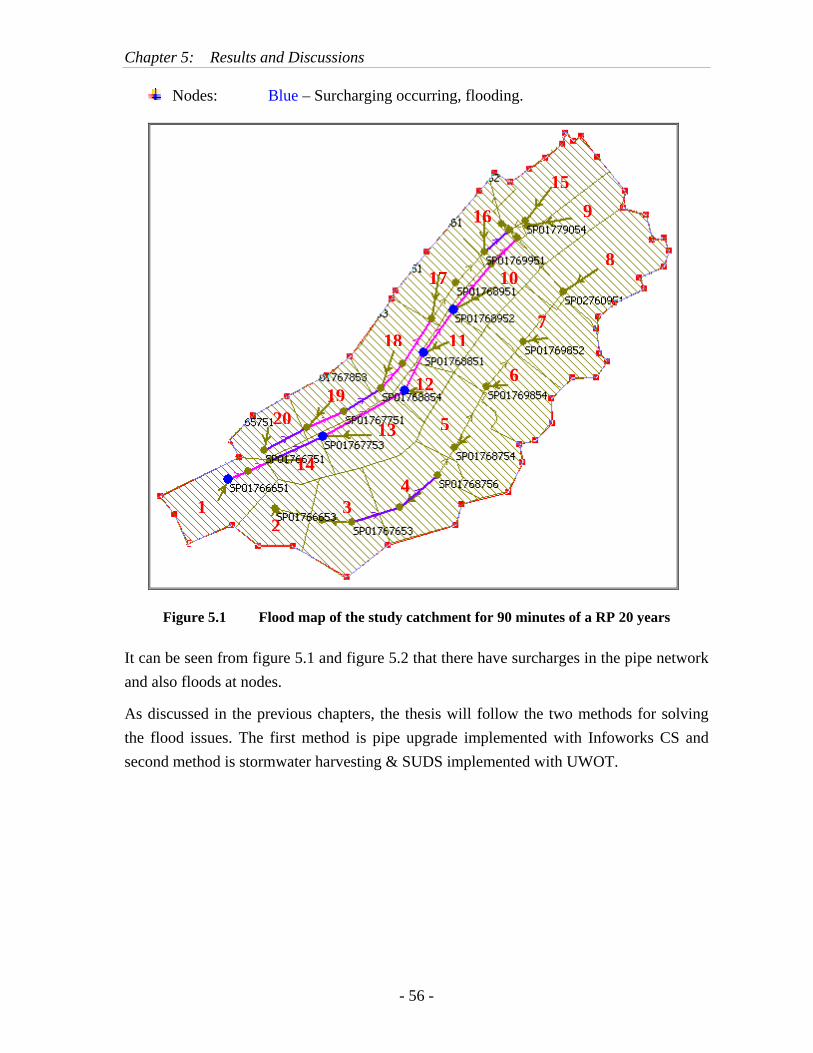
Chapter 5: Results and Discussions
- 56 -
Nodes: Blue – Surcharging occurring, flooding.
Figure 5.1 Flood map of the study catchment for 90 minutes of a RP 20 years
It can be seen from figure 5.1 and figure 5.2 that there have surcharges in the pipe network and also floods at nodes.
As discussed in the previous chapters, the thesis will follow the two methods for solving the flood issues. The first method is pipe upgrade implemented with Infoworks CS and second method is stormwater harvesting & SUDS implemented with UWOT.
1 32
4
5
6
7
8
9
10
11
12
13
14
15
16
17
18
1920
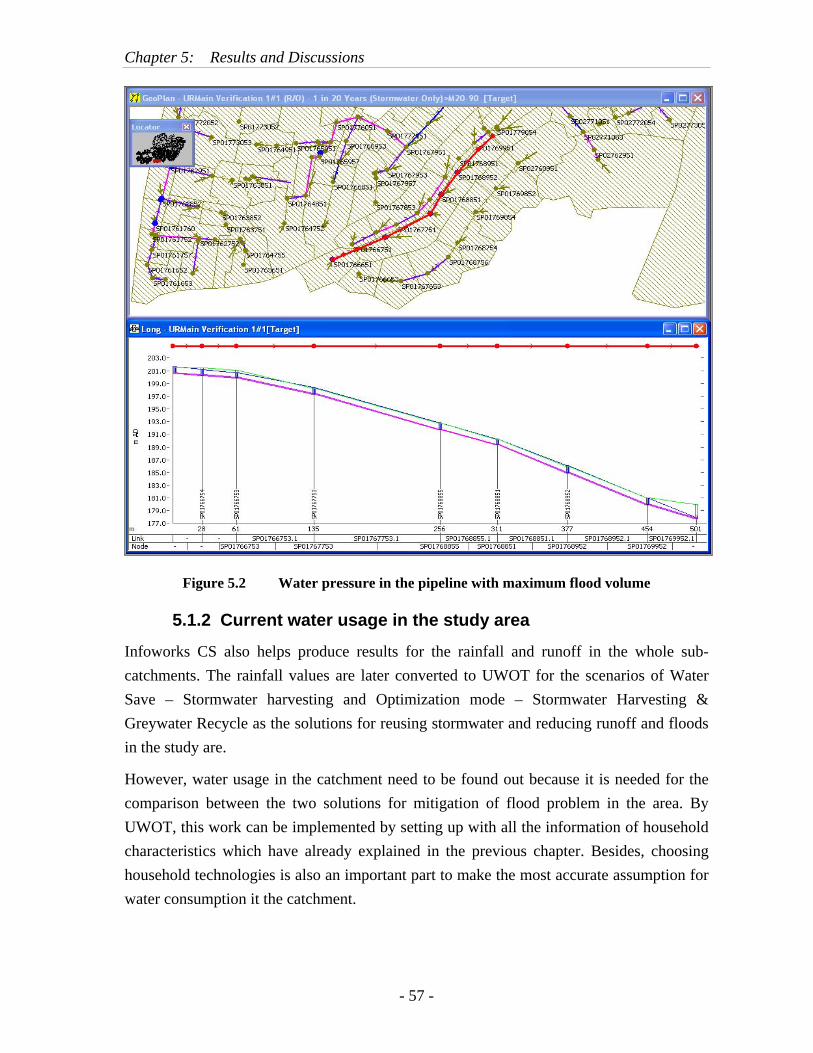
Chapter 5: Results and Discussions
- 57 -
Figure 5.2 Water pressure in the pipeline with maximum flood volume
5.1.2 Current water usage in the study area
Infoworks CS also helps produce results for the rainfall and runoff in the whole sub-catchments. The rainfall values are later converted to UWOT for the scenarios of Water Save – Stormwater harvesting and Optimization mode – Stormwater Harvesting & Greywater Recycle as the solutions for reusing stormwater and reducing runoff and floods in the study are.
However, water usage in the catchment need to be found out because it is needed for the comparison between the two solutions for mitigation of flood problem in the area. By UWOT, this work can be implemented by setting up with all the information of household characteristics which have already explained in the previous chapter. Besides, choosing household technologies is also an important part to make the most accurate assumption for water consumption it the catchment.
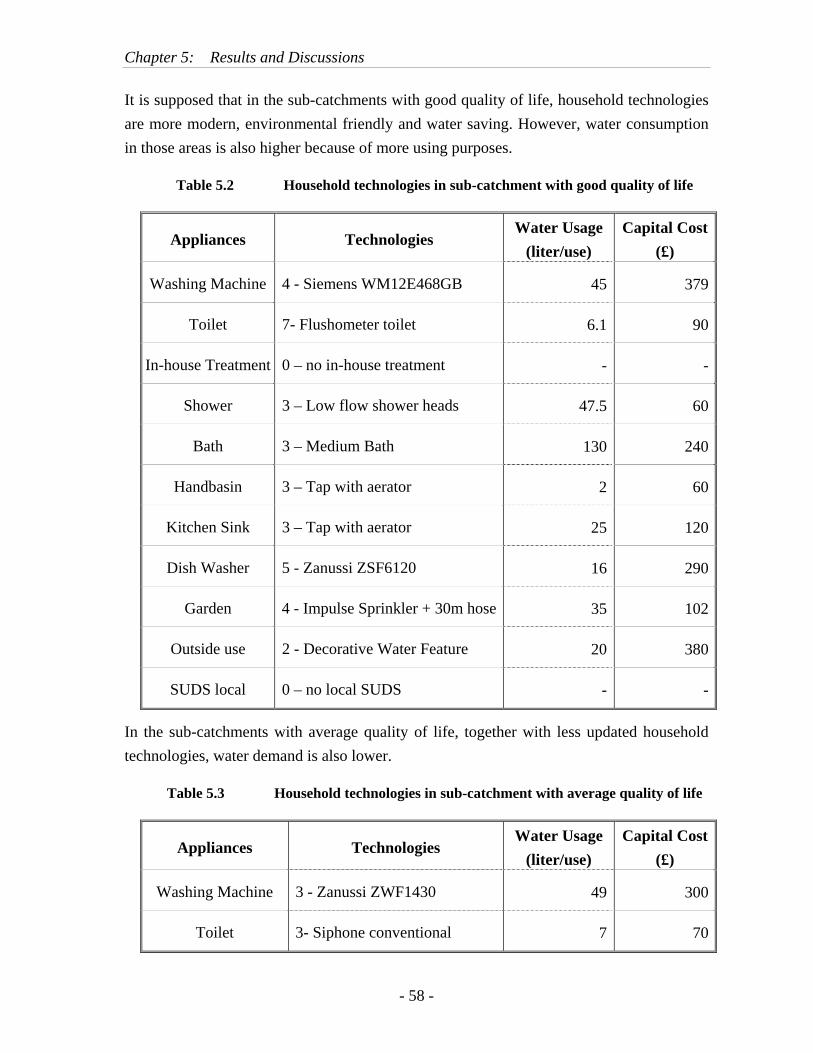
Chapter 5: Results and Discussions
- 58 -
It is supposed that in the sub-catchments with good quality of life, household technologies are more modern, environmental friendly and water saving. However, water consumption in those areas is also higher because of more using purposes.
Table 5.2 Household technologies in sub-catchment with good quality of life
Appliances Technologies Water Usage
(liter/use) Capital Cost
(£)
Washing Machine 4 - Siemens WM12E468GB 45 379
Toilet 7- Flushometer toilet 6.1 90
In-house Treatment 0 – no in-house treatment - -
Shower 3 – Low flow shower heads 47.5 60
Bath 3 – Medium Bath 130 240
Handbasin 3 – Tap with aerator 2 60
Kitchen Sink 3 – Tap with aerator 25 120
Dish Washer 5 - Zanussi ZSF6120 16 290
Garden 4 - Impulse Sprinkler + 30m hose 35 102
Outside use 2 - Decorative Water Feature 20 380
SUDS local 0 – no local SUDS - -
In the sub-catchments with average quality of life, together with less updated household technologies, water demand is also lower.
Table 5.3 Household technologies in sub-catchment with average quality of life
Appliances Technologies Water Usage
(liter/use) Capital Cost
(£)
Washing Machine 3 - Zanussi ZWF1430 49 300
Toilet 3- Siphone conventional 7 70

Chapter 5: Results and Discussions
- 59 -
In-house Treatment 0 – no in-house treatment - -
Shower 3 – Low flow shower heads 55 55
Bath 3 – Medium Bath 130 240
Handbasin 3 – Tap with aerator 2 60
Kitchen Sink 3 – Tap with aerator 25 120
Dish Washer 0 – no dish washer - -
Garden 3 - 30m Garden Hose Troley 10 30
Outside use 0 – no outside use - -
SUDS local 0 – no local SUDS - -
9095
100105110115120125
Assumption of Water Usage in Sub-Catchments
(litre/p/d) 122.70 102.85
Good quality of life indicator
Average quality of life indicator
Figure 5.3 Water usages at household level in the study area
5.2 Results for pipeline optimization by Infoworks CS The pipe upgrade method is done by replacing the old pipes and using the bigger ones for carrying stormwater. The manhole sizes are also considered.
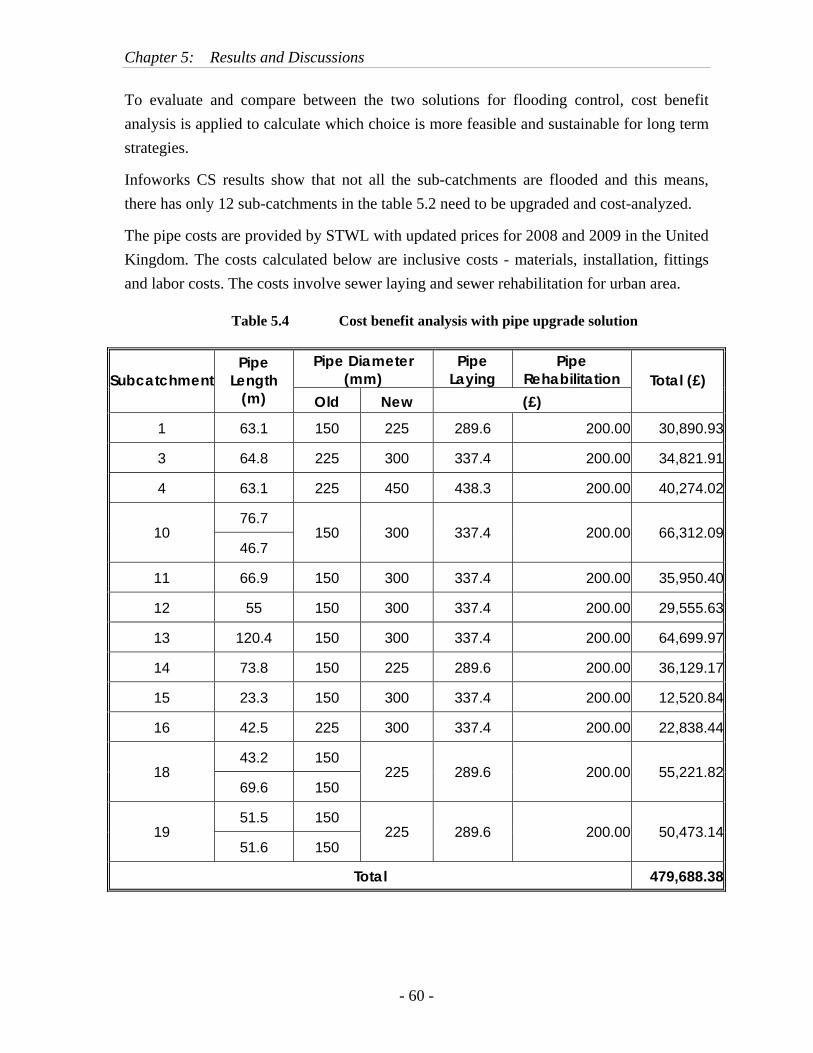
Chapter 5: Results and Discussions
- 60 -
To evaluate and compare between the two solutions for flooding control, cost benefit analysis is applied to calculate which choice is more feasible and sustainable for long term strategies.
Infoworks CS results show that not all the sub-catchments are flooded and this means, there has only 12 sub-catchments in the table 5.2 need to be upgraded and cost-analyzed.
The pipe costs are provided by STWL with updated prices for 2008 and 2009 in the United Kingdom. The costs calculated below are inclusive costs - materials, installation, fittings and labor costs. The costs involve sewer laying and sewer rehabilitation for urban area.
Table 5.4 Cost benefit analysis with pipe upgrade solution
Pipe Diameter (mm)
Pipe Laying
Pipe Rehabilitation Subcatchment
Pipe Length
(m) Old New (£) Total (£)
1 63.1 150 225 289.6 200.00 30,890.93
3 64.8 225 300 337.4 200.00 34,821.91
4 63.1 225 450 438.3 200.00 40,274.02
76.7 10
46.7 150 300 337.4 200.00 66,312.09
11 66.9 150 300 337.4 200.00 35,950.40
12 55 150 300 337.4 200.00 29,555.63
13 120.4 150 300 337.4 200.00 64,699.97
14 73.8 150 225 289.6 200.00 36,129.17
15 23.3 150 300 337.4 200.00 12,520.84
16 42.5 225 300 337.4 200.00 22,838.44
43.2 150 18
69.6 150 225 289.6 200.00 55,221.82
51.5 150 19
51.6 150 225 289.6 200.00 50,473.14
Total 479,688.38
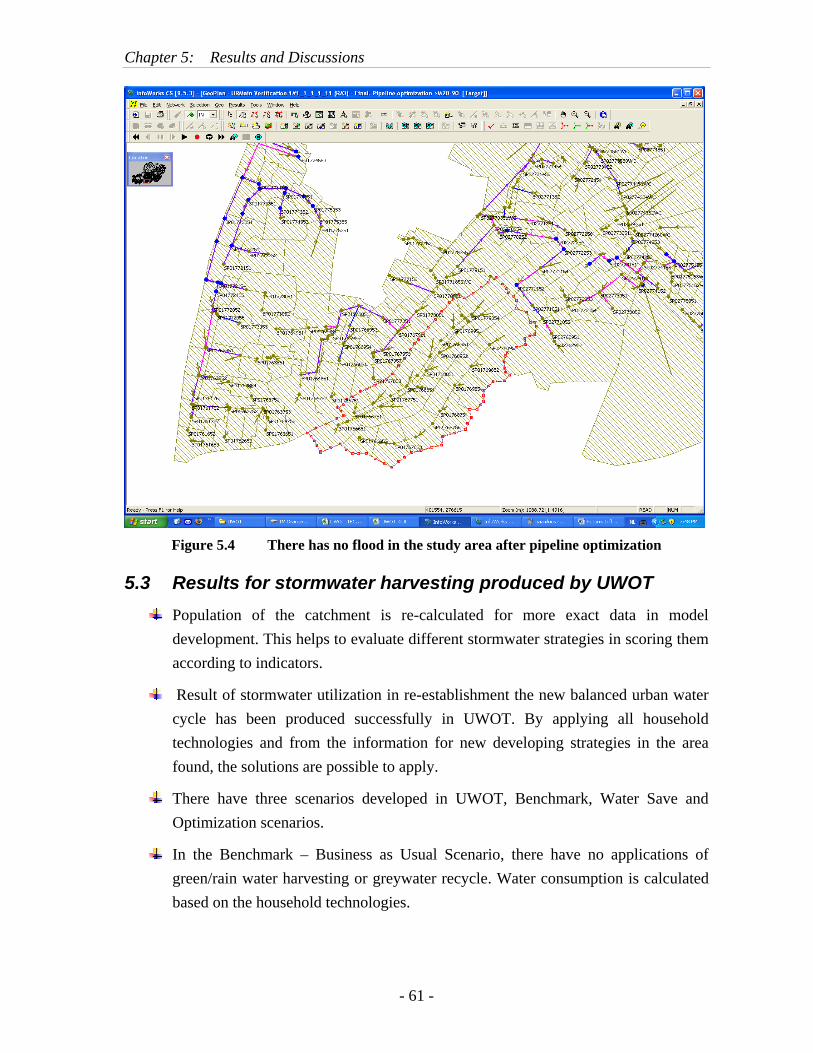
Chapter 5: Results and Discussions
- 61 -
Figure 5.4 There has no flood in the study area after pipeline optimization
5.3 Results for stormwater harvesting produced by UWOT Population of the catchment is re-calculated for more exact data in model
development. This helps to evaluate different stormwater strategies in scoring them according to indicators.
Result of stormwater utilization in re-establishment the new balanced urban water cycle has been produced successfully in UWOT. By applying all household technologies and from the information for new developing strategies in the area found, the solutions are possible to apply.
There have three scenarios developed in UWOT, Benchmark, Water Save and Optimization scenarios.
In the Benchmark – Business as Usual Scenario, there have no applications of green/rain water harvesting or greywater recycle. Water consumption is calculated based on the household technologies.
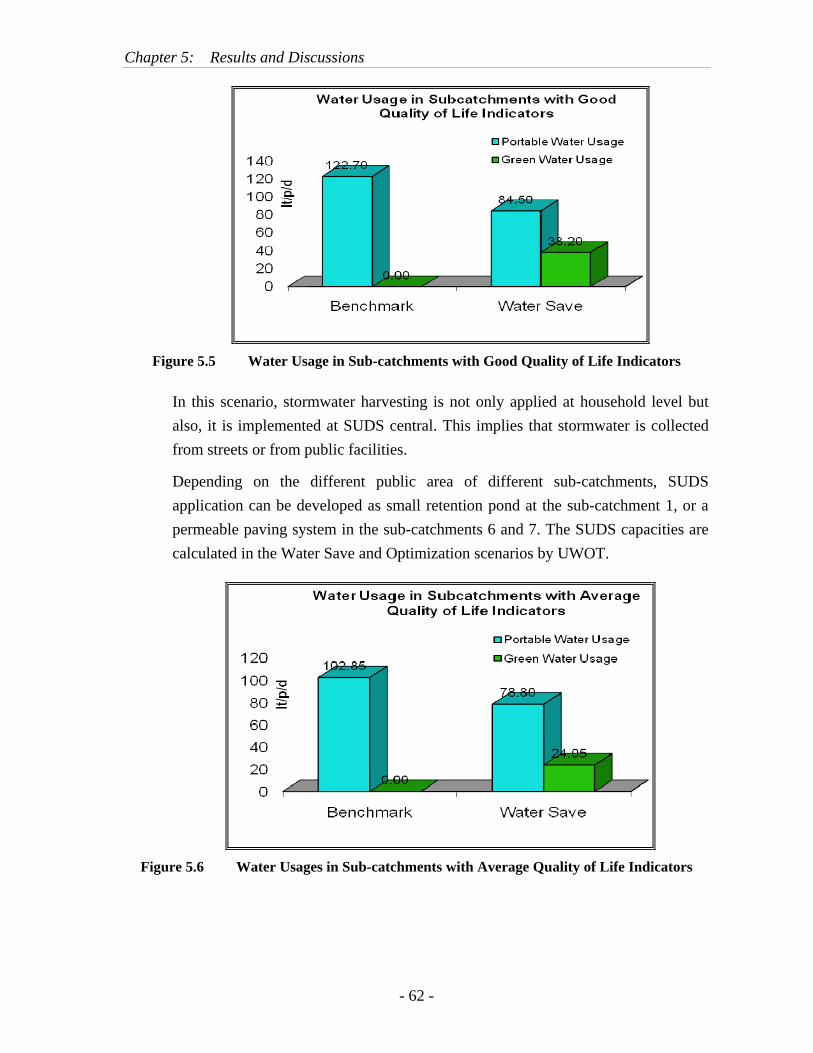
Chapter 5: Results and Discussions
- 62 -
Figure 5.5 Water Usage in Sub-catchments with Good Quality of Life Indicators
In this scenario, stormwater harvesting is not only applied at household level but also, it is implemented at SUDS central. This implies that stormwater is collected from streets or from public facilities.
Depending on the different public area of different sub-catchments, SUDS application can be developed as small retention pond at the sub-catchment 1, or a permeable paving system in the sub-catchments 6 and 7. The SUDS capacities are calculated in the Water Save and Optimization scenarios by UWOT.
Figure 5.6 Water Usages in Sub-catchments with Average Quality of Life Indicators
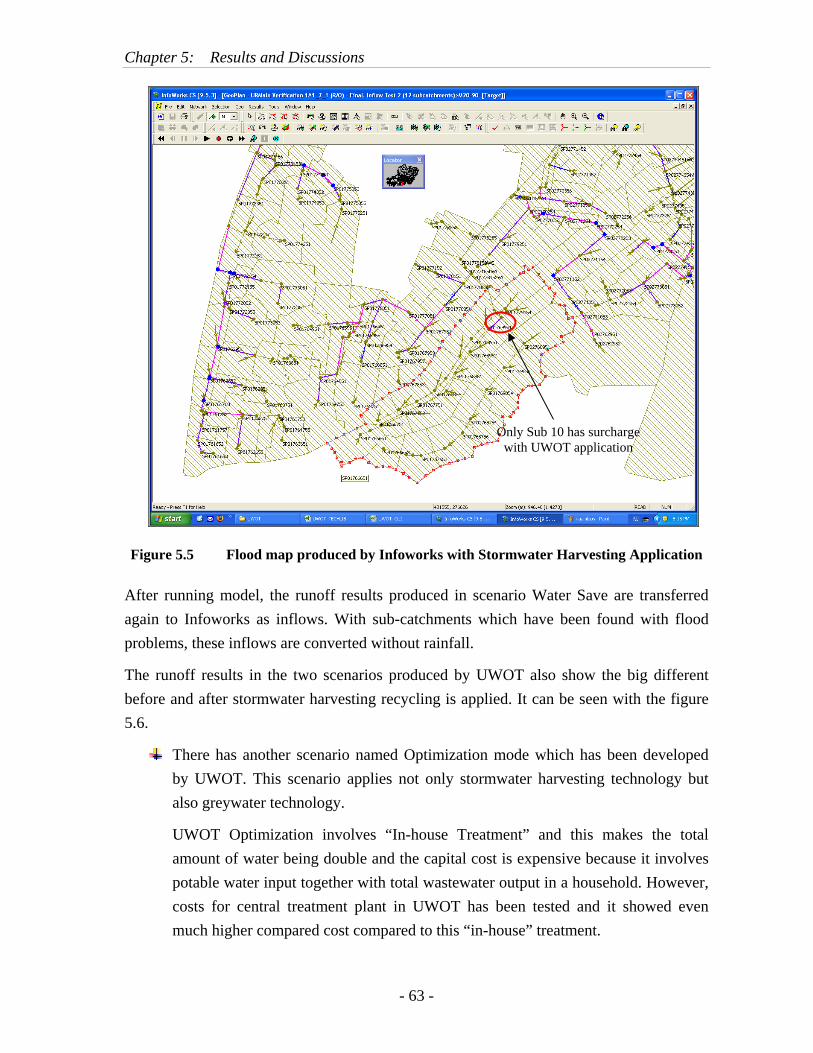
Chapter 5: Results and Discussions
- 63 -
Figure 5.5 Flood map produced by Infoworks with Stormwater Harvesting Application
After running model, the runoff results produced in scenario Water Save are transferred again to Infoworks as inflows. With sub-catchments which have been found with flood problems, these inflows are converted without rainfall.
The runoff results in the two scenarios produced by UWOT also show the big different before and after stormwater harvesting recycling is applied. It can be seen with the figure 5.6.
There has another scenario named Optimization mode which has been developed by UWOT. This scenario applies not only stormwater harvesting technology but also greywater technology.
UWOT Optimization involves “In-house Treatment” and this makes the total amount of water being double and the capital cost is expensive because it involves potable water input together with total wastewater output in a household. However, costs for central treatment plant in UWOT has been tested and it showed even much higher compared cost compared to this “in-house” treatment.
Only Sub 10 has surcharge with UWOT application
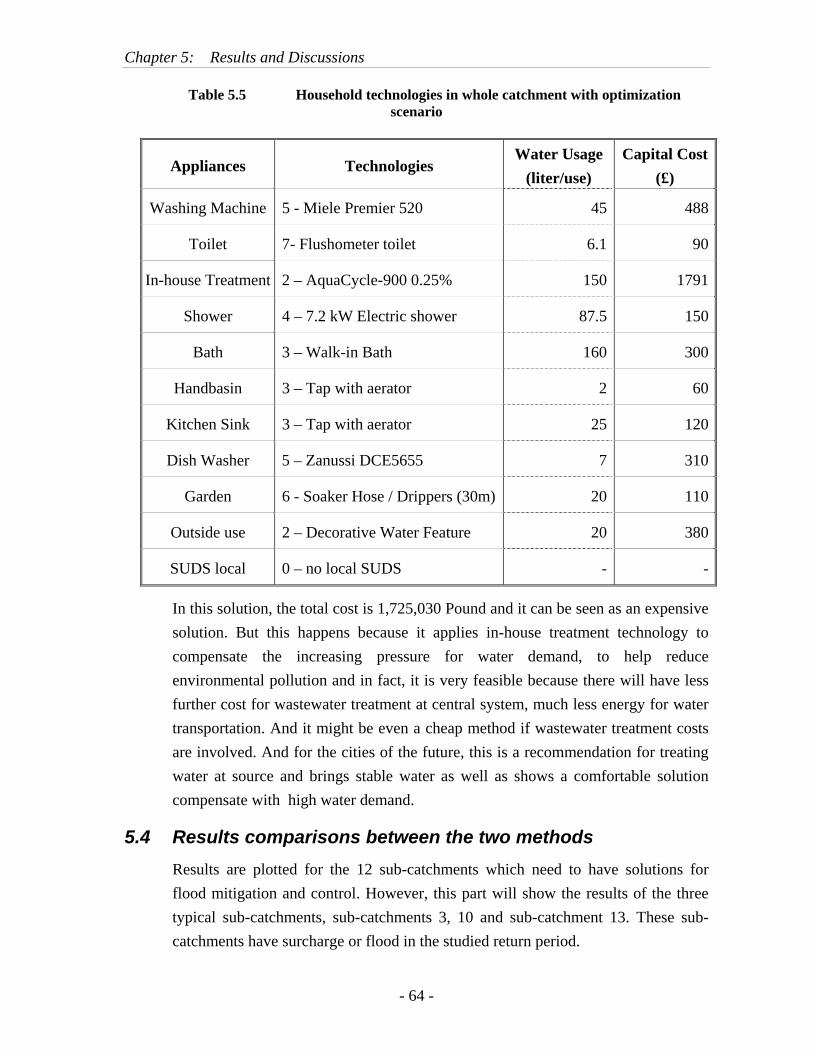
Chapter 5: Results and Discussions
- 64 -
Table 5.5 Household technologies in whole catchment with optimization scenario
Appliances Technologies Water Usage
(liter/use) Capital Cost
(£)
Washing Machine 5 - Miele Premier 520 45 488
Toilet 7- Flushometer toilet 6.1 90
In-house Treatment 2 – AquaCycle-900 0.25% 150 1791
Shower 4 – 7.2 kW Electric shower 87.5 150
Bath 3 – Walk-in Bath 160 300
Handbasin 3 – Tap with aerator 2 60
Kitchen Sink 3 – Tap with aerator 25 120
Dish Washer 5 – Zanussi DCE5655 7 310
Garden 6 - Soaker Hose / Drippers (30m) 20 110
Outside use 2 – Decorative Water Feature 20 380
SUDS local 0 – no local SUDS - -
In this solution, the total cost is 1,725,030 Pound and it can be seen as an expensive solution. But this happens because it applies in-house treatment technology to compensate the increasing pressure for water demand, to help reduce environmental pollution and in fact, it is very feasible because there will have less further cost for wastewater treatment at central system, much less energy for water transportation. And it might be even a cheap method if wastewater treatment costs are involved. And for the cities of the future, this is a recommendation for treating water at source and brings stable water as well as shows a comfortable solution compensate with high water demand.
5.4 Results comparisons between the two methods Results are plotted for the 12 sub-catchments which need to have solutions for flood mitigation and control. However, this part will show the results of the three typical sub-catchments, sub-catchments 3, 10 and sub-catchment 13. These sub-catchments have surcharge or flood in the studied return period.
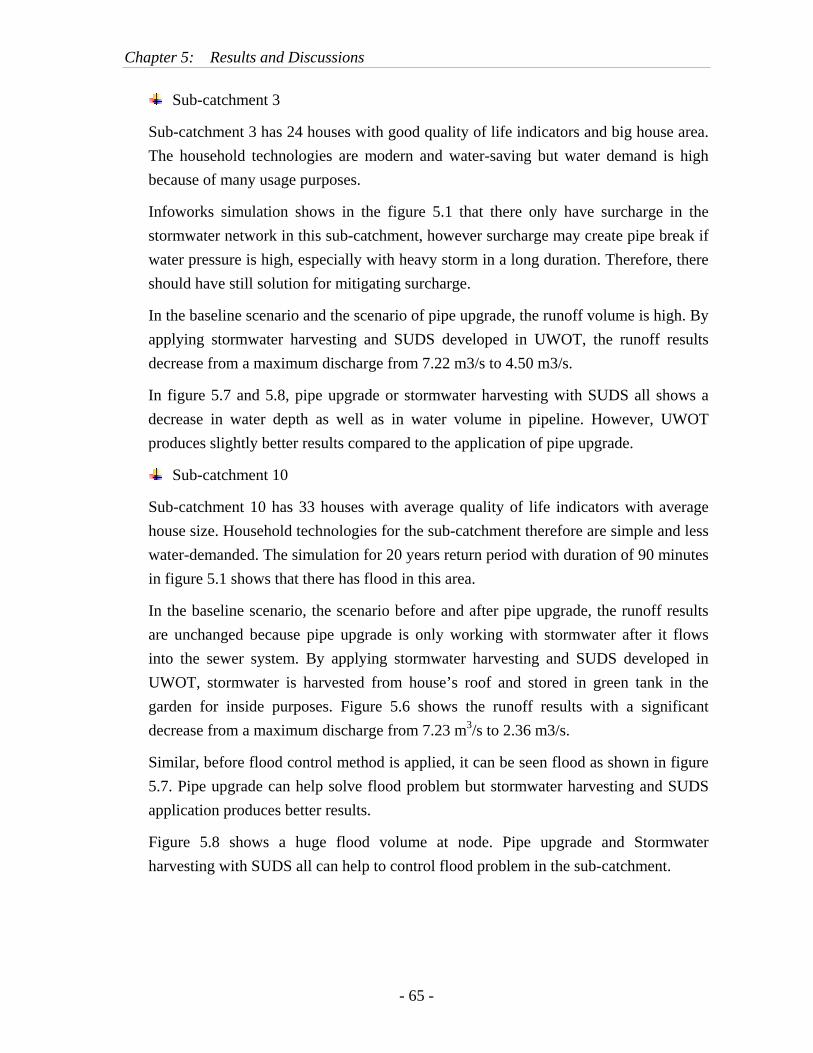
Chapter 5: Results and Discussions
- 65 -
Sub-catchment 3
Sub-catchment 3 has 24 houses with good quality of life indicators and big house area. The household technologies are modern and water-saving but water demand is high because of many usage purposes.
Infoworks simulation shows in the figure 5.1 that there only have surcharge in the stormwater network in this sub-catchment, however surcharge may create pipe break if water pressure is high, especially with heavy storm in a long duration. Therefore, there should have still solution for mitigating surcharge.
In the baseline scenario and the scenario of pipe upgrade, the runoff volume is high. By applying stormwater harvesting and SUDS developed in UWOT, the runoff results decrease from a maximum discharge from 7.22 m3/s to 4.50 m3/s.
In figure 5.7 and 5.8, pipe upgrade or stormwater harvesting with SUDS all shows a decrease in water depth as well as in water volume in pipeline. However, UWOT produces slightly better results compared to the application of pipe upgrade.
Sub-catchment 10
Sub-catchment 10 has 33 houses with average quality of life indicators with average house size. Household technologies for the sub-catchment therefore are simple and less water-demanded. The simulation for 20 years return period with duration of 90 minutes in figure 5.1 shows that there has flood in this area.
In the baseline scenario, the scenario before and after pipe upgrade, the runoff results are unchanged because pipe upgrade is only working with stormwater after it flows into the sewer system. By applying stormwater harvesting and SUDS developed in UWOT, stormwater is harvested from house’s roof and stored in green tank in the garden for inside purposes. Figure 5.6 shows the runoff results with a significant decrease from a maximum discharge from 7.23 m3/s to 2.36 m3/s.
Similar, before flood control method is applied, it can be seen flood as shown in figure 5.7. Pipe upgrade can help solve flood problem but stormwater harvesting and SUDS application produces better results.
Figure 5.8 shows a huge flood volume at node. Pipe upgrade and Stormwater harvesting with SUDS all can help to control flood problem in the sub-catchment.
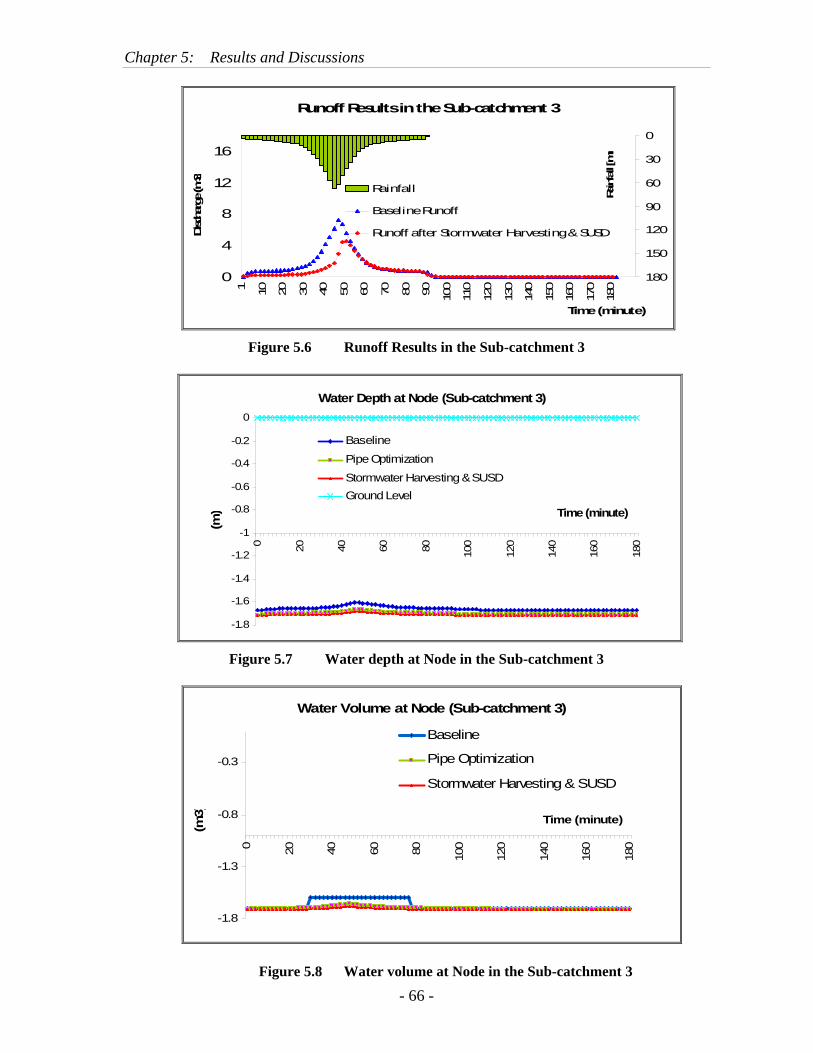
Chapter 5: Results and Discussions
- 66 -
Runoff Results in the Sub-catchment 3
0
4
8
12
16
1 10 20 30 40 50 60 70 80 90 100
110
120
130
140
150
160
170
180
Time (minute)
Discha
rge (m
3/
0
30
60
90
120
150
180
Rainfall [m
m
Rainfall
Baseline Runoff
Runoff after Stormwater Harvesting & SUSD
Figure 5.6 Runoff Results in the Sub-catchment 3
Water Depth at Node (Sub-catchment 3)
-1.8
-1.6
-1.4
-1.2
-1
-0.8
-0.6
-0.4
-0.2
0
0 20 40 60 80 100
120
140
160
180
Time (minute)
(m)
Baseline
Pipe Optimization
Stormwater Harvesting & SUSDGround Level
Figure 5.7 Water depth at Node in the Sub-catchment 3
Water Volume at Node (Sub-catchment 3)
-1.8
-1.3
-0.8
-0.3
0 20 40 60 80 100
120
140
160
180
Time (minute)
(m3)
Baseline
Pipe Optimization
Stormwater Harvesting & SUSD
Figure 5.8 Water volume at Node in the Sub-catchment 3
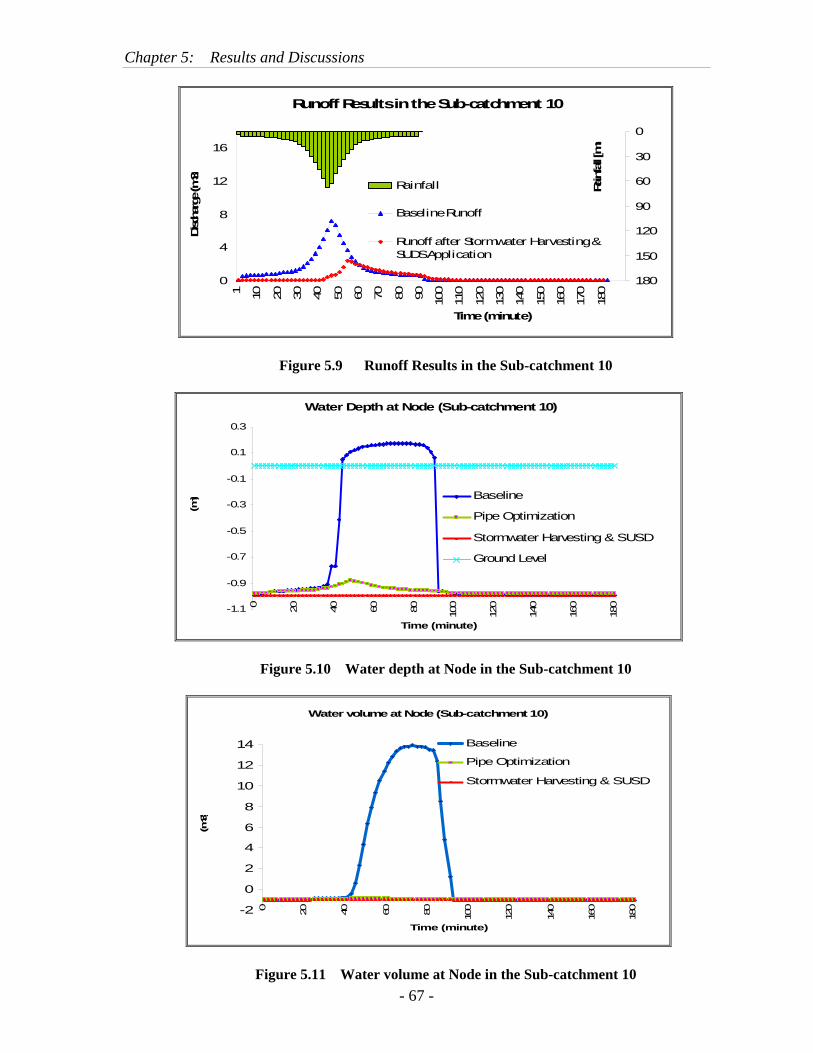
Chapter 5: Results and Discussions
- 67 -
Runoff Results in the Sub-catchment 10
0
4
8
12
16
1 10 20 30 40 50 60 70 80 90 100
110
120
130
140
150
160
170
180
Time (minute)
Discha
rge (m
3/
0
30
60
90
120
150
180
Rainfall [m
m
Rainfall
Baseline Runoff
Runoff after Stormwater Harvesting &SUDS Application
Figure 5.9 Runoff Results in the Sub-catchment 10
Water Depth at Node (Sub-catchment 10)
-1.1
-0.9
-0.7
-0.5
-0.3
-0.1
0.1
0.3
0 20 40 60 80 100
120
140
160
180
Time (minute)
(m) Baseline
Pipe Optimization
Stormwater Harvesting & SUSD
Ground Level
Figure 5.10 Water depth at Node in the Sub-catchment 10
Water volume at Node (Sub-catchment 10)
-2
0
2
4
6
8
10
12
14
0 20 40 60 80 100
120
140
160
180
Time (minute)
(m3)
Baseline
Pipe Optimization
Stormwater Harvesting & SUSD
Figure 5.11 Water volume at Node in the Sub-catchment 10

Chapter 5: Results and Discussions
- 68 -
Runoff Results in the Sub-catchment 13
0
4
8
12
16
1 10 20 30 40 50 60 70 80 90 100
110
120
130
140
150
160
170
180
Time (minute)
Discha
rge (m
3/
0
30
60
90
120
150
180
Rainfall [
mm
Rainfall
Baseline Runoff
Runoff after StormwaterHarvesting & SUSD Application
Figure 5.12 Runoff Results in the Sub-catchment 13
Water Depth at Node (Sub-catchment 13)
-1.1
-0.7
-0.3
0.1
0 20 40 60 80 100
120
140
160
180
Time (minute)
(m)
BaselinePipe OptimizationStormwater Harvesting & SUSDGround Level
Figure 5.13 Water depth at Node in the Sub-catchment 13
Water Volume at Node (Sub-catchment 13)
-1
0
1
2
3
4
5
6
0 20 40 60 80 100
120
140
160
180
Time (minute)
Wat
er V
olum
e (m Baseline
Pipe Optimization
Stormwater Harvesting & SUSD
Figure 5.14 Water volume at Node in the Sub-catchment 13

Chapter 5: Results and Discussions
- 69 -
Sub-catchment 13
Sub-catchment 13 has 26 houses with good quality of life indicators and bigger house area therefore household technologies are more modern although with less water usage but water demand is higher because of more purposes. Infoworks simulation also shows that there has flood in this area.
In the baseline scenario and the scenario of pipe upgrade, the runoff volume is high. By applying stormwater harvesting and SUDSs developed in UWOT, the runoff results decrease from a maximum discharge from 6.34 m3/s to 2.39 m3/s.
In figure 5.10, before flood control method is applied, the sub-catchment is flooded. In this sub-catchment, the stormwater harvesting and SUSs application still produces better results compared to pipe upgrade method.
Figure 5.11 also shows a huge flood volume at node. Pipe upgrade and Stormwater harvesting with SUDs all help to control flood problem in the sub-catchment however, stormwater harvesting is more effective to reduce flood volume.
5.5 Policy making by mDSS4 for the two methods In UWOT, many indicators have been developed for assessing stormwater harvesting, greywater recycling with SUDs to clarify to which objectives are achieved. If the stormwater harvesting with modern household technologies are applied, whether or not it receives social acceptability or shows high reliability of technological development.
However, there has no measure in Infoworks CS to score the pipe upgrade method ifit meets criteria for urban water sustainability. Therefore pipe upgrade and stormwater harvesting with SUDS are scored by mDSS4 to assist decision makers exploring the most possible solution.
Results of different indicators developed from the two methods above are transferred to mDSS4. There have many indicators which have been developed as shown in Table 3.3, however this thesis lack information and data for several indicators, therefore, there have only indicators with identified values are further developed in analysis matrix.
In the next step, cost type is chosen as standardized option for evaluation matrix because the higher value, the lower the score. For example, the total stormwater volume produced by pip upgrade method is 479.19 whilst total storm water volume after SUDS and stormwater harvesting application is 306.92, then the second solution receives the higher mark by decision makers.
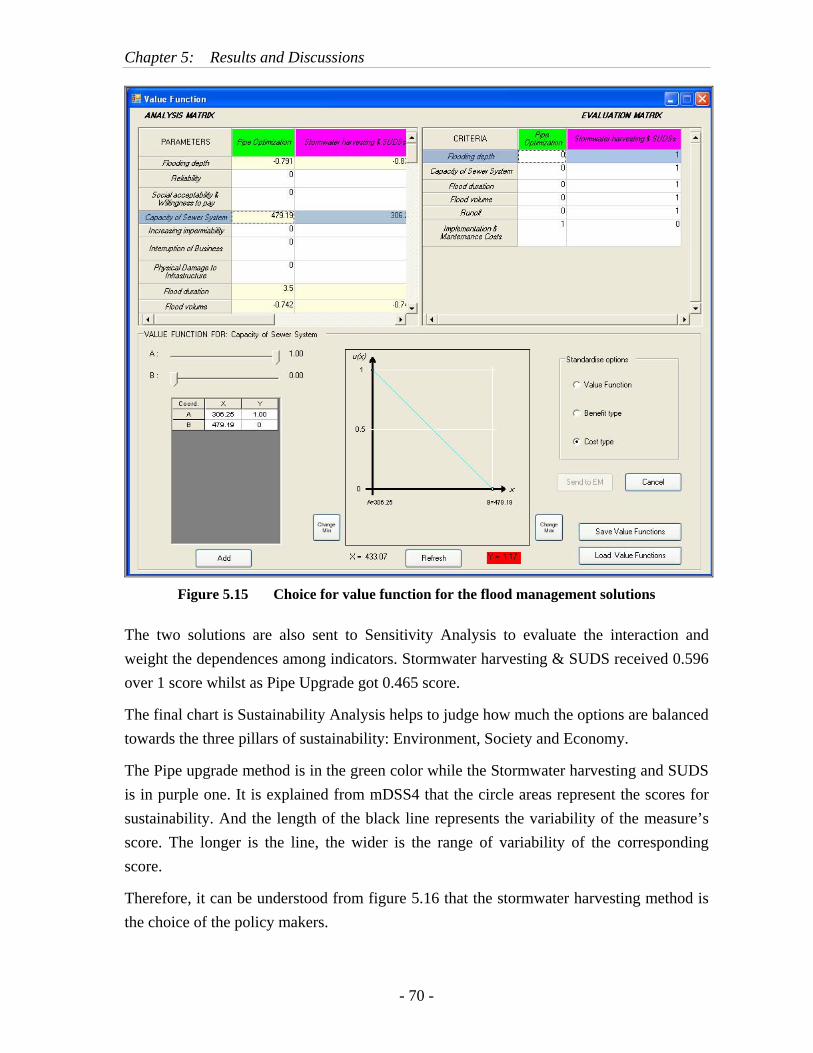
Chapter 5: Results and Discussions
- 70 -
Figure 5.15 Choice for value function for the flood management solutions
The two solutions are also sent to Sensitivity Analysis to evaluate the interaction and weight the dependences among indicators. Stormwater harvesting & SUDS received 0.596 over 1 score whilst as Pipe Upgrade got 0.465 score.
The final chart is Sustainability Analysis helps to judge how much the options are balanced towards the three pillars of sustainability: Environment, Society and Economy.
The Pipe upgrade method is in the green color while the Stormwater harvesting and SUDS is in purple one. It is explained from mDSS4 that the circle areas represent the scores for sustainability. And the length of the black line represents the variability of the measure’s score. The longer is the line, the wider is the range of variability of the corresponding score.
Therefore, it can be understood from figure 5.16 that the stormwater harvesting method is the choice of the policy makers.

Chapter 5: Results and Discussions
- 71 -
Figure 5.16 Sustainability Analysis of the two solutions
5.6 Discussions Rainfall data: Rainfall was measured three times at gauging stations in 2001 and
this data was used to build up the return periods in Infoworks CS model. However, it is stated that due to the impacts of climate changes and urbanization in the region, rainfall amount has been much more frequent and higher recently. And therefore the area might have been more seriously flooded.
UWOT Assessment mode is not updated compared the newer version therefore the results are not fully satisfied because household technologies are limited and related costs are different recently.
Indicators such as potable water demand, green water use, and social acceptability, willingness to pay or reliability are unchanged among good sub-catchments or among average sub-catchments because household technologies were the same. The differences are among runoff results, energy use, operational and capital cost because those depend on impervious and pervious area, population, house size and quality of life (Annex 2)
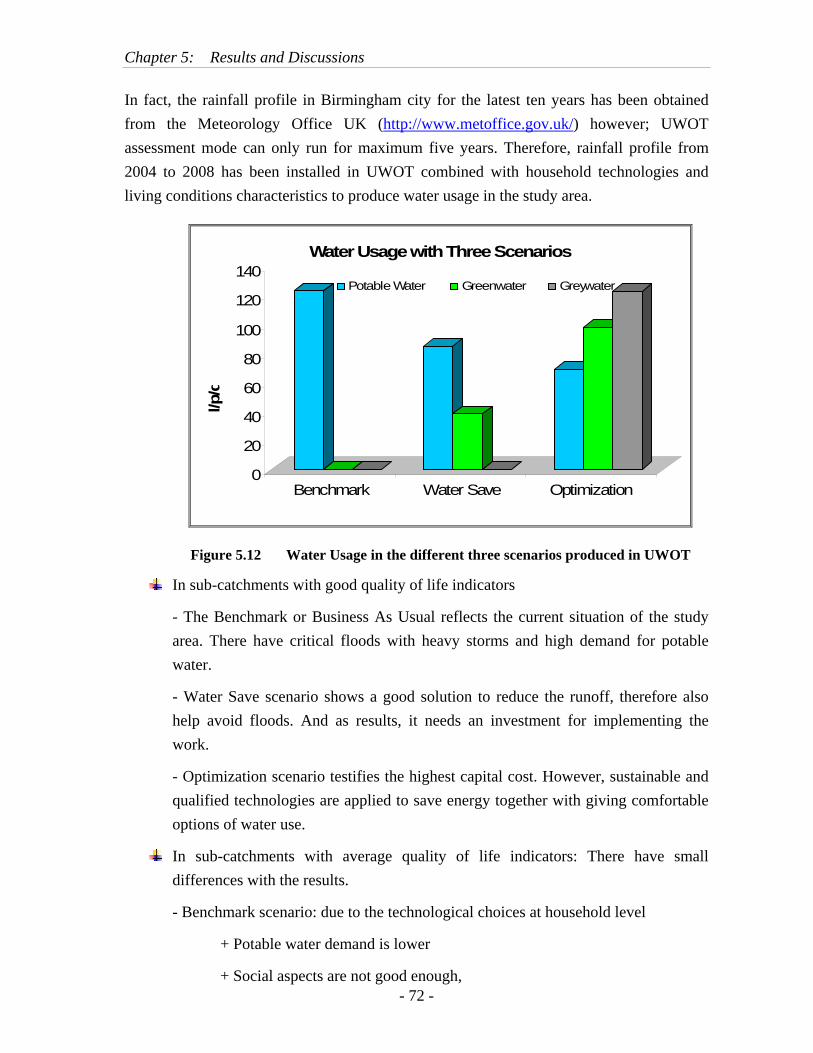
Chapter 5: Results and Discussions
- 72 -
In fact, the rainfall profile in Birmingham city for the latest ten years has been obtained from the Meteorology Office UK (http://www.metoffice.gov.uk/) however; UWOT assessment mode can only run for maximum five years. Therefore, rainfall profile from 2004 to 2008 has been installed in UWOT combined with household technologies and living conditions characteristics to produce water usage in the study area.
0
20
40
60
80
100
120
140
l/p/d
Benchmark Water Save Optimization
Water Usage with Three Scenarios
Potable Water Greenwater Greywater
Figure 5.12 Water Usage in the different three scenarios produced in UWOT
In sub-catchments with good quality of life indicators
- The Benchmark or Business As Usual reflects the current situation of the study area. There have critical floods with heavy storms and high demand for potable water.
- Water Save scenario shows a good solution to reduce the runoff, therefore also help avoid floods. And as results, it needs an investment for implementing the work.
- Optimization scenario testifies the highest capital cost. However, sustainable and qualified technologies are applied to save energy together with giving comfortable options of water use.
In sub-catchments with average quality of life indicators: There have small differences with the results.
- Benchmark scenario: due to the technological choices at household level
+ Potable water demand is lower
+ Social aspects are not good enough,

Chapter 5: Results and Discussions
- 73 -
- Water Save scenario: Runoff results are much lower, energy is not increased but social aspects have not yet satisfied because household technologies for storm water harvesting is not much innovative.
- Optimization scenario: Improvements are shown for results of stormwater harvesting and although the capital cost is huge, energy is slighter higher but willingness to pay and reliability together with social acceptability are all improved.
By converting the rainfall values from Infoworks model, runoff results in all sub-catchment are produced in UWOT. The total cost for stormwater harvesting & SUDS with green tank application (Water Save scenario) and stormwater and grey water recycling (Optimization Scenario) are all calculated by UWOT.
Table 5.6 Total costs of the different methods for flood control
Solutions Total Costs
Pipe upgrade 479,688
Stormwater Harvesting & SUDs 524,666
Stormwater Harvesting, SUDs & Grey Water Recycling 1,725,030
This thesis has also tested with application of Water Save scenario (stormwater harvesting with green tank technology) for the whole 20 sub-catchments in the study area. The total cost is 986,726 Pound (calculated from Annex 2). If the inhabitants in the sub-catchments where floods do not occur are willing to apply this technology, the innovative solution can be reachable.
Not all the sub-catchments need to be upgraded the stormwater network because there have a few places without flooding. However, for sustainable and integrated solutions, it is still recommended to have to Optimization scenario with high water usage efficiency, flexible and comfortable supply.
Chapter 6: Conclusions & Recommendations
- 74 -
CHAPTER 6 CONCLUSIONS & RECOMMENDATIONS
6.1 Conclusions Infoworks CS has successfully helped to produced flood map and flood risk
information based on the model data in the study area.
Stormwater system was built up in 2001 but information about the major changes of the network has not been provided.
UWOT is a new but creative model involving indicators and criteria which are supportive for making decision in household technologies.
Together with conventional method of upgrading sewer pipe for flood mitigation, stormwater harvesting helps reduce flooding more effectively.
Compared to Pipe upgrade method to solve flood problem, Stormwater harvesting and SUDS not only help reduce runoff and negative impacts of flooding in a more sustainable way but also help provide valuable resource to satisfy water usage, which is becoming more critical because of the new developments in cities.
Toward a sustainable flood control and management, stormwater harvesting and SUDS have indicated as an innovative solution. Although this solution shows a higher cost for implementation, it should be still consider as a better method for the city of the future.
Pipe upgrade is still an applicable method for solving flood problem, especially in region with high density of population which has no or less space for building up green tank and grey tank for direct water usage.
mDSS4 is a good decision support tool to help decision makers to evaluate different options for environmental management. It can be applied for urban flooding to find a compromise on a common set of solutions.
The thesis has been developed to provide the solutions of flood control and management to meet the European Water Frame Work Directive 2007/60/EC which has been mentioned in chapter 2.
Moreover, the work has also been developed as an effective tool for technical, financial and political decisions regarding flood risk management.
6.2 Recommendations Due to the delay of data collection and model set-up, calibration has not been done.
It is recommended to have further work for more accurate results.
Chapter 6: Conclusions & Recommendations
- 75 -
The thesis work lacks information and data of climate change impact. Under the impact of this issue, there had many more floods and heavy rain in the United Kingdom. If the issue is involved, the result will be more appropriate and meaningful.
mDSS4 can be a very effective support tool if more information related to environmental conditions is provided. The results produced can be more accurate and help decision makers have right choices.
The report “Making Space for Water” which had been developed in the Upper Rea catchment shows that evidence of current approach is not enough for managing the stormwater which leads to several floods in the area. Therefore, these thesis results provide further consideration toward a sustainable and innovative ways of using stormwater as a valuable resource.
Indicators for flood mitigations are developed for comparing the two solutions of stormwater harvesting with SUDS and pipe upgrade. However, there have other solution such as using green roof but it might be for the further work.
The thesis development has involved conventional and updated methods for solving flood problem. This work can be helpful for other cities of SWITCH project as good reference of using stormwater as the valuable source as well as a consideration for innovative solution.
UWOT and SUDS have not yet been widely adopted. The treatment qualities developed in assessment mode of UWOT is still general without providing related standards. There should have more research and further developments for the model.
There should also have more brochures, information and better guidance to be approached by inhabitants with the UWOT development. This innovative method can be reachable, easy to implement and feasible to apply.
For the perspective of “the city of the future”, an optimization scenario of UWOT should be considered. The optimization can handle multi-objective problems through weighting. This scenario shows higher net present value for flooding mitigation but if wastewater treatment prices are involved, this is a very feasible solution. Moreover Optimization scenario shows more sustainable water management and is more environmental-friendly.
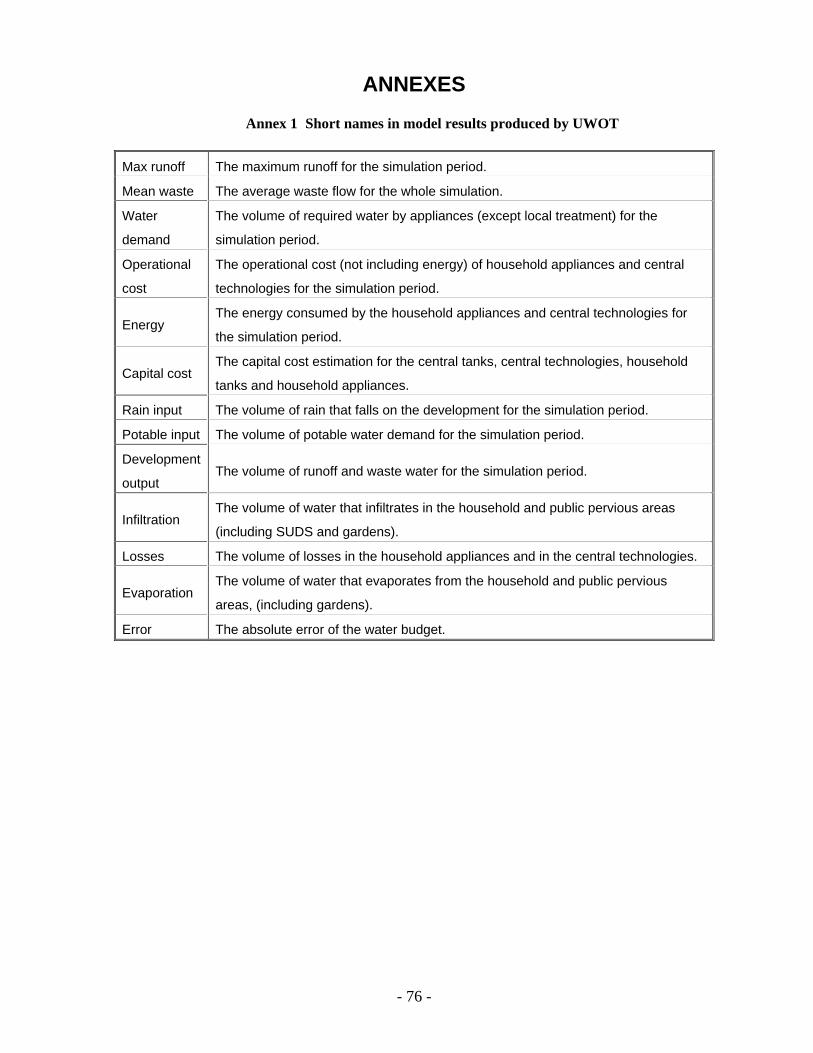
- 76 -
ANNEXES Annex 1 Short names in model results produced by UWOT
Max runoff The maximum runoff for the simulation period.
Mean waste The average waste flow for the whole simulation.
Water
demand
The volume of required water by appliances (except local treatment) for the
simulation period.
Operational
cost
The operational cost (not including energy) of household appliances and central
technologies for the simulation period.
Energy The energy consumed by the household appliances and central technologies for
the simulation period.
Capital cost The capital cost estimation for the central tanks, central technologies, household
tanks and household appliances.
Rain input The volume of rain that falls on the development for the simulation period.
Potable input The volume of potable water demand for the simulation period.
Development
output The volume of runoff and waste water for the simulation period.
Infiltration The volume of water that infiltrates in the household and public pervious areas
(including SUDS and gardens).
Losses The volume of losses in the household appliances and in the central technologies.
Evaporation The volume of water that evaporates from the household and public pervious
areas, (including gardens).
Error The absolute error of the water budget.
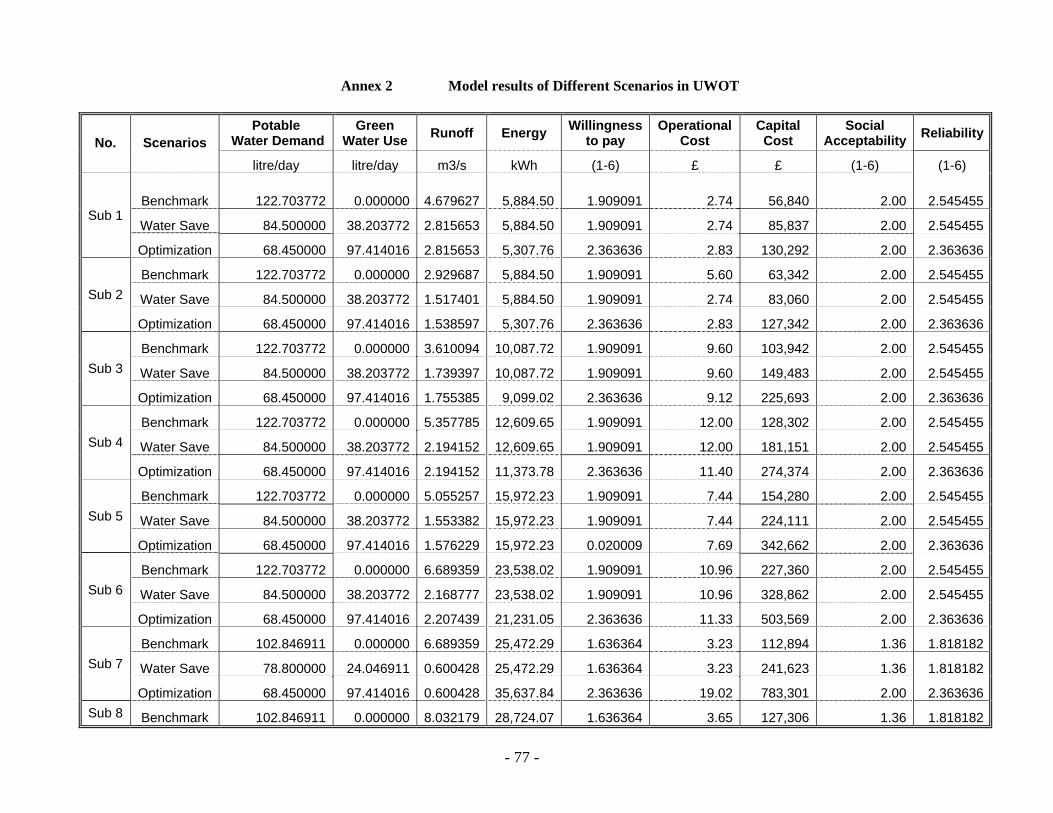
- 77 -
Annex 2 Model results of Different Scenarios in UWOT
Potable Water Demand
Green Water Use Runoff Energy Willingness
to pay Operational
Cost Capital
Cost Social
Acceptability Reliability No. Scenarios
litre/day litre/day m3/s kWh (1-6) £ £ (1-6) (1-6)
Benchmark 122.703772 0.000000 4.679627 5,884.50 1.909091 2.74 56,840 2.00 2.545455
Water Save 84.500000 38.203772 2.815653 5,884.50 1.909091 2.74 85,837 2.00 2.545455 Sub 1
Optimization 68.450000 97.414016 2.815653 5,307.76 2.363636 2.83 130,292 2.00 2.363636
Benchmark 122.703772 0.000000 2.929687 5,884.50 1.909091 5.60 63,342 2.00 2.545455
Water Save 84.500000 38.203772 1.517401 5,884.50 1.909091 2.74 83,060 2.00 2.545455 Sub 2
Optimization 68.450000 97.414016 1.538597 5,307.76 2.363636 2.83 127,342 2.00 2.363636
Benchmark 122.703772 0.000000 3.610094 10,087.72 1.909091 9.60 103,942 2.00 2.545455
Water Save 84.500000 38.203772 1.739397 10,087.72 1.909091 9.60 149,483 2.00 2.545455 Sub 3
Optimization 68.450000 97.414016 1.755385 9,099.02 2.363636 9.12 225,693 2.00 2.363636
Benchmark 122.703772 0.000000 5.357785 12,609.65 1.909091 12.00 128,302 2.00 2.545455
Water Save 84.500000 38.203772 2.194152 12,609.65 1.909091 12.00 181,151 2.00 2.545455 Sub 4
Optimization 68.450000 97.414016 2.194152 11,373.78 2.363636 11.40 274,374 2.00 2.363636
Benchmark 122.703772 0.000000 5.055257 15,972.23 1.909091 7.44 154,280 2.00 2.545455
Water Save 84.500000 38.203772 1.553382 15,972.23 1.909091 7.44 224,111 2.00 2.545455 Sub 5
Optimization 68.450000 97.414016 1.576229 15,972.23 0.020009 7.69 342,662 2.00 2.363636
Benchmark 122.703772 0.000000 6.689359 23,538.02 1.909091 10.96 227,360 2.00 2.545455
Water Save 84.500000 38.203772 2.168777 23,538.02 1.909091 10.96 328,862 2.00 2.545455 Sub 6
Optimization 68.450000 97.414016 2.207439 21,231.05 2.363636 11.33 503,569 2.00 2.363636
Benchmark 102.846911 0.000000 6.689359 25,472.29 1.636364 3.23 112,894 1.36 1.818182
Water Save 78.800000 24.046911 0.600428 25,472.29 1.636364 3.23 241,623 1.36 1.818182 Sub 7
Optimization 68.450000 97.414016 0.600428 35,637.84 2.363636 19.02 783,301 2.00 2.363636 Sub 8 Benchmark 102.846911 0.000000 8.032179 28,724.07 1.636364 3.65 127,306 1.36 1.818182
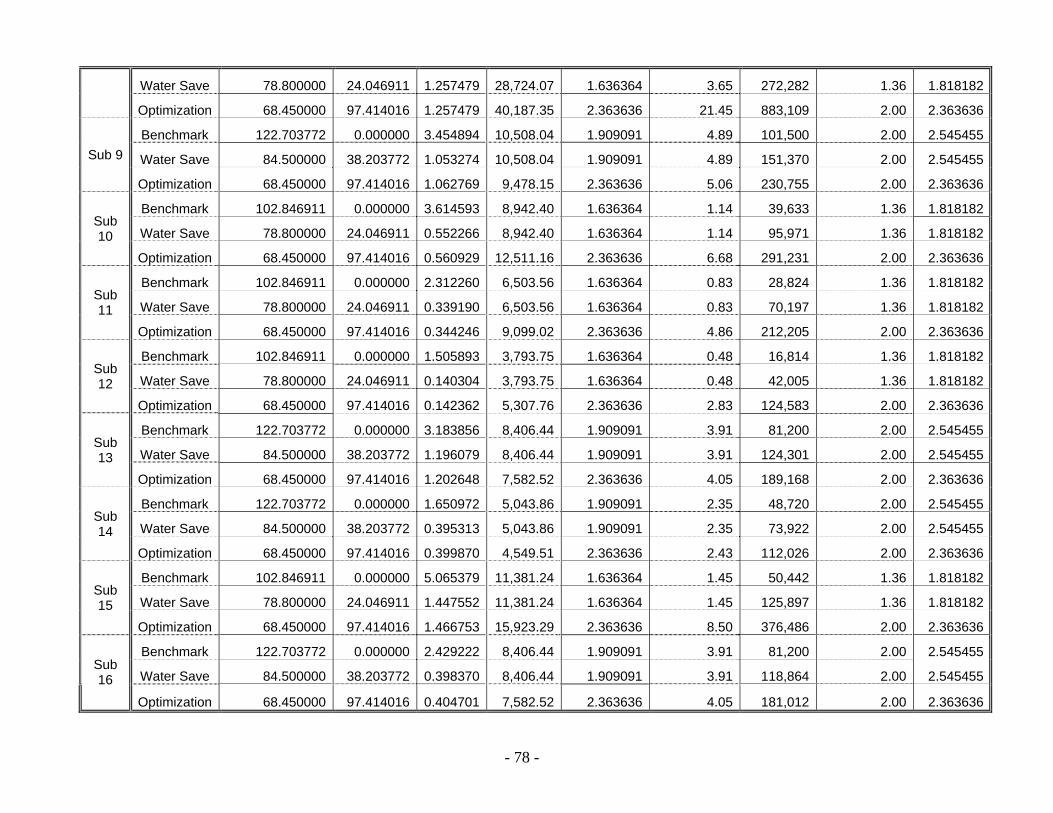
- 78 -
Water Save 78.800000 24.046911 1.257479 28,724.07 1.636364 3.65 272,282 1.36 1.818182
Optimization 68.450000 97.414016 1.257479 40,187.35 2.363636 21.45 883,109 2.00 2.363636
Benchmark 122.703772 0.000000 3.454894 10,508.04 1.909091 4.89 101,500 2.00 2.545455
Water Save 84.500000 38.203772 1.053274 10,508.04 1.909091 4.89 151,370 2.00 2.545455 Sub 9
Optimization 68.450000 97.414016 1.062769 9,478.15 2.363636 5.06 230,755 2.00 2.363636
Benchmark 102.846911 0.000000 3.614593 8,942.40 1.636364 1.14 39,633 1.36 1.818182
Water Save 78.800000 24.046911 0.552266 8,942.40 1.636364 1.14 95,971 1.36 1.818182 Sub 10
Optimization 68.450000 97.414016 0.560929 12,511.16 2.363636 6.68 291,231 2.00 2.363636
Benchmark 102.846911 0.000000 2.312260 6,503.56 1.636364 0.83 28,824 1.36 1.818182
Water Save 78.800000 24.046911 0.339190 6,503.56 1.636364 0.83 70,197 1.36 1.818182 Sub 11
Optimization 68.450000 97.414016 0.344246 9,099.02 2.363636 4.86 212,205 2.00 2.363636
Benchmark 102.846911 0.000000 1.505893 3,793.75 1.636364 0.48 16,814 1.36 1.818182
Water Save 78.800000 24.046911 0.140304 3,793.75 1.636364 0.48 42,005 1.36 1.818182 Sub 12
Optimization 68.450000 97.414016 0.142362 5,307.76 2.363636 2.83 124,583 2.00 2.363636
Benchmark 122.703772 0.000000 3.183856 8,406.44 1.909091 3.91 81,200 2.00 2.545455
Water Save 84.500000 38.203772 1.196079 8,406.44 1.909091 3.91 124,301 2.00 2.545455 Sub 13
Optimization 68.450000 97.414016 1.202648 7,582.52 2.363636 4.05 189,168 2.00 2.363636
Benchmark 122.703772 0.000000 1.650972 5,043.86 1.909091 2.35 48,720 2.00 2.545455
Water Save 84.500000 38.203772 0.395313 5,043.86 1.909091 2.35 73,922 2.00 2.545455 Sub 14
Optimization 68.450000 97.414016 0.399870 4,549.51 2.363636 2.43 112,026 2.00 2.363636
Benchmark 102.846911 0.000000 5.065379 11,381.24 1.636364 1.45 50,442 1.36 1.818182
Water Save 78.800000 24.046911 1.447552 11,381.24 1.636364 1.45 125,897 1.36 1.818182 Sub 15
Optimization 68.450000 97.414016 1.466753 15,923.29 2.363636 8.50 376,486 2.00 2.363636
Benchmark 122.703772 0.000000 2.429222 8,406.44 1.909091 3.91 81,200 2.00 2.545455
Water Save 84.500000 38.203772 0.398370 8,406.44 1.909091 3.91 118,864 2.00 2.545455 Sub 16
Optimization 68.450000 97.414016 0.404701 7,582.52 2.363636 4.05 181,012 2.00 2.363636
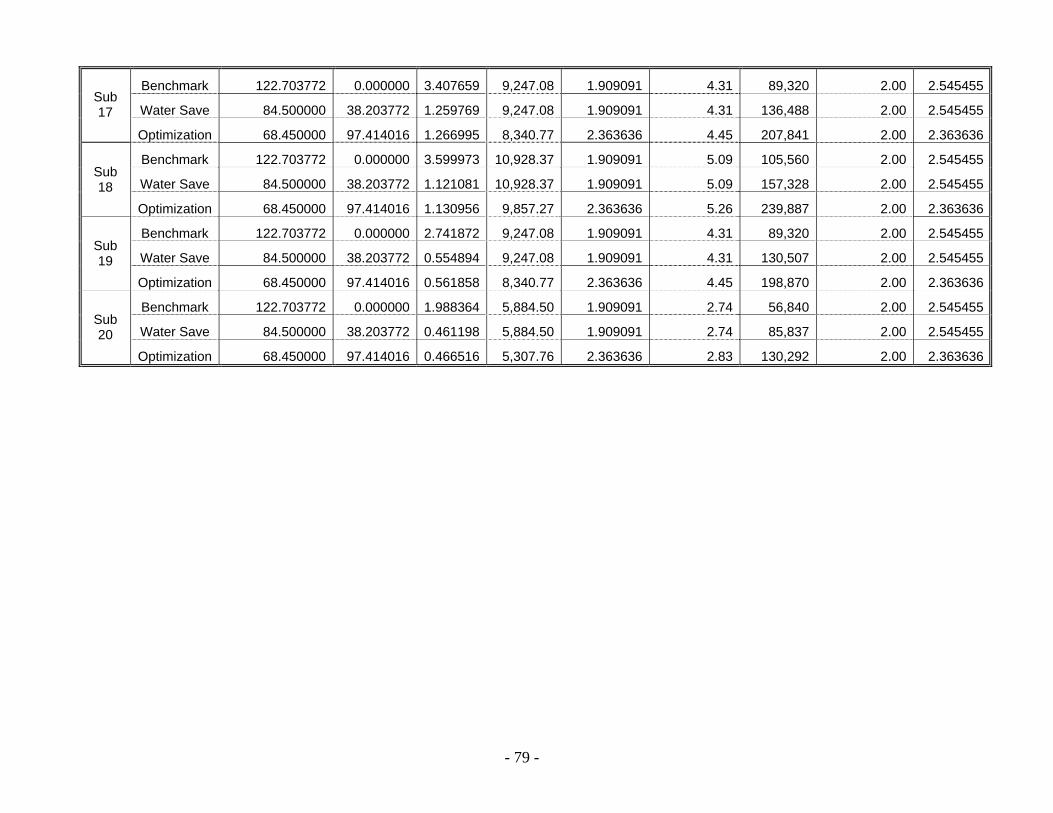
- 79 -
Benchmark 122.703772 0.000000 3.407659 9,247.08 1.909091 4.31 89,320 2.00 2.545455
Water Save 84.500000 38.203772 1.259769 9,247.08 1.909091 4.31 136,488 2.00 2.545455 Sub 17
Optimization 68.450000 97.414016 1.266995 8,340.77 2.363636 4.45 207,841 2.00 2.363636
Benchmark 122.703772 0.000000 3.599973 10,928.37 1.909091 5.09 105,560 2.00 2.545455
Water Save 84.500000 38.203772 1.121081 10,928.37 1.909091 5.09 157,328 2.00 2.545455 Sub 18
Optimization 68.450000 97.414016 1.130956 9,857.27 2.363636 5.26 239,887 2.00 2.363636
Benchmark 122.703772 0.000000 2.741872 9,247.08 1.909091 4.31 89,320 2.00 2.545455
Water Save 84.500000 38.203772 0.554894 9,247.08 1.909091 4.31 130,507 2.00 2.545455 Sub 19
Optimization 68.450000 97.414016 0.561858 8,340.77 2.363636 4.45 198,870 2.00 2.363636
Benchmark 122.703772 0.000000 1.988364 5,884.50 1.909091 2.74 56,840 2.00 2.545455
Water Save 84.500000 38.203772 0.461198 5,884.50 1.909091 2.74 85,837 2.00 2.545455 Sub 20
Optimization 68.450000 97.414016 0.466516 5,307.76 2.363636 2.83 130,292 2.00 2.363636
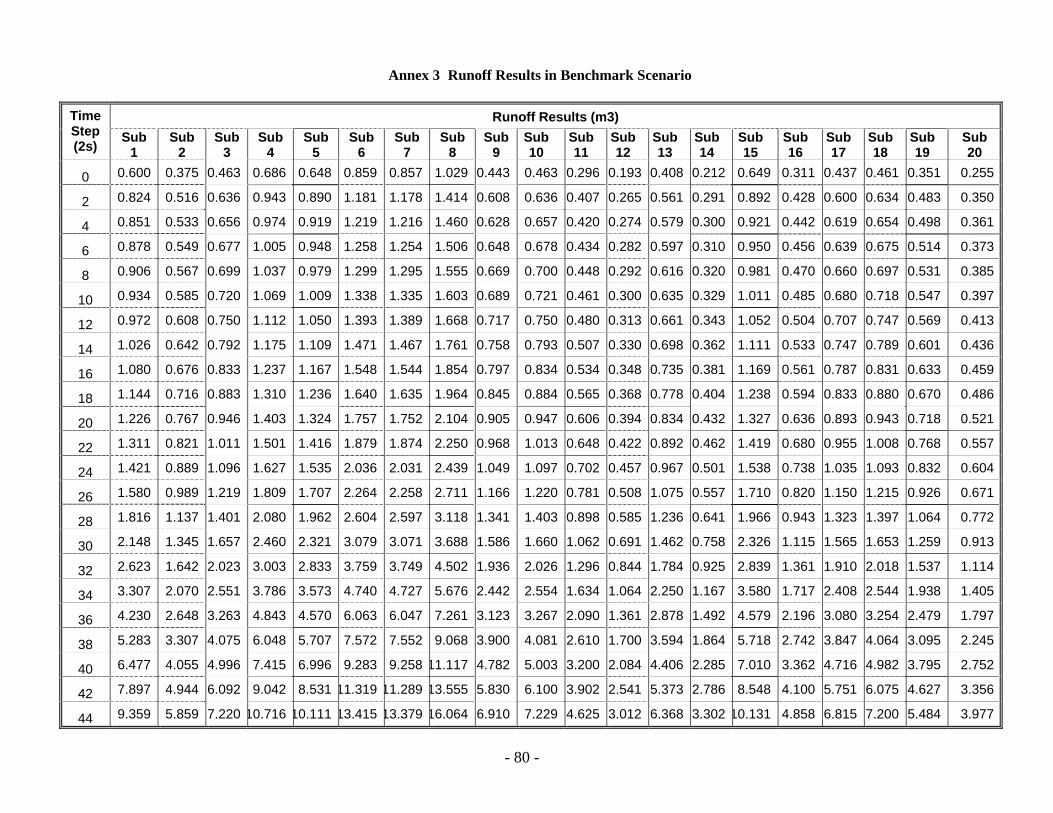
- 80 -
Annex 3 Runoff Results in Benchmark Scenario
Runoff Results (m3) Time Step (2s) Sub
1 Sub
2 Sub
3 Sub
4 Sub
5 Sub
6 Sub
7 Sub
8 Sub
9 Sub 10
Sub 11
Sub 12
Sub 13
Sub 14
Sub 15
Sub 16
Sub 17
Sub 18
Sub 19
Sub 20
0 0.600 0.375 0.463 0.686 0.648 0.859 0.857 1.029 0.443 0.463 0.296 0.193 0.408 0.212 0.649 0.311 0.437 0.461 0.351 0.255
2 0.824 0.516 0.636 0.943 0.890 1.181 1.178 1.414 0.608 0.636 0.407 0.265 0.561 0.291 0.892 0.428 0.600 0.634 0.483 0.350
4 0.851 0.533 0.656 0.974 0.919 1.219 1.216 1.460 0.628 0.657 0.420 0.274 0.579 0.300 0.921 0.442 0.619 0.654 0.498 0.361
6 0.878 0.549 0.677 1.005 0.948 1.258 1.254 1.506 0.648 0.678 0.434 0.282 0.597 0.310 0.950 0.456 0.639 0.675 0.514 0.373
8 0.906 0.567 0.699 1.037 0.979 1.299 1.295 1.555 0.669 0.700 0.448 0.292 0.616 0.320 0.981 0.470 0.660 0.697 0.531 0.385
10 0.934 0.585 0.720 1.069 1.009 1.338 1.335 1.603 0.689 0.721 0.461 0.300 0.635 0.329 1.011 0.485 0.680 0.718 0.547 0.397
12 0.972 0.608 0.750 1.112 1.050 1.393 1.389 1.668 0.717 0.750 0.480 0.313 0.661 0.343 1.052 0.504 0.707 0.747 0.569 0.413
14 1.026 0.642 0.792 1.175 1.109 1.471 1.467 1.761 0.758 0.793 0.507 0.330 0.698 0.362 1.111 0.533 0.747 0.789 0.601 0.436
16 1.080 0.676 0.833 1.237 1.167 1.548 1.544 1.854 0.797 0.834 0.534 0.348 0.735 0.381 1.169 0.561 0.787 0.831 0.633 0.459
18 1.144 0.716 0.883 1.310 1.236 1.640 1.635 1.964 0.845 0.884 0.565 0.368 0.778 0.404 1.238 0.594 0.833 0.880 0.670 0.486
20 1.226 0.767 0.946 1.403 1.324 1.757 1.752 2.104 0.905 0.947 0.606 0.394 0.834 0.432 1.327 0.636 0.893 0.943 0.718 0.521
22 1.311 0.821 1.011 1.501 1.416 1.879 1.874 2.250 0.968 1.013 0.648 0.422 0.892 0.462 1.419 0.680 0.955 1.008 0.768 0.557
24 1.421 0.889 1.096 1.627 1.535 2.036 2.031 2.439 1.049 1.097 0.702 0.457 0.967 0.501 1.538 0.738 1.035 1.093 0.832 0.604
26 1.580 0.989 1.219 1.809 1.707 2.264 2.258 2.711 1.166 1.220 0.781 0.508 1.075 0.557 1.710 0.820 1.150 1.215 0.926 0.671
28 1.816 1.137 1.401 2.080 1.962 2.604 2.597 3.118 1.341 1.403 0.898 0.585 1.236 0.641 1.966 0.943 1.323 1.397 1.064 0.772
30 2.148 1.345 1.657 2.460 2.321 3.079 3.071 3.688 1.586 1.660 1.062 0.691 1.462 0.758 2.326 1.115 1.565 1.653 1.259 0.913
32 2.623 1.642 2.023 3.003 2.833 3.759 3.749 4.502 1.936 2.026 1.296 0.844 1.784 0.925 2.839 1.361 1.910 2.018 1.537 1.114
34 3.307 2.070 2.551 3.786 3.573 4.740 4.727 5.676 2.442 2.554 1.634 1.064 2.250 1.167 3.580 1.717 2.408 2.544 1.938 1.405
36 4.230 2.648 3.263 4.843 4.570 6.063 6.047 7.261 3.123 3.267 2.090 1.361 2.878 1.492 4.579 2.196 3.080 3.254 2.479 1.797
38 5.283 3.307 4.075 6.048 5.707 7.572 7.552 9.068 3.900 4.081 2.610 1.700 3.594 1.864 5.718 2.742 3.847 4.064 3.095 2.245
40 6.477 4.055 4.996 7.415 6.996 9.283 9.258 11.117 4.782 5.003 3.200 2.084 4.406 2.285 7.010 3.362 4.716 4.982 3.795 2.752
42 7.897 4.944 6.092 9.042 8.531 11.319 11.289 13.555 5.830 6.100 3.902 2.541 5.373 2.786 8.548 4.100 5.751 6.075 4.627 3.356
44 9.359 5.859 7.220 10.716 10.111 13.415 13.379 16.064 6.910 7.229 4.625 3.012 6.368 3.302 10.131 4.858 6.815 7.200 5.484 3.977
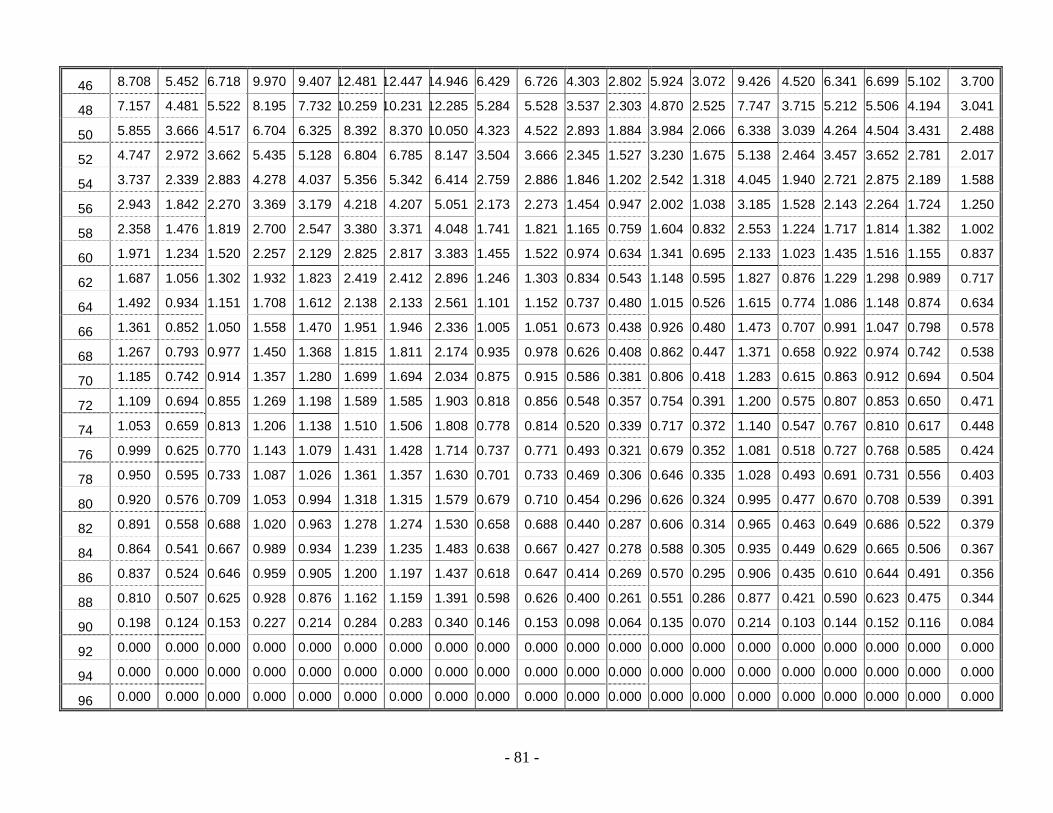
- 81 -
46 8.708 5.452 6.718 9.970 9.407 12.481 12.447 14.946 6.429 6.726 4.303 2.802 5.924 3.072 9.426 4.520 6.341 6.699 5.102 3.700
48 7.157 4.481 5.522 8.195 7.732 10.259 10.231 12.285 5.284 5.528 3.537 2.303 4.870 2.525 7.747 3.715 5.212 5.506 4.194 3.041
50 5.855 3.666 4.517 6.704 6.325 8.392 8.370 10.050 4.323 4.522 2.893 1.884 3.984 2.066 6.338 3.039 4.264 4.504 3.431 2.488
52 4.747 2.972 3.662 5.435 5.128 6.804 6.785 8.147 3.504 3.666 2.345 1.527 3.230 1.675 5.138 2.464 3.457 3.652 2.781 2.017
54 3.737 2.339 2.883 4.278 4.037 5.356 5.342 6.414 2.759 2.886 1.846 1.202 2.542 1.318 4.045 1.940 2.721 2.875 2.189 1.588
56 2.943 1.842 2.270 3.369 3.179 4.218 4.207 5.051 2.173 2.273 1.454 0.947 2.002 1.038 3.185 1.528 2.143 2.264 1.724 1.250
58 2.358 1.476 1.819 2.700 2.547 3.380 3.371 4.048 1.741 1.821 1.165 0.759 1.604 0.832 2.553 1.224 1.717 1.814 1.382 1.002
60 1.971 1.234 1.520 2.257 2.129 2.825 2.817 3.383 1.455 1.522 0.974 0.634 1.341 0.695 2.133 1.023 1.435 1.516 1.155 0.837
62 1.687 1.056 1.302 1.932 1.823 2.419 2.412 2.896 1.246 1.303 0.834 0.543 1.148 0.595 1.827 0.876 1.229 1.298 0.989 0.717
64 1.492 0.934 1.151 1.708 1.612 2.138 2.133 2.561 1.101 1.152 0.737 0.480 1.015 0.526 1.615 0.774 1.086 1.148 0.874 0.634
66 1.361 0.852 1.050 1.558 1.470 1.951 1.946 2.336 1.005 1.051 0.673 0.438 0.926 0.480 1.473 0.707 0.991 1.047 0.798 0.578
68 1.267 0.793 0.977 1.450 1.368 1.815 1.811 2.174 0.935 0.978 0.626 0.408 0.862 0.447 1.371 0.658 0.922 0.974 0.742 0.538
70 1.185 0.742 0.914 1.357 1.280 1.699 1.694 2.034 0.875 0.915 0.586 0.381 0.806 0.418 1.283 0.615 0.863 0.912 0.694 0.504
72 1.109 0.694 0.855 1.269 1.198 1.589 1.585 1.903 0.818 0.856 0.548 0.357 0.754 0.391 1.200 0.575 0.807 0.853 0.650 0.471
74 1.053 0.659 0.813 1.206 1.138 1.510 1.506 1.808 0.778 0.814 0.520 0.339 0.717 0.372 1.140 0.547 0.767 0.810 0.617 0.448
76 0.999 0.625 0.770 1.143 1.079 1.431 1.428 1.714 0.737 0.771 0.493 0.321 0.679 0.352 1.081 0.518 0.727 0.768 0.585 0.424
78 0.950 0.595 0.733 1.087 1.026 1.361 1.357 1.630 0.701 0.733 0.469 0.306 0.646 0.335 1.028 0.493 0.691 0.731 0.556 0.403
80 0.920 0.576 0.709 1.053 0.994 1.318 1.315 1.579 0.679 0.710 0.454 0.296 0.626 0.324 0.995 0.477 0.670 0.708 0.539 0.391
82 0.891 0.558 0.688 1.020 0.963 1.278 1.274 1.530 0.658 0.688 0.440 0.287 0.606 0.314 0.965 0.463 0.649 0.686 0.522 0.379
84 0.864 0.541 0.667 0.989 0.934 1.239 1.235 1.483 0.638 0.667 0.427 0.278 0.588 0.305 0.935 0.449 0.629 0.665 0.506 0.367
86 0.837 0.524 0.646 0.959 0.905 1.200 1.197 1.437 0.618 0.647 0.414 0.269 0.570 0.295 0.906 0.435 0.610 0.644 0.491 0.356
88 0.810 0.507 0.625 0.928 0.876 1.162 1.159 1.391 0.598 0.626 0.400 0.261 0.551 0.286 0.877 0.421 0.590 0.623 0.475 0.344
90 0.198 0.124 0.153 0.227 0.214 0.284 0.283 0.340 0.146 0.153 0.098 0.064 0.135 0.070 0.214 0.103 0.144 0.152 0.116 0.084
92 0.000 0.000 0.000 0.000 0.000 0.000 0.000 0.000 0.000 0.000 0.000 0.000 0.000 0.000 0.000 0.000 0.000 0.000 0.000 0.000
94 0.000 0.000 0.000 0.000 0.000 0.000 0.000 0.000 0.000 0.000 0.000 0.000 0.000 0.000 0.000 0.000 0.000 0.000 0.000 0.000
96 0.000 0.000 0.000 0.000 0.000 0.000 0.000 0.000 0.000 0.000 0.000 0.000 0.000 0.000 0.000 0.000 0.000 0.000 0.000 0.000

- 82 -
Annex 4 Runoff Results in Water Save Scenario
Runoff Results (m3) Time Step (2s) Sub 1 Sub 2 Sub 3 Sub 4 Sub 5 Sub 6 Sub 7 Sub 8 Sub 9 Sub
10 Sub 11
Sub 12
Sub 13
Sub 14
Sub 15
Sub 16
Sub 17
Sub 18
Sub 19
Sub 20
0 0.000 0.105 0.072 0.184 0.000 0.000 0.000 0.000 0.000 0.000 0.000 0.000 0.000 0.000 0.000 0.000 0.000 0.000 0.000 0.000
2 0.000 0.187 0.128 0.326 0.000 0.000 0.000 0.000 0.000 0.000 0.000 0.000 0.000 0.000 0.000 0.000 0.000 0.000 0.000 0.000
4 0.000 0.224 0.153 0.391 0.000 0.000 0.000 0.000 0.000 0.000 0.000 0.000 0.000 0.000 0.000 0.000 0.000 0.000 0.000 0.000
6 0.000 0.244 0.167 0.425 0.000 0.000 0.000 0.000 0.000 0.000 0.000 0.000 0.000 0.000 0.000 0.000 0.000 0.000 0.000 0.000
8 0.000 0.257 0.176 0.448 0.000 0.000 0.000 0.000 0.000 0.000 0.000 0.000 0.000 0.000 0.000 0.000 0.000 0.000 0.000 0.000
10 0.000 0.267 0.183 0.465 0.000 0.000 0.000 0.000 0.000 0.000 0.000 0.000 0.000 0.000 0.000 0.000 0.000 0.000 0.000 0.000
12 0.000 0.278 0.190 0.484 0.000 0.000 0.000 0.000 0.000 0.000 0.000 0.000 0.000 0.000 0.000 0.000 0.000 0.000 0.000 0.000
14 0.000 0.291 0.199 0.508 0.000 0.000 0.000 0.000 0.000 0.000 0.000 0.000 0.000 0.000 0.000 0.000 0.000 0.000 0.000 0.000
16 0.000 0.306 0.210 0.534 0.000 0.000 0.000 0.000 0.000 0.000 0.000 0.000 0.000 0.000 0.000 0.000 0.000 0.000 0.000 0.000
18 0.000 0.324 0.221 0.564 0.000 0.000 0.000 0.000 0.000 0.000 0.000 0.000 0.000 0.000 0.000 0.000 0.000 0.000 0.000 0.000
20 0.000 0.345 0.236 0.601 0.000 0.000 0.000 0.000 0.000 0.000 0.000 0.000 0.000 0.000 0.000 0.000 0.000 0.000 0.000 0.000
22 0.000 0.368 0.252 0.642 0.000 0.000 0.000 0.000 0.000 0.000 0.000 0.000 0.000 0.000 0.000 0.000 0.000 0.000 0.000 0.000
24 0.000 0.397 0.272 0.692 0.000 0.000 0.000 0.000 0.000 0.000 0.000 0.000 0.000 0.000 0.000 0.000 0.000 0.000 0.000 0.000
26 0.000 0.437 0.299 0.761 0.000 0.000 0.000 0.000 0.000 0.000 0.000 0.000 0.000 0.000 0.000 0.000 0.000 0.000 0.000 0.000
28 0.189 0.494 0.338 0.861 0.000 0.000 0.000 0.000 0.000 0.000 0.000 0.000 0.000 0.000 0.000 0.000 0.189 0.000 0.000 0.000
30 0.466 0.575 0.394 1.002 0.000 0.000 0.000 0.000 0.000 0.000 0.000 0.000 0.000 0.000 0.000 0.000 0.466 0.000 0.000 0.000
32 0.774 0.691 0.473 1.204 0.000 0.000 0.000 0.131 0.000 0.000 0.000 0.000 0.000 0.000 0.000 0.000 0.774 0.000 0.000 0.000
34 1.118 0.858 0.587 1.495 0.000 0.000 0.000 0.332 0.000 0.000 0.000 0.000 0.000 0.000 0.000 0.000 1.118 0.000 0.000 0.000
36 1.521 1.087 0.743 1.893 0.000 0.074 0.000 0.568 0.000 0.000 0.000 0.000 0.000 0.000 0.000 0.000 1.521 0.000 0.000 0.000
38 1.994 1.363 0.933 2.375 0.148 0.293 0.070 0.832 0.000 0.000 0.000 0.000 0.000 0.000 0.114 0.000 1.994 0.000 0.000 0.000
40 2.545 1.684 1.152 2.934 0.465 0.560 0.295 1.124 0.000 0.000 0.000 0.000 0.000 0.000 0.352 0.000 2.545 0.000 0.000 0.000
42 4.056 2.062 1.411 3.592 0.837 0.850 0.570 1.451 0.000 0.125 0.000 0.000 0.000 0.000 0.631 0.000 4.056 0.000 0.000 0.000
44 5.367 2.470 1.690 4.303 1.225 1.152 0.860 2.169 0.000 0.370 0.000 0.000 0.000 0.000 0.923 0.000 5.367 0.000 0.000 0.000
46 5.631 2.519 2.897 4.388 1.519 1.377 1.079 2.515 0.000 0.588 0.000 0.000 0.018 0.000 1.143 0.000 5.631 0.006 0.000 0.000
48 5.116 2.265 4.470 4.969 2.859 4.220 1.187 2.360 0.105 0.721 0.000 0.000 0.887 0.000 2.035 0.000 8.635 0.201 0.000 0.000
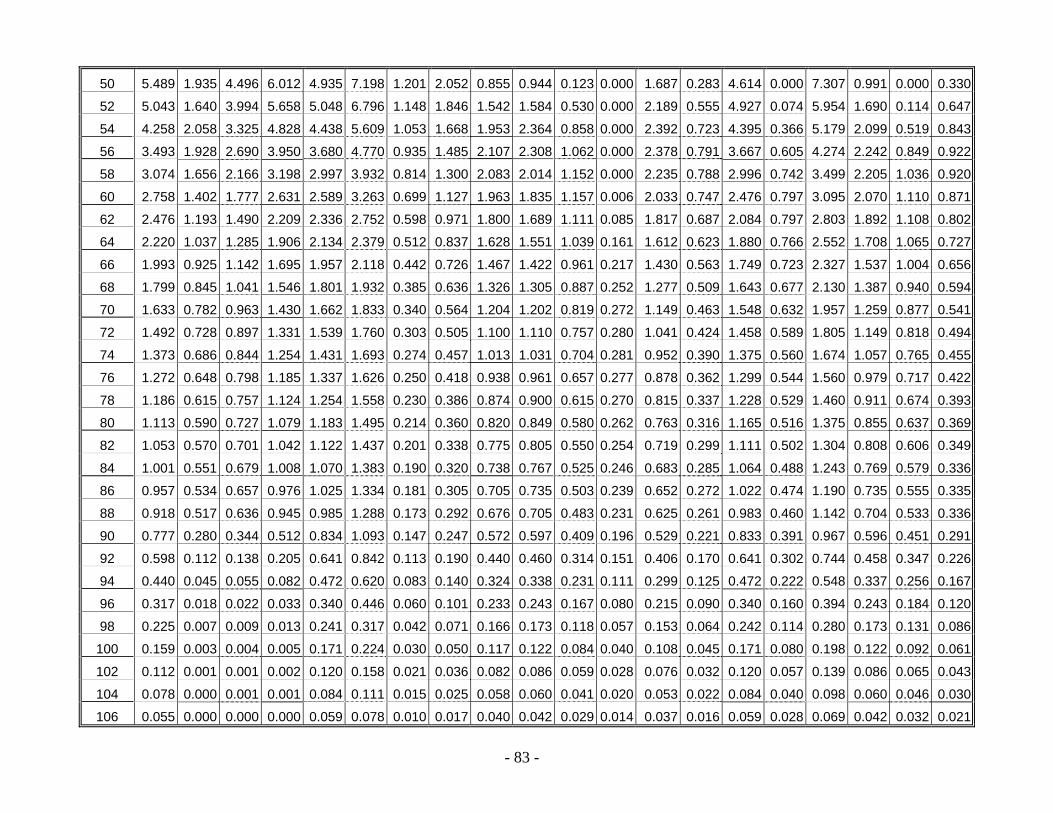
- 83 -
50 5.489 1.935 4.496 6.012 4.935 7.198 1.201 2.052 0.855 0.944 0.123 0.000 1.687 0.283 4.614 0.000 7.307 0.991 0.000 0.330
52 5.043 1.640 3.994 5.658 5.048 6.796 1.148 1.846 1.542 1.584 0.530 0.000 2.189 0.555 4.927 0.074 5.954 1.690 0.114 0.647
54 4.258 2.058 3.325 4.828 4.438 5.609 1.053 1.668 1.953 2.364 0.858 0.000 2.392 0.723 4.395 0.366 5.179 2.099 0.519 0.843
56 3.493 1.928 2.690 3.950 3.680 4.770 0.935 1.485 2.107 2.308 1.062 0.000 2.378 0.791 3.667 0.605 4.274 2.242 0.849 0.922
58 3.074 1.656 2.166 3.198 2.997 3.932 0.814 1.300 2.083 2.014 1.152 0.000 2.235 0.788 2.996 0.742 3.499 2.205 1.036 0.920
60 2.758 1.402 1.777 2.631 2.589 3.263 0.699 1.127 1.963 1.835 1.157 0.006 2.033 0.747 2.476 0.797 3.095 2.070 1.110 0.871
62 2.476 1.193 1.490 2.209 2.336 2.752 0.598 0.971 1.800 1.689 1.111 0.085 1.817 0.687 2.084 0.797 2.803 1.892 1.108 0.802
64 2.220 1.037 1.285 1.906 2.134 2.379 0.512 0.837 1.628 1.551 1.039 0.161 1.612 0.623 1.880 0.766 2.552 1.708 1.065 0.727
66 1.993 0.925 1.142 1.695 1.957 2.118 0.442 0.726 1.467 1.422 0.961 0.217 1.430 0.563 1.749 0.723 2.327 1.537 1.004 0.656
68 1.799 0.845 1.041 1.546 1.801 1.932 0.385 0.636 1.326 1.305 0.887 0.252 1.277 0.509 1.643 0.677 2.130 1.387 0.940 0.594
70 1.633 0.782 0.963 1.430 1.662 1.833 0.340 0.564 1.204 1.202 0.819 0.272 1.149 0.463 1.548 0.632 1.957 1.259 0.877 0.541
72 1.492 0.728 0.897 1.331 1.539 1.760 0.303 0.505 1.100 1.110 0.757 0.280 1.041 0.424 1.458 0.589 1.805 1.149 0.818 0.494
74 1.373 0.686 0.844 1.254 1.431 1.693 0.274 0.457 1.013 1.031 0.704 0.281 0.952 0.390 1.375 0.560 1.674 1.057 0.765 0.455
76 1.272 0.648 0.798 1.185 1.337 1.626 0.250 0.418 0.938 0.961 0.657 0.277 0.878 0.362 1.299 0.544 1.560 0.979 0.717 0.422
78 1.186 0.615 0.757 1.124 1.254 1.558 0.230 0.386 0.874 0.900 0.615 0.270 0.815 0.337 1.228 0.529 1.460 0.911 0.674 0.393
80 1.113 0.590 0.727 1.079 1.183 1.495 0.214 0.360 0.820 0.849 0.580 0.262 0.763 0.316 1.165 0.516 1.375 0.855 0.637 0.369
82 1.053 0.570 0.701 1.042 1.122 1.437 0.201 0.338 0.775 0.805 0.550 0.254 0.719 0.299 1.111 0.502 1.304 0.808 0.606 0.349
84 1.001 0.551 0.679 1.008 1.070 1.383 0.190 0.320 0.738 0.767 0.525 0.246 0.683 0.285 1.064 0.488 1.243 0.769 0.579 0.336
86 0.957 0.534 0.657 0.976 1.025 1.334 0.181 0.305 0.705 0.735 0.503 0.239 0.652 0.272 1.022 0.474 1.190 0.735 0.555 0.335
88 0.918 0.517 0.636 0.945 0.985 1.288 0.173 0.292 0.676 0.705 0.483 0.231 0.625 0.261 0.983 0.460 1.142 0.704 0.533 0.336
90 0.777 0.280 0.344 0.512 0.834 1.093 0.147 0.247 0.572 0.597 0.409 0.196 0.529 0.221 0.833 0.391 0.967 0.596 0.451 0.291
92 0.598 0.112 0.138 0.205 0.641 0.842 0.113 0.190 0.440 0.460 0.314 0.151 0.406 0.170 0.641 0.302 0.744 0.458 0.347 0.226
94 0.440 0.045 0.055 0.082 0.472 0.620 0.083 0.140 0.324 0.338 0.231 0.111 0.299 0.125 0.472 0.222 0.548 0.337 0.256 0.167
96 0.317 0.018 0.022 0.033 0.340 0.446 0.060 0.101 0.233 0.243 0.167 0.080 0.215 0.090 0.340 0.160 0.394 0.243 0.184 0.120
98 0.225 0.007 0.009 0.013 0.241 0.317 0.042 0.071 0.166 0.173 0.118 0.057 0.153 0.064 0.242 0.114 0.280 0.173 0.131 0.086
100 0.159 0.003 0.004 0.005 0.171 0.224 0.030 0.050 0.117 0.122 0.084 0.040 0.108 0.045 0.171 0.080 0.198 0.122 0.092 0.061
102 0.112 0.001 0.001 0.002 0.120 0.158 0.021 0.036 0.082 0.086 0.059 0.028 0.076 0.032 0.120 0.057 0.139 0.086 0.065 0.043
104 0.078 0.000 0.001 0.001 0.084 0.111 0.015 0.025 0.058 0.060 0.041 0.020 0.053 0.022 0.084 0.040 0.098 0.060 0.046 0.030
106 0.055 0.000 0.000 0.000 0.059 0.078 0.010 0.017 0.040 0.042 0.029 0.014 0.037 0.016 0.059 0.028 0.069 0.042 0.032 0.021
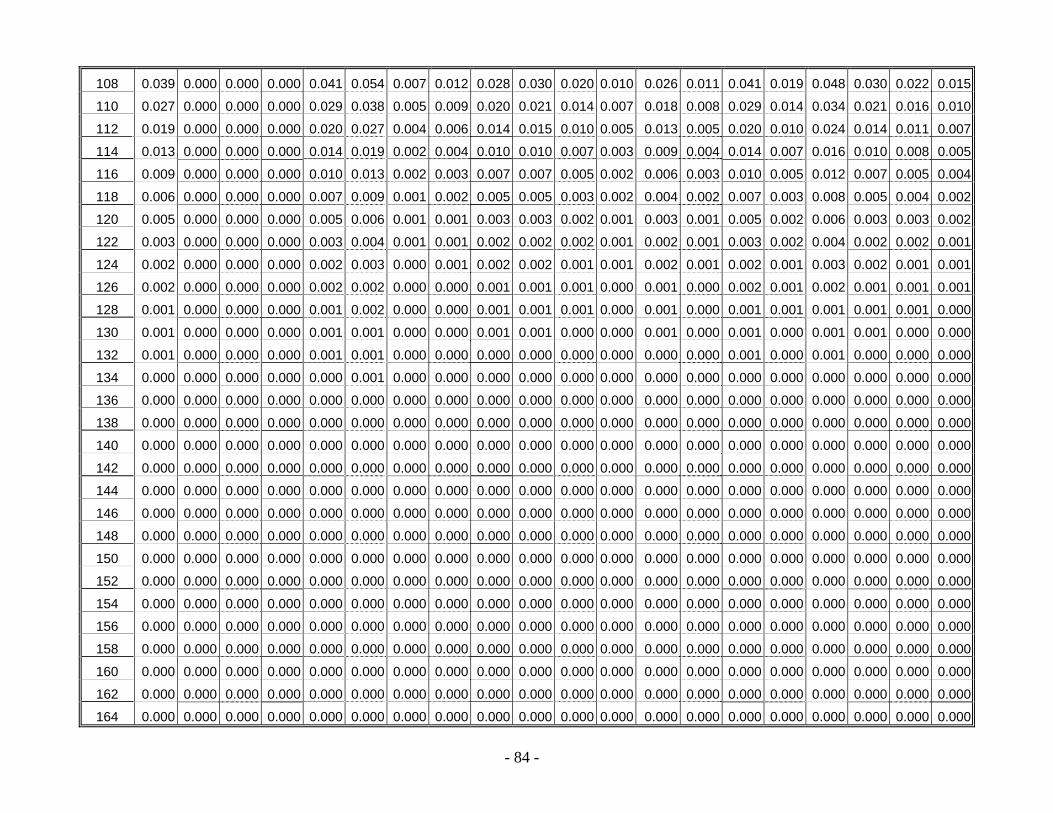
- 84 -
108 0.039 0.000 0.000 0.000 0.041 0.054 0.007 0.012 0.028 0.030 0.020 0.010 0.026 0.011 0.041 0.019 0.048 0.030 0.022 0.015
110 0.027 0.000 0.000 0.000 0.029 0.038 0.005 0.009 0.020 0.021 0.014 0.007 0.018 0.008 0.029 0.014 0.034 0.021 0.016 0.010
112 0.019 0.000 0.000 0.000 0.020 0.027 0.004 0.006 0.014 0.015 0.010 0.005 0.013 0.005 0.020 0.010 0.024 0.014 0.011 0.007
114 0.013 0.000 0.000 0.000 0.014 0.019 0.002 0.004 0.010 0.010 0.007 0.003 0.009 0.004 0.014 0.007 0.016 0.010 0.008 0.005
116 0.009 0.000 0.000 0.000 0.010 0.013 0.002 0.003 0.007 0.007 0.005 0.002 0.006 0.003 0.010 0.005 0.012 0.007 0.005 0.004
118 0.006 0.000 0.000 0.000 0.007 0.009 0.001 0.002 0.005 0.005 0.003 0.002 0.004 0.002 0.007 0.003 0.008 0.005 0.004 0.002
120 0.005 0.000 0.000 0.000 0.005 0.006 0.001 0.001 0.003 0.003 0.002 0.001 0.003 0.001 0.005 0.002 0.006 0.003 0.003 0.002
122 0.003 0.000 0.000 0.000 0.003 0.004 0.001 0.001 0.002 0.002 0.002 0.001 0.002 0.001 0.003 0.002 0.004 0.002 0.002 0.001
124 0.002 0.000 0.000 0.000 0.002 0.003 0.000 0.001 0.002 0.002 0.001 0.001 0.002 0.001 0.002 0.001 0.003 0.002 0.001 0.001
126 0.002 0.000 0.000 0.000 0.002 0.002 0.000 0.000 0.001 0.001 0.001 0.000 0.001 0.000 0.002 0.001 0.002 0.001 0.001 0.001
128 0.001 0.000 0.000 0.000 0.001 0.002 0.000 0.000 0.001 0.001 0.001 0.000 0.001 0.000 0.001 0.001 0.001 0.001 0.001 0.000
130 0.001 0.000 0.000 0.000 0.001 0.001 0.000 0.000 0.001 0.001 0.000 0.000 0.001 0.000 0.001 0.000 0.001 0.001 0.000 0.000
132 0.001 0.000 0.000 0.000 0.001 0.001 0.000 0.000 0.000 0.000 0.000 0.000 0.000 0.000 0.001 0.000 0.001 0.000 0.000 0.000
134 0.000 0.000 0.000 0.000 0.000 0.001 0.000 0.000 0.000 0.000 0.000 0.000 0.000 0.000 0.000 0.000 0.000 0.000 0.000 0.000
136 0.000 0.000 0.000 0.000 0.000 0.000 0.000 0.000 0.000 0.000 0.000 0.000 0.000 0.000 0.000 0.000 0.000 0.000 0.000 0.000
138 0.000 0.000 0.000 0.000 0.000 0.000 0.000 0.000 0.000 0.000 0.000 0.000 0.000 0.000 0.000 0.000 0.000 0.000 0.000 0.000
140 0.000 0.000 0.000 0.000 0.000 0.000 0.000 0.000 0.000 0.000 0.000 0.000 0.000 0.000 0.000 0.000 0.000 0.000 0.000 0.000
142 0.000 0.000 0.000 0.000 0.000 0.000 0.000 0.000 0.000 0.000 0.000 0.000 0.000 0.000 0.000 0.000 0.000 0.000 0.000 0.000
144 0.000 0.000 0.000 0.000 0.000 0.000 0.000 0.000 0.000 0.000 0.000 0.000 0.000 0.000 0.000 0.000 0.000 0.000 0.000 0.000
146 0.000 0.000 0.000 0.000 0.000 0.000 0.000 0.000 0.000 0.000 0.000 0.000 0.000 0.000 0.000 0.000 0.000 0.000 0.000 0.000
148 0.000 0.000 0.000 0.000 0.000 0.000 0.000 0.000 0.000 0.000 0.000 0.000 0.000 0.000 0.000 0.000 0.000 0.000 0.000 0.000
150 0.000 0.000 0.000 0.000 0.000 0.000 0.000 0.000 0.000 0.000 0.000 0.000 0.000 0.000 0.000 0.000 0.000 0.000 0.000 0.000
152 0.000 0.000 0.000 0.000 0.000 0.000 0.000 0.000 0.000 0.000 0.000 0.000 0.000 0.000 0.000 0.000 0.000 0.000 0.000 0.000
154 0.000 0.000 0.000 0.000 0.000 0.000 0.000 0.000 0.000 0.000 0.000 0.000 0.000 0.000 0.000 0.000 0.000 0.000 0.000 0.000
156 0.000 0.000 0.000 0.000 0.000 0.000 0.000 0.000 0.000 0.000 0.000 0.000 0.000 0.000 0.000 0.000 0.000 0.000 0.000 0.000
158 0.000 0.000 0.000 0.000 0.000 0.000 0.000 0.000 0.000 0.000 0.000 0.000 0.000 0.000 0.000 0.000 0.000 0.000 0.000 0.000
160 0.000 0.000 0.000 0.000 0.000 0.000 0.000 0.000 0.000 0.000 0.000 0.000 0.000 0.000 0.000 0.000 0.000 0.000 0.000 0.000
162 0.000 0.000 0.000 0.000 0.000 0.000 0.000 0.000 0.000 0.000 0.000 0.000 0.000 0.000 0.000 0.000 0.000 0.000 0.000 0.000
164 0.000 0.000 0.000 0.000 0.000 0.000 0.000 0.000 0.000 0.000 0.000 0.000 0.000 0.000 0.000 0.000 0.000 0.000 0.000 0.000
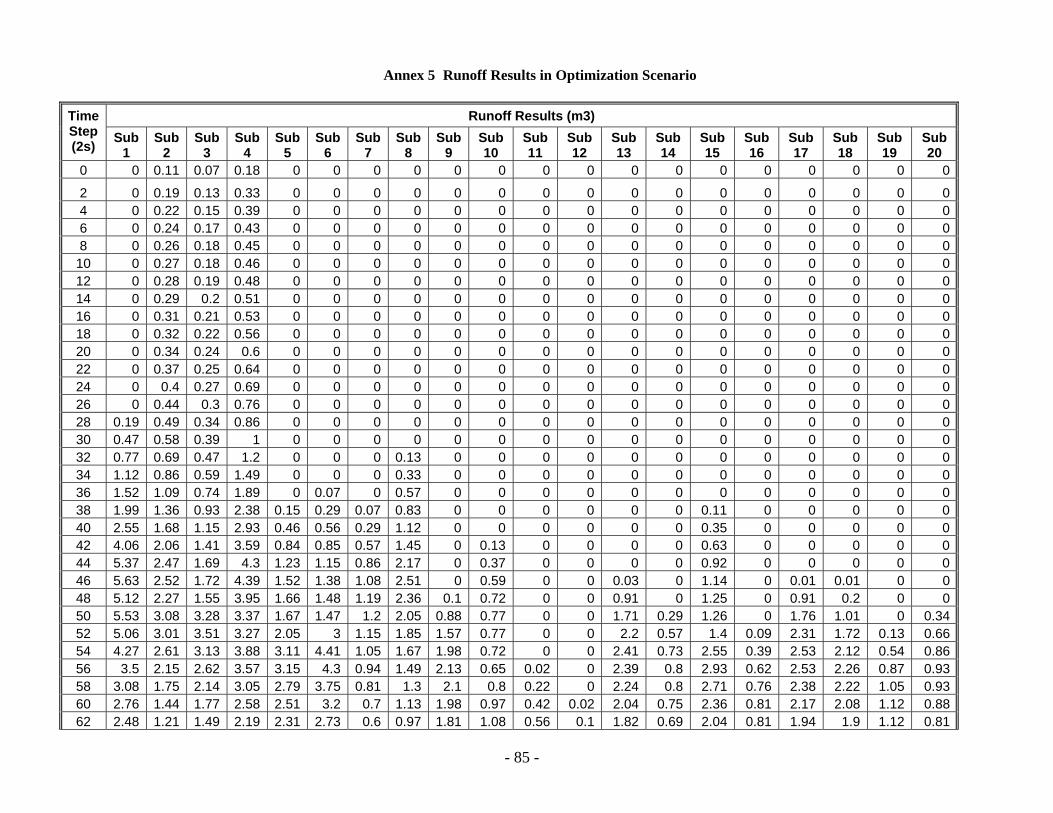
- 85 -
Annex 5 Runoff Results in Optimization Scenario
Runoff Results (m3) Time Step (2s) Sub
1 Sub
2 Sub
3 Sub
4 Sub
5 Sub
6 Sub
7 Sub
8 Sub
9 Sub 10
Sub 11
Sub 12
Sub 13
Sub 14
Sub 15
Sub 16
Sub 17
Sub 18
Sub 19
Sub 20
0 0 0.11 0.07 0.18 0 0 0 0 0 0 0 0 0 0 0 0 0 0 0 0
2 0 0.19 0.13 0.33 0 0 0 0 0 0 0 0 0 0 0 0 0 0 0 04 0 0.22 0.15 0.39 0 0 0 0 0 0 0 0 0 0 0 0 0 0 0 06 0 0.24 0.17 0.43 0 0 0 0 0 0 0 0 0 0 0 0 0 0 0 08 0 0.26 0.18 0.45 0 0 0 0 0 0 0 0 0 0 0 0 0 0 0 0
10 0 0.27 0.18 0.46 0 0 0 0 0 0 0 0 0 0 0 0 0 0 0 012 0 0.28 0.19 0.48 0 0 0 0 0 0 0 0 0 0 0 0 0 0 0 014 0 0.29 0.2 0.51 0 0 0 0 0 0 0 0 0 0 0 0 0 0 0 016 0 0.31 0.21 0.53 0 0 0 0 0 0 0 0 0 0 0 0 0 0 0 018 0 0.32 0.22 0.56 0 0 0 0 0 0 0 0 0 0 0 0 0 0 0 020 0 0.34 0.24 0.6 0 0 0 0 0 0 0 0 0 0 0 0 0 0 0 022 0 0.37 0.25 0.64 0 0 0 0 0 0 0 0 0 0 0 0 0 0 0 024 0 0.4 0.27 0.69 0 0 0 0 0 0 0 0 0 0 0 0 0 0 0 026 0 0.44 0.3 0.76 0 0 0 0 0 0 0 0 0 0 0 0 0 0 0 028 0.19 0.49 0.34 0.86 0 0 0 0 0 0 0 0 0 0 0 0 0 0 0 030 0.47 0.58 0.39 1 0 0 0 0 0 0 0 0 0 0 0 0 0 0 0 032 0.77 0.69 0.47 1.2 0 0 0 0.13 0 0 0 0 0 0 0 0 0 0 0 034 1.12 0.86 0.59 1.49 0 0 0 0.33 0 0 0 0 0 0 0 0 0 0 0 036 1.52 1.09 0.74 1.89 0 0.07 0 0.57 0 0 0 0 0 0 0 0 0 0 0 038 1.99 1.36 0.93 2.38 0.15 0.29 0.07 0.83 0 0 0 0 0 0 0.11 0 0 0 0 040 2.55 1.68 1.15 2.93 0.46 0.56 0.29 1.12 0 0 0 0 0 0 0.35 0 0 0 0 042 4.06 2.06 1.41 3.59 0.84 0.85 0.57 1.45 0 0.13 0 0 0 0 0.63 0 0 0 0 044 5.37 2.47 1.69 4.3 1.23 1.15 0.86 2.17 0 0.37 0 0 0 0 0.92 0 0 0 0 046 5.63 2.52 1.72 4.39 1.52 1.38 1.08 2.51 0 0.59 0 0 0.03 0 1.14 0 0.01 0.01 0 048 5.12 2.27 1.55 3.95 1.66 1.48 1.19 2.36 0.1 0.72 0 0 0.91 0 1.25 0 0.91 0.2 0 050 5.53 3.08 3.28 3.37 1.67 1.47 1.2 2.05 0.88 0.77 0 0 1.71 0.29 1.26 0 1.76 1.01 0 0.3452 5.06 3.01 3.51 3.27 2.05 3 1.15 1.85 1.57 0.77 0 0 2.2 0.57 1.4 0.09 2.31 1.72 0.13 0.6654 4.27 2.61 3.13 3.88 3.11 4.41 1.05 1.67 1.98 0.72 0 0 2.41 0.73 2.55 0.39 2.53 2.12 0.54 0.8656 3.5 2.15 2.62 3.57 3.15 4.3 0.94 1.49 2.13 0.65 0.02 0 2.39 0.8 2.93 0.62 2.53 2.26 0.87 0.9358 3.08 1.75 2.14 3.05 2.79 3.75 0.81 1.3 2.1 0.8 0.22 0 2.24 0.8 2.71 0.76 2.38 2.22 1.05 0.9360 2.76 1.44 1.77 2.58 2.51 3.2 0.7 1.13 1.98 0.97 0.42 0.02 2.04 0.75 2.36 0.81 2.17 2.08 1.12 0.8862 2.48 1.21 1.49 2.19 2.31 2.73 0.6 0.97 1.81 1.08 0.56 0.1 1.82 0.69 2.04 0.81 1.94 1.9 1.12 0.81
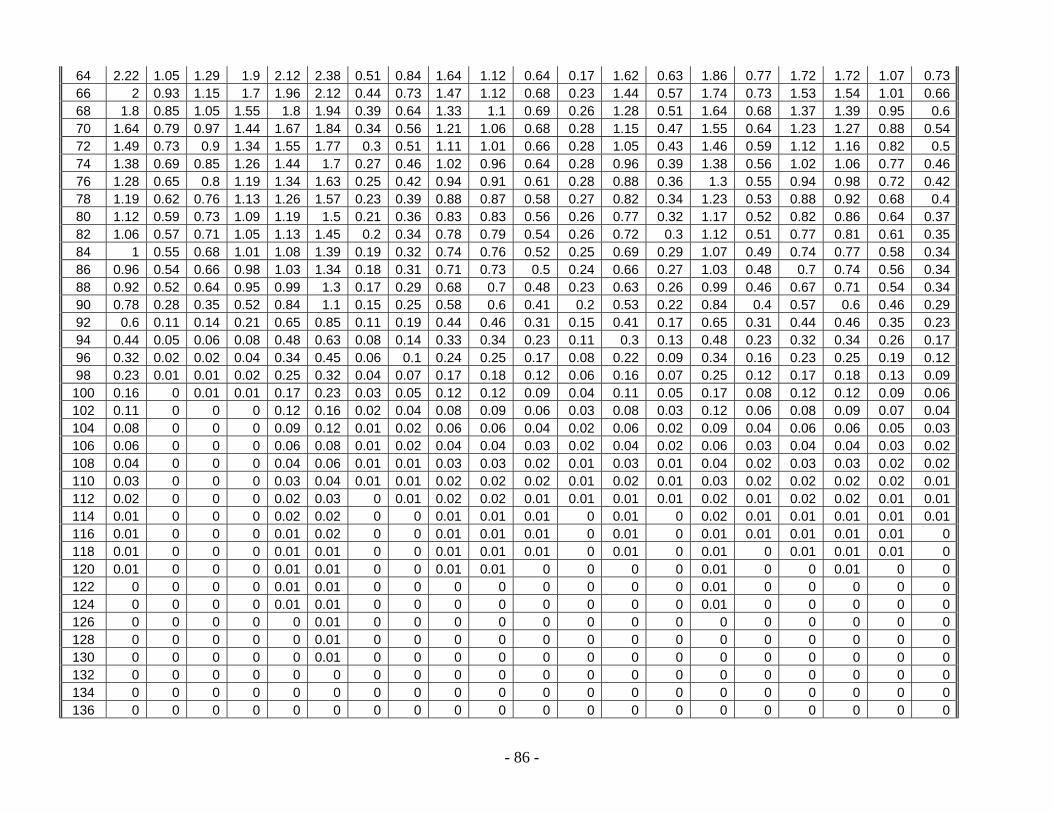
- 86 -
64 2.22 1.05 1.29 1.9 2.12 2.38 0.51 0.84 1.64 1.12 0.64 0.17 1.62 0.63 1.86 0.77 1.72 1.72 1.07 0.7366 2 0.93 1.15 1.7 1.96 2.12 0.44 0.73 1.47 1.12 0.68 0.23 1.44 0.57 1.74 0.73 1.53 1.54 1.01 0.6668 1.8 0.85 1.05 1.55 1.8 1.94 0.39 0.64 1.33 1.1 0.69 0.26 1.28 0.51 1.64 0.68 1.37 1.39 0.95 0.670 1.64 0.79 0.97 1.44 1.67 1.84 0.34 0.56 1.21 1.06 0.68 0.28 1.15 0.47 1.55 0.64 1.23 1.27 0.88 0.5472 1.49 0.73 0.9 1.34 1.55 1.77 0.3 0.51 1.11 1.01 0.66 0.28 1.05 0.43 1.46 0.59 1.12 1.16 0.82 0.574 1.38 0.69 0.85 1.26 1.44 1.7 0.27 0.46 1.02 0.96 0.64 0.28 0.96 0.39 1.38 0.56 1.02 1.06 0.77 0.4676 1.28 0.65 0.8 1.19 1.34 1.63 0.25 0.42 0.94 0.91 0.61 0.28 0.88 0.36 1.3 0.55 0.94 0.98 0.72 0.4278 1.19 0.62 0.76 1.13 1.26 1.57 0.23 0.39 0.88 0.87 0.58 0.27 0.82 0.34 1.23 0.53 0.88 0.92 0.68 0.480 1.12 0.59 0.73 1.09 1.19 1.5 0.21 0.36 0.83 0.83 0.56 0.26 0.77 0.32 1.17 0.52 0.82 0.86 0.64 0.3782 1.06 0.57 0.71 1.05 1.13 1.45 0.2 0.34 0.78 0.79 0.54 0.26 0.72 0.3 1.12 0.51 0.77 0.81 0.61 0.3584 1 0.55 0.68 1.01 1.08 1.39 0.19 0.32 0.74 0.76 0.52 0.25 0.69 0.29 1.07 0.49 0.74 0.77 0.58 0.3486 0.96 0.54 0.66 0.98 1.03 1.34 0.18 0.31 0.71 0.73 0.5 0.24 0.66 0.27 1.03 0.48 0.7 0.74 0.56 0.3488 0.92 0.52 0.64 0.95 0.99 1.3 0.17 0.29 0.68 0.7 0.48 0.23 0.63 0.26 0.99 0.46 0.67 0.71 0.54 0.3490 0.78 0.28 0.35 0.52 0.84 1.1 0.15 0.25 0.58 0.6 0.41 0.2 0.53 0.22 0.84 0.4 0.57 0.6 0.46 0.2992 0.6 0.11 0.14 0.21 0.65 0.85 0.11 0.19 0.44 0.46 0.31 0.15 0.41 0.17 0.65 0.31 0.44 0.46 0.35 0.2394 0.44 0.05 0.06 0.08 0.48 0.63 0.08 0.14 0.33 0.34 0.23 0.11 0.3 0.13 0.48 0.23 0.32 0.34 0.26 0.1796 0.32 0.02 0.02 0.04 0.34 0.45 0.06 0.1 0.24 0.25 0.17 0.08 0.22 0.09 0.34 0.16 0.23 0.25 0.19 0.1298 0.23 0.01 0.01 0.02 0.25 0.32 0.04 0.07 0.17 0.18 0.12 0.06 0.16 0.07 0.25 0.12 0.17 0.18 0.13 0.09100 0.16 0 0.01 0.01 0.17 0.23 0.03 0.05 0.12 0.12 0.09 0.04 0.11 0.05 0.17 0.08 0.12 0.12 0.09 0.06102 0.11 0 0 0 0.12 0.16 0.02 0.04 0.08 0.09 0.06 0.03 0.08 0.03 0.12 0.06 0.08 0.09 0.07 0.04104 0.08 0 0 0 0.09 0.12 0.01 0.02 0.06 0.06 0.04 0.02 0.06 0.02 0.09 0.04 0.06 0.06 0.05 0.03106 0.06 0 0 0 0.06 0.08 0.01 0.02 0.04 0.04 0.03 0.02 0.04 0.02 0.06 0.03 0.04 0.04 0.03 0.02108 0.04 0 0 0 0.04 0.06 0.01 0.01 0.03 0.03 0.02 0.01 0.03 0.01 0.04 0.02 0.03 0.03 0.02 0.02110 0.03 0 0 0 0.03 0.04 0.01 0.01 0.02 0.02 0.02 0.01 0.02 0.01 0.03 0.02 0.02 0.02 0.02 0.01112 0.02 0 0 0 0.02 0.03 0 0.01 0.02 0.02 0.01 0.01 0.01 0.01 0.02 0.01 0.02 0.02 0.01 0.01114 0.01 0 0 0 0.02 0.02 0 0 0.01 0.01 0.01 0 0.01 0 0.02 0.01 0.01 0.01 0.01 0.01116 0.01 0 0 0 0.01 0.02 0 0 0.01 0.01 0.01 0 0.01 0 0.01 0.01 0.01 0.01 0.01 0118 0.01 0 0 0 0.01 0.01 0 0 0.01 0.01 0.01 0 0.01 0 0.01 0 0.01 0.01 0.01 0120 0.01 0 0 0 0.01 0.01 0 0 0.01 0.01 0 0 0 0 0.01 0 0 0.01 0 0122 0 0 0 0 0.01 0.01 0 0 0 0 0 0 0 0 0.01 0 0 0 0 0124 0 0 0 0 0.01 0.01 0 0 0 0 0 0 0 0 0.01 0 0 0 0 0126 0 0 0 0 0 0.01 0 0 0 0 0 0 0 0 0 0 0 0 0 0128 0 0 0 0 0 0.01 0 0 0 0 0 0 0 0 0 0 0 0 0 0130 0 0 0 0 0 0.01 0 0 0 0 0 0 0 0 0 0 0 0 0 0132 0 0 0 0 0 0 0 0 0 0 0 0 0 0 0 0 0 0 0 0134 0 0 0 0 0 0 0 0 0 0 0 0 0 0 0 0 0 0 0 0136 0 0 0 0 0 0 0 0 0 0 0 0 0 0 0 0 0 0 0 0

- 87 -
138 0 0 0 0 0 0 0 0 0 0 0 0 0 0 0 0 0 0 0 0140 0 0 0 0 0 0 0 0 0 0 0 0 0 0 0 0 0 0 0 0142 0 0 0 0 0 0 0 0 0 0 0 0 0 0 0 0 0 0 0 0144 0 0 0 0 0 0 0 0 0 0 0 0 0 0 0 0 0 0 0 0146 0 0 0 0 0 0 0 0 0 0 0 0 0 0 0 0 0 0 0 0148 0 0 0 0 0 0 0 0 0 0 0 0 0 0 0 0 0 0 0 0150 0 0 0 0 0 0 0 0 0 0 0 0 0 0 0 0 0 0 0 0152 0 0 0 0 0 0 0 0 0 0 0 0 0 0 0 0 0 0 0 0154 0 0 0 0 0 0 0 0 0 0 0 0 0 0 0 0 0 0 0 0156 0 0 0 0 0 0 0 0 0 0 0 0 0 0 0 0 0 0 0 0158 0 0 0 0 0 0 0 0 0 0 0 0 0 0 0 0 0 0 0 0160 0 0 0 0 0 0 0 0 0 0 0 0 0 0 0 0 0 0 0 0162 0 0 0 0 0 0 0 0 0 0 0 0 0 0 0 0 0 0 0 0164 0 0 0 0 0 0 0 0 0 0 0 0 0 0 0 0 0 0 0 0166 0 0 0 0 0 0 0 0 0 0 0 0 0 0 0 0 0 0 0 0168 0 0 0 0 0 0 0 0 0 0 0 0 0 0 0 0 0 0 0 0170 0 0 0 0 0 0 0 0 0 0 0 0 0 0 0 0 0 0 0 0172 0 0 0 0 0 0 0 0 0 0 0 0 0 0 0 0 0 0 0 0174 0 0 0 0 0 0 0 0 0 0 0 0 0 0 0 0 0 0 0 0176 0 0 0 0 0 0 0 0 0 0 0 0 0 0 0 0 0 0 0 0178 0 0 0 0 0 0 0 0 0 0 0 0 0 0 0 0 0 0 0 0180 0 0 0 0 0 0 0 0 0 0 0 0 0 0 0 0 0 0 0 0182 0 0 0 0 0 0 0 0 0 0 0 0 0 0 0 0 0 0 0 0184 0 0 0 0 0 0 0 0 0 0 0 0 0 0 0 0 0 0 0 0186 0 0 0 0 0 0 0 0 0 0 0 0 0 0 0 0 0 0 0 0188 0 0 0 0 0 0 0 0 0 0 0 0 0 0 0 0 0 0 0 0190 0 0 0 0 0 0 0 0 0 0 0 0 0 0 0 0 0 0 0 0192 0 0 0 0 0 0 0 0 0 0 0 0 0 0 0 0 0 0 0 0194 0 0 0 0 0 0 0 0 0 0 0 0 0 0 0 0 0 0 0 0196 0 0 0 0 0 0 0 0 0 0 0 0 0 0 0 0 0 0 0 0198 0 0 0 0 0 0 0 0 0 0 0 0 0 0 0 0 0 0 0 0200 0 0 0 0 0 0 0 0 0 0 0 0 0 0 0 0 0 0 0 0202 0 0 0 0 0 0 0 0 0 0 0 0 0 0 0 0 0 0 0 0204 0 0 0 0 0 0 0 0 0 0 0 0 0 0 0 0 0 0 0 0206 0 0 0 0 0 0 0 0 0 0 0 0 0 0 0 0 0 0 0 0208 0 0 0 0 0 0 0 0 0 0 0 0 0 0 0 0 0 0 0 0210 0 0 0 0 0 0 0 0 0 0 0 0 0 0 0 0 0 0 0 0
- 88 -
REFERENCES ASTM (2008). "Stormwater Pipe Materials."
AWDO (2007). "New insights of Water Security in Asia: III. Urban water management."
BCC (2008). "Housing Development Plan."
BCC (2009). "Longbridge - Area Action Plan."
Brown, R. (2005). "Impediments to Integrated Urban Stormwater Management: The Need for Institutional Reform." Environmental Management 36(3): 455-468.
Defra (2008). "Making Space for Water Urban Flood Risk and Integrated Drainage Pilots: Upper Rea Catchment including Longbridge, Northfield and Rubery Districts of Birmingham."
EC (23 October 2007). "DIRECTIVE 2007/60/EC OF THE EUROPEAN PARLIAMENT AND OF THE COUNCIL of 23 October 2007 on the assessment and management of flood risks ".
EC (2002). "The Water Framework Directive - Tap into it!" ISBN 92-894-1946-6.
FEEM (2008). "mDSS4 USERS’ Guide - INTRODUCTION AND APPLICATION CONTEXT."
http://switchbirmingham.wordpress.com (2009). "Water resources, pressures and issues affecting Birmingham."
http://www.propertyfinder.com/ "Search UK Property and Houses for Sale."
http://www.uklocalarea.com "Browse for UK local area information including census statistics, house prices, council tax, energy prices and more in England and Wales."
Last, E., Mackay, R. (2007). "Developing a New Scope Model for Urban Water Sustainability."
Makropoulos, C. K., K. Natsis, et al. (2008). "Decision support for sustainable option selection in integrated urban water management." Environmental Modelling & Software 23(12): 1448-1460.
Mitchell, V. G. (2006). "Applying Integrated Urban Water Management Concepts: A Review of Australian Experience." Environmental Management 37(5): 589-605.
Mitchell, V. G. and C. Diaper (2003). "UVQ: A tool for assessing the water and contaminant balance impacts of urban development scenarios ".
Mouchel Ltd (2008). "Infoworks Training Documentation."
Parliament Office of Science and Technology, U. (2007). "Urban Flooding."
Price, R. K. and Z. Vojinovic (September 2008). "Urban Flood Disaster Management." Urban Water 5: 259-276.
- 89 -
Severn-Trent-Water (2001). "Upper Rea Main - Drainage Area Plan Review."
SWITCH-Deliverable-Briefing-Note-Template (2008). "SWITCH Approach to Strategic planning for Integrated Urban Water Management (IUWM)."
Tejada-Guibert, J. A. (2006). "Unesco and Urban Water Management."
Wallingtonfordsoftware (2009). "InfoWorks CS - Technical Review."
Wikipedia (2009). "http://www.wikipedia.org/."