Unemployment Insurance and Job Search Activitycy10/public/UI_and_Job_Search...Unemployment Insurance...
34
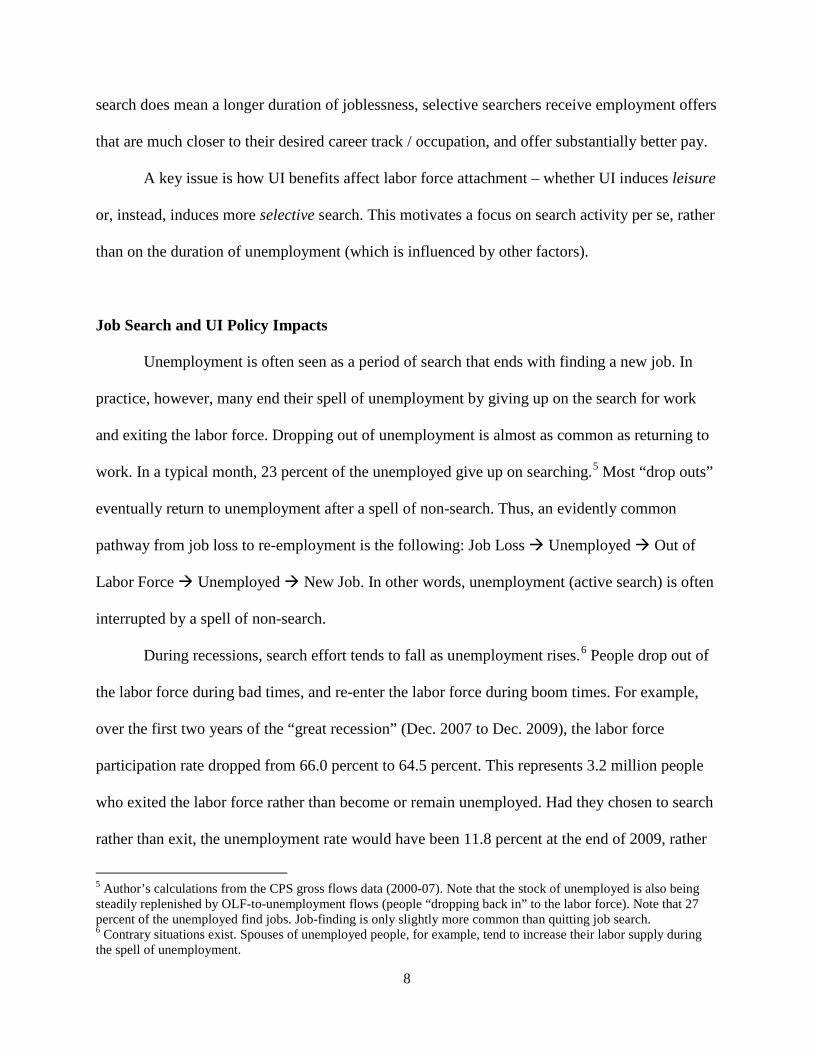
Unemployment Insurance and Job Search Activity: Evidence from Random Audits * Cristobal Young, Stanford University July, 2012 WC: 8,063 Abstract Objective: This paper examines the extent to which Unemployment Insurance (UI) recipients are actively searching for work, and how benefit generosity influences search effort. Critics of the UI program focus on the disincentive of providing income support to the jobless. However, many unemployed people become discouraged, give up on the job search, and drop out of the labor market altogether. From this perspective, UI may help sustain search effort in the face of repeated rejection. Method: Drawing on 378,000 administrative audits of UI recipients’ actual work search records, I test the effect of benefit generosity on the probability of actively searching for work. Results: The results show that 1) the great majority of UI recipients maintain an active work search; 2) higher UI benefits incentivize job search, producing a greater likelihood of active search; 3) search activity declines over time, consistent with discouragement; 4) there is no observed spike in search at benefit exhaustion; and 5) the positive effect of UI benefits on search activity is strongest among low-wage workers. Conclusion: UI appears to support and encourage active job search among people who would otherwise drop out of the labor force. * Direct correspondence to Cristobal Young, Department of Sociology, Stanford University, 450 Serra Mall, Building 120, Room 160, Stanford, CA 94305 ([email protected]). The author would like to thank Paul DiMaggio, Martin Ruef, Sara McLanahan, and Patricia Young for helpful feedback and suggestions. A version of this paper was presented as the 2011 annual meeting of the American Sociological Association.
Transcript of Unemployment Insurance and Job Search Activitycy10/public/UI_and_Job_Search...Unemployment Insurance...
Unemployment Insurance and Job Search Activity:
Evidence from Random Audits *
Cristobal Young, Stanford University July, 2012 WC: 8,063
Abstract
Objective: This paper examines the extent to which Unemployment Insurance (UI) recipients are
actively searching for work, and how benefit generosity influences search effort. Critics
of the UI program focus on the disincentive of providing income support to the jobless.
However, many unemployed people become discouraged, give up on the job search, and
drop out of the labor market altogether. From this perspective, UI may help sustain search
effort in the face of repeated rejection.
Method: Drawing on 378,000 administrative audits of UI recipients’ actual work search records,
I test the effect of benefit generosity on the probability of actively searching for work.
Results: The results show that 1) the great majority of UI recipients maintain an active work
search; 2) higher UI benefits incentivize job search, producing a greater likelihood of
active search; 3) search activity declines over time, consistent with discouragement; 4)
there is no observed spike in search at benefit exhaustion; and 5) the positive effect of UI
benefits on search activity is strongest among low-wage workers.
Conclusion: UI appears to support and encourage active job search among people who would
otherwise drop out of the labor force.
* Direct correspondence to Cristobal Young, Department of Sociology, Stanford University, 450 Serra Mall, Building 120, Room 160, Stanford, CA 94305 ([email protected]). The author would like to thank Paul DiMaggio, Martin Ruef, Sara McLanahan, and Patricia Young for helpful feedback and suggestions. A version of this paper was presented as the 2011 annual meeting of the American Sociological Association.

2
Introduction
How does Unemployment Insurance affect the commitment to search for work? A key
condition of the program is that recipients be actively searching for work. However, economic
search theory suggests the program creates a disincentive to find new employment (Mortensen
1977), and empirical work shows that UI leads to longer durations of unemployment (Card and
Levine 2000; Meyer 1990). These studies do not, however, explicitly look at search activity.1
This paper advances the argument that UI pays people to search for work, creating moral
suasion, material incentives, and financial liquidity in support of search. This may have
important effects in a context where the unemployed are at high risk of quitting search and
dropping out of the labor market. Indeed, in a typical month, a quarter of the unemployed exit the
labor force – almost the same proportion that find a job.2 This general fact has not been well
incorporated into search models. And preventing labor force drop out may be an important side
effect of UI policy. Scholars have found that in Canada, where UI benefits are more generous
and accessible, unemployed workers are much less likely to give up searching for work than in
the United States (Card and Riddell 1997; Riddell and Sharpe 1998). The UI program may
encourage jobless people to remain in the market, and keep searching. Earlier research, though
scattered, has also suggested that UI benefits may reduce the rate of labor force dropout and
increase the likelihood of search (Atkinson and Micklewright 1991; Barron and Mellow 1981).
Much research has examined how Unemployment Insurance affects the rate of job-
finding – consistently showing that generous benefits prolong the duration of unemployment.
However, the reasons for this result are not entirely clear. For some scholars, this work shows
1 Even considering only supply side factors, unemployment duration is a product of both search and reservation wage. 2 Author’s calculations from the CPS gross flows data, 2000-07. See Ilg (2005) for similar estimates from earlier years.

3
that UI subsidizes the price of leisure, reducing the motivation to return to work (Feldstein
2005). For others, this work suggests that committed job searchers are using UI as a way to hold
out for a better job (Chetty 2008). These conflicting interpretations are not yet settled. The
contribution of this study is to look at job search activity, rather than the duration of
unemployment or the rate at which unemployed people find jobs (see also Krueger and Mueller
2010). Searching for work is not the same as actually finding work. This is true even ignoring the
demand side of the labor market. UI may affect either search effort, reservation wages, or both.
By focusing on search activity (rather than job-finding), one can parse out the issue of
reservation wages, and more directly address the issue of how UI affects people’s active efforts
to find a new job.
While research in economics has focused on duration of unemployment, there is a rich
sociological literature on job search activities and strategies (Granovetter 1995, Mouw 2003,
Fountain 2005, Yakubovich 2005). This work, however, has not generally focused on policy or
the unemployment insurance program (though see Sjoberg 2010). This paper combines the
economic focus on UI policy with the sociological focus on actual search activity.
Empirically, this study draws on a unique administrative data set of random audits of UI
recipients’ actual work search records. The data set includes some 378,000 audits, covering all
U.S. states over the years 1988-2006. The results indicate that (1) most UI recipients are engaged
in active work search, and (2) UI generosity increases the probability of searching. This suggests
that, rather than inducing “leisure”, UI helps to sustain a vigorous job search.
Background
The relationship between UI benefits and job finding (ie, the duration of unemployment)
has been extensively studied. There remain active debates over the meaning of the empirical

4
results, which highlights the ambiguity of using re-employment to analyze the impact of
Unemployment Insurance. After reviewing this literature, I discuss how focusing on search effort
(rather than just re-employment) can shed crucial light on our understanding of the UI program.
The generosity of UI benefits directly affects how long people take to find a new job.
Both the dollar amount of benefits, and the duration of those benefits, matter. A 10 percentage
point increase in benefits, on average, leads to a one-week increase in the duration of
unemployment (Card and Levine 2000; Decker 1997; Meyer 1990). This would imply, for
example, that raising the replacement rate from 50 percent to 60 percent would increase the
average duration of unemployment from about 16 weeks to 17 weeks. In terms of benefit length,
Card and Levine (2000) found that an extra 13 weeks of extended benefits prolonged benefit
duration by one week. Katz and Meyer (1990), with larger estimates, find that 13 weeks of extra
benefits would prolong duration by about 2-2.5 weeks. However, a recent study found that, in the
“great recession” (2008-10), the 73 week extension in federal UI benefits produced almost no
increase in the duration of unemployment (for those on UI benefits compared to unemployed
people not eligible for benefits) (Valleta and Kuang 2010).
Research also finds a pronounced spike in re-employment around the time when people’s
UI runs out (eg, Katz and Mayer 1990; Mayer 1990; Card, Chetty, and Weber 2007). Before
benefits expire, the chance of finding a job is about 7 percent per week. At the point when UI
expires, the job-finding rate temporarily spikes up to about 14 percent (Katz and Mayer
1990:990).3 This is partly because some employers recall their laid-off workers exactly at the
3 In 2004, 42% of people on UI received benefits until they ran out (Nicholson and Needels 2006:49). Multiplying this figure by the magnitude of the “spike” (0.42*.07) gives an estimate that 2.9% of people who begin UI spells ‘suspiciously’ find jobs as soon as their benefits end. Card, Chetty, and Weber (2007) analyze data from Austria (which has an American-style UI system), and find that the spike in job finding represents less than 1% of people who receive UI. It is also important to note that after the spike, job-finding falls back to its previous low rate: most people whose UI benefits expire endure a continued long period of fruitless search.

5
week when UI runs out (ie, employers use UI to manage temporary lay-offs). But it is also
because searchers either suddenly find new jobs at the point of benefit exhaustion, or are able to
schedule the start of a new job to occur at the week of benefit exhaustion.
The standard interpretation of this research is that UI furnishes distortionary incentives
that support unproductive leisure. UI subsidizes leisure and encourages people to “choose
excessive spells of temporary unemployment” (Feldstein and Altman 2007:40; Feldstein 2005;
Fredriksson and Holmlund 2006; Krueger and Meyer 2002; Drecker 1997). The concern is well
articulated by one UI recipient, who reported “I’m having the best summer of my life right now.
I’m relaxed, my blood pressure has gone down, I’m eating better and I’m seeing a lot more
people…” (quoted in Havitz et al 2004:52). Based on these concerns, some advocate eliminating
the UI program altogether and replacing it with a system of individual savings accounts that
would reduce the disincentive to find work (Feldstein 2005; Kling 2006; see Vroman 2007 for a
critique).
This labor-leisure interpretation, however, is at odds with research using health and
social-psychological evidence, which shows that people experience unemployment as highly
distressing (Jahoda 1982; Newman 1999). Well-designed, large-scale panel data studies from
both Europe (Andersen 2009; Clark 2003; Lucas et al 2004) and the U.S. (Young, forthcoming;
Dooley et al 2000; Burgard, Brand and House 2007; Strully 2009) report sharp drops in health
and well-being when people become unemployed. The drop in well-being is not accounted for by
the reduction in household income, and is observed even among those who are eligible for UI
benefits (Young, forthcoming). This indicates that unemployment – even insured unemployment
– is not experienced as a period of enjoyable “time away from work” that people wish to linger
6
in for longer than necessary. On the contrary, joblessness appears as highly distressing – a
condition that people are eager to exit.
If people are strongly motivated to find work, why would UI benefits increase the
duration of unemployment? One explanation is that UI beneficiaries search more selectively for
good jobs that fit their specific skills, rather than applying to any job, regardless of quality or
wage. Chetty (2008) and others (Gangl 2006; Acemoglu and Shimmer 2000) argue that many
unemployed people, without some form of income support, are unable to sustain a fruitful job
search. Many unemployed people have little or no savings when they begin their spell of
joblessness (Gruber 2001).4 Moreover, because of credit market imperfections, banks do not give
‘unemployment loans’ to support productive job search. This lack of liquidity encourages people
to end their job search quickly by taking jobs below their skill level. The UI program, from this
view, not so much distorts search incentives but rather corrects for credit market imperfections
and provides resources to help sustain a productive search (ie, search effort that yields a better
quality job match).
Chetty (2008) provides two empirical analyses supporting the liquidity interpretation.
First, he shows that UI benefits increase the duration of unemployment mostly for people who
are credit constrained and who have no liquid wealth reserves. Among those with more wealth,
UI generosity has no significant effect on the duration of joblessness. In short, UI primarily has
an effect on people who are cash poor. Second, the effect of UI benefits is very similar to that of
receiving a lump sum severance payment. Severance packages “provide liquidity but have no
moral hazard effect”, since they are non-distortionary grants that do not affect the incentive to
find work (Chetty 2008:176). With UI, if a person quickly finds a new job, they lose their UI
4 Gruber reports that 17 percent of job losers have no financial assets, and one-third are unable to cover even 10 percent of their income loss from unemployment (Gruber 2001).

7
benefits. However, quick job finders keep their severance pay, and therefore have no
disincentive. Nonetheless, Chetty (2008) shows that 1) people who receive severance packages
take longer to find a new job; 2) more generous severance pay incrementally increases jobless
durations; and 3) severance pay does not have an effect on people who already have high
reserves of wealth.
Taken together, these results suggest that receiving UI benefits has very similar
consequences as having greater savings, more access to credit, or receiving a lump sum
severance package. Chetty concludes that “60 percent of the increase in unemployment durations
caused by UI benefits is due to a ‘liquidity effect’ rather than distortions on…incentives to
search (‘moral hazard’)” (2008:173). UI increases unemployment duration mostly because it
supports people who are cash poor and could not otherwise sustain productive search effort. In
other words, UI supports search effort, but raises reservation wages.
A series of research papers find that UI benefits can lead to better re-employment
outcomes. Gangl (2004; 2006) using matched micro data from the US and Europe, shows that
lower UI benefits lead to shorter unemployment durations, but also lead to re-employment at low
wages; generous UI systems generate longer durations of joblessness but lead to re-employment
with comparatively good wages (see also McCall and Chi (2008); DiPrete and Gangl (2004), and
Adison and Blackburn (2000)). Centeno (2004) shows that UI benefits lead to jobs with longer
tenure – suggesting both employer and employee are more satisfied with the quality of the
match.
More broadly, Pager and Pedulla (2011) find that a more selective search (applying to a
more narrow range of job positions) has long-term benefits. They report that while a selective
8
search does mean a longer duration of joblessness, selective searchers receive employment offers
that are much closer to their desired career track / occupation, and offer substantially better pay.
A key issue is how UI benefits affect labor force attachment – whether UI induces leisure
or, instead, induces more selective search. This motivates a focus on search activity per se, rather
than on the duration of unemployment (which is influenced by other factors).
Job Search and UI Policy Impacts
Unemployment is often seen as a period of search that ends with finding a new job. In
practice, however, many end their spell of unemployment by giving up on the search for work
and exiting the labor force. Dropping out of unemployment is almost as common as returning to
work. In a typical month, 23 percent of the unemployed give up on searching.5 Most “drop outs”
eventually return to unemployment after a spell of non-search. Thus, an evidently common
pathway from job loss to re-employment is the following: Job Loss Unemployed Out of
Labor Force Unemployed New Job. In other words, unemployment (active search) is often
interrupted by a spell of non-search.
During recessions, search effort tends to fall as unemployment rises.6 People drop out of
the labor force during bad times, and re-enter the labor force during boom times. For example,
over the first two years of the “great recession” (Dec. 2007 to Dec. 2009), the labor force
participation rate dropped from 66.0 percent to 64.5 percent. This represents 3.2 million people
who exited the labor force rather than become or remain unemployed. Had they chosen to search
rather than exit, the unemployment rate would have been 11.8 percent at the end of 2009, rather
5 Author’s calculations from the CPS gross flows data (2000-07). Note that the stock of unemployed is also being steadily replenished by OLF-to-unemployment flows (people “dropping back in” to the labor force). Note that 27 percent of the unemployed find jobs. Job-finding is only slightly more common than quitting job search. 6 Contrary situations exist. Spouses of unemployed people, for example, tend to increase their labor supply during the spell of unemployment.

9
than 10.0 percent.7 Experience from past recessions show that these people will likely return to
search as the labor market improves.
Discouragement occurs when people grow alienated from the world of work, and doubt
whether the job market has a place for them. Being rejected by a potential employer (or sending
out unanswered job applications) carries a psychological cost, and repeated rejection may wear
down job searchers (Newman 1999). People may respond to this by simultaneously searching for
a new position outside the labor force. They may return to school or focus on household
production and child rearing – options that confer “job-like social status” in the absence of
market employment. Job searchers may also become discouraged and are simply
stalling/avoiding search activities. All of these are strategies for minimizing the psychological
costs of rejection and unsuccessful search.
Standard search models assume that the cost of searching is simply the opportunity cost
(ie, one could be doing something else with their time). But search effort is also costly because
job applicants are exposed to rejection and negative assessments of their value. Thus, job
applications carry two risks: 1) a (positive) risk of receiving a job offer; and 2) a (negative) risk
of rejection and disappointment. When people believe their chances of receiving an offer are
small, they may improve their temporary well-being by not applying to jobs. This is the same
principle as reciprocal liking (eg, Sprecher 1998), or avoiding people who do not like us. Of
course, this comes at the cost of even lower chances of receiving an offer (assuming the baseline
odds are not strictly zero). This is the challenge of search persistence: finding motivation that
overcomes discouragement / disappointment as long as the chance of a job offer remains non-
zero.
7 Author’s calculations using the aggregate Current Population Survey data. The alternative unemployment rate is computed by holding the labor force participation rate constant at the December 2007 rate.

10
Given that so many people end unemployment (at least temporarily) by quitting search, a
key question is, what sustains job search effort? Unemployment Insurance may support search
persistence for two complimentary reasons: program requirements and liquidity support.
First, the UI program pays the unemployed to search for work, in that benefits are
technically contingent on search activity. In practice, search is rarely verified, though the
program generally makes it quite clear that search is expected, and that episodes of non-search
call for penalties.8 There is a combination of moral suasion and material incentives that can
induce search persistence and discourage labor force drop-out. This leads to the expectation that
those on UI will be more likely to search than those not receiving UI benefits.
Existing research finds that violations of UI search requirements are rare. Ashenfelter et
al (2005), drawing on randomized experiments in four US states, found that stricter monitoring
of UI search requirements had essentially no effect on disqualifications or claim durations,
indicating that few violations were detected. This, they conclude, contradicts “the perception that
these programs are riddled with abuse” (Ashenfelter et al 2005:53). This also offers some
evidence that people treat UI as something like a job, committing themselves to search effort in
return for benefits.
Second, the UI system provides liquidity. As emphasized by Chetty (2008) and
Acemoglu and Shimmer (2000), liquidity changes people’s search strategy, broadening their
search horizon and raising expectations of eventually finding a “good job”. Greater liquidity may
lower the odds of discouragement and labor force exit (from unemployment to OLF). When
people believe that unemployment means a desperate search for a bad job, they are more likely
to become demoralized, and look for credible exit routes from the job market. However, having
8 In practice, the penalties for non-search are not that high: failure to search during a benefit week generally means that the week’s benefits must be re-paid. At the same time, many UI recipients are uncertain what the penalty for non-search is, and may imagine harsher consequences such as denial of future benefits.
11
enough liquidity to support a sustained and longer-term search may raise people’s beliefs in
finding “not just a job, but the right job” (Centeno 2004:841). Thus, the liquidity and hold-out
power offered by UI benefits may lead more people to believe that job search is a more
promising venture, with a more promising conclusion – i.e., that it leads to a job that will be
worth the difficult process of finding it. UI liquidity may help people’s persistence in applying
for the long-shot job openings, and help them to see applications as a longer-term numbers game
rather than an immediate challenge of success or failure. In short, UI may help people lengthen
their search horizon to see better prospects.
Through the joint processes of program requirements and tangible liquidity, UI can raise
the labor force attachment of the unemployed. Card and Riddell (1997), using micro-data from
the US and Canada, give strong evidence supporting this hypothesis. They show three key
findings: 1) UI recipients spend more weeks in job search than observationally-similar people
who do not receive UI benefits; 2) in Canada, where UI benefits are more generous and more
available, non-working people are significantly more likely to be searching for work than their
American counterparts; and 3) the increase in job search is most pronounced for people who just-
barely qualify for UI benefits.9 As Riddell concludes, “UI receipt results in job search by
individuals who would not otherwise look for work” (1999:22).
This framework can be translated into an incremental model by focusing on UI program
generosity. The intuition is that the impact of UI eligibility is weighted by benefit levels: a more
generous UI package has greater eligibility effects, so the more generous the UI system, the
greater the impact it has on real behavior. This gives the main hypothesis of this study: the
greater the generosity of UI, the greater the probability of searching for work. I also examine
9 It is worth noting that this analysis is based on the share of non-working weeks that are spent unemployed (searching) rather than OLF (not searching). They do not have data on specific search activities or behavior. This study, using audits of search activities, makes a credible step forward in testing these results.

12
how search activity varies as recipients approach the end of their 26 weeks of benefits, and
whether there is a spike in search activity at the point of benefit exhaustion (Katz and Mayer
1990). Finally, I test whether people with higher savings are less sensitive to UI benefits (the
liquidity effect identified by Chetty 2008).
Data
Since 1988, the US Department of Labor has organized random audits of unemployment
insurance payments, investigating “the UI claimant's… efforts to find suitable work” (US DOL,
2007a).10 Titled the Benefit Accuracy Management (BAM) program, state UI investigators
interview claimants and employers, and seek to verify each reported work search contact. The
program makes detailed efforts to estimate the rate of misreporting/fraud among UI claimants,
and administrative errors by UI offices. Persons in violation of state rules are required to repay
overpayments they received during the audit week.11 The DOL samples about 40,000 UI
payments each year, and the records include basic demographic information.
The combined data set (1988-2006) contains records on 610,479 audits. Of these, 28
percent were not required to search for work because they were awaiting a definite recall, or
attending an approved training program.12 This brings the sample to 438,979. Missing data on a
number of variables reduced the sample to 368,138, or 84% of those required to search for work.
Adequate job search is a determination by the auditor that a UI recipient successfully met
search requirements, as defined by state rules. Auditors are regular UI case file workers,
10 Outside of these audits, actual verification of job search is rarely done, due to the enormous monitoring effort that would be required. Roughly 9 million people use the UI system each year, for an average duration of 14 weeks, giving an aggregate 135 million person-weeks of job search to be verified (O’Leary 2006:27). 11 It is worth noting that states are not penalized for non-search among their UI populations. States do not have an incentive to under-report violations of search rules. 12 Pennsylvania does not require an active job search.

13
checking the records of recipients in the local UI office. Outcomes of the audits do not affect
state or local UI funding. Rather, the audits feed into a national administrative report on the level
of UI recipient compliance with program rules (including, for example, the accuracy of benefit
denial decisions).
State UI systems have different job search requirements, and specific rules may change
over time. Some states require more job search than others. BAM evaluates the extent to which
claimants are meeting the current search requirements of their state system. It is important to
recognize that compliance in one state could be non-compliance in another. States with stricter
search and enforcement standards, other things being equal, will have higher rates of inadequate
search (lower rates of adequate search) (see O’Leary 2006 for more detail on state rules). Thus,
the Department of Labor strongly cautions against interpreting differences across states. This
creates some particular difficulties for testing the effect of program parameters on search effort,
since cross-state differences are frequently used as identifying variation in program generosity.
This study controls for state differences using a fixed effects model, meaning that variation
across states is excluded from the analysis. The very large sample size helps facilitate an analysis
entirely on within-state individual variation in benefits.
It is possible that some UI recipients are searching purely to satisfy program
requirements, applying to jobs they do not want or for which they are unqualified. Hence, some
recipients may be technically following behavioral search requirements, but are not truly trying
to find a job. This is essentially a problem of measurement error in the outcome variable.
However, there are clear strengths of the data that should be emphasized. First, information on
job search is not self-reported, but rather is based on the conclusion of an auditor’s independent
investigation. This alleviates concerns about “social acceptability bias”, recall error, and the like.

14
Second, both base-period wages and UI benefit amounts are observed from administrative
records. This information is rarely available even from survey data. Most studies of UI do not
observe the individual’s qualifying income, or what benefits they actually receive. A common
strategy is to impute state-level maximum benefit amounts as the measure of UI generosity.
Many studies, moreover, do not have direct information on whether an individual is even
receiving benefits (instead relying on estimates of benefit eligibility) (Blank and Card 1991;
Gruber 1997; Chetty 2008; Young, forthcoming). Thus, a random sample of UI recipients with
known levels of UI benefits and base period earnings, as well as audited job search records,
offers a unique look at the relationship between UI and job search.
[Table 1: Descriptive Statistics]
[Figure 1: Non-Search and Unemployment Rates, 1988-2006]
A descriptive summary of the data set is given in Table 1. In the overall sample, 94.9
percent of UI recipients met their state search requirements. The remaining 5.1 percent were
found to have failed search expectations during their audit week. It is not clear what level of
search / non-search would be expected overall. However, it is worth noting that persons on UI
are a sub-set of the unemployed who have enough work experience and past earnings to qualify
for benefits (only about 50 percent of the jobless qualify). UI recipients are a select group of
unemployed who are strongly attached to the labor force.
Figure 1 plots the annual rate of search violations – the percentage of UI claimants that
failed to maintain an adequate search in their audit week – along with the annual unemployment
rate in the United States. The rate of non-search declined in the late 1980s from over 7 percent to
15
5 percent by 1991, and has since remained relatively stable, tracking the national unemployment
rate. This is consistent with the pro-cyclical pattern of labor force participation – people tend to
quit searching when unemployment is high.
Identification Issues
Unemployment Insurance benefits are based in large part on a worker’s “base period”
(previous year) earnings – those with higher earnings receive higher benefits. To find an
exogenous source of benefit generosity, it is crucial to strip out the effect of base period earnings.
This study exploits variation in the timing of previous-year income flows to provide diffuse but
plausibly exogenous shocks to benefit generosity. The following section explains the
identification strategy.
Weekly benefit amounts increase with earnings up to the state UI maximum benefit level.
After this maximum, higher income does not translate into higher benefits. This gives clear
empirical space for identifying the effect of earnings separately from benefits (variation in
earnings at a constant benefit level). The relationship between base period income and weekly
benefit amounts is shown in Figure 2 below. Evidence for the effect of earnings conditional on
benefit amounts mostly comes from the higher end of the earnings distribution. Below earnings
of $30,000, benefits and earnings are strongly correlated and hard to disentangle.
[Figure 2: UI Benefit Amounts by Base Period Earnings]
Evidence for the effect of benefits conditional on earnings comes from less clear-cut
sources. There is no specific, obvious place in the distribution where earnings are fixed but
benefits vary. The main source of benefit variation, therefore, is heterogeneity in the mapping of

16
earnings to benefit amounts. UI policy, in most states, is very complex. UI benefits depend not
only on the amount of earnings, but also on the timing of earnings. Benefits in most states are
based on earnings in one’s best quarter of the previous year (base period). People with an
outstanding three-month period of earnings generally receive more generous benefits than people
that had stable and consistent earnings throughout the year. As the Department of Labor notes,
“depending on the distribution of wages in the base period, workers with the same total base
period wages can have… different weekly benefit amounts” (US DOL 2005: 3-21). This offers
plausibly exogenous variation in benefit amounts among people in the same state with the same
annual (base period) earnings.
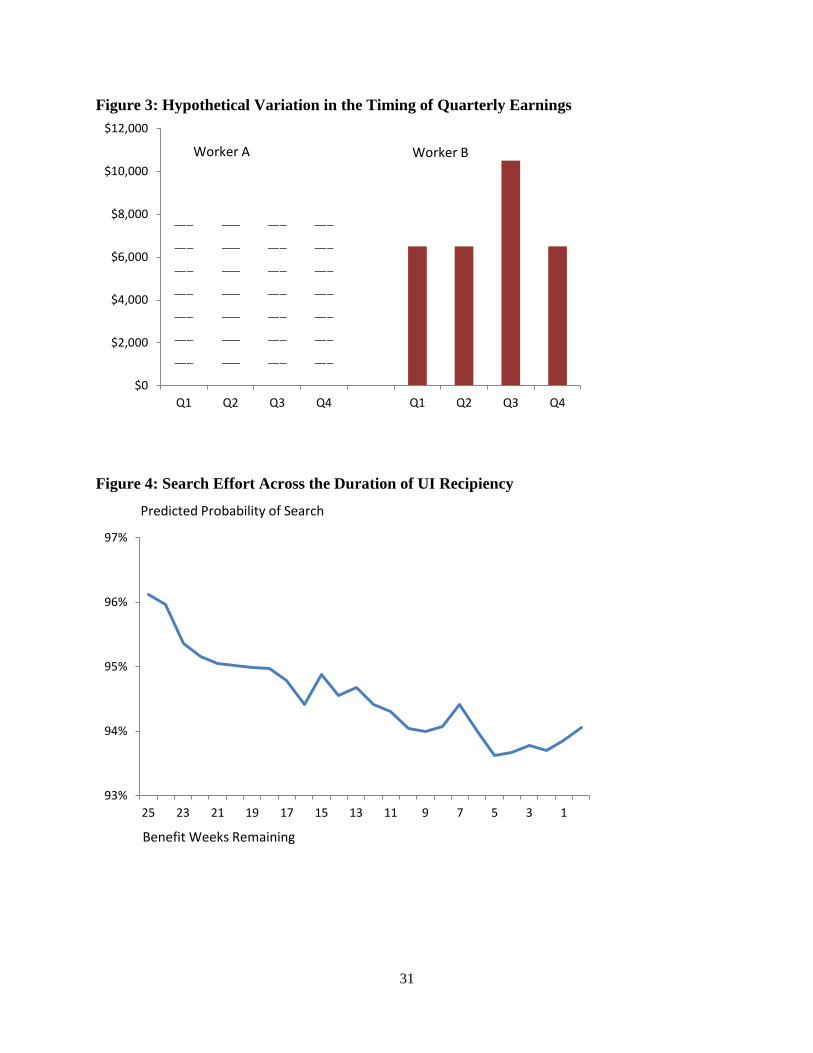
To visualize this, Figure 3 shows hypothetical variation in the timing of quarterly
earnings for two workers who each have $30,000 in annual income. Worker A made $7,500
consistently each quarter. Worker B made $6,500 in three quarters, but had one strong quarter
making $10,500. Both have the same annual earnings, but the timing of the income flows means
that B will have higher benefit amounts than A. Using a simple, back-of-the-envelope
calculation, A will get about $310 per week, while B will get about $440.13 These are
significantly different benefit amounts, due to differences in the timing of their past earnings.
Only five states determine benefits based purely on annual wages. For the other 46 states, the
timing of past income flows directly affects individual benefit amounts (O’Leary and Rubin
1997). This provides micro-variation in the relationship between earnings and benefits. The sum
of this variation due to idiosyncratic timing of earnings is large and diffuse, and allows credible
identification of the effect of benefit amounts. To my knowledge, no previous research has
exploited this source of variation to estimate UI policy effects.
13 Benefit amounts generally equal 50% of earnings in the best quarter, divided by 12 to get the weekly amount. The actual formulas UI agencies use are more complicated due to benefit maximums and other issues.

17
[Figure 3: Hypothetical Variation in in the Timing of Quarterly Earnings] .
In contrast, a common empirical strategy is to examine cross-sectional data on whether
high UI benefits in a state lead to high durations of unemployment. Card and Levine (2000)
emphasize the identification problem with this strategy: endogenous policy adoption. Some
states may have generous benefits because they have high unemployment. At the same time,
high unemployment rates lead to discouragement. Low chances of finding a job cause
discouragement among workers and lead to lower search effort. Such a combination of effects
gives a misleading impression that UI benefits create high unemployment and/or low search
effort. The current identification strategy avoids this bias, by focusing on variation in benefit
amounts within states (Card and Levine 2000).
A counter risk, however, is that the earnings volatility that creates within-state differences
in benefit amounts may introduce its own bias. Jobs with higher earnings instability may be less
desirable jobs, and people eligible for those jobs may search less strenuously than do other job
candidates. This concern is not immediately clear: even Wall Street bankers and corporate
lawyers face strong seasonal fluctuations in earnings due to commissions, year-end bonuses, and
the like. Still, research shows that high-paying jobs on average tend to have less earnings
instability (Drewianka 2010). The real concern is that non-wage aspects of job quality may be
correlated with search effort. This is a problem if jobs with high earnings instability have low
“non-wage job quality”. This, to some degree, runs counter to the theory of compensating
differentials: jobs with high earnings instability should compensate by improving other aspects of
job quality. In any event, if seasonal fluctuation in earnings is a marker for low overall job
18
quality, then this research strategy will likely be biased towards a null or negative result.14 In
other words, the possibility of lingering endogeneity makes this is a conservative test of whether
UI benefits increase job search attachment.
Model
The outcome variable in this study, adequate search, is an indicator variable coded 1 if
search is performed and zero otherwise. Search is modeled as a function of base period earnings
(𝐵𝑃𝑖), real weekly benefit amounts (𝑊𝐵𝐴𝑖), remaining weeks of UI benefits (𝑤𝑒𝑒𝑘𝑠𝑙𝑒𝑓𝑡𝑖), as
well as a vector of individual-level controls (𝑿), and a vector of state-level controls (𝑺),
including state fixed effects. Using the probit estimator gives the following model
𝑃𝑅(𝑌 = 1 | 𝐵𝑃𝑖,𝑊𝐵𝐴𝑖 ,𝑤𝑒𝑒𝑘𝑠𝑙𝑒𝑓𝑡𝑖,𝑿,𝑺)
= Φ(𝛼𝐵𝑃𝑖 + 𝛽𝑊𝐵𝐴𝑖 + 𝜆𝑤𝑒𝑒𝑘𝑠𝑙𝑒𝑓𝑡𝑖 + 𝑿𝜹 + 𝑺𝜸 )
where Φ is the cumulative standard normal distribution function.
Results
Models 1 through 4 show how the probability of search varies with base period wages
(past earnings) and benefit amounts (the policy effect). Those with higher past earnings, and
those with higher benefits, are more likely to be actively searching for work. The probability of
search increases both with base period wages (model 1) and benefit amounts (model 2). Model 3
shows both factors to be jointly significant. Model 4 adds in a wide range of controls. In this
model, the marginal effects indicate that increasing benefits by $150 per week leads to a one
14 To be clear, the assumption is that low job quality discourages search effort. If earnings volatility is a marker of a “bad job” (conditional on average earnings), then the expectation is that people will be less likely to search. If so, the extra UI benefits caused by earnings volatility will (incorrectly) appear to reduce search effort.

19
percentage point increase in the probability of search. This magnitude is small. Nonetheless, the
central finding is that UI benefits increase labor force attachment.
[Table 2. Regression Results for Job Search]
The number of weeks left remaining in one’s UI spell is positive (each week raises the
search probability by 1 percent). In other words, search effort is highest at the beginning of a UI
spell, and declines as remaining weeks of UI approach zero. This is contrary to the search model
expectation (eg, Mortensen 1977). Figure 4 shows a non-parametric specification, giving the
predicted probability of search at each week of benefit recipiency. This shows a nearly linear
decline in search effort over the length of the UI spell (as in the model 4 specification). This
suggests a pattern of discouragement, where search effort declines over time and with the
number of rejections they receive from employers. The newly unemployed initially believe in the
efficacy of search, but grow disillusioned over time.15 Notably absent is a spike in search effort
immediately preceding the end of UI benefits (Katz and Meyer 1990).
[Figure 4: Search Effort Across the Duration of UI Recipiency]
Education raises search effort, consistent with the view that market prospects determine
search effort. Also supporting this view is the quadratic effect of age, with search effort peaking
at age 56 and declining slowly thereafter. Middle-career workers search much more than young
people.
15 This may also be due simply to “survivor selection,” whereby the most intensive searchers exit UI early in their spell, leaving a pool of less intensive searchers at longer UI spells.

20
Men have a lower probability of search than women. Surprisingly, neither union
membership nor recall expectations affect the probability of search. By race/ethnicity, there are
strong and well-defined effects for blacks, who are less likely to search than are (non-Hispanic)
whites. Asians also have a lower probability of search, though the standard error is much larger
than for blacks and the coefficient fails to achieve significance. Hispanics and American Indians
are also less likely to search than whites, though the magnitude of these effects is lower.
Finally, the state-level unemployment rate and UI recipiency rate are both insignificant
and trivial in magnitude. However, as the models control for fixed state effects, these variables
only capture within-state changes over time – which offers substantially less identifying variation
than would a cross-state analysis.
Interaction Results
This paper follows the approach of Chetty (2008) to test whether the effect of UI benefits
is stronger for those in most need of temporary liquidity. The data set does not contain
information about individuals’ wealth, savings, or credit capacity. For this analysis, I simply
partition the data into quartiles according to base period earnings. I assume that lower income
earners have little available liquidity to support job search (and thus should be highly sensitive to
UI), while the highest income earners have more resources on their own and are less sensitive to
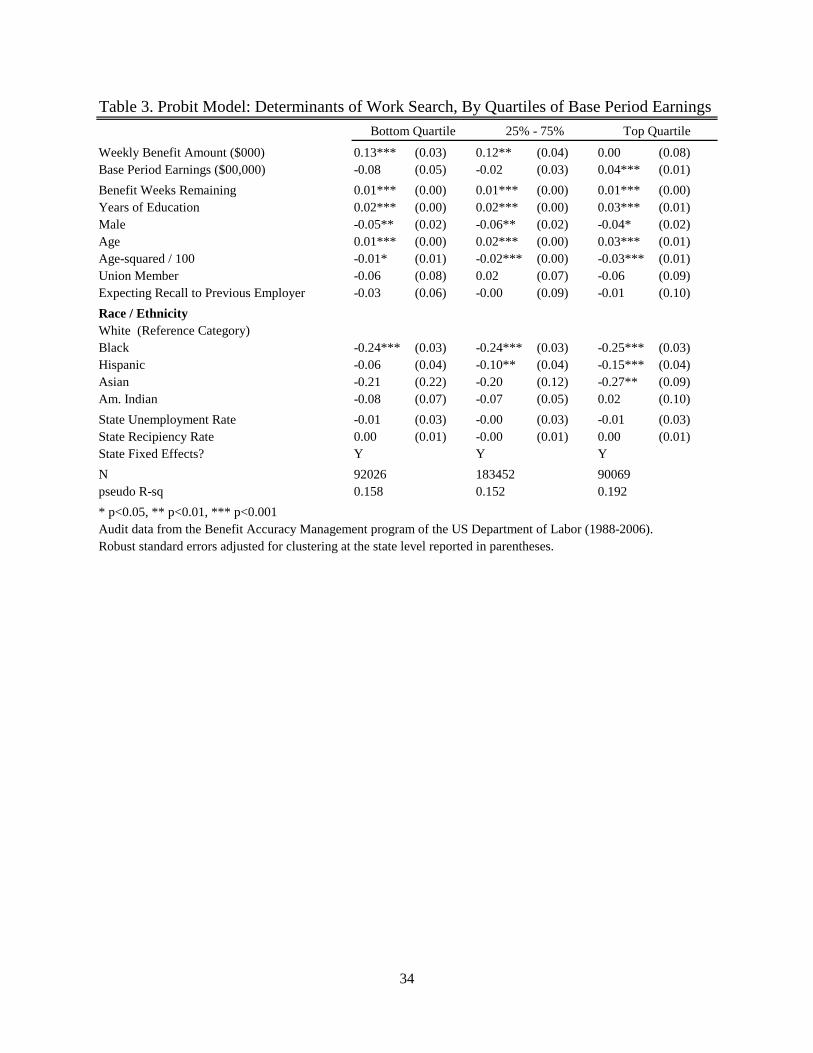
their received benefit amount (Gruber 2001). Table 3 reports analyses for the bottom, combined
middle two, and top quartiles. The main cut points of base period earnings are $12,800 (25th
percentile) and $32,000 (75th percentile).
The results support expectations from the liquidity model. Those with the lowest earnings
are much more sensitive to benefit amounts than in the overall sample (model 4 above). The
middle two quartiles show similar results. In the top quartile of earnings, however, search is not

21
affected by variation in benefit amounts. This suggests that high income recipients have stocks of
savings or credit capacity that makes UI much less important as a source of temporary liquidity
to support job search. One possibility is that that everyone in the top quartile is already at their
maximum benefit amount and so there is no variation to analyze. However, this is not the case:
in the top quartile of base period earnings there is actually much more variation in benefit
amounts than in the bottom quartile (standard deviation of $172 compared to $28). People with
higher incomes levels have plenty of variation in their UI benefits, but that variation does not
affect their search effort.
[Table 3. Regression Results by Quartiles of Base Period Earnings]
Conclusion
This study examines job search effort among UI recipients using more than 300,000
administrative audits of reported search activity. The results show that the vast majority of UI
recipients are maintaining an active job search. Moreover, and consistent with work by Card and
Riddell (1997), this study finds that UI benefit generosity incentivizes and increases the
probability of job search. This effect is modest: a $150 increase in benefit amounts leads to a 1
percentage point increase in search likelihood. The baseline rate of job search among UI
recipients is already very high, and additional spending on UI benefits does not leverage a great
deal of additional search activity. Nonetheless, the results give an important qualitative
conclusion: more generous UI benefits lead to greater, rather than lesser, levels of search
commitment. This is likely because the UI program pays people to search, and provides financial

22
liquidity to support a search for the right job. Without UI – or with lower levels of benefits – the
unemployed are more likely to become discouraged and give up on the search for work.
Search effort – or more precisely, the probability of actively searching for work – is
highest at the beginning of people’s UI spell, and declines slowly but steadily over time. This
suggests a process of discouragement, where the accumulation of rejected job applications
demoralizes searchers, resulting in less search effort or a temporary exit from the labor force. In
contrast to studies on the duration of joblessness, there is no evidence of a spike in search effort
at the point of benefit exhaustion.
Finally, the positive effect of UI on search is driven by recipients with lower base period
(previous year) earnings, and not evident at all among those in the top quartile of earnings. As in
Chetty (2008), UI has its strongest effects among those who are relatively cash poor and need
temporary liquidity to support a rigorous job search.
This study highlights the shortage of research on search persistence. It is common for the
unemployed to give up searching and exit the labor force – dropping out is almost as frequent as
finding work. More research on why people quit job search, and what factors encourage search
persistence, would help fill a salient gap in our knowledge of labor force activity.
One limitation of the current study is that search effort is defined as compliance with
state UI search requirements. This is not, per se, a problem for the internal validity of the
estimates, as identification of the policy effect is from within-state variation in benefits.
Nevertheless, a more standardized metric of search (such as hours of search or number of job
applications) would be beneficial and advance understanding of the sensitivity of search activity
to policy parameters.
23
Triangulating on the current findings, future research could look at the rate of job search
drop-out (transitions from unemployment to OLF) in states with low- and high-generosity UI
systems. The “gross flows” data from the Current Population Survey would be a fitting data set
(Ilg 2005). The results reported here would predict that, in states with more liberal eligibility
rules and more generous benefit levels, there should be a lower rate of labor force drop-out. In
other words, UI supports and encourages job search among people who would otherwise drop-
out of the labor force.

24
References:
Acemoglu, Daron and Robert Shimer. 2000. “Productivity Gains from Unemployment
Insurance.” European Economic Review. Vol. 44(7):1195-1224.
Andersen, Signe. 2009. “Unemployment and Subjective Well-Being: A Question of Class?”
Work and Occupations. Vol. 36(1):3-25.
Ashenfelter, Orley. 1978. “Estimating the Effect of Training Programs on Earnings.” Review of
Economics and Statistics. Vol. 60(1): 47-57.
Ashenfelter, Orley, David Ashmore, and Olivier Deschenes. 2005. “Do unemployment insurance
recipients actively seek work? Evidence from randomized trials in four U.S. States.”
Journal of Econometrics. Vol. 125(1-2):53-75.
Atkinson, Anthony, and John Micklewright. 1991. “Unemployment Compensation and Labor
Market Transitions: A Critical Review.” Journal of Economic Literature. Vol. 29:1679-
1727.
Barron, John, and Wesley Mellow. 1981. “Changes in Labor Force Status Among the
Unemployed.” Journal of Human Resources. Vol. 16(3):427-41.
Blank, Rebecca, and David Card. 1991. “Recent Trends in Insured and Uninsured
Unemployment: Is There an Explanation?” Quarterly Journal of Economics. Vol. 106(4):
1157-89.
Burgard, Sarah A., Jennie E. Brand, and James S. House. 2007. “Toward a Better Estimation of
the Effect of Job Loss on Health.” Journal of Health and Social Behavior. Vol. 48:369-
384.
Card, David, and Craig Riddell. 1997. “Unemployment in Canada and the United States: A
Further Analysis.” Pp. 47-87 in Eaton, Curtis, and Richard G. Harris (eds.). Trade,
25
Technology and Economics: Essays in Honour of Richard G. Lipsey. Cheltenham, U.K.:
Edward Elgar.
Card, David, and Philip Levine. 2000. “Extended Benefits and the Duration of UI Spells:
Evidence from the New Jersey Extended Benefit Program.” Journal of Public
Economics. Vol. 78:107-38.
Centeno, Mario. 2004. “The Match Quality Gains from Unemployment Insurance.” Journal of
Human Resources. Vol. 39(3): 839-63.
Chetty, Raj. 2008. “Moral Hazard versus Liquidity and Optimal Unemployment Insurance.”
Journal of Political Economy. Vol. 116(2):173-234.
Corson, Walter, Stuart Kerachsky, and Ellen Kisker. 1988. “Work Search Among
Unemployment Insurance Claimants: An Investigation of Some Effects of State Rules
and Enforcement.” Occasional Paper 88-1. Unemployment Insurance Service.
Washington, DC.
Decker, Paul T. 1997. “Work Incentives and Disincentives.” Pp 286-320, in O’Leary,
Christopher, and Stephen Wandner (eds.). Unemployment Insurance in the United States:
Analysis of Policy Issues. Kalamazoo, MI: W.E. Upjohn Institute for Employment
Research.
Department of Labor (DOL). 2005. “Monetary Entitlement.” Comparison of State
Unemployment Laws. Washington, D.C.: Department of Labor, Employment and
Training Administration.
Feldstein, Martin. 2005. “Rethinking Social Insurance.” American Economic Review. Vol.
95(1):1-24.

26
Fredriksson, Peter, Bertil Holmlund. 2006. “Improving Incentives in Unemployment Insurance:
A Review of Recent Research.” Journal of Economic Surveys. Vol. 20(3): 357-86.
Gangl, Markus. 2004. “Welfare States and the Scar Effects of Unemployment: A Comparative
Analysis of the United States and Germany.” American Journal of Sociology. Vol.
109(6): 1319-64.
Gangl, Markus. 2006. “Scar Effects of Unemployment: An Assessment of Institutional
Complementarities.” American Sociological Review. Vol. 71(6):986-1013.
Granovetter, Mark. 1995. Finding a Job: A Study of Contacts and Careers. Chicago, IL:
University Of Chicago Press.
Gruber, Jonathan. 1997. “The Consumption Smoothing Benefits of Unemployment Insurance.”
American Economic Review. Vol. 87(1):192-205.
Gruber, Jonathan. 2001. “The Wealth of the Unemployed.” Industrial and Labor Relations
Review. Vol. 55(1): 79-94.
Halvitz, Mark, P Morden, and D Samdahl. 2004. The Diverse Worlds of Unemployed Adults:
Consequences for leisure, lifestyle, and well-being. Waterloo, Canada: Wilfrid Laurier
University Press.
Ilg, Randy. 2005. “Analyzing CPS Data Using Gross Flows.” Monthly Labor Review.
September: 10-18.
Jahoda, Marie. 1982. Employment and Unemployment: A Social-Psychological Analysis.
Cambidge: Cambridge University Press.
Katz, Lawrence, and Bruce Meyer. 1990. “The Impact of Potential Duration of Unemployment
Benefits on the Duration of Unemployment.” Journal of Public Economics. Vol. 41(1):
45-72.
27
Kling, Jeffrey. 2006. “Fundamental Restructuring of Unemployment Insurance: Wage-Loss
Insurance and Temporary Earnings Replacement Accounts.” Brookings Institution.
Discussion Paper 2006-05.
Krueger, Alan, and Andreas Mueller. 2010. “Job Search and Unemployment Insurance: New
Evidence from Time Use Data.” Journal of Public Economics. Vol. 94(3-4): 298-307.
Meyer, Bruce. 1990. “Unemployment Insurance and Unemployment Spells.” Econometrica. Vol.
58(4):757-82.
Marimon, R, and F Zilibotti. 1999. “Unemployment vs. Mismatch of Talents: Reconsidering
Unemployment Benefits.” Economic Journal. Vol. 109:266-91.
Mouw, Ted. 2003. “Social Capital and Finding a Job: Do Contacts Matter?” American
Sociological Review. 68(December):868-898.
Newman, Katherine. 1999. Falling From Grace: Downward Mobility in the Age of Affluence.
Berkeley: University of California Press.
O’Leary, Christopher. 2006. “State UI Job Search Rules and Reemployment Services.” Monthly
Labor Review. Vol. 129(6):27-37.
O’Leary, Christopher, and Murray Rubin. 1997. “Adequacy of the Weekly Benefit Amount.” Pp
163-210 in O’Leary, Christopher and Stephen Wandner (eds.). Unemployment Insurance
in the United States: Analysis of Policy Issues. Kalamazoo, MI: W.E. Upjohn Institute for
Employment Research.
Pager, Devah, and David Pedulla. 2011. “Race, Self-Selection, and the Job Search Process: A
Case Study of the Unemployed in New Jersey.” Paper presented at ASA, Las Vegas.

28
Riddell, Craig, and Andrew Sharpe. 1998. "The Canada-U.S. Unemployment Rate
Gap: An Introduction and Overview." Canadian Public Policy. Vol. 24(Supplement): S1-
S37.
Riddell, Craig. 1999. “Canadian Labour Market Performance in International Perspective.”
Canadian Journal of Economics. Vol. 32(5):1097-1134.
Sjoberg, Ola. 2010. “Social Insurance as a Collective Resource: Unemployment Benefits, Job
Insecurity and Subjective Well-being in a Comparative Perspective.” Social Forces. Vol.
88(3):1281-1304.
Sprecher, Susan. 1998. “Insiders' Perspectives on Reasons for Attraction to a Close Other.”
Social Psychology Quarterly. Vol. 61(4):287-300.
Strully, Kate. 2009. “Job Loss and Health in the U.S. Labor Market.” Demography. Vol.
46(2):221-46.
US DOL (Department of Labor). 2005. Comparison of State Unemployment Insurance Laws
2005. Washington, DC.
US DOL (Department of Labor). 2007. Benefit Accuracy Measurement Methodology and
Program Description. http://workforcesecurity.doleta.gov/unemploy/bqc.asp. Accessed
9/14/2007.
Vroman, Wayne. 2007. “Strengthening Unemployment Insurance: A Critique of Individual
Accounts and Wage Loss Insurance.” Economic Policy Institute. Briefing Paper #202.
Wandner, Stephen, and Andrew Stettner. 2000. “Why are Many Jobless Workers Not Applying
for Benefits?” Monthly Labor Review. June: 21-32.
Winkelmann, Liliana, and Rainer Winkelmann. 1998. “Why are the Unemployed So Unhappy?
Evidence from Panel Data.” Economica. Vol. 65(257):1-15.
29
Valletta, Rob, and Katherine Kuang. 2010. "Extended Unemployment and UI Benefits." Federal
Reserve Bank of San Francisco Economic Letter. [Link]
Yakubovich, Valery. 2005. “Weak Ties, Information, and Influence: How Workers Find Jobs in
a Local Russian Labor Market.” American Sociological Review. Vol. 70(3):408-421.
Young, Cristobal. 2011. “Losing a Job: The Non-Pecuniary Cost of Unemployment in the United
States.” Working Paper.

30
Figure 1: Non-Search and Unemployment Rates, 1988-2006
Benefit Accuracy Management Data, US Department of Labor (1988-2006). Figure 2: UI Benefit Amounts by Base Period Earnings
Calculated from the Benefit Accuracy Management Data, US Department of Labor (1988-2006). Adjusted for inflation.
0.0
1.0
2.0
3.0
4.0
5.0
6.0
7.0
8.0
1988 1990 1992 1994 1996 1998 2000 2002 2004 2006
Rate of Non-Search
Unemployment Rate
r = .38
0
100
200
300
400
< 8 8 - 15 15-30 30-50 50-70 70 - 100
Weekly Benefit Amounts (k$)
Base Period Earnings (k$ thousands)
31
Figure 3: Hypothetical Variation in the Timing of Quarterly Earnings
Figure 4: Search Effort Across the Duration of UI Recipiency
$0
$2,000
$4,000
$6,000
$8,000
$10,000
$12,000
Q1 Q2 Q3 Q4 Q1 Q2 Q3 Q4
Worker A Worker B
93%
94%
95%
96%
97%
25 23 21 19 17 15 13 11 9 7 5 3 1
Benefit Weeks Remaining
Predicted Probability of Search

32
Benefit Accuracy Management Data, US Department of Labor (1988-2006).
Table 1: Descriptive Statistics
Mean NotesSatisfactory Search 94.9% State search requirements satisfiedFailed to Meet Search Requirements 5.1%Weekly Benefit Amount 246$ Adjusted for inflationBase Period Earnings 24,587$ Adjusted for inflationRemaining Weeks of UI 18.0State UI Recipiency Rate 34% Percent of State unemployed that
receive UI benefitsState Unemployment Rate 5.4%Male 55%Female 45%Age 39.1Union Member 5.1%Expecting Recall 16.4% Claimant expects to be recalled
by last employerYears of Education 12.7Black 17.7%Hispanic 8.6%Asian 0.6%American Indian 1.6%

33
Table 2. Probit Model: Determinants of Work SearchModel 1 Model 2 Model 3 Model 4
Weekly Benefit Amount ($000) 0.14*** (0.02) 0.07** (0.02) 0.06** (0.02)Base Period Earnings ($00,000) 0.08*** (0.01) 0.05*** (0.01) 0.02*** (0.01)Benefit Weeks Remaining 0.01*** (0.00)Years of Education 0.02*** (0.00)Male -0.05** (0.02)Age 0.02*** (0.00)Age-squared / 100 -0.02*** (0.00)Union Member -0.03 (0.08)Expecting Recall to Previous Employer -0.00 (0.08)Race / EthnicityWhite (Reference Category)Black -0.25*** (0.03)Hispanic -0.09* (0.04)Asian -0.22 (0.12)Am. Indian -0.07 (0.05)State Unemployment Rate -0.01 (0.03)State Recipiency Rate 0.00 (0.01)State Fixed Effects? Y Y Y YN 368,106 368,106 368,106 368,106 pseudo R-sq 0.155 0.154 0.155 0.164* p<0.05, ** p<0.01, *** p<0.001Audit data from the Benefit Accuracy Management program of the US Department of Labor (1988-2006).Robust standard errors adjusted for clustering at the state level reported in parentheses.
34
Table 3. Probit Model: Determinants of Work Search, By Quartiles of Base Period Earnings
Weekly Benefit Amount ($000) 0.13*** (0.03) 0.12** (0.04) 0.00 (0.08)Base Period Earnings ($00,000) -0.08 (0.05) -0.02 (0.03) 0.04*** (0.01)Benefit Weeks Remaining 0.01*** (0.00) 0.01*** (0.00) 0.01*** (0.00)Years of Education 0.02*** (0.00) 0.02*** (0.00) 0.03*** (0.01)Male -0.05** (0.02) -0.06** (0.02) -0.04* (0.02)Age 0.01*** (0.00) 0.02*** (0.00) 0.03*** (0.01)Age-squared / 100 -0.01* (0.01) -0.02*** (0.00) -0.03*** (0.01)Union Member -0.06 (0.08) 0.02 (0.07) -0.06 (0.09)Expecting Recall to Previous Employer -0.03 (0.06) -0.00 (0.09) -0.01 (0.10)Race / EthnicityWhite (Reference Category)Black -0.24*** (0.03) -0.24*** (0.03) -0.25*** (0.03)Hispanic -0.06 (0.04) -0.10** (0.04) -0.15*** (0.04)Asian -0.21 (0.22) -0.20 (0.12) -0.27** (0.09)Am. Indian -0.08 (0.07) -0.07 (0.05) 0.02 (0.10)State Unemployment Rate -0.01 (0.03) -0.00 (0.03) -0.01 (0.03)State Recipiency Rate 0.00 (0.01) -0.00 (0.01) 0.00 (0.01)State Fixed Effects? Y Y YN 92026 183452 90069pseudo R-sq 0.158 0.152 0.192* p<0.05, ** p<0.01, *** p<0.001Audit data from the Benefit Accuracy Management program of the US Department of Labor (1988-2006).Robust standard errors adjusted for clustering at the state level reported in parentheses.
25% - 75%Bottom Quartile Top Quartile