![[United Nations] Workers' Remittances, Economic Gr(BookFi.org)](https://static.fdocuments.in/doc/165x107/552b9876550346d6478b475e/united-nations-workers-remittances-economic-grbookfiorg.jpg)
[United Nations] Workers' Remittances, Economic Gr(BookFi.org)
Unedited
United Nations
Department of Economic and Social Affairs
LINK Global Economic Outlook
2017-2018
Presented at the DESA Expert Group Meeting on the World Economy (Project LINK)
Toronto, Canada
19-21 October 2016
1
Acknowledgements
This report presents the short-term prospects for the global economy in 2017-2018, including major risks and policy challenges.
The report draws on the analysis of staff in the Global Economic Monitoring Unit (GEMU) of the Development Policy and Analysis Division (DPAD), United Nations Department of Economic and Social Affairs (DESA), and on inputs from the experts of Project LINK. The regional outlooks include inputs provided by the UN Regional Commissions (ESCAP, ESCWA, ECA, ECE and ECLAC). UNCTAD provided input to the section on commodity prices.
The current report was coordinated by Dawn Holland, with contributions from Grigor Agabekian, Hoi Wai Cheng, Pingfan Hong, Matthias Kempf, Erik Klok, Poh Lynn Ng, Ingo Pitterle, Sebastian Vergara. Hamid Rashid also contributed to the background research underpinning the report. Helena Afonso, Cordelia Gow, Kenneth Iversen and Ann D’Lima provided statistical and editorial assistance. Pingfan Hong provided general guidance.
This report is prepared for the UN DESA Expert Group Meeting on the World Economy (Project LINK) to be held on 19-21 October 2016 in Toronto. The views expressed herein do not necessarily represent those of the United Nations or its Member States.
2
Contents Section 1: State of the world economy ...................................................................................... 4
Global outlook ........................................................................................................................ 4
Employment and productivity .............................................................................................. 10
Box A. The LDC growth scenario ....................................................................................... 15
Investment ............................................................................................................................ 17
Inflation and exchange rates ................................................................................................. 21
Section 2. Trade, Capital Flows and Remittances ................................................................... 24
International trade flows ....................................................................................................... 24
Box B. G-20 policies and LDCs economic integration ........................................................ 29
International capital flows .................................................................................................... 31
Remittances .......................................................................................................................... 34
Section 3. Sustainability and inclusiveness of economic growth ............................................ 37
Poverty and inequality .......................................................................................................... 37
Energy and Environment ...................................................................................................... 40
Section 4. Uncertainties, risks and policy challenges .............................................................. 44
Major uncertainties and risks in the global economy ........................................................... 44
Uncertainties associated with Brexit ................................................................................ 44
Uncertainties and risks associated with negative interest rates ........................................ 46
Policy challenges .................................................................................................................. 47
Macroeconomic policy stance in the outlook ................................................................... 47
The needs for reorienting towards a more effective policy mix ....................................... 51
Enhancing international policy coordination under the new 2030 Agenda ...................... 52
Section 5. Regional economic prospects ................................................................................. 54
Developed economies .......................................................................................................... 54
United States ..................................................................................................................... 54
Canada .............................................................................................................................. 56
Japan ................................................................................................................................. 57
Australia............................................................................................................................ 60
Europe ............................................................................................................................... 60
Economies in transition ........................................................................................................ 64
The Commonwealth of Independent States (CIS) ............................................................ 64
3
South-Eastern Europe ....................................................................................................... 68
Developing economies ......................................................................................................... 69
Africa ................................................................................................................................ 69
East Asia ........................................................................................................................... 74
South Asia......................................................................................................................... 78
Western Asia..................................................................................................................... 81
Latin America and the Caribbean ..................................................................................... 85
References ................................................................................................................................ 89
Appendix A. Global assumptions ............................................................................................ 90
Appendix B. Statistics tables ................................................................................................... 96
4
Section 1: State of the world economy
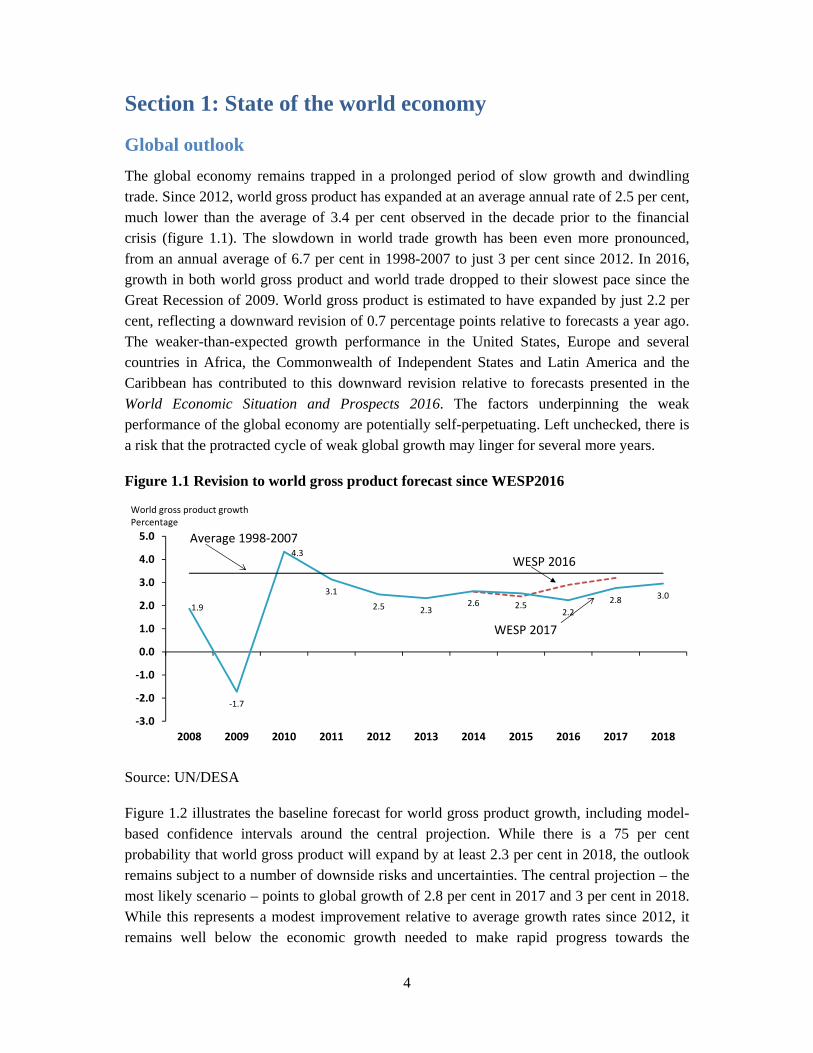
Global outlook The global economy remains trapped in a prolonged period of slow growth and dwindling trade. Since 2012, world gross product has expanded at an average annual rate of 2.5 per cent, much lower than the average of 3.4 per cent observed in the decade prior to the financial crisis (figure 1.1). The slowdown in world trade growth has been even more pronounced, from an annual average of 6.7 per cent in 1998-2007 to just 3 per cent since 2012. In 2016, growth in both world gross product and world trade dropped to their slowest pace since the Great Recession of 2009. World gross product is estimated to have expanded by just 2.2 per cent, reflecting a downward revision of 0.7 percentage points relative to forecasts a year ago. The weaker-than-expected growth performance in the United States, Europe and several countries in Africa, the Commonwealth of Independent States and Latin America and the Caribbean has contributed to this downward revision relative to forecasts presented in the World Economic Situation and Prospects 2016. The factors underpinning the weak performance of the global economy are potentially self-perpetuating. Left unchecked, there is a risk that the protracted cycle of weak global growth may linger for several more years.
Figure 1.1 Revision to world gross product forecast since WESP2016
Source: UN/DESA
Figure 1.2 illustrates the baseline forecast for world gross product growth, including model-based confidence intervals around the central projection. While there is a 75 per cent probability that world gross product will expand by at least 2.3 per cent in 2018, the outlook remains subject to a number of downside risks and uncertainties. The central projection – the most likely scenario – points to global growth of 2.8 per cent in 2017 and 3 per cent in 2018. While this represents a modest improvement relative to average growth rates since 2012, it remains well below the economic growth needed to make rapid progress towards the
1.9
‐1.7
4.3
3.1
2.5 2.32.6 2.5
2.22.8 3.0
‐3.0
‐2.0
‐1.0
0.0
1.0
2.0
3.0
4.0
5.0
2008 2009 2010 2011 2012 2013 2014 2015 2016 2017 2018
WESP 2016
WESP 2017
Average 1998‐2007
World gross product growthPercentage

5
Sustainable Development Goals (SDGs), as defined in the 2030 Agenda for Sustainable Development, which was adopted by the Member States of the United Nations in 2015. If downside risks to the outlook were to materialize, this could push global growth rates down even further, with additional setbacks towards achieving the SDGs, particularly the goals of eradicating extreme poverty and creating decent jobs.
Figure 1.2 Confidence intervals for world gross product growth forecast
Source: UN/DESA. Confidence intervals derived from stochastic simulation of WEFM.
The prolonged slump in the global economy has been characterized by widespread weak productivity growth, weak investment, low wage growth, low inflation, rising debt levels and a slowdown in global trade. Low commodity prices have exacerbated these trends in many commodity-exporting countries since mid-2014, while conflict and geopolitical tensions continue to weigh on regional economic prospects, especially in Western Asia and several parts of Central, East and West Africa.
The factors underlying the protracted economic slowdown have a tendency to self-reinforce one another, through the close linkages between demand, trade, investment and productivity. Firms are unlikely to invest in new projects and expand production when demand is weak and expected profits are low. This reluctance has been particularly acute in extractive industries since 2015, due to the low level of commodity prices. Economic and political uncertainties have also weighed on investment demand in many countries. Declining demand for capital goods restrains global trade, which in turn curtails investment in other export-oriented sectors. Meanwhile, the extended period of weak investment is a driving factor behind the widespread slowdown in productivity growth. This has been further compounded by the broad slowdown in global trade and capital flows to developing countries, as trade and foreign investment play a role in speeding the rate of technological diffusion between countries. Weak productivity growth has restrained wages and progress in poverty reduction, compounding the slowdown in domestic demand. This extended cycle of weak global growth
-3.0
-2.0
-1.0
0.0
1.0
2.0
3.0
4.0
5.0
6.0
2008
2009
2010
2011
2012
2013
2014
2015
2016
2017
2018
95% confidence 80% confidence
50% confidence Central forcast
6
may prove tenacious in the absence of concerted policy efforts to revive productive investment and foster a recovery in productivity.
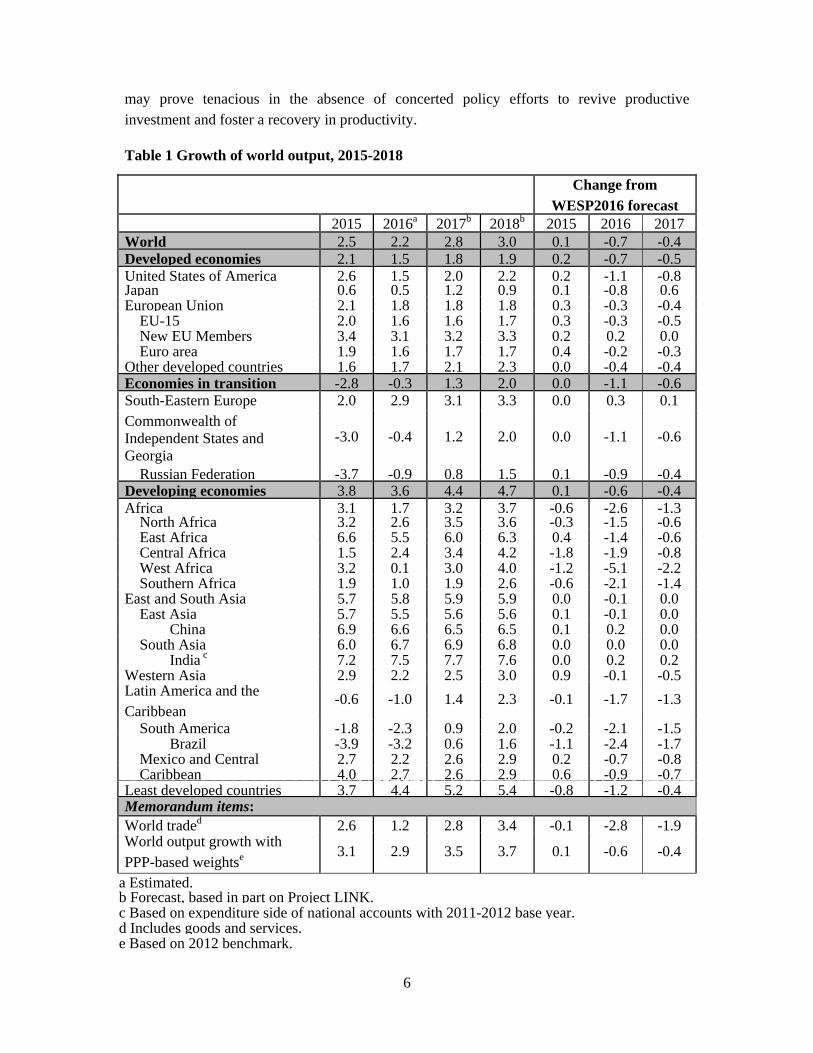
Table 1 Growth of world output, 2015-2018
Change from
WESP2016 forecast 2015 2016a 2017b 2018b 2015 2016 2017World 2.5 2.2 2.8 3.0 0.1 -0.7 -0.4Developed economies 2.1 1.5 1.8 1.9 0.2 -0.7 -0.5United States of America 2.6 1.5 2.0 2.2 0.2 -1.1 -0.8Japan 0.6 0.5 1.2 0.9 0.1 -0.8 0.6European Union 2.1 1.8 1.8 1.8 0.3 -0.3 -0.4
EU-15 2.0 1.6 1.6 1.7 0.3 -0.3 -0.5New EU Members 3.4 3.1 3.2 3.3 0.2 0.2 0.0Euro area 1.9 1.6 1.7 1.7 0.4 -0.2 -0.3
Other developed countries 1.6 1.7 2.1 2.3 0.0 -0.4 -0.4Economies in transition -2.8 -0.3 1.3 2.0 0.0 -1.1 -0.6South-Eastern Europe 2.0 2.9 3.1 3.3 0.0 0.3 0.1 Commonwealth of Independent States and Georgia
-3.0 -0.4 1.2 2.0 0.0 -1.1 -0.6
Russian Federation -3.7 -0.9 0.8 1.5 0.1 -0.9 -0.4Developing economies 3.8 3.6 4.4 4.7 0.1 -0.6 -0.4Africa 3.1 1.7 3.2 3.7 -0.6 -2.6 -1.3
North Africa 3.2 2.6 3.5 3.6 -0.3 -1.5 -0.6East Africa 6.6 5.5 6.0 6.3 0.4 -1.4 -0.6Central Africa 1.5 2.4 3.4 4.2 -1.8 -1.9 -0.8West Africa 3.2 0.1 3.0 4.0 -1.2 -5.1 -2.2Southern Africa 1.9 1.0 1.9 2.6 -0.6 -2.1 -1.4
East and South Asia 5.7 5.8 5.9 5.9 0.0 -0.1 0.0East Asia 5.7 5.5 5.6 5.6 0.1 -0.1 0.0 China 6.9 6.6 6.5 6.5 0.1 0.2 0.0South Asia 6.0 6.7 6.9 6.8 0.0 0.0 0.0 India c 7.2 7.5 7.7 7.6 0.0 0.2 0.2
Western Asia 2.9 2.2 2.5 3.0 0.9 -0.1 -0.5Latin America and the Caribbean
-0.6 -1.0 1.4 2.3 -0.1 -1.7 -1.3
South America -1.8 -2.3 0.9 2.0 -0.2 -2.1 -1.5 Brazil -3.9 -3.2 0.6 1.6 -1.1 -2.4 -1.7Mexico and Central 2.7 2.2 2.6 2.9 0.2 -0.7 -0.8Caribbean 4.0 2.7 2.6 2.9 0.6 -0.9 -0.7
Least developed countries 3.7 4.4 5.2 5.4 -0.8 -1.2 -0.4Memorandum items: World traded 2.6 1.2 2.8 3.4 -0.1 -2.8 -1.9World output growth with PPP-based weightse
3.1 2.9 3.5 3.7 0.1 -0.6 -0.4
a Estimated. b Forecast, based in part on Project LINK. c Based on expenditure side of national accounts with 2011-2012 base year. d Includes goods and services. e Based on 2012 benchmark.
7
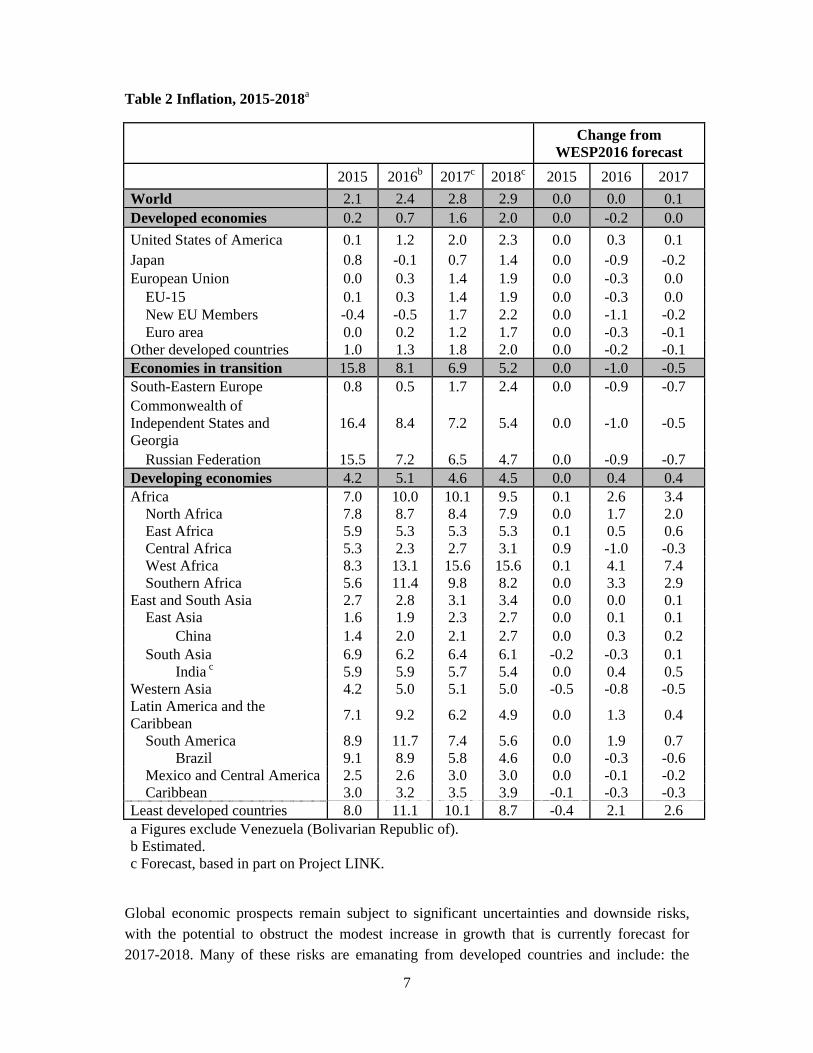
Table 2 Inflation, 2015-2018a
Change from WESP2016 forecast
2015 2016b 2017c 2018c 2015 2016 2017 World 2.1 2.4 2.8 2.9 0.0 0.0 0.1 Developed economies 0.2 0.7 1.6 2.0 0.0 -0.2 0.0 United States of America 0.1 1.2 2.0 2.3 0.0 0.3 0.1 Japan 0.8 -0.1 0.7 1.4 0.0 -0.9 -0.2 European Union 0.0 0.3 1.4 1.9 0.0 -0.3 0.0
EU-15 0.1 0.3 1.4 1.9 0.0 -0.3 0.0 New EU Members -0.4 -0.5 1.7 2.2 0.0 -1.1 -0.2 Euro area 0.0 0.2 1.2 1.7 0.0 -0.3 -0.1
Other developed countries 1.0 1.3 1.8 2.0 0.0 -0.2 -0.1 Economies in transition 15.8 8.1 6.9 5.2 0.0 -1.0 -0.5 South-Eastern Europe 0.8 0.5 1.7 2.4 0.0 -0.9 -0.7 Commonwealth of Independent States and Georgia
16.4 8.4 7.2 5.4 0.0 -1.0 -0.5
Russian Federation 15.5 7.2 6.5 4.7 0.0 -0.9 -0.7 Developing economies 4.2 5.1 4.6 4.5 0.0 0.4 0.4 Africa 7.0 10.0 10.1 9.5 0.1 2.6 3.4
North Africa 7.8 8.7 8.4 7.9 0.0 1.7 2.0 East Africa 5.9 5.3 5.3 5.3 0.1 0.5 0.6 Central Africa 5.3 2.3 2.7 3.1 0.9 -1.0 -0.3 West Africa 8.3 13.1 15.6 15.6 0.1 4.1 7.4 Southern Africa 5.6 11.4 9.8 8.2 0.0 3.3 2.9
East and South Asia 2.7 2.8 3.1 3.4 0.0 0.0 0.1East Asia 1.6 1.9 2.3 2.7 0.0 0.1 0.1 China 1.4 2.0 2.1 2.7 0.0 0.3 0.2 South Asia 6.9 6.2 6.4 6.1 -0.2 -0.3 0.1 India c 5.9 5.9 5.7 5.4 0.0 0.4 0.5
Western Asia 4.2 5.0 5.1 5.0 -0.5 -0.8 -0.5 Latin America and the Caribbean 7.1 9.2 6.2 4.9 0.0 1.3 0.4
South America 8.9 11.7 7.4 5.6 0.0 1.9 0.7 Brazil 9.1 8.9 5.8 4.6 0.0 -0.3 -0.6 Mexico and Central America 2.5 2.6 3.0 3.0 0.0 -0.1 -0.2 Caribbean 3.0 3.2 3.5 3.9 -0.1 -0.3 -0.3
Least developed countries 8.0 11.1 10.1 8.7 -0.4 2.1 2.6 a Figures exclude Venezuela (Bolivarian Republic of). b Estimated. c Forecast, based in part on Project LINK.
Global economic prospects remain subject to significant uncertainties and downside risks, with the potential to obstruct the modest increase in growth that is currently forecast for 2017-2018. Many of these risks are emanating from developed countries and include: the
8
potential side-effects of negative interest rates and other unconventional monetary policies; the pace and sequence of adjustments in the US monetary policy stance; uncertainties associated with the decision by the United Kingdom of Great Britain and Northern Ireland to leave the European Union, or "Brexit"; rising trade protectionism as well as a broader tendency to shift away from closer international integration, in terms of trade, capital flows and migration; and the outcome of elections in the United States as well as a number of European countries, including Germany and France, and their potential impact on trade and other policy stances. Uncertainties and risks stemming from developing countries and emerging economies include the vulnerability associated with the rising debt levels, as well as regional conflicts and geopolitical tensions. All of these uncertainties have the potential to significantly deter long-term business investment, impede international trade and prolong the cycle of weak global growth. They are discussed in more detail in the section on uncertainties, risks and policy challenges below.
In order to restore the global economy to a healthy growth trajectory, policy measures need to target a wide range of objectives, including: improving education; investing in worker training; promoting capital investment, including in infrastructure as well as areas such as social protection; increasing spending on research and development; and reforming regulations. For the most part, developed economies continue to rely almost exclusively on monetary policy to support their policy objectives for growth and employment. While monetary policy has played an important role in the aftermath of the global crisis and remains crucial, it is clear that monetary policy alone is not sufficient to achieve all policy objectives, which will require greater use of fiscal policy, as well as reforms in financial, goods and labour markets. Despite record-low, often negative, interest rates, Governments in developed countries have generally not made use of available fiscal policy space, and several of the largest economies have made sharp cuts in public investment for several years. This has impeded progress towards many of the policy objectives above, especially given the general weakness of private sector investment. There is a clear need for a more balanced policy mix in the global economy.
The general consensus of the Hangzhou G-20 summit underscored the need for more supportive and accommodative fiscal measures, indicating that the political will towards a greater role for fiscal policy may be approaching an inflection point. To date, however, only a handful countries have announced expansionary fiscal measures. In the absence of a broader shift towards a more balanced policy mix, the cycle of weak economic growth and deteriorating prospects for sustainable development is likely to continue.
Weak growth, rising inflationary pressures and low commodity prices have complicated the conduct of policy in many developing economies and economies in transition. Several countries have introduced pro-cyclical interest rate rises to stem capital outflows and prevent currency depreciation, while containing rising inflation – albeit at the expense of higher borrowing costs that weigh on domestic activity. Low global commodity prices have intensified fiscal pressures in the commodity-dependent economies, exposing shortfalls in efforts to diversify away from excessive reliance on volatile commodity revenue. This has
9
forced cutbacks or delays in much needed investment in infrastructure, healthcare, energy and transport, which will constrain productivity growth and undermine progress on economic and social development.
A recent agreement among OPEC members to a modest cut in production of oil may ease some of the downward pressure on oil prices, but can be expected to have only a limited impact on the excess market supply of oil if the global economy does not accelerate. While oil exporters continue to undergo a painful adjustment to the lower oil price, non-oil commodity prices have shown some signs of revival. If sustained, this recovery can be expected to ease the pressure on several countries, especially non-oil exporters in Africa.
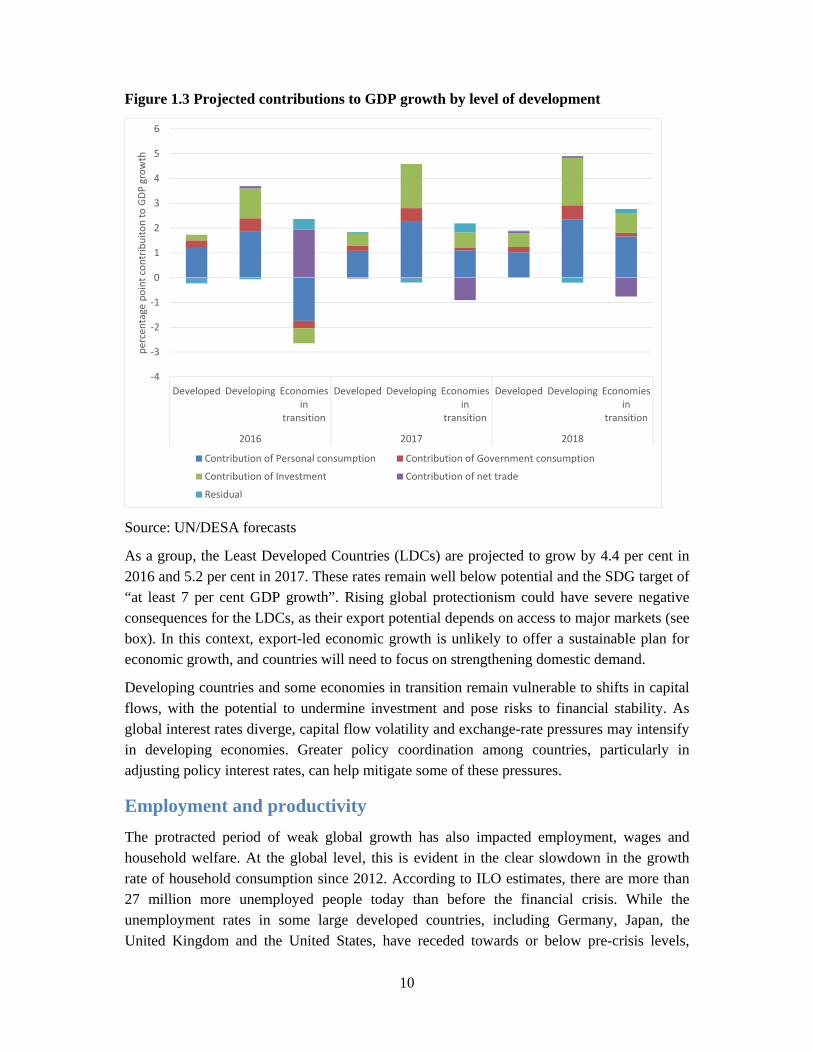
GDP growth in developing countries, especially in East and South Asia, is expected to remain driven by domestic consumption (figure 1.3), as the slowdown in world trade will restrain any contribution from net exports. As China rebalances its economy, domestic growth is expected to remain stable, supported by public spending. However, the rebalancing of the economy can be expected to continue to weigh on global trade flows in the near term. India is expected to be the fastest growing large developing economy again this year, as the country benefits from strong private consumption and the gradual introduction of significant domestic reforms.
The economies in transition, on the other hand, have suffered a sharp collapse in domestic demand in the Commonwealth of Independent States region. Net trade is expected to make a significant positive contribution to GDP growth in 2016, reflecting the impact of lower imports as a result of steep exchange rate realignments in several countries (figure 3). In 2017, the economy of the Russian Federation is expected to register its first year of growth since 2014, as the country has largely absorbed the sharp terms-of-trade shock.
The sharp downturn in Brazil may have also turned a corner. Political uncertainty in Brazil has declined and a credible programme for macro-management has been introduced. Together Brazil and the Russian Federation are expected to contribute 0.1 percentage points to the acceleration in global GDP growth in 2017.
10
Figure 1.3 Projected contributions to GDP growth by level of development
Source: UN/DESA forecasts
As a group, the Least Developed Countries (LDCs) are projected to grow by 4.4 per cent in 2016 and 5.2 per cent in 2017. These rates remain well below potential and the SDG target of “at least 7 per cent GDP growth”. Rising global protectionism could have severe negative consequences for the LDCs, as their export potential depends on access to major markets (see box). In this context, export-led economic growth is unlikely to offer a sustainable plan for economic growth, and countries will need to focus on strengthening domestic demand.
Developing countries and some economies in transition remain vulnerable to shifts in capital flows, with the potential to undermine investment and pose risks to financial stability. As global interest rates diverge, capital flow volatility and exchange-rate pressures may intensify in developing economies. Greater policy coordination among countries, particularly in adjusting policy interest rates, can help mitigate some of these pressures.
Employment and productivity The protracted period of weak global growth has also impacted employment, wages and household welfare. At the global level, this is evident in the clear slowdown in the growth rate of household consumption since 2012. According to ILO estimates, there are more than 27 million more unemployed people today than before the financial crisis. While the unemployment rates in some large developed countries, including Germany, Japan, the United Kingdom and the United States, have receded towards or below pre-crisis levels,
‐4
‐3
‐2
‐1
0
1
2
3
4
5
6
Developed Developing Economiesin
transition
Developed Developing Economiesin
transition
Developed Developing Economiesin
transition
2016 2017 2018
percentage point con
tribuiton to GDP
growth
Contribution of Personal consumption Contribution of Government consumption
Contribution of Investment Contribution of net trade
Residual
11
much of the rest of the European Union continues to struggle with high unemployment rates. In the case of the United States, recent improvements in the unemployment rate are at least in part attributable to declining labour force participation. Unemployment rates are generally low in developing East Asia, but rising unemployment in parts of South America, including Brazil and Chile, is raising concerns. Labour markets in Western Asia exhibit high levels of unemployment, particularly among the youth, which is likely to weigh heavily on the region’s ability to realize the 2030 Agenda for sustainable development.
In an environment of a protracted period of weak investment, which has allowed the existing capital stock to deteriorate, and ample supply of labour, it appears that production processes have shifted away from capital, substituting capital with higher levels of labour inputs. This has been an important factor restraining wage growth in recent years, with an expansion of low quality, low paid jobs, and a rise in the incidence of part-time and temporary contracts.
Nominal wage inflation in most developed economies has slowed since the financial crisis. The incidence is widespread, including in countries where the unemployment rate is low. In the United States, nominal wage growth has averaged about 0.5 per cent per annum in recent years, despite a significant rise in the median household income in 2015. Germany, however, has seen some recent acceleration in wage growth. This may pass through to settlements in other euro area countries, offering some respite to the low wage low inflation cycle.
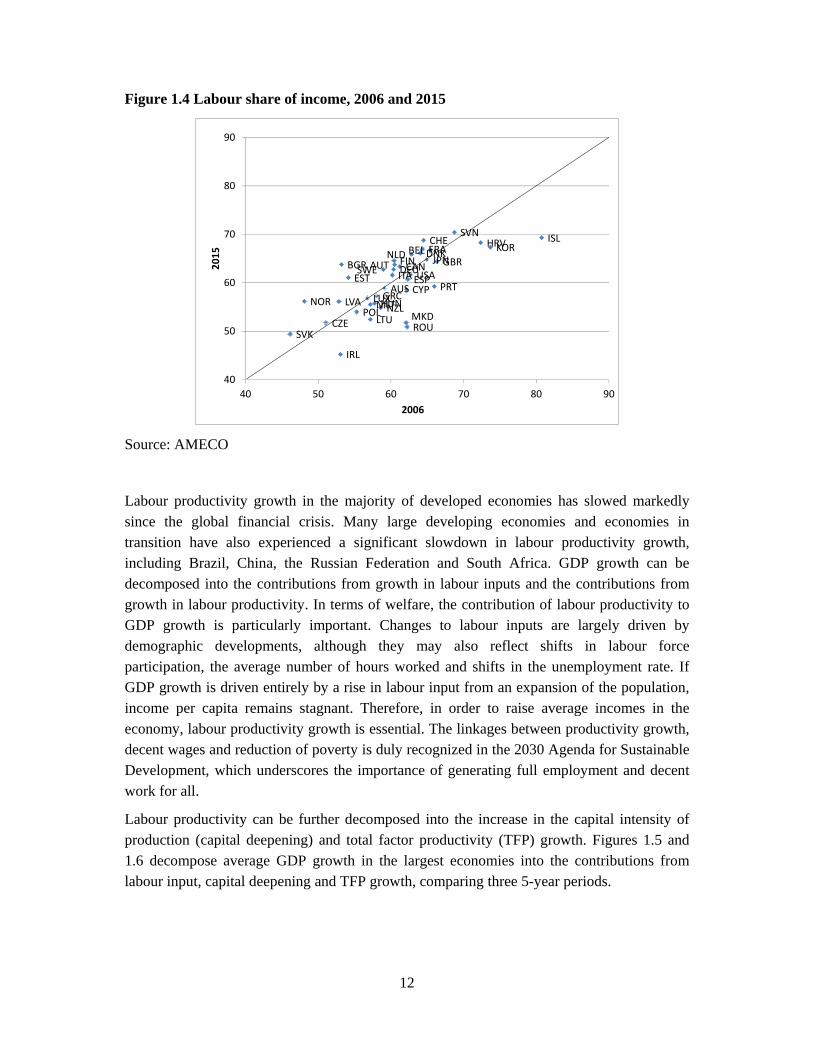
Real wages have been stagnant or declining in many countries, and have for the most part lagged behind productivity growth. As real wages have failed to keep pace with productivity, a general decline in the labour share of income has been evident in many developed economies. While the onset of decline pre-dates the financial crisis in some countries, the bulk of adjustment has occurred since 2006, as illustrated in figure 1.4, which compares the labour share of income in 2015 in a selection of developed countries to its level in 2006. Countries that lie below the 45 degree line have seen a decline in the labour share. While the number of countries below that line is roughly half, the mean distance below the line is somewhat higher than the mean difference above the line, pointing to a broad decline in the labour share. However, a small recovery in the labour share is evident in certain countries including as Germany, France and Canada.
12
Figure 1.4 Labour share of income, 2006 and 2015
Source: AMECO
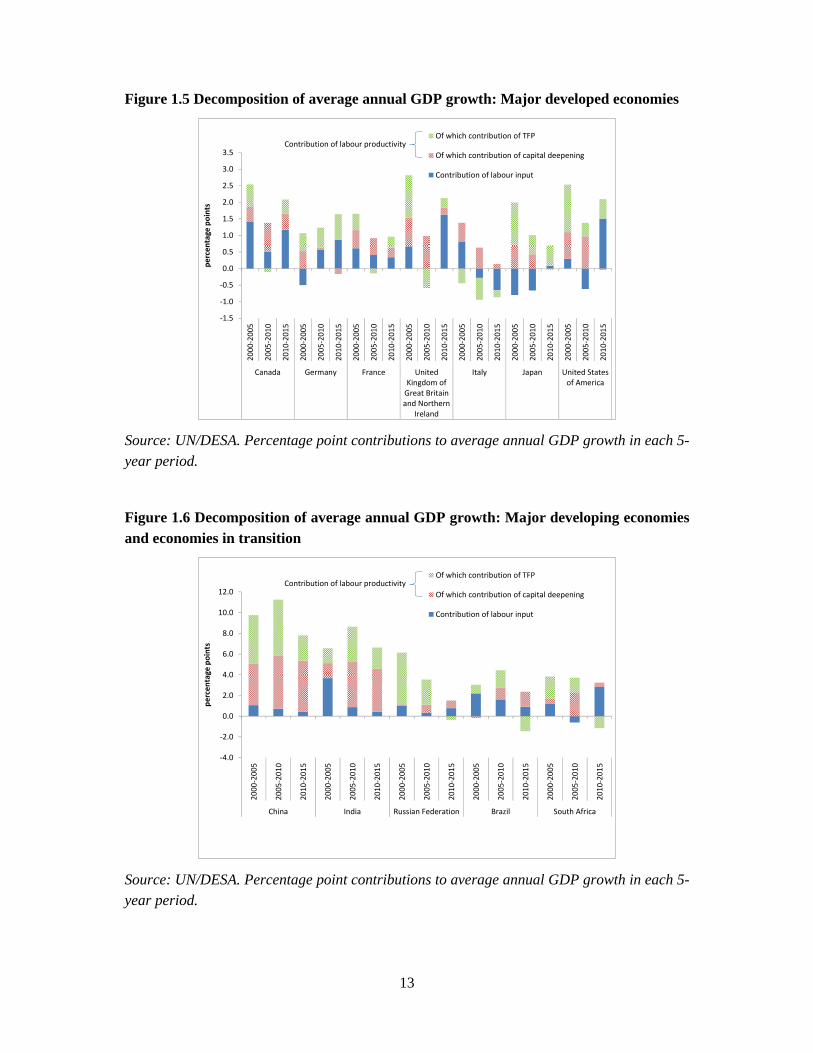
Labour productivity growth in the majority of developed economies has slowed markedly since the global financial crisis. Many large developing economies and economies in transition have also experienced a significant slowdown in labour productivity growth, including Brazil, China, the Russian Federation and South Africa. GDP growth can be decomposed into the contributions from growth in labour inputs and the contributions from growth in labour productivity. In terms of welfare, the contribution of labour productivity to GDP growth is particularly important. Changes to labour inputs are largely driven by demographic developments, although they may also reflect shifts in labour force participation, the average number of hours worked and shifts in the unemployment rate. If GDP growth is driven entirely by a rise in labour input from an expansion of the population, income per capita remains stagnant. Therefore, in order to raise average incomes in the economy, labour productivity growth is essential. The linkages between productivity growth, decent wages and reduction of poverty is duly recognized in the 2030 Agenda for Sustainable Development, which underscores the importance of generating full employment and decent work for all.
Labour productivity can be further decomposed into the increase in the capital intensity of production (capital deepening) and total factor productivity (TFP) growth. Figures 1.5 and 1.6 decompose average GDP growth in the largest economies into the contributions from labour input, capital deepening and TFP growth, comparing three 5-year periods.
BELBGR
CZE
DNKDEU
EST
IRL
GRCESP
FRA HRV
ITACYP
LVA
LTU
LUXHUNMLT
NLDAUT
POL
PRT
ROU
SVN
SVK
FINSWE
GBR
MKD
ISL
NOR
CHE
USAJPNCAN
KOR
AUS
NZL
40
50
60
70
80
90
40 50 60 70 80 90
2015
2006
13
Figure 1.5 Decomposition of average annual GDP growth: Major developed economies
Source: UN/DESA. Percentage point contributions to average annual GDP growth in each 5-year period.
Figure 1.6 Decomposition of average annual GDP growth: Major developing economies and economies in transition
Source: UN/DESA. Percentage point contributions to average annual GDP growth in each 5-year period.
‐1.5
‐1.0
‐0.5
0.0
0.5
1.0
1.5
2.0
2.5
3.0
3.5
2000
‐2005
2005
‐2010
2010
‐2015
2000
‐2005
2005
‐2010
2010
‐2015
2000
‐2005
2005
‐2010
2010
‐2015
2000
‐2005
2005
‐2010
2010
‐2015
2000
‐2005
2005
‐2010
2010
‐2015
2000
‐2005
2005
‐2010
2010
‐2015
2000
‐2005
2005
‐2010
2010
‐2015
Canada Germany France UnitedKingdom ofGreat Britainand Northern
Ireland
Italy Japan United Statesof America
percen
tage points
Of which contribution of TFP
Of which contribution of capital deepening
Contribution of labour input
Contribution of labour productivity
‐4.0
‐2.0
0.0
2.0
4.0
6.0
8.0
10.0
12.0
2000
‐200
5
2005
‐201
0
2010
‐201
5
2000
‐200
5
2005
‐201
0
2010
‐201
5
2000
‐200
5
2005
‐201
0
2010
‐201
5
2000
‐200
5
2005
‐201
0
2010
‐201
5
2000
‐200
5
2005
‐201
0
2010
‐201
5
China India Russian Federation Brazil South Africa
percen
tage points
Of which contribution of TFP
Of which contribution of capital deepening
Contribution of labour input
Contribution of labour productivity
14
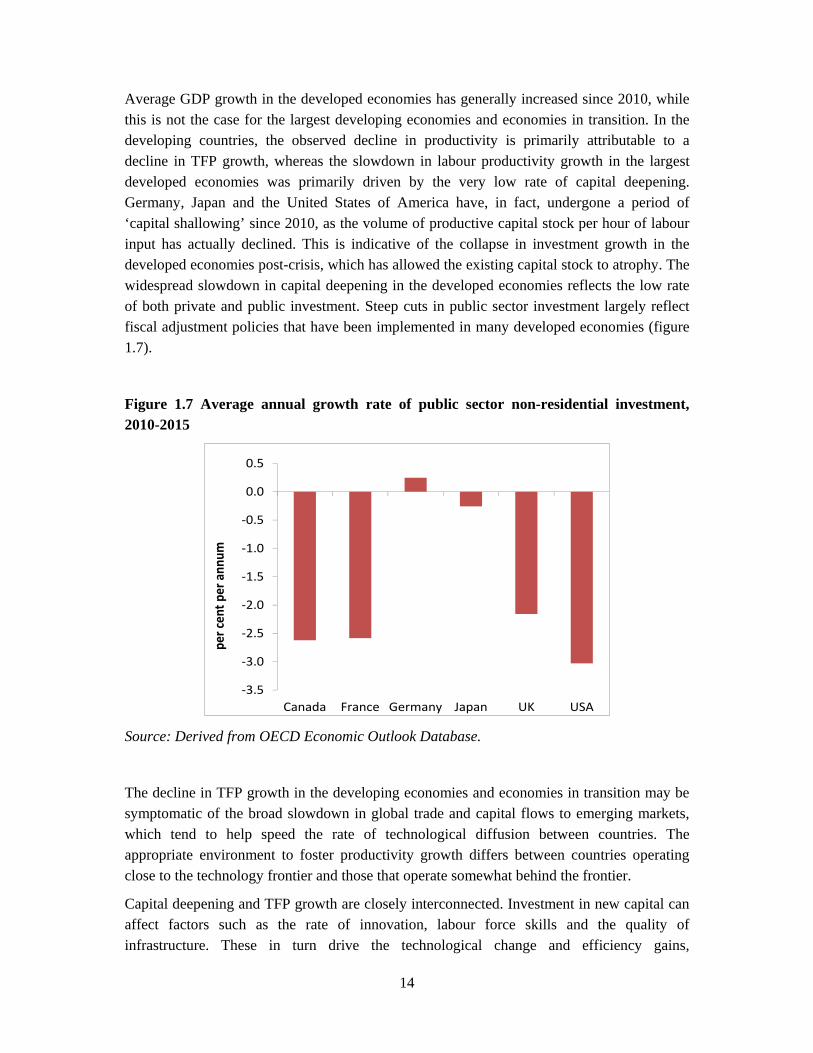
Average GDP growth in the developed economies has generally increased since 2010, while this is not the case for the largest developing economies and economies in transition. In the developing countries, the observed decline in productivity is primarily attributable to a decline in TFP growth, whereas the slowdown in labour productivity growth in the largest developed economies was primarily driven by the very low rate of capital deepening. Germany, Japan and the United States of America have, in fact, undergone a period of ‘capital shallowing’ since 2010, as the volume of productive capital stock per hour of labour input has actually declined. This is indicative of the collapse in investment growth in the developed economies post-crisis, which has allowed the existing capital stock to atrophy. The widespread slowdown in capital deepening in the developed economies reflects the low rate of both private and public investment. Steep cuts in public sector investment largely reflect fiscal adjustment policies that have been implemented in many developed economies (figure 1.7).
Figure 1.7 Average annual growth rate of public sector non-residential investment, 2010-2015
Source: Derived from OECD Economic Outlook Database.
The decline in TFP growth in the developing economies and economies in transition may be symptomatic of the broad slowdown in global trade and capital flows to emerging markets, which tend to help speed the rate of technological diffusion between countries. The appropriate environment to foster productivity growth differs between countries operating close to the technology frontier and those that operate somewhat behind the frontier.
Capital deepening and TFP growth are closely interconnected. Investment in new capital can affect factors such as the rate of innovation, labour force skills and the quality of infrastructure. These in turn drive the technological change and efficiency gains,
‐3.5
‐3.0
‐2.5
‐2.0
‐1.5
‐1.0
‐0.5
0.0
0.5
Canada France Germany Japan UK USA
per cen
t per ann
um
15
underpinning TFP growth in the medium-term. As the private sector remains jittery about making new investments, amid significant economic and political uncertainties worldwide, higher levels of public sector investments are needed to reduce the investment gaps as part of a move towards a more balanced policy mix, taking advantage of historically low borrowing costs. The role of investment in the global economic slowdown is discussed further below.
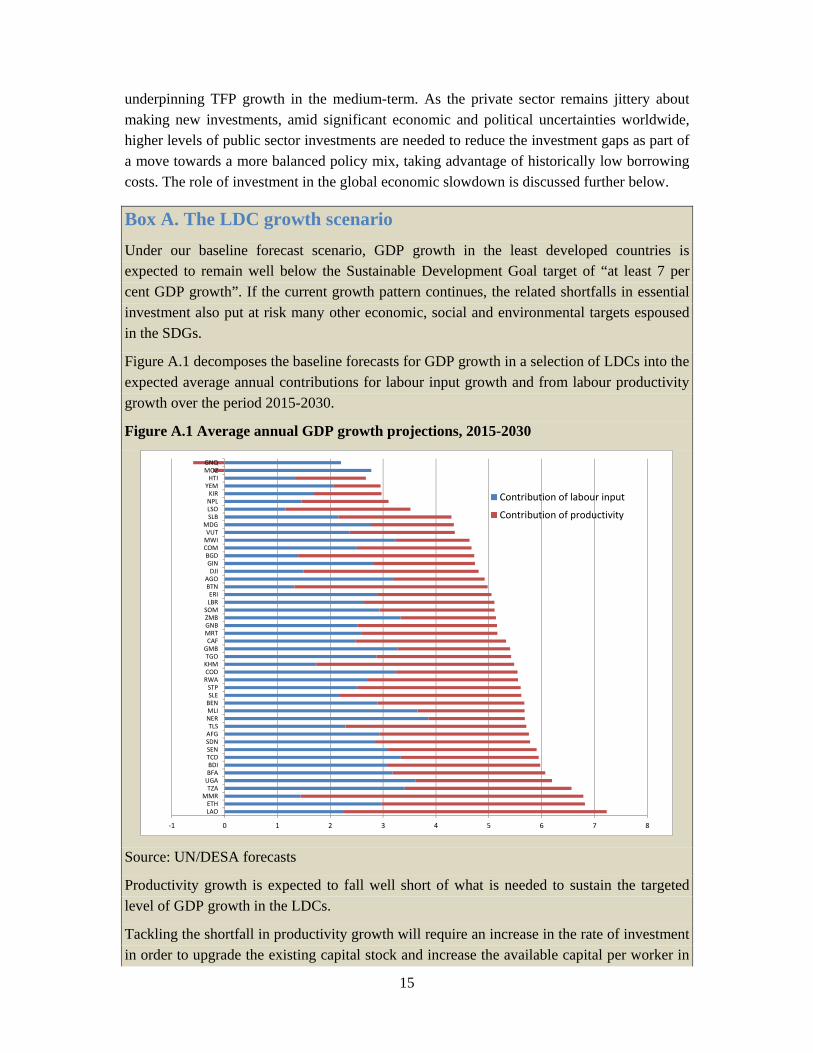
Box A. The LDC growth scenario Under our baseline forecast scenario, GDP growth in the least developed countries is expected to remain well below the Sustainable Development Goal target of “at least 7 per cent GDP growth”. If the current growth pattern continues, the related shortfalls in essential investment also put at risk many other economic, social and environmental targets espoused in the SDGs.
Figure A.1 decomposes the baseline forecasts for GDP growth in a selection of LDCs into the expected average annual contributions for labour input growth and from labour productivity growth over the period 2015-2030.
Figure A.1 Average annual GDP growth projections, 2015-2030
Source: UN/DESA forecasts
Productivity growth is expected to fall well short of what is needed to sustain the targeted level of GDP growth in the LDCs.
Tackling the shortfall in productivity growth will require an increase in the rate of investment in order to upgrade the existing capital stock and increase the available capital per worker in
‐1 0 1 2 3 4 5 6 7 8
LAOETH
MMRTZAUGABFABDITCDSENSDNAFGTLSNERMLIBENSLESTP
RWACODKHMTGOGMBCAFMRTGNBZMBSOMLBRERIBTNAGODJIGINBGDCOMMWIVUTMDGSLBLSONPLKIR
YEMHTI
MOZGNQ
Contribution of labour input
Contribution of productivity
16
the economy. A model simulation exercise can assess the magnitude of additional investment needed to close the productivity gaps, and approach an average GDP growth rate of 7 per cent per annum in the LDCs. The scenario suggests that, in order to achieve an average rate of GDP growth of 7 per cent per annum, the average rate of investment growth in the LDCs as a whole would need to increase by 3 percentage points per annum relative to the baseline projections. This implies an average increase in gross fixed capital formation of 11.3 per cent per annum through 2030. While this exceeds that average rate of investment growth of 8.9 per cent recorded between 2010 and 2015, it is in line with the investment rate recorded during the period of rapid growth during 2000-2005, when GDP growth in the LDCs as a whole averaged 6.8 per cent per annum. However, the external environment is expected to be much less supportive to growth in the LDCs than it was in 2000-2005, when export growth for the group averaged 6.5 per cent per annum. Given the prospects for the world economy, exports from the LDCs are expected to average less than 5 per cent per annum over the forecast horizon to 2030.
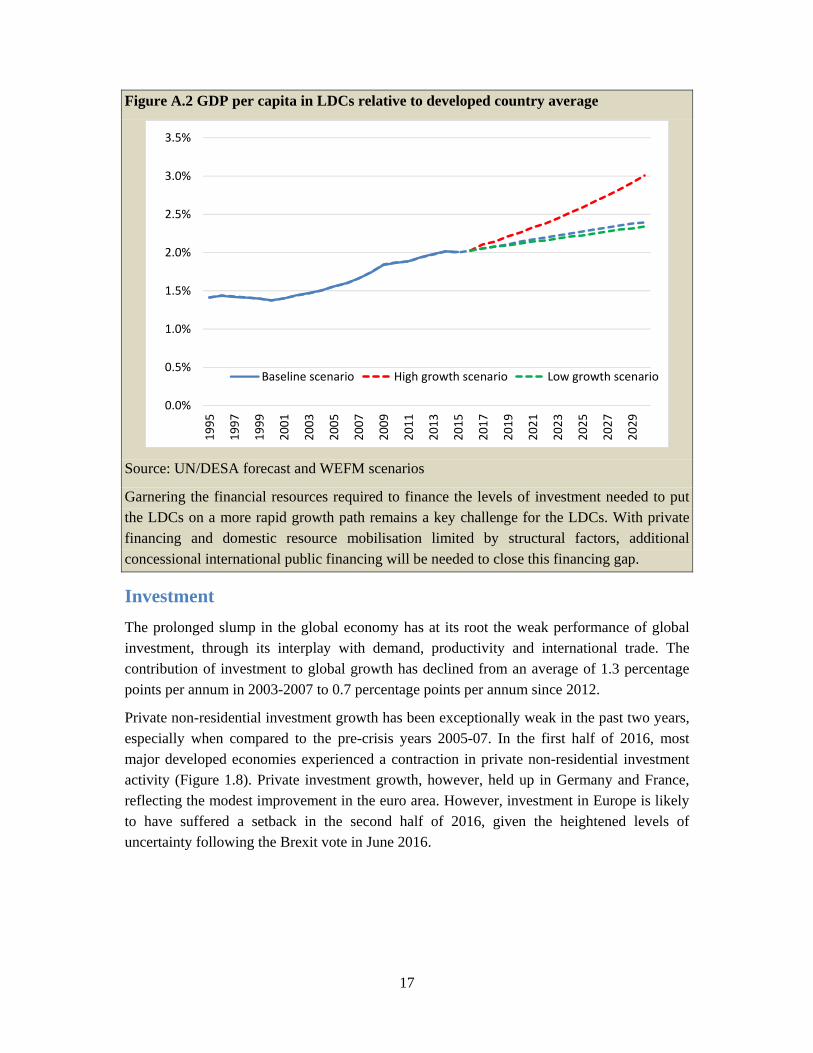
Figure A.2 illustrates the expected rate of convergence in GDP per capita between the LDCs and the developed economies under 3 different scenarios. The baseline scenario represents prospects according to the current baseline forecast, which sees GDP growth in the LDCs averaging 5.4 per cent per annum to 2030. At this rate of growth, GDP per capita can only be expected to converge marginally towards average levels in the developed economies, rising from just 2 per cent of the developed economy average in 2015 to just under 2.5 per cent in 2030. In the ‘low growth scenario’ the growth rate of average productivity in the LDC’s is expected to remain at average levels observed in 2010-2015. A few LDCs, including the relatively large economies of Tanzania, Ethiopia and Myanmar, recorded strong average productivity growth in excess of 5 per cent per annum over this period, so the profile for the LDCs as a whole in the ‘low growth scenario’ is only marginally weaker than the baseline scenario. If average labour productivity growth were to remain stable over the next 15 years, we can expect very limited convergence in the level of GDP per capita of the LDCs compared to the developed country average. If, on the other hand, the short-falls in productivity growth could be closed through an acceleration in investment, a more rapid pace of convergence can be achieved. This would allow GDP per capita in the LDC to rise from 2 per cent of the Developed country average in 2015 to 3 per cent by 2030 (‘high growth scenario’).
17
Figure A.2 GDP per capita in LDCs relative to developed country average
Source: UN/DESA forecast and WEFM scenarios
Garnering the financial resources required to finance the levels of investment needed to put the LDCs on a more rapid growth path remains a key challenge for the LDCs. With private financing and domestic resource mobilisation limited by structural factors, additional concessional international public financing will be needed to close this financing gap.
Investment The prolonged slump in the global economy has at its root the weak performance of global investment, through its interplay with demand, productivity and international trade. The contribution of investment to global growth has declined from an average of 1.3 percentage points per annum in 2003-2007 to 0.7 percentage points per annum since 2012.
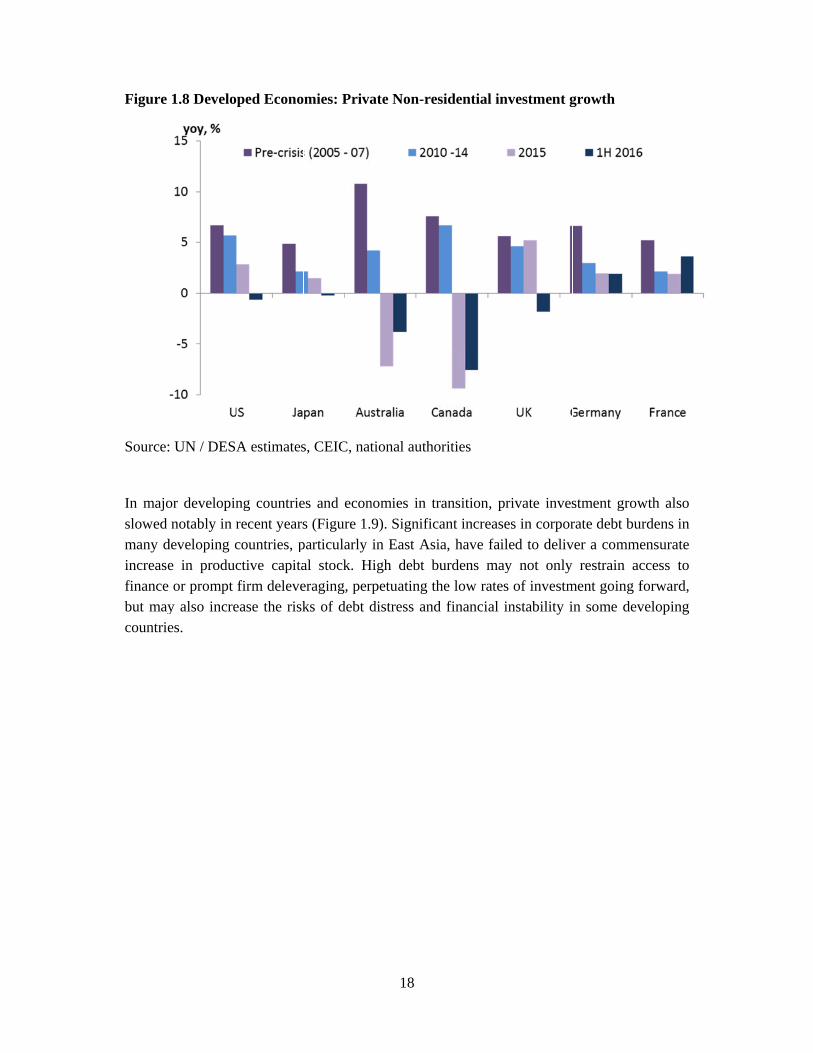
Private non-residential investment growth has been exceptionally weak in the past two years, especially when compared to the pre-crisis years 2005-07. In the first half of 2016, most major developed economies experienced a contraction in private non-residential investment activity (Figure 1.8). Private investment growth, however, held up in Germany and France, reflecting the modest improvement in the euro area. However, investment in Europe is likely to have suffered a setback in the second half of 2016, given the heightened levels of uncertainty following the Brexit vote in June 2016.
0.0%
0.5%
1.0%
1.5%
2.0%
2.5%
3.0%
3.5%
1995
1997
1999
2001
2003
2005
2007
2009
2011
2013
2015
2017
2019
2021
2023
2025
2027
2029
Baseline scenario High growth scenario Low growth scenario
Figure
Source:
In majoslowed many dincreasefinance but maycountrie
1.8 Develo
: UN / DESA
or developinnotably in r
developing ce in producor prompt
y also increes.
ped Econo
A estimates
ng countrierecent yearscountries, pctive capitafirm deleve
ease the risk
mies: Priva
s, CEIC, nat
es and econs (Figure 1.
particularly al stock. Heraging, perks of debt d
18
ate Non-res
tional autho
nomies in tr9). Significin East Asi
High debt brpetuating thdistress and
sidential in
orities
ransition, pcant increaseia, have fail
burdens mayhe low ratesd financial i
nvestment g
rivate inveses in corporled to delivy not only s of investminstability i
growth
stment growrate debt buver a comme
restrain acment going fin some dev
wth also urdens in ensurate ccess to forward, veloping
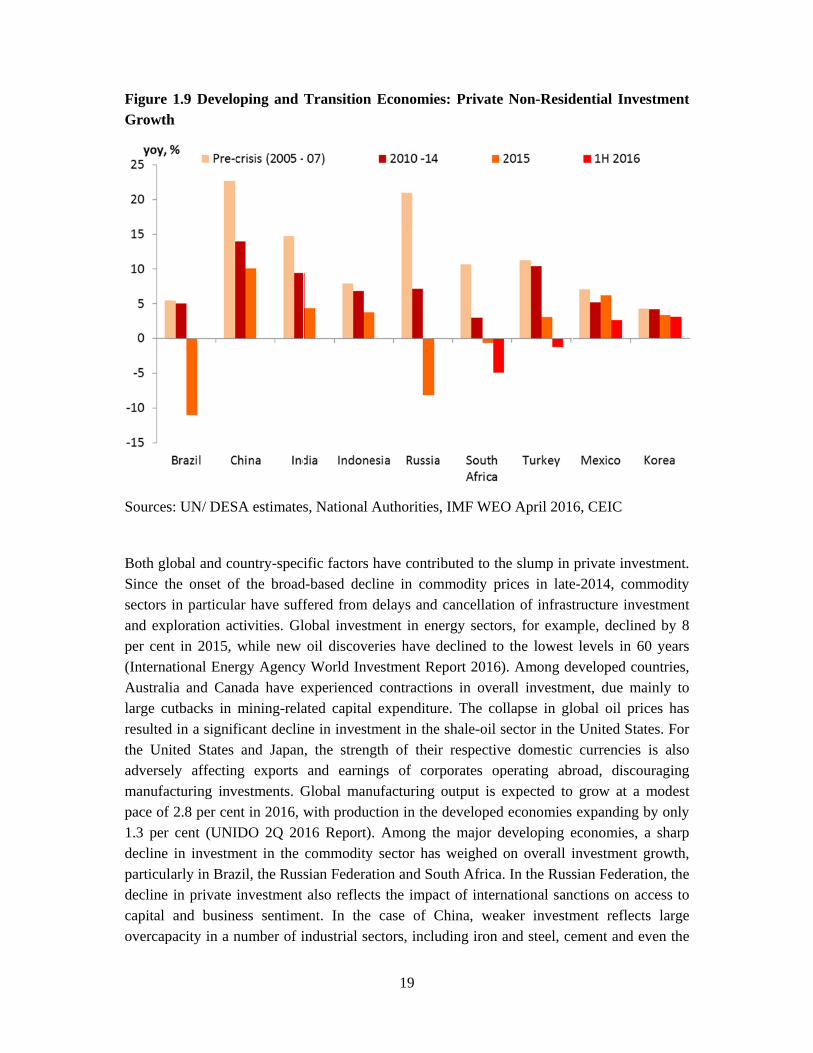
Figure Growth
Sources
Both glSince thsectors and expper cen(InternaAustrallarge curesultedthe Uniadversemanufapace of 1.3 per decline particuldecline capital overcap
1.9 Develoh
s: UN/ DES
lobal and cohe onset ofin particula
ploration acnt in 2015, ational Eneria and Canutbacks in d in a signifited States
ely affectinacturing invf 2.8 per cen
cent (UNIin investm
larly in Brazin private and busine
pacity in a n
oping and
SA estimates
ountry-specf the broadar have suffctivities. Glwhile new rgy Agencynada have emining-rela
ficant declinand Japan
ng exports vestments. Gnt in 2016, wIDO 2Q 20
ment in the zil, the Rusinvestment ess sentimenumber of i
Transition
s, National
ific factors d-based decffered from lobal investoil discove
y World Invexperiencedated capitalne in invest
n, the strengand earnin
Global manwith produc
016 Report)commoditysian Federaalso reflect
ent. In the industrial se
19
Economie
Authorities
have contricline in comdelays and
tment in eneries have dvestment Red contractiol expenditurtment in thegth of theirngs of cornufacturing ction in the . Among th
y sector hasation and Sots the impa
case of Cectors, inclu
es: Private
s, IMF WEO
ibuted to thmmodity pr
cancellationergy sectordeclined to eport 2016)ons in overare. The col
e shale-oil sr respectiverporates opoutput is edeveloped
he major ds weighed oouth Africa.act of internChina, weauding iron a
Non-Resid
O April 201
he slump in rices in lateon of infrastrs, for exam
the lowest. Among deall investmllapse in glsector in thee domestic
perating abrexpected toeconomies eveloping eon overall i In the Russ
national sanaker investmand steel, ce
dential Inve
6, CEIC
private invee-2014, comtructure inv
mple, declint levels in 6eveloped co
ment, due mlobal oil pre United Sta
currenciesroad, disco grow at a expanding
economies, investment sian Federa
nctions on ament reflecement and e
estment
estment. mmodity vestment ned by 8 60 years ountries,
mainly to ices has ates. For s is also ouraging
modest by only a sharp growth,
ation, the access to cts large even the
20
solar energy sector. At the same time, protracted weak global demand has reduced the incentive for firms to invest, especially for firms in export-oriented industries. Firms are unlikely to invest in new projects and expand production when demand is weak and expected profits are low.
Economic and political uncertainties have also weighed negatively on investment demand. Uncertainties surrounding the United Kingdom’s Brexit referendum and its potential fallout have resulted in a significant deterioration in investor sentiment in the United Kingdom, Europe and beyond. This has adversely impacted business investment in the United Kingdom, which contracted during the first half of 2016. In the United States, business investment has been negatively affected by uncertainty over the outcome of the presidential election in November and the future direction of the United States monetary, fiscal and trade policies. In Brazil, South Africa and Turkey, political uncertainty and social unrests have also impacted the investment climate.
Policy shifts and elevated financial market volatility have also constrained investment growth in several large developing countries. High financial market volatility, including large exchange rate depreciations, has resulted in increased investor uncertainty. For example in Nigeria, the removal of the currency peg in June 2016 resulted in a sharp depreciation of the naira of more than 40 per cent, with a consequent impact on investment.
Public Investment
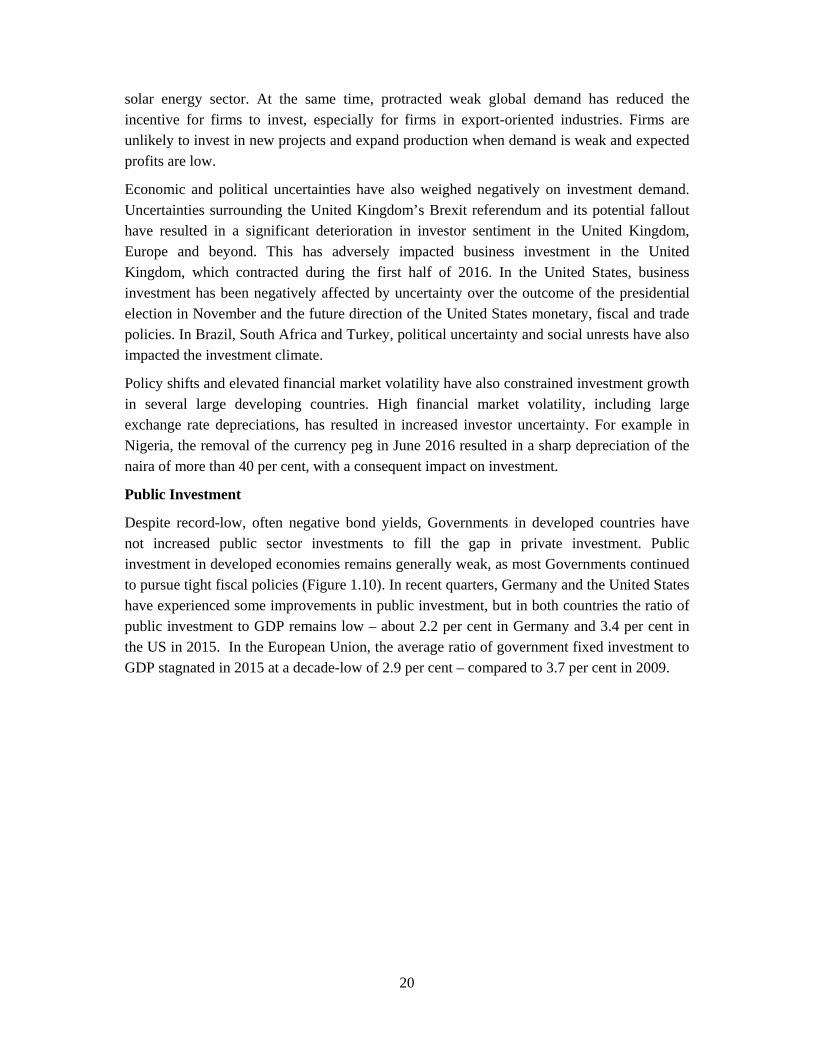
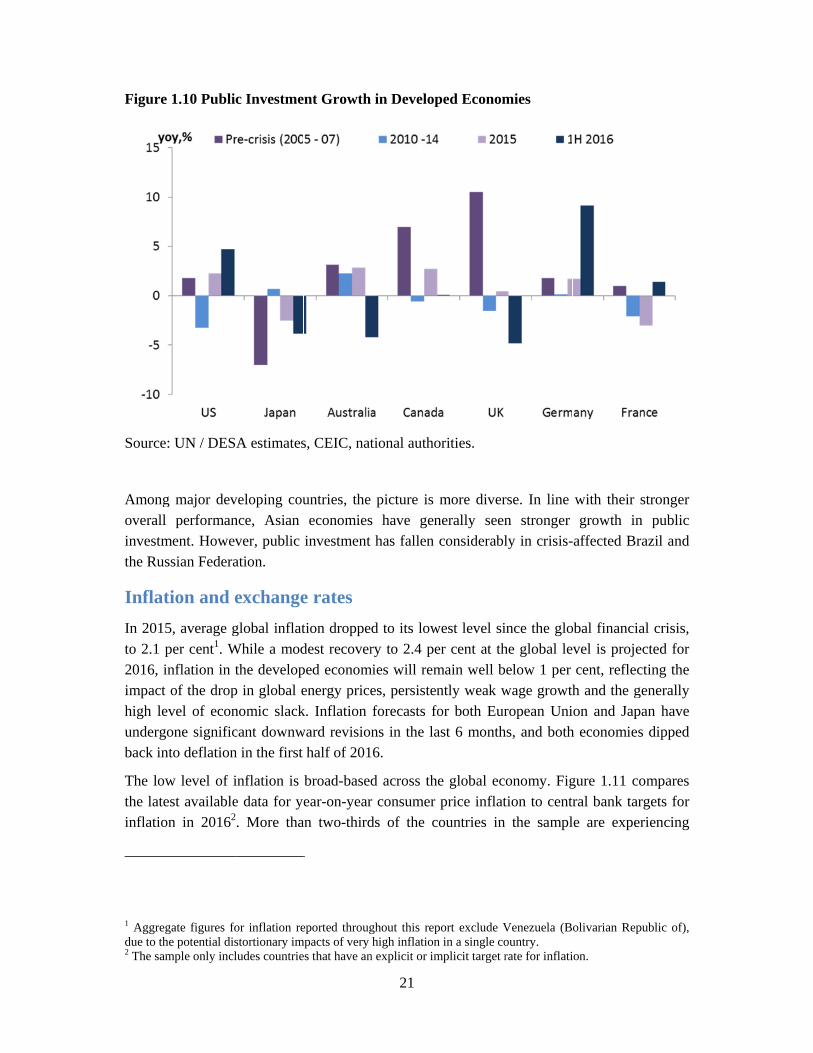
Despite record-low, often negative bond yields, Governments in developed countries have not increased public sector investments to fill the gap in private investment. Public investment in developed economies remains generally weak, as most Governments continued to pursue tight fiscal policies (Figure 1.10). In recent quarters, Germany and the United States have experienced some improvements in public investment, but in both countries the ratio of public investment to GDP remains low – about 2.2 per cent in Germany and 3.4 per cent in the US in 2015. In the European Union, the average ratio of government fixed investment to GDP stagnated in 2015 at a decade-low of 2.9 per cent – compared to 3.7 per cent in 2009.
Figure
Source:
Amongoverall investmthe Rus
InflatIn 2015to 2.1 p2016, inimpact high levundergoback int
The lowthe lateinflation
1 Aggregdue to the2 The sam
1.10 Public
: UN / DESA
g major devperforman
ment. Howevssian Federa
tion and e5, average gper cent1. Wnflation in tof the dropvel of econone significto deflation
w level of iest availablen in 20162
gate figures foe potential dis
mple only incl
c Investme
A estimates
veloping counce, Asian ver, public ation.
exchangeglobal inflat
While a modthe develop
p in global enomic slackcant downwn in the first
inflation is e data for y. More tha
or inflation restortionary imludes countrie
ent Growth
s, CEIC, nat
untries, theeconomies
investment
e rates tion droppedest recoverped economenergy pricek. Inflation ward revision
half of 201
broad-basedear-on-year
an two-third
eported througmpacts of very es that have an
21
in Develop
tional autho
picture is s have gen
has fallen
d to its lowry to 2.4 pe
mies will remes, persistenforecasts fons in the la6.
d across ther consumer ds of the c
ghout this rephigh inflation
n explicit or im
ped Econom
orities.
more divernerally seenconsiderabl
west level sier cent at thmain well bntly weak wor both Eurast 6 month
e global ecprice inflatountries in
port exclude Vn in a single complicit target r
mies
rse. In line n stronger ly in crisis-
ince the glohe global leelow 1 per
wage growthropean Uni
hs, and both
onomy. Figtion to centr
the sampl
Venezuela (Bountry. rate for inflati
with their growth in
affected Br
obal financiavel is projecent, reflech and the gon and Jap
h economies
gure 1.11 coral bank tarle are expe
olivarian Rep
ion.
stronger n public razil and
al crisis, ected for cting the generally pan have s dipped
ompares rgets for riencing
public of),
22
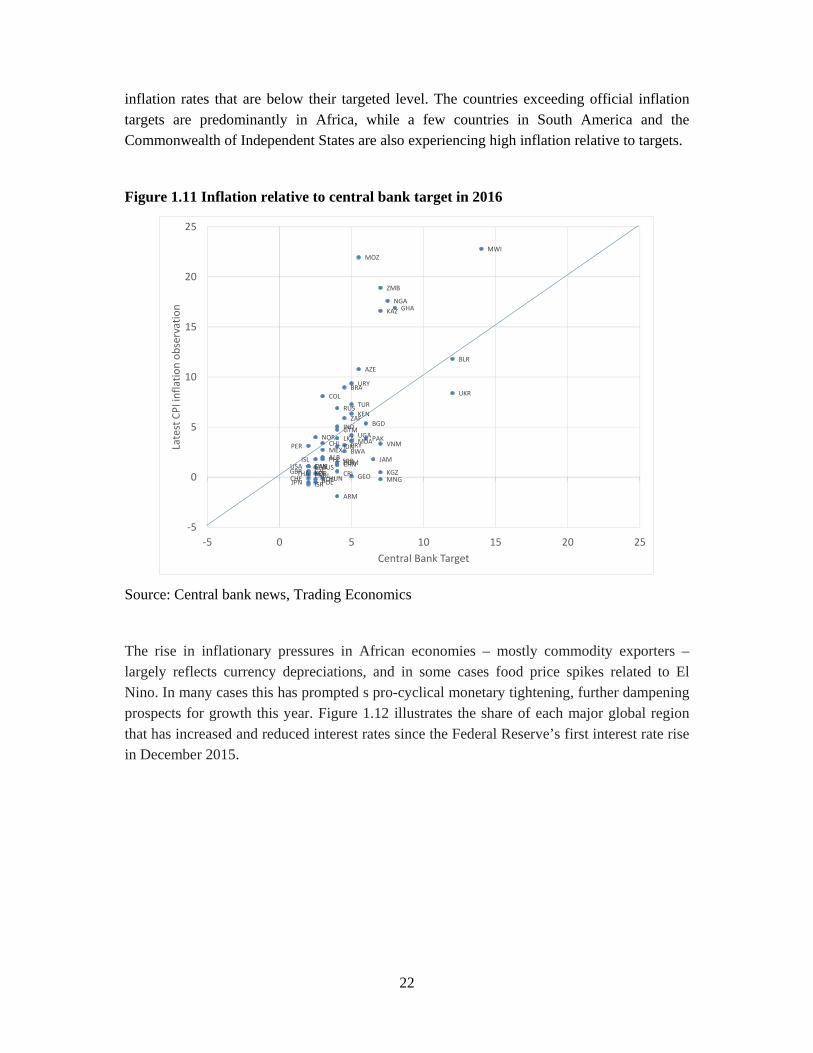
inflation rates that are below their targeted level. The countries exceeding official inflation targets are predominantly in Africa, while a few countries in South America and the Commonwealth of Independent States are also experiencing high inflation relative to targets.
Figure 1.11 Inflation relative to central bank target in 2016
Source: Central bank news, Trading Economics
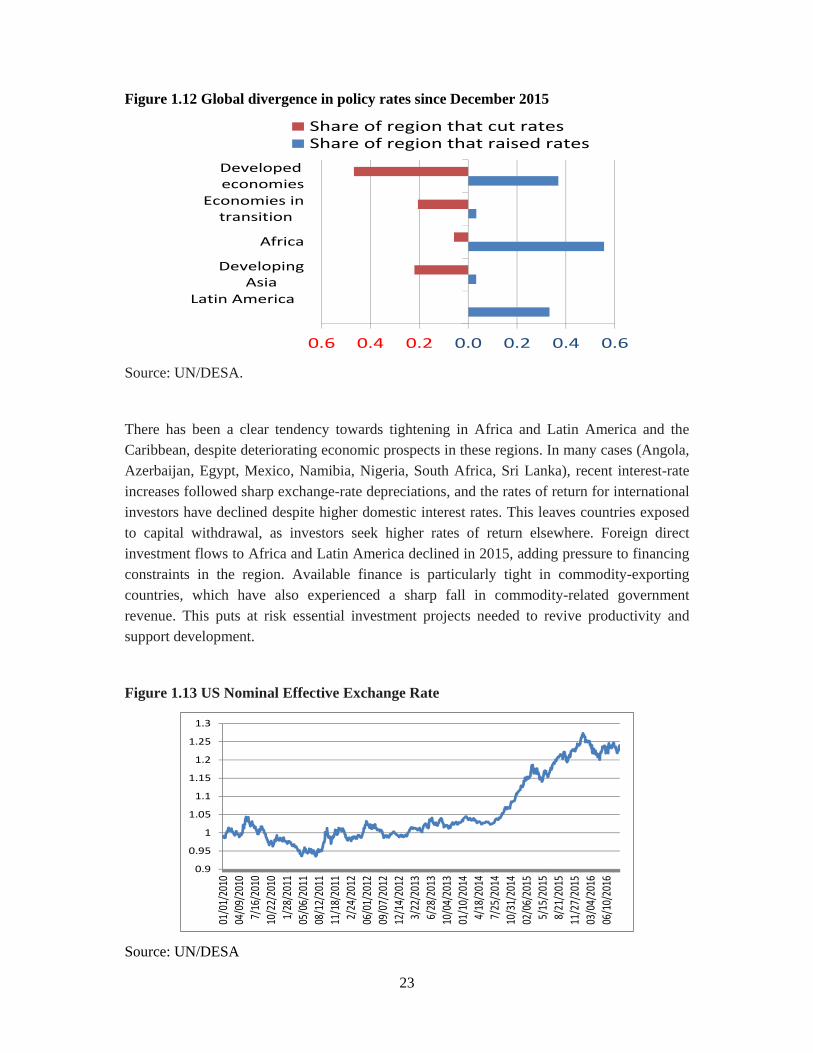
The rise in inflationary pressures in African economies – mostly commodity exporters –largely reflects currency depreciations, and in some cases food price spikes related to El Nino. In many cases this has prompted s pro-cyclical monetary tightening, further dampening prospects for growth this year. Figure 1.12 illustrates the share of each major global region that has increased and reduced interest rates since the Federal Reserve’s first interest rate rise in December 2015.
CANCZEEMUISRJPNNZL
PER
KORSWE
CHEGBRUSA AUS
ISL
NOR
POLROUTHA
ALB
CHL
COL
HUN
MEXPHL
ARM
CHNCRIDOM
GTMIND
IDN
RUS
SRB
LKA
BWA
BRA
PRY
ZAF
GEO
KEN
MDA
TUR
UGA
URY
AZE
MOZ
PAK
BGD
JAM
KAZ
KGZMNG
VNM
ZMB
NGAGHA
BLR
UKR
MWI
‐5
0
5
10
15
20
25
‐5 0 5 10 15 20 25
Latest CPI inflatio
n ob
servation
Central Bank Target
23
Figure 1.12 Global divergence in policy rates since December 2015
Source: UN/DESA.
There has been a clear tendency towards tightening in Africa and Latin America and the Caribbean, despite deteriorating economic prospects in these regions. In many cases (Angola, Azerbaijan, Egypt, Mexico, Namibia, Nigeria, South Africa, Sri Lanka), recent interest-rate increases followed sharp exchange-rate depreciations, and the rates of return for international investors have declined despite higher domestic interest rates. This leaves countries exposed to capital withdrawal, as investors seek higher rates of return elsewhere. Foreign direct investment flows to Africa and Latin America declined in 2015, adding pressure to financing constraints in the region. Available finance is particularly tight in commodity-exporting countries, which have also experienced a sharp fall in commodity-related government revenue. This puts at risk essential investment projects needed to revive productivity and support development.
Figure 1.13 US Nominal Effective Exchange Rate
Source: UN/DESA
0.6 0.4 0.2 0.0 0.2 0.4 0.6
Latin America
DevelopingAsia
Africa
Economies in transition
Developed economies
Share of region that cut ratesShare of region that raised rates
0.9
0.95
1
1.05
1.1
1.15
1.2
1.25
1.3
01/01/20
1004
/09/20
107/16
/201
010
/22/20
101/28
/201
105
/06/20
1108
/12/20
1111
/18/20
112/24
/201
206
/01/20
1209
/07/20
1212
/14/20
123/22
/201
36/28
/201
310
/04/20
1301
/10/20
144/18
/201
47/25
/201
410
/31/20
1402
/06/20
155/15
/201
58/21
/201
511
/27/20
1503
/04/20
1606
/10/20
16

24
The US dollar has appreciated by more than 15 per cent since mid-2014 (figure 1.13). The strong dollar has important implications both in the US and in the rest of the world, through its association with capital flows, external debt financing costs, commodity prices and global imbalances. Low inflation coupled with the strong US dollar led to a sharp contraction in the level of nominal gross world product in 2015, of a similar magnitude to that experienced in 2009. This loss of global income is reflected in terms-of-trade adjusted export revenue, and continued to weigh on global demand in 2016.
Section 2. Trade, Capital Flows and Remittances
International trade flows Dwindling world trade is both a contributing factor and a symptom of the global economic slowdown. Trade and investment are strongly interconnected and mutually reinforcing. The causality runs primarily from investment to trade, with the current weak investment trends in major developed and developing economies constraining trade in capital goods. At the same time, the weakness in trade is propagating and reinforcing the slump in investment, especially in other export-oriented sectors. There may also be direct spillovers from weak global trade to productivity, especially in developing countries, as international trade tends to help speed the rate of technological diffusion between countries, improves resource allocation and increases the quality and variety of available goods. The 2030 Agenda for Sustainable Development recognizes the important role of international trade as an engine of inclusive and sustainable growth (e.g. SDG 17 calls for significantly increasing the exports of developing countries). In order to design appropriate policies to support these objectives requires an understanding of the factors behind the slump in world trade, distinguishing between temporary cyclical factors and more permanent structural factors. While global trade growth has been volatile over the past four decades, the prolonged downturn since 2009 is exceptional, suggesting that not only cyclical factors are at play.
The volume of world trade in goods and services is expected to grow by just 1.2 per cent in 2016, the slowest rate since the financial crisis, marking a significant downward revision of nearly 3 percentage points compared to projections in the WESP 2016. This reflects the exceptional slowdown in first half of year, as world merchandise trade virtually stagnated. This continues the downward trend of international trade flows observed in recent years, reflecting weak growth both in historical terms and also relative to GDP growth. The projected global trade growth of only 1.2 per cent in 2016 will stand out as the third-lowest rate of trade growth in the past 30 years. World trade growth dipped below 1 per cent only twice over this period, during the crisis years 2001 and 2009 (figure 2.1).

25
Figure 2.1 Growth of global GDP and global trade, 1970 – 2016, (in %)
Source: UN Statistical Division National Accounts Database; UN-DESA estimates for 2015-2016.
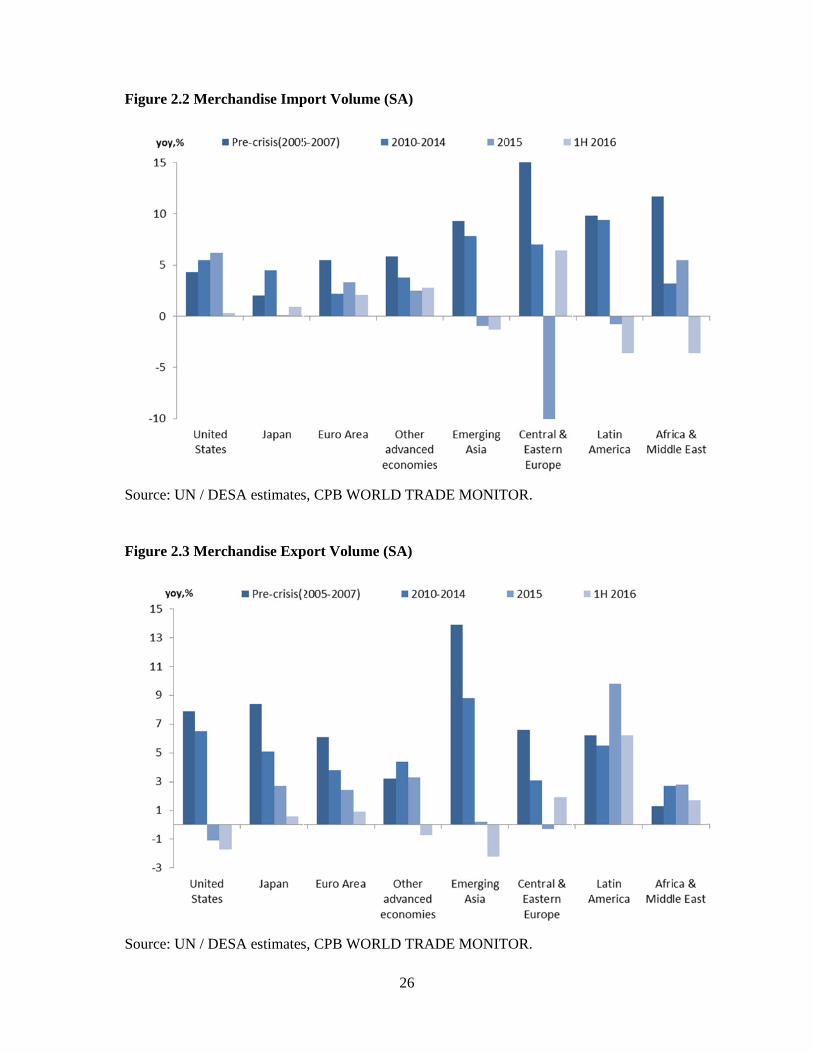
The weakness in trade flows is broad-based, encompassing developed, developing and transition economies, although there are notable regional differences between the developments in imports and exports. Imports were exceptionally weak in developing economies in the first half of 2016. Asia, Africa and the Middle East and Latin America have seen contractions compared to the previous year (figure 2.2). This reflects weak domestic demand (in the cases of Latin America and Africa), significant currency depreciations and, in some cases a gradual transformation in the economic structure and rebalancing, as observed in the case of China. On the export side, emerging Asia and the United States – affected by the strong dollar - have seen contractions over the previous year, whereas Latin America benefited from much weaker domestic currencies (figure 2.3).
‐15
‐10
‐5
0
5
10
15
Global trade growth Global GDP Growth
Figure
Source:
Figure
Source:
2.2 Merch
: UN / DESA
2.3 Merch
: UN / DESA
andise Imp
A estimates
andise Exp
A estimates
port Volum
s, CPB WO
port Volum
s, CPB WO
26
me (SA)
RLD TRAD
me (SA)
RLD TRAD
DE MONIT
DE MONIT
TOR.
TOR.
27
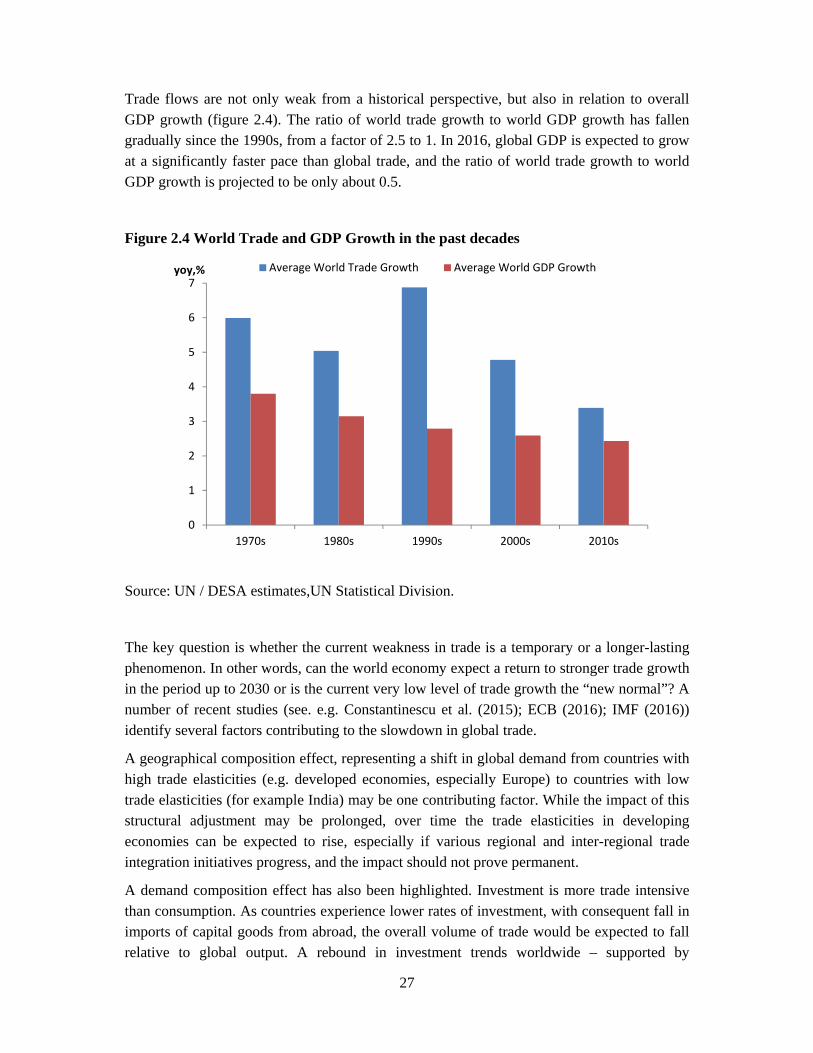
Trade flows are not only weak from a historical perspective, but also in relation to overall GDP growth (figure 2.4). The ratio of world trade growth to world GDP growth has fallen gradually since the 1990s, from a factor of 2.5 to 1. In 2016, global GDP is expected to grow at a significantly faster pace than global trade, and the ratio of world trade growth to world GDP growth is projected to be only about 0.5.
Figure 2.4 World Trade and GDP Growth in the past decades
Source: UN / DESA estimates,UN Statistical Division.
The key question is whether the current weakness in trade is a temporary or a longer-lasting phenomenon. In other words, can the world economy expect a return to stronger trade growth in the period up to 2030 or is the current very low level of trade growth the “new normal”? A number of recent studies (see. e.g. Constantinescu et al. (2015); ECB (2016); IMF (2016)) identify several factors contributing to the slowdown in global trade.
A geographical composition effect, representing a shift in global demand from countries with high trade elasticities (e.g. developed economies, especially Europe) to countries with low trade elasticities (for example India) may be one contributing factor. While the impact of this structural adjustment may be prolonged, over time the trade elasticities in developing economies can be expected to rise, especially if various regional and inter-regional trade integration initiatives progress, and the impact should not prove permanent.
A demand composition effect has also been highlighted. Investment is more trade intensive than consumption. As countries experience lower rates of investment, with consequent fall in imports of capital goods from abroad, the overall volume of trade would be expected to fall relative to global output. A rebound in investment trends worldwide – supported by
0
1
2
3
4
5
6
7
1970s 1980s 1990s 2000s 2010s
Average World Trade Growth Average World GDP Growthyoy,%
28
appropriate policy measures – may provide a boost to global trade in the medium term. This will, however, require a significant adjustment in fiscal and structural policies that would incentivize investments.
More broadly speaking, world trade can be expected to grow faster than world output for a sustained period only if the prices of international goods and services continue to decline relative to the prices of domestic goods and services. The impact of a number of factors that supported these relative price declines in the 1990s and 2000s have started to wane, including the reduction in transportation costs, supported, for example by ICT advancements; trade liberalisation and deeper economic integration, including the integration process of the economies in transition and China into global trade networks and deeper integration in Europe with the European Single Market; and the formation and increasing expansion of global value chains, which distributed various stages of production to different countries. These factors can be expected to have a more permanent effect on world trade growth.
Non-tariff barriers to trade have clearly increased since the global financial crisis, amid a growing tendency towards protectionism. If this tendency persists, prospects for global trade will remain subdued. This would compound and prolong the slow growth in the world economy, leading to a less-efficient allocation of resources, slower pace of technological diffusion and rise in global inequality. The LDCs can be expected to bear a disproportionate share of these costs, as their export potential depends on access to major markets. A backlash on international trade is likely to have significant negative spillover effects on cross border capital flows, investments, migration and remittances.
There is considerable room for policymakers to provide support for international trade flows. This will require concerted efforts to curtail the spread of protectionist measures, further opening of markets in developed countries, especially for least developed countries, fostering regional integration among developing countries, and strengthening multilateral mechanisms under the auspices of WTO.
29
Box B. G-20 policies and LDCs economic integration Alessandro Nicita and Julia Seiermann
The integration of least developed countries into the global economy has been the objective of many multilateral declarations and has been more recently reinstated in the United Nations Sustainable Development Goals (SDGs). In particular SDG 17, on strengthening the means of implementation and revitalizing the global partnership for sustainable development, aims to "increase significantly the exports of developing countries, in particular with a view to doubling the least developing countries share of global exports by 2020" (Target 17.11) and to "realize timely implementation of duty-free and quota-free market access on a lasting basis for all least developed countries" (Target 17.12). This box draws on a recent study by Nicita and Seiermann (2016) that explores whether providing LDCs with better market access represents a solution to the weak trade performance of LDCs, focusing on how of G20 trade policies (preferential schemes and non-tariff measures) affect LDCs exports, and how these policies can be improved so as to facilitate the integration of LDCs in the global economy.
While LDCs represent around 12 per cent of the world's population, they contribute only about one per cent of global exports. Moreover, LDCs exports are largely concentrated in commodities. Their export-to-GDP ratio is significantly below the average for developing countries and has been on a clear downward trend since 2011, partially driven by the fall in commodity prices. The G20 generally recognize LDCs' trade constraints and provide LDCs exporters with preferential market access and technical cooperation programs to increase competitiveness. They have made progress towards fulfilling commitments of duty-free quota-free market access for LDCs and affirmed their commitment to assist developing countries in complying with standards and regulations in a recent declaration by the G20 Trade Ministers.
Many of the high income countries and some of the G20 developing countries such as China and India provide tariff preferences to LDCs on a non-reciprocal basis. Although most of the preferential schemes are generous, in many sectors of importance for LDCs, such as agriculture, textiles and apparel, tariffs remain substantial and tariff peaks (particularly high tariffs on specific products) are prominent. Tariffs are just one of the burdens to LDCs exports. Access to G20 markets depends on and is administered by a large and increasing set of regulations and requirements with which traded goods need to comply, generally referred to as non-tariff measures (NTMs). While being a legitimate and important part of national public policies in developed countries, NTMs pose a particular challenge for LDCs for two reasons. First, NTMs tend to be more prevalent in products that are typically exported by LDCs such as agriculture, textiles and apparel. Second, NTMs can have a potentially distortionary effect on trade. The costs related to compliance with NTMs depend on technical know-how, production facilities, and an infrastructural base that, while usually available in developed and emerging markets, is lacking in many LDCs. For this reason, regulatory trade
30
frameworks often have negative effects on the export competitiveness of LDCs, as confirmed by Nicita and Seiermann (2016).
The study indicates that preferential tariff schemes make an important contribution, but will not be sufficient to meet the ambitious SDG target of doubling LDCs export share by 2020. They need to be complemented by policies which help LDCs comply with NTMs. At the aggregate level, allowing for tariff-free market access for LDCs is quantified to increase LDC exports to G20 by almost 10 billion US$, equivalent to an increase in LDCs total exports of almost five per cent. Eliminating the distortionary trade effects of NTMs would increase LDC exports to G20 countries by about 23 billion US$, equivalent to about a ten per cent increase. Taken together fully liberalizing market access for LDCs and eliminating the negative trade effect of NTMs on LDCs would increase their exports by about 15 per cent.
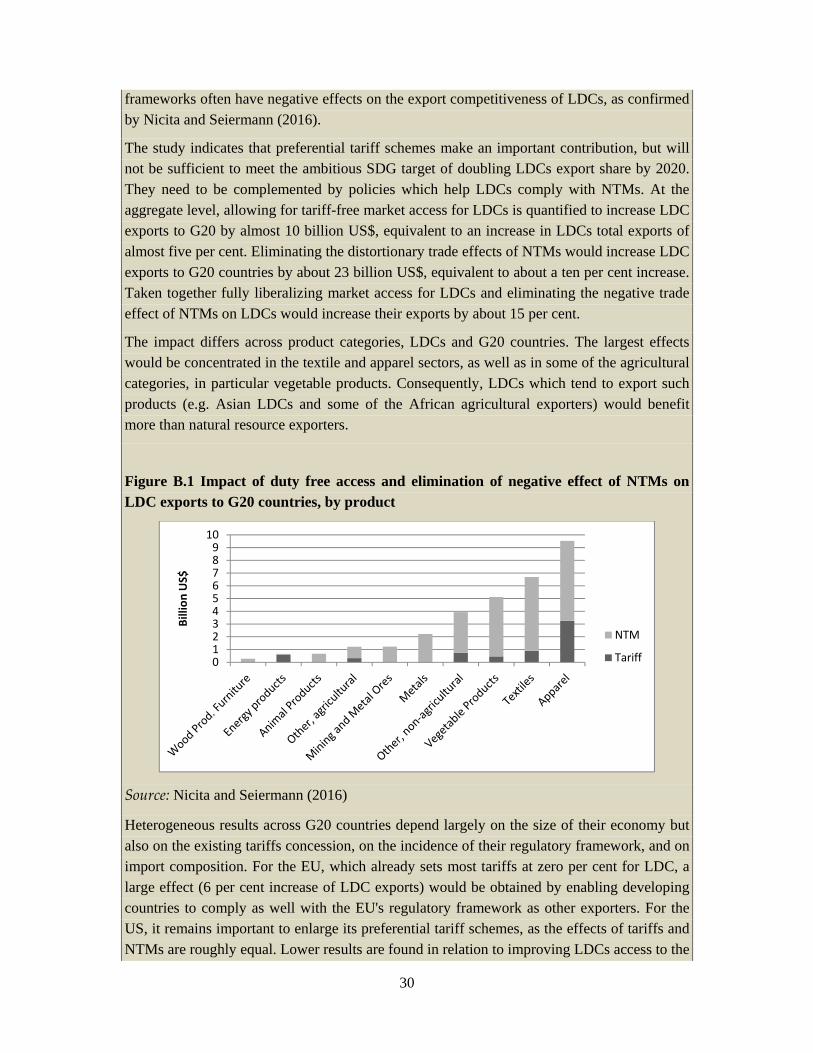
The impact differs across product categories, LDCs and G20 countries. The largest effects would be concentrated in the textile and apparel sectors, as well as in some of the agricultural categories, in particular vegetable products. Consequently, LDCs which tend to export such products (e.g. Asian LDCs and some of the African agricultural exporters) would benefit more than natural resource exporters.
Figure B.1 Impact of duty free access and elimination of negative effect of NTMs on LDC exports to G20 countries, by product
Source: Nicita and Seiermann (2016)
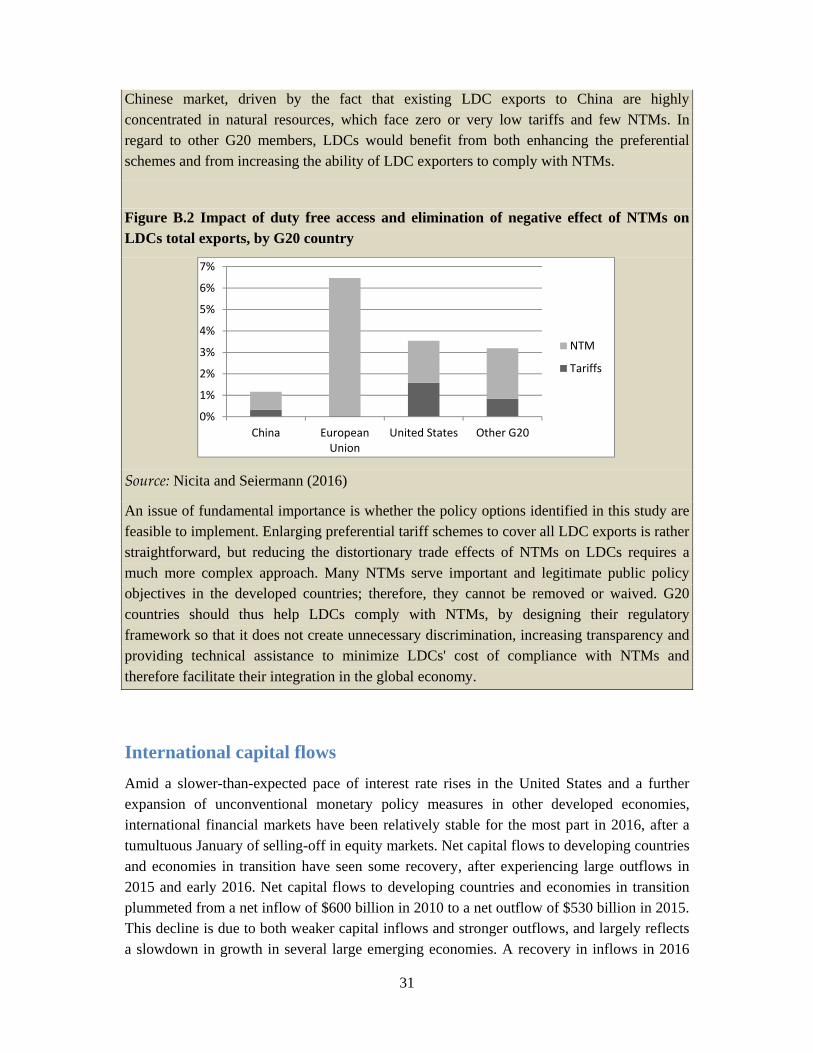
Heterogeneous results across G20 countries depend largely on the size of their economy but also on the existing tariffs concession, on the incidence of their regulatory framework, and on import composition. For the EU, which already sets most tariffs at zero per cent for LDC, a large effect (6 per cent increase of LDC exports) would be obtained by enabling developing countries to comply as well with the EU's regulatory framework as other exporters. For the US, it remains important to enlarge its preferential tariff schemes, as the effects of tariffs and NTMs are roughly equal. Lower results are found in relation to improving LDCs access to the
012345678910
Billion
US$
NTM
Tariff
31
Chinese market, driven by the fact that existing LDC exports to China are highly concentrated in natural resources, which face zero or very low tariffs and few NTMs. In regard to other G20 members, LDCs would benefit from both enhancing the preferential schemes and from increasing the ability of LDC exporters to comply with NTMs.
Figure B.2 Impact of duty free access and elimination of negative effect of NTMs on LDCs total exports, by G20 country
Source: Nicita and Seiermann (2016)
An issue of fundamental importance is whether the policy options identified in this study are feasible to implement. Enlarging preferential tariff schemes to cover all LDC exports is rather straightforward, but reducing the distortionary trade effects of NTMs on LDCs requires a much more complex approach. Many NTMs serve important and legitimate public policy objectives in the developed countries; therefore, they cannot be removed or waived. G20 countries should thus help LDCs comply with NTMs, by designing their regulatory framework so that it does not create unnecessary discrimination, increasing transparency and providing technical assistance to minimize LDCs' cost of compliance with NTMs and therefore facilitate their integration in the global economy.
International capital flows Amid a slower-than-expected pace of interest rate rises in the United States and a further expansion of unconventional monetary policy measures in other developed economies, international financial markets have been relatively stable for the most part in 2016, after a tumultuous January of selling-off in equity markets. Net capital flows to developing countries and economies in transition have seen some recovery, after experiencing large outflows in 2015 and early 2016. Net capital flows to developing countries and economies in transition plummeted from a net inflow of $600 billion in 2010 to a net outflow of $530 billion in 2015. This decline is due to both weaker capital inflows and stronger outflows, and largely reflects a slowdown in growth in several large emerging economies. A recovery in inflows in 2016
0%
1%
2%
3%
4%
5%
6%
7%
China EuropeanUnion
United States Other G20
NTM
Tariffs
32
can be expected to partially reverse this deterioration. China, however, continued to see net outflows of capital in 2016 and a decline in foreign exchange reserves, albeit at a much more modest pace than in 2015.
The recovery in capital flows to emerging market economies reflects both internal and external factors, including a mild recovery in international commodity prices; a slightly improved growth outlook in Brazil and the Russian Federation; and renewed search for yield amid record-low returns in developed economies. Global equity and debt markets have largely proven resilient, despite elevated global uncertainty. Financial markets recovered quickly from the unexpected outcome of the Brexit referendum in June 2016, in a large part due to the rapid and forceful response of developed country central banks.
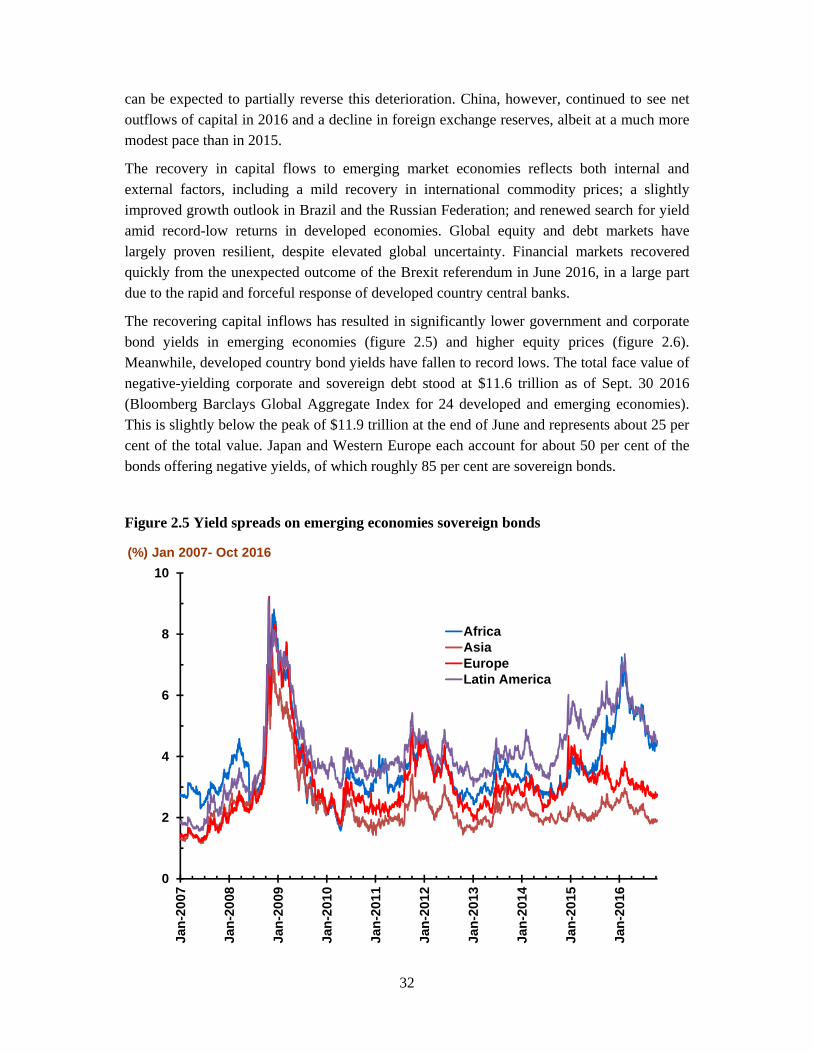
The recovering capital inflows has resulted in significantly lower government and corporate bond yields in emerging economies (figure 2.5) and higher equity prices (figure 2.6). Meanwhile, developed country bond yields have fallen to record lows. The total face value of negative-yielding corporate and sovereign debt stood at $11.6 trillion as of Sept. 30 2016 (Bloomberg Barclays Global Aggregate Index for 24 developed and emerging economies). This is slightly below the peak of $11.9 trillion at the end of June and represents about 25 per cent of the total value. Japan and Western Europe each account for about 50 per cent of the bonds offering negative yields, of which roughly 85 per cent are sovereign bonds.
Figure 2.5 Yield spreads on emerging economies sovereign bonds
0
2
4
6
8
10
Jan-
2007
Jan-
2008
Jan-
2009
Jan-
2010
Jan-
2011
Jan-
2012
Jan-
2013
Jan-
2014
Jan-
2015
Jan-
2016
AfricaAsiaEuropeLatin America
(%) Jan 2007- Oct 2016

33
Source: JPMorgan Chase.
Figure 2.6 Equity Market Indices in Selected Emerging Economies
Source: CEIC
Looking ahead, there are significant fragilities in the international financial system and major risks, both for developed and developing economies. The main underlying factor is the widening divergence between buoyant – and complacent – financial markets and persistently weak global economic growth that has resulted from the over-reliance on monetary policy to stimulate economic activity. Years of exceptionally expansionary monetary policy, and the lack of support on the fiscal side, has encouraged excessive risk taking and considerable distortions, and led to very high equity and asset prices, without ensuring a robust growth trajectory. Significant uncertainties and risks persist in the financial market, which may suddenly alter the volume, composition and pace of international capital flows. If the global divergences in policy rates and yields continue to widen, this may trigger disorderly adjustments in asset prices and change the volume and direction of capital flows, with significant adverse effects on the real economy, especially in large developing countries. A surge in risk aversion – driven, for example, by uncertainties regarding the implementation and actual impact of Brexit or by the outcome of the US Presidential election in November – has the potential to destabilize the financial markets worldwide.
60
70
80
90
100
110
120
130
140
Jan‐14
Mar‐14
May‐14
Jul‐1
4
Sep‐14
Nov‐14
Jan‐15
Mar‐15
May‐15
Jul‐1
5
Sep‐15
Nov‐15
Jan‐16
Mar‐16
May‐16
Jul‐1
6
Sep‐16
Index ( Jan '14 = 100)
Brazil South Africa Indonesia Philippines
34
Remittances Amid subdued global economic growth, remittance flows to developing countries in dollar terms virtually stagnated in 2015. Preliminary data for 2016 underscore that there are large differences not only across major geographic regions, but also within regions. Officially recorded remittances to developing countries amounted to $431.6 billion in 2015 (World Bank), an increase of only 0.4 per cent from 2014 – the lowest rate of increase since the global financial crisis.
The appreciation of the dollar and the low oil price constrained the growth in the dollar value of remittances in 2015. While the dollar appreciation has come to an end and the oil price has started to recover, both factors have continued to weigh on remittance flows in the first half of 2016. CIS countries that receive most of their remittance inflows from the Russian Federation continue to see contractions, following a massive drop in 2015, exacerbated by the sharp decline in the rouble’s value. The ongoing decline reflects the challenging labour market conditions and economic outlook in the Russian Federation.
Outflows from the Cooperation Council for the Arab States of the Gulf (GCC) have also slowed, negatively impacting South Asian economies, notably Bangladesh, India and Nepal. In certain cases, the flow of remittances in the “reverse direction” increased in 2016, for example, from Asian to Gulf countries or from Caucasus to the Russian Federation, as families in home countries tried to provide some support to the migrant workers facing temporary difficulties.
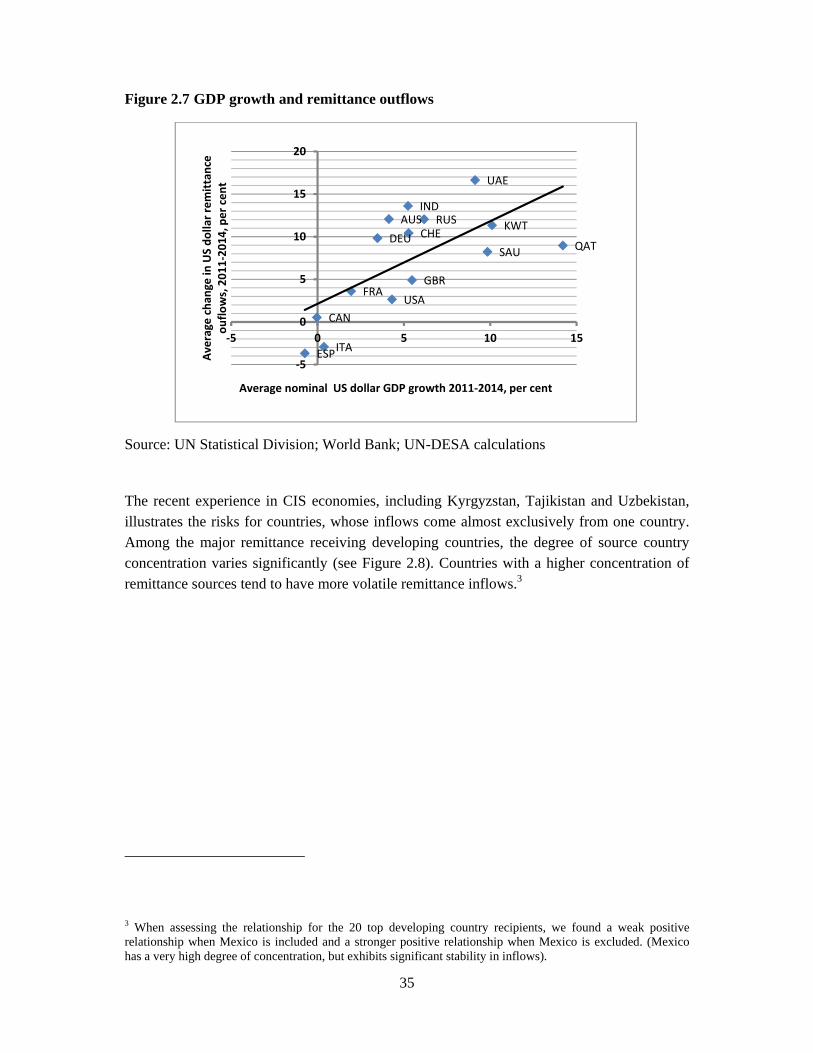
Remittance-receiving economies with a strong exposure to the United States and euro area countries have generally performed well, thanks to positive labour market trends. Remittance flows to Mexico, for example, increased by over 8 per cent (in US dollar terms) y-o-y in the first half of 2016 and at $13.2 billon far exceeded oil export revenues. It is clear that host country economic condition is an important determinant of remittance outflows (figure 2.7).
35
Figure 2.7 GDP growth and remittance outflows
Source: UN Statistical Division; World Bank; UN-DESA calculations
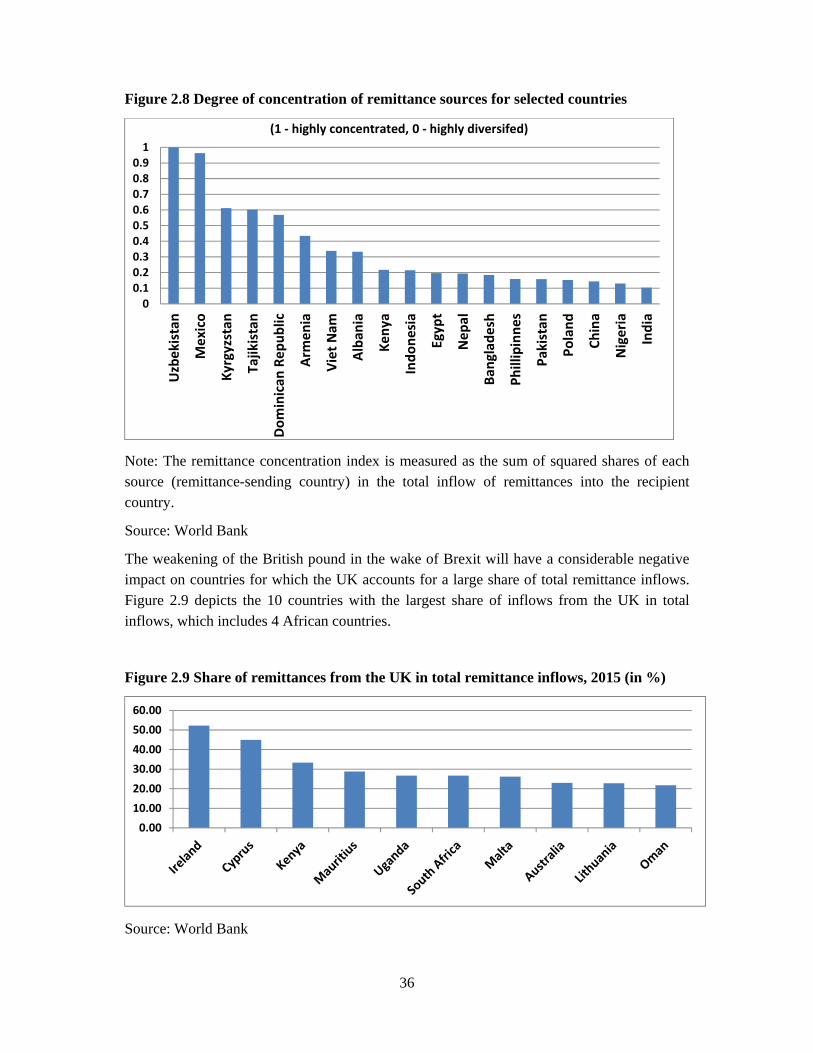
The recent experience in CIS economies, including Kyrgyzstan, Tajikistan and Uzbekistan, illustrates the risks for countries, whose inflows come almost exclusively from one country. Among the major remittance receiving developing countries, the degree of source country concentration varies significantly (see Figure 2.8). Countries with a higher concentration of remittance sources tend to have more volatile remittance inflows.3
3 When assessing the relationship for the 20 top developing country recipients, we found a weak positive relationship when Mexico is included and a stronger positive relationship when Mexico is excluded. (Mexico has a very high degree of concentration, but exhibits significant stability in inflows).
AUS
CAN
FRA
DEU
IND
ITA
KWT
GBR
ESP
QAT
RUS
SAUCHE
UAE
USA
‐5
0
5
10
15
20
‐5 0 5 10 15
Average chan
ge in
US do
llar rem
ittan
ce
ouflo
ws, 201
1‐20
14, per cen
t
Average nominal US dollar GDP growth 2011‐2014, per cent
36
Figure 2.8 Degree of concentration of remittance sources for selected countries
Note: The remittance concentration index is measured as the sum of squared shares of each source (remittance-sending country) in the total inflow of remittances into the recipient country.
Source: World Bank
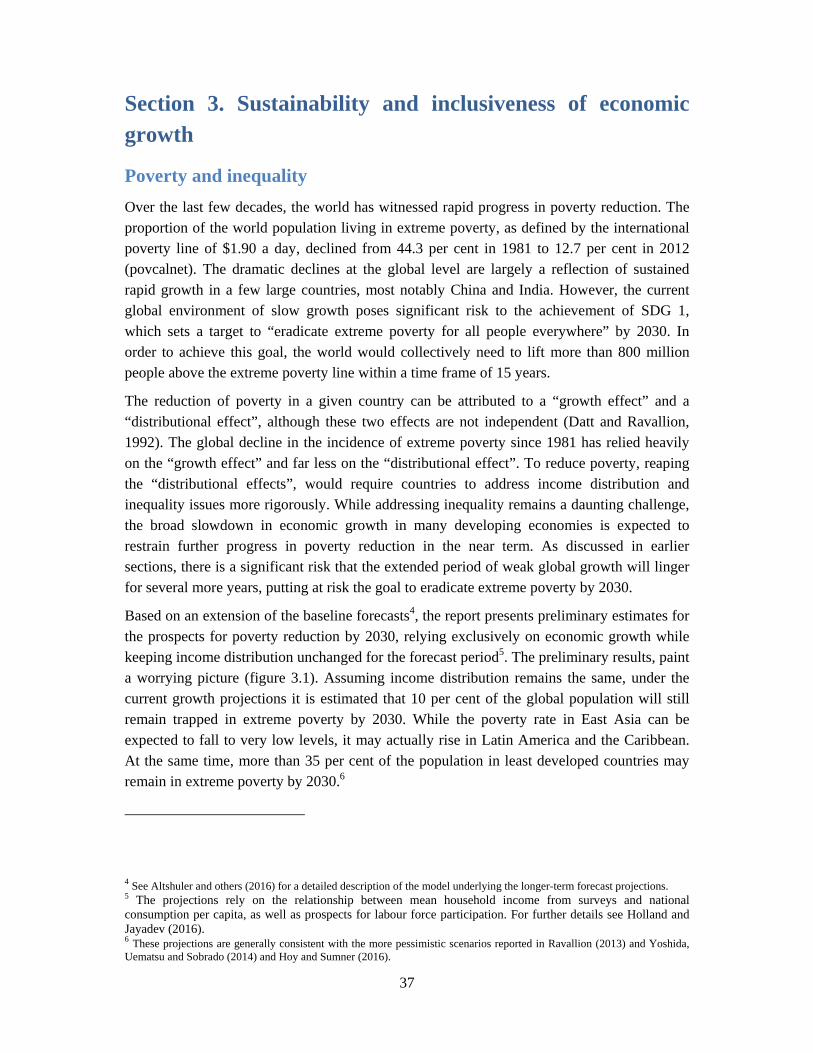
The weakening of the British pound in the wake of Brexit will have a considerable negative impact on countries for which the UK accounts for a large share of total remittance inflows. Figure 2.9 depicts the 10 countries with the largest share of inflows from the UK in total inflows, which includes 4 African countries.
Figure 2.9 Share of remittances from the UK in total remittance inflows, 2015 (in %)
Source: World Bank
00.10.20.30.40.50.60.70.80.91
Uzbekistan
Mexico
Kyrgyzstan
Tajikistan
Dom
inican
Rep
ublic
Armen
ia
Viet Nam
Alba
nia
Kenya
Indo
nesia
Egyp
t
Nep
al
Banglade
sh
Phillipinne
s
Pakistan
Poland
China
Nigeria
India
(1 ‐ highly concentrated, 0 ‐ highly diversifed)
0.0010.0020.00
30.0040.00
50.0060.00
37
Section 3. Sustainability and inclusiveness of economic growth
Poverty and inequality Over the last few decades, the world has witnessed rapid progress in poverty reduction. The proportion of the world population living in extreme poverty, as defined by the international poverty line of $1.90 a day, declined from 44.3 per cent in 1981 to 12.7 per cent in 2012 (povcalnet). The dramatic declines at the global level are largely a reflection of sustained rapid growth in a few large countries, most notably China and India. However, the current global environment of slow growth poses significant risk to the achievement of SDG 1, which sets a target to “eradicate extreme poverty for all people everywhere” by 2030. In order to achieve this goal, the world would collectively need to lift more than 800 million people above the extreme poverty line within a time frame of 15 years.
The reduction of poverty in a given country can be attributed to a “growth effect” and a “distributional effect”, although these two effects are not independent (Datt and Ravallion, 1992). The global decline in the incidence of extreme poverty since 1981 has relied heavily on the “growth effect” and far less on the “distributional effect”. To reduce poverty, reaping the “distributional effects”, would require countries to address income distribution and inequality issues more rigorously. While addressing inequality remains a daunting challenge, the broad slowdown in economic growth in many developing economies is expected to restrain further progress in poverty reduction in the near term. As discussed in earlier sections, there is a significant risk that the extended period of weak global growth will linger for several more years, putting at risk the goal to eradicate extreme poverty by 2030.
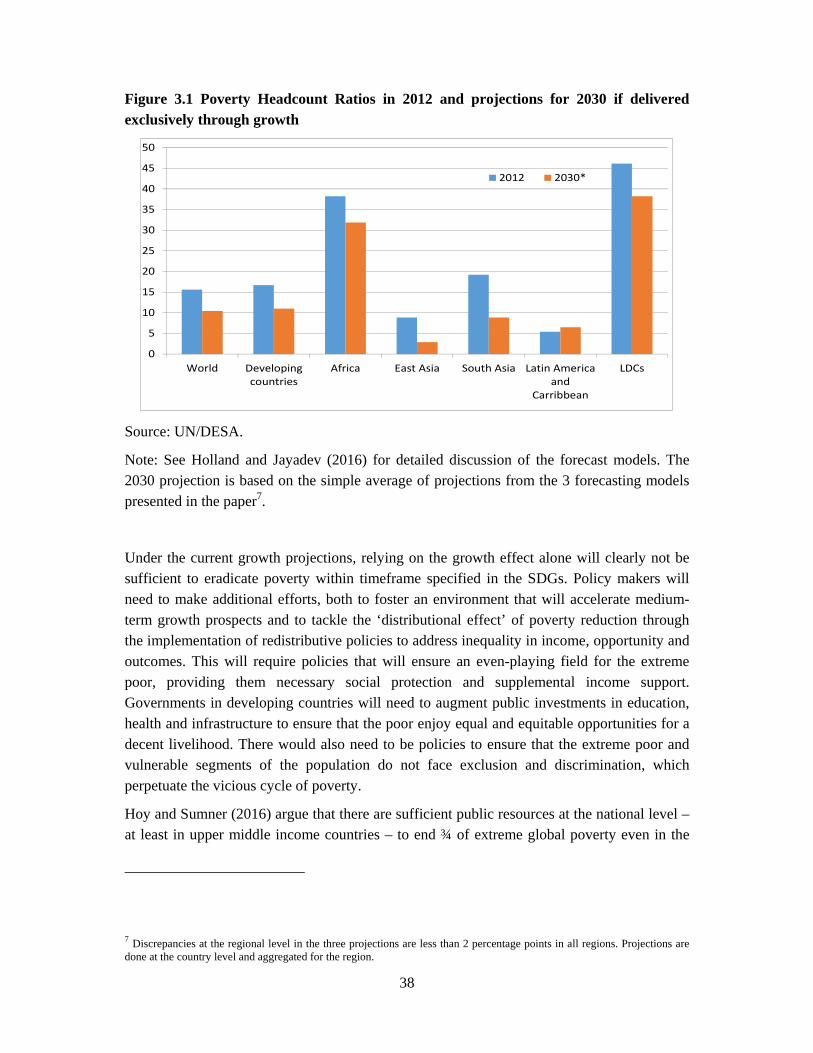
Based on an extension of the baseline forecasts4, the report presents preliminary estimates for the prospects for poverty reduction by 2030, relying exclusively on economic growth while keeping income distribution unchanged for the forecast period5. The preliminary results, paint a worrying picture (figure 3.1). Assuming income distribution remains the same, under the current growth projections it is estimated that 10 per cent of the global population will still remain trapped in extreme poverty by 2030. While the poverty rate in East Asia can be expected to fall to very low levels, it may actually rise in Latin America and the Caribbean. At the same time, more than 35 per cent of the population in least developed countries may remain in extreme poverty by 2030.6
4 See Altshuler and others (2016) for a detailed description of the model underlying the longer-term forecast projections. 5 The projections rely on the relationship between mean household income from surveys and national consumption per capita, as well as prospects for labour force participation. For further details see Holland and Jayadev (2016). 6 These projections are generally consistent with the more pessimistic scenarios reported in Ravallion (2013) and Yoshida, Uematsu and Sobrado (2014) and Hoy and Sumner (2016).
38
Figure 3.1 Poverty Headcount Ratios in 2012 and projections for 2030 if delivered exclusively through growth
Source: UN/DESA.
Note: See Holland and Jayadev (2016) for detailed discussion of the forecast models. The 2030 projection is based on the simple average of projections from the 3 forecasting models presented in the paper7.
Under the current growth projections, relying on the growth effect alone will clearly not be sufficient to eradicate poverty within timeframe specified in the SDGs. Policy makers will need to make additional efforts, both to foster an environment that will accelerate medium-term growth prospects and to tackle the ‘distributional effect’ of poverty reduction through the implementation of redistributive policies to address inequality in income, opportunity and outcomes. This will require policies that will ensure an even-playing field for the extreme poor, providing them necessary social protection and supplemental income support. Governments in developing countries will need to augment public investments in education, health and infrastructure to ensure that the poor enjoy equal and equitable opportunities for a decent livelihood. There would also need to be policies to ensure that the extreme poor and vulnerable segments of the population do not face exclusion and discrimination, which perpetuate the vicious cycle of poverty.
Hoy and Sumner (2016) argue that there are sufficient public resources at the national level – at least in upper middle income countries – to end ¾ of extreme global poverty even in the
7 Discrepancies at the regional level in the three projections are less than 2 percentage points in all regions. Projections are done at the country level and aggregated for the region.
0
5
10
15
20
25
30
35
40
45
50
World Developingcountries
Africa East Asia South Asia Latin Americaand
Carribbean
LDCs
2012 2030*
39
absence of acceleration in economic growth. While Ravallion (2009) concluded that the marginal tax rates needed to fund the fight against poverty in the mid-2000s were prohibitively high, updated estimates by Hoy and Sumner (2016) suggest that this may no longer be the case. It appears that many national governments in developing countries have the financial capacities to support those in extreme poverty through well-targeted cash transfers, funded either via new taxation on the non-poor or through the reallocation of public spending away from fossil fuel subsidies and military spending. The scope for poverty reduction via tax funded public transfers remains – for the most part – restricted to upper middle income countries8 and will do little to redress the persistently high rates of poverty in the least developed economies. However, the removal of fossil fuel subsidies in countries such as Ethiopia, Mozambique, Tanzania and Uganda – which often disproportionately benefit rich and middle-class households – could provide the needed national resources to reduce poverty levels by about one-third.
The historical evolution of income distribution suggests that stronger efforts would be needed in the future to reduce income inequality, given that within-country inequality has not seen much improvement in many regions for the past 30 years (see figure 3.2). The exception is Latin America and the Caribbean, which has seen broad-based decline in inequality since the early 2000s. The improvement can be largely attributed to the reduction in the earning gaps between skilled and low-skilled workers – a result of expanding basic education – and an increase in public transfer.9
Without an acceleration in both GDP growth and progress towards improving income inequality, eradicating the high levels of extreme poverty in the least developed economies by 2030 will remain a formidable challenge. While policies aimed at reducing inequality must play a crucial role, mobilizing the resources to support investment and productivity growth, as well as a commitment to share in prosperity both within and across national borders, are also essential to achieving the SDG targets.
8 It is estimated that a marginal tax rate of less than 10 per cent would be sufficient to support the tax-funded public transfers in upper middle income countries. 9 For more detailed discussions, please refer to: López-Calva, L. F., & Lustig, N. (2010). Explaining the decline in inequality in Latin America: Technological change, educational upgrading and democracy. Declining Inequality in Latin America: a decade of progress, 1-24.
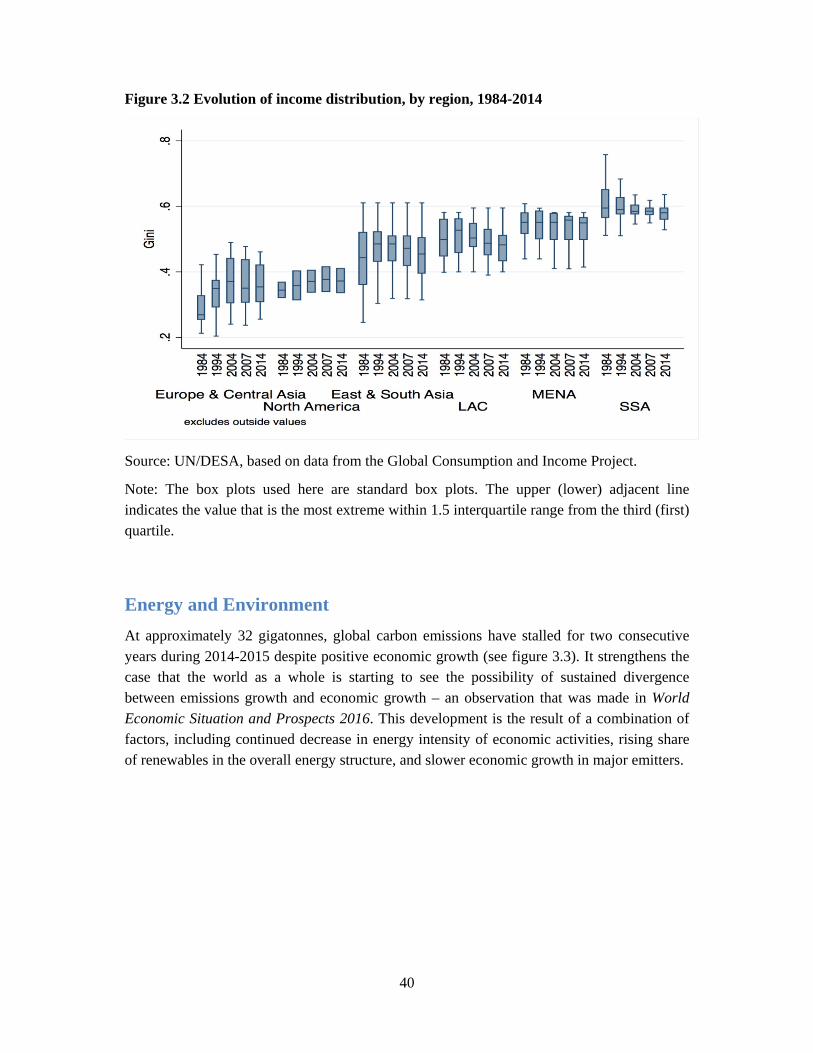
40
Figure 3.2 Evolution of income distribution, by region, 1984-2014
Source: UN/DESA, based on data from the Global Consumption and Income Project.
Note: The box plots used here are standard box plots. The upper (lower) adjacent line indicates the value that is the most extreme within 1.5 interquartile range from the third (first) quartile.
Energy and Environment At approximately 32 gigatonnes, global carbon emissions have stalled for two consecutive years during 2014-2015 despite positive economic growth (see figure 3.3). It strengthens the case that the world as a whole is starting to see the possibility of sustained divergence between emissions growth and economic growth – an observation that was made in World Economic Situation and Prospects 2016. This development is the result of a combination of factors, including continued decrease in energy intensity of economic activities, rising share of renewables in the overall energy structure, and slower economic growth in major emitters.
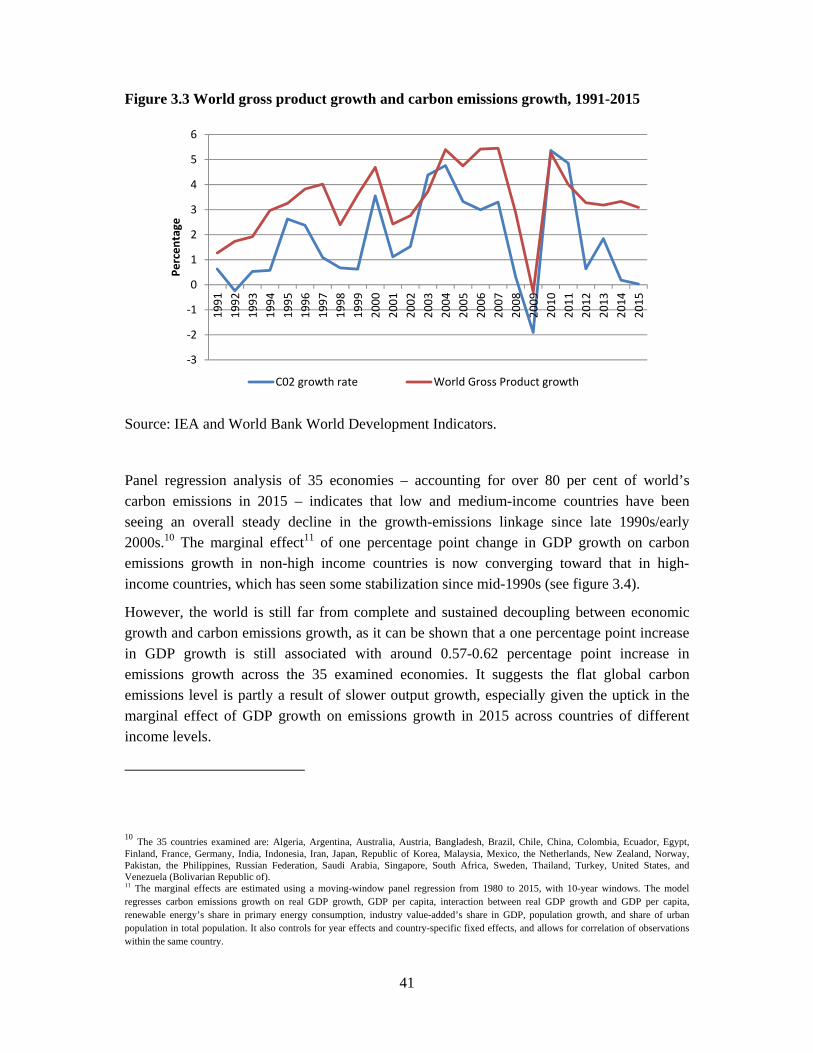
41
Figure 3.3 World gross product growth and carbon emissions growth, 1991-2015
Source: IEA and World Bank World Development Indicators.
Panel regression analysis of 35 economies – accounting for over 80 per cent of world’s carbon emissions in 2015 – indicates that low and medium-income countries have been seeing an overall steady decline in the growth-emissions linkage since late 1990s/early 2000s.10 The marginal effect11 of one percentage point change in GDP growth on carbon emissions growth in non-high income countries is now converging toward that in high-income countries, which has seen some stabilization since mid-1990s (see figure 3.4).
However, the world is still far from complete and sustained decoupling between economic growth and carbon emissions growth, as it can be shown that a one percentage point increase in GDP growth is still associated with around 0.57-0.62 percentage point increase in emissions growth across the 35 examined economies. It suggests the flat global carbon emissions level is partly a result of slower output growth, especially given the uptick in the marginal effect of GDP growth on emissions growth in 2015 across countries of different income levels.
10 The 35 countries examined are: Algeria, Argentina, Australia, Austria, Bangladesh, Brazil, Chile, China, Colombia, Ecuador, Egypt, Finland, France, Germany, India, Indonesia, Iran, Japan, Republic of Korea, Malaysia, Mexico, the Netherlands, New Zealand, Norway, Pakistan, the Philippines, Russian Federation, Saudi Arabia, Singapore, South Africa, Sweden, Thailand, Turkey, United States, and Venezuela (Bolivarian Republic of). 11 The marginal effects are estimated using a moving-window panel regression from 1980 to 2015, with 10-year windows. The model regresses carbon emissions growth on real GDP growth, GDP per capita, interaction between real GDP growth and GDP per capita, renewable energy’s share in primary energy consumption, industry value-added’s share in GDP, population growth, and share of urban population in total population. It also controls for year effects and country-specific fixed effects, and allows for correlation of observations within the same country.
‐3
‐2
‐1
0
1
2
3
4
5
6
1991
1992
1993
1994
1995
1996
1997
1998
1999
2000
2001
2002
2003
2004
2005
2006
2007
2008
2009
2010
2011
2012
2013
2014
2015
Percen
tage
C02 growth rate World Gross Product growth
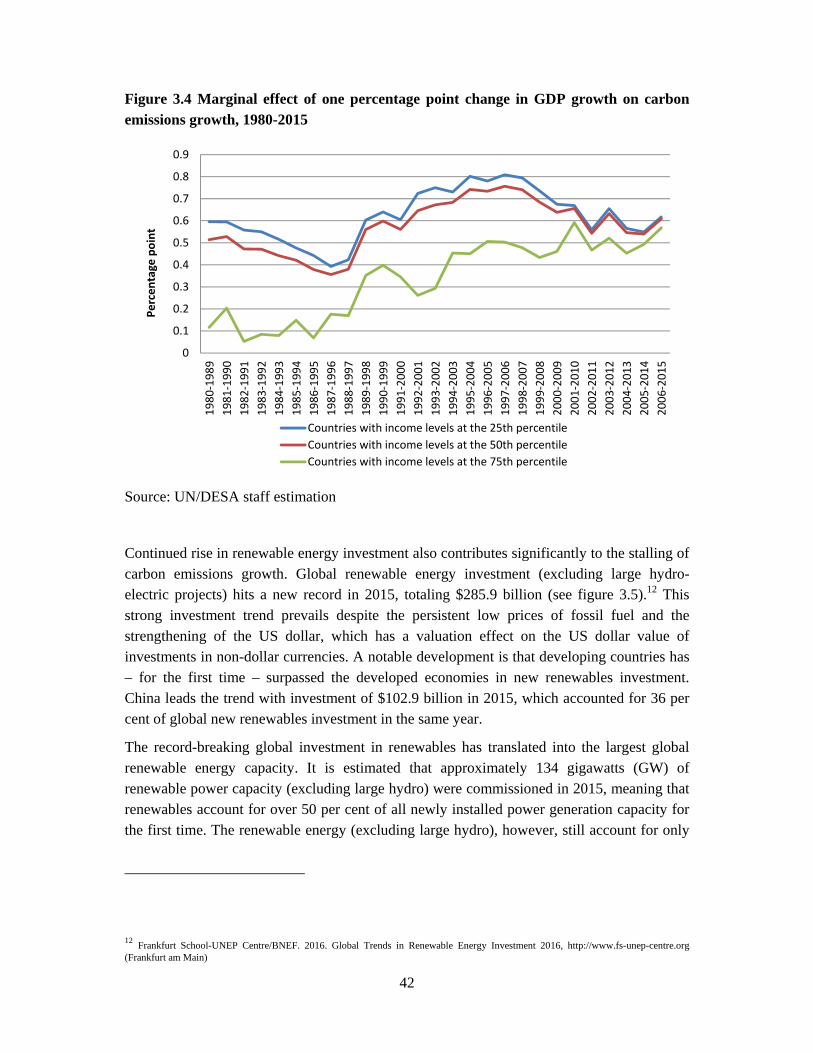
42
Figure 3.4 Marginal effect of one percentage point change in GDP growth on carbon emissions growth, 1980-2015
Source: UN/DESA staff estimation
Continued rise in renewable energy investment also contributes significantly to the stalling of carbon emissions growth. Global renewable energy investment (excluding large hydro-electric projects) hits a new record in 2015, totaling $285.9 billion (see figure 3.5).12 This strong investment trend prevails despite the persistent low prices of fossil fuel and the strengthening of the US dollar, which has a valuation effect on the US dollar value of investments in non-dollar currencies. A notable development is that developing countries has – for the first time – surpassed the developed economies in new renewables investment. China leads the trend with investment of $102.9 billion in 2015, which accounted for 36 per cent of global new renewables investment in the same year.
The record-breaking global investment in renewables has translated into the largest global renewable energy capacity. It is estimated that approximately 134 gigawatts (GW) of renewable power capacity (excluding large hydro) were commissioned in 2015, meaning that renewables account for over 50 per cent of all newly installed power generation capacity for the first time. The renewable energy (excluding large hydro), however, still account for only
12 Frankfurt School-UNEP Centre/BNEF. 2016. Global Trends in Renewable Energy Investment 2016, http://www.fs-unep-centre.org (Frankfurt am Main)
0
0.1
0.2
0.3
0.4
0.5
0.6
0.7
0.8
0.9
1980
‐1989
1981
‐1990
1982
‐1991
1983
‐1992
1984
‐1993
1985
‐1994
1986
‐1995
1987
‐1996
1988
‐1997
1989
‐1998
1990
‐1999
1991
‐2000
1992
‐2001
1993
‐2002
1994
‐2003
1995
‐2004
1996
‐2005
1997
‐2006
1998
‐2007
1999
‐2008
2000
‐2009
2001
‐2010
2002
‐2011
2003
‐2012
2004
‐2013
2005
‐2014
2006
‐2015
Percen
tage point
Countries with income levels at the 25th percentileCountries with income levels at the 50th percentileCountries with income levels at the 75th percentile
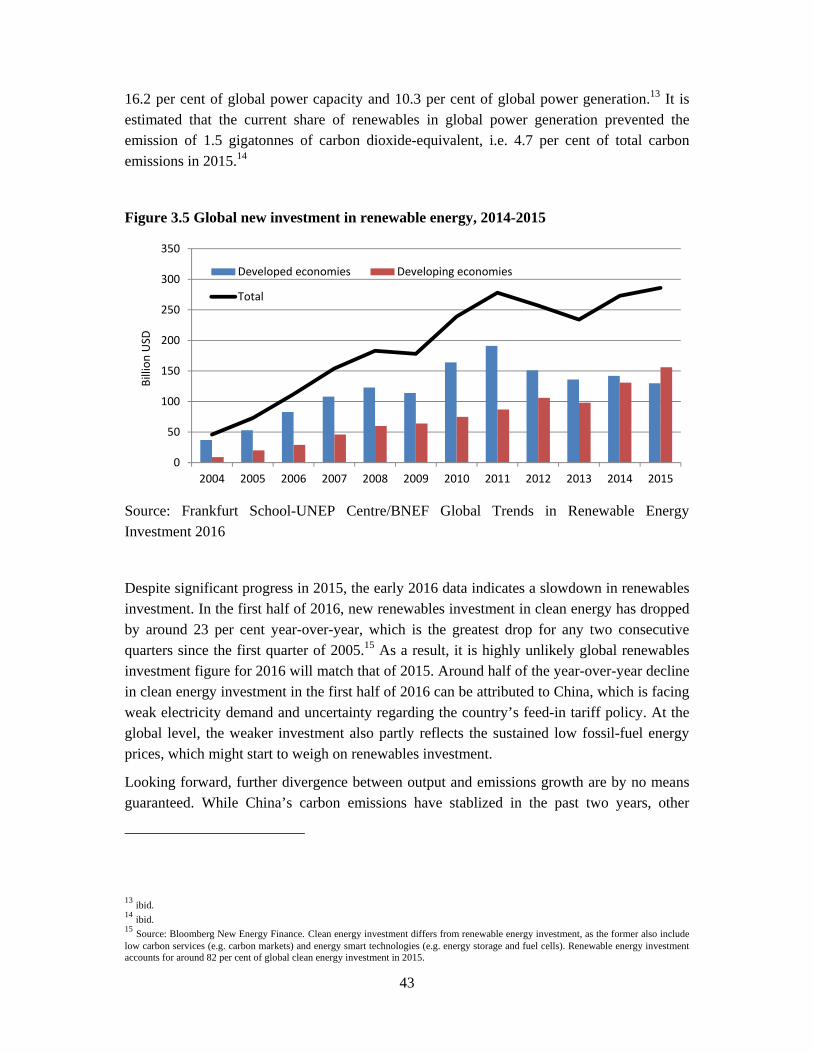
43
16.2 per cent of global power capacity and 10.3 per cent of global power generation.13 It is estimated that the current share of renewables in global power generation prevented the emission of 1.5 gigatonnes of carbon dioxide-equivalent, i.e. 4.7 per cent of total carbon emissions in 2015.14
Figure 3.5 Global new investment in renewable energy, 2014-2015
Source: Frankfurt School-UNEP Centre/BNEF Global Trends in Renewable Energy Investment 2016
Despite significant progress in 2015, the early 2016 data indicates a slowdown in renewables investment. In the first half of 2016, new renewables investment in clean energy has dropped by around 23 per cent year-over-year, which is the greatest drop for any two consecutive quarters since the first quarter of 2005.15 As a result, it is highly unlikely global renewables investment figure for 2016 will match that of 2015. Around half of the year-over-year decline in clean energy investment in the first half of 2016 can be attributed to China, which is facing weak electricity demand and uncertainty regarding the country’s feed-in tariff policy. At the global level, the weaker investment also partly reflects the sustained low fossil-fuel energy prices, which might start to weigh on renewables investment.
Looking forward, further divergence between output and emissions growth are by no means guaranteed. While China’s carbon emissions have stablized in the past two years, other
13 ibid. 14 ibid. 15 Source: Bloomberg New Energy Finance. Clean energy investment differs from renewable energy investment, as the former also include low carbon services (e.g. carbon markets) and energy smart technologies (e.g. energy storage and fuel cells). Renewable energy investment accounts for around 82 per cent of global clean energy investment in 2015.
0
50
100
150
200
250
300
350
2004 2005 2006 2007 2008 2009 2010 2011 2012 2013 2014 2015
Billion
USD
Developed economies Developing economies
Total

44
developing countries are still seeing increase in carbon emission levels. The overall downward trend of the marginal effect of GDP growth on carbon emissions growth witnessed in recent years could easily reverse if there is a lack of concerted efforts from the public and private sectors to improve energy efficiency and promote renewable energy. International cooperation on clean technology transfer and climate finance, among other areas, is also necessary. Countries will have to continue to pursue nationally-appropriate low-carbon development paths that are sustainable on economic, social and environmental fronts.
The pursuit of low-carbon paths in averting disastrous global warming is also critically important in the current environment of low productivity growth. A growing literature shows that higher temperature reduces growth rate in poor countries and countries that are located in high-temperature regions .16 The transmission channel from climate change to economic output is not only climate change’s well-documented impact on physical capital accumulation (e.g. infrastructure), but also its impact on labor supply and total factor productivity. Sensitivity of labor supply to temperature is apparent in outdoor economic activities, such as agriculture, construction, and mining, etc. There is also emerging evidence from micro data showing how thermal stress could affect productivity, through disrupting cognitive functioning and influencing behavioral responses of individuals in work environment. The disproportionate negative economic impact of higher temperature on poor countries suggests that climate change could exacerbate global income and wealth inequality, depressing output and productivity growth in developing countries. This effect could be further intensified given the poorest also has the least amount of resources to adjust and to recover from climate shocks.
Section 4. Uncertainties, risks and policy challenges
Major uncertainties and risks in the global economy
UncertaintiesassociatedwithBrexitThe initial shock emanated from the unexpected decision by the voters in the United Kingdom to leave the European Union (EU) in June 2016 (Brexit) to global financial markets was precipitous but faded quickly as well, partly because central banks responded promptly.
However, significant uncertainties remain in the coming years, associated with the process of the negotiations for the exit: Article 50 is expected to be triggered by March 2017 and the United Kingdom will leave the EU in 2019. These uncertainties are at three different levels: (1) the uncertainties about the future trade and financial arrangements between the United Kingdom and the EU, as well as the existing arrangements between the United Kingdom and
16 See Dell, M., Jones, B. F., & Olken, B. A. (2008). Climate change and economic growth: evidence from the last half century (No. w14132). National Bureau of Economic Research; and Heal, G., & Park, J. (2013). Feeling the heat: Temperature, physiology & the wealth of nations (No. w19725). National Bureau of Economic Research.
45
other countries which the EU holds with; (2) the uncertainties about the likelihood of similar actions taken by other EU members; and (3) the uncertainties about the change in the trend of global economic integration at large.
For example, if the EU cannot offer the United Kingdom the ability to restrict migration unilaterally while retaining full access to the single market, or remaining in the European Economic Area (EEA), the pattern of non-tariff barriers (NTBs) facing the United Kingdom may change considerably. The NTBs can be in various forms, such as quotas, voluntary export restraints, rules of origin, technical and administrative barriers, including product standards. Uncertainty is considerable about the changes in these factors, depending on future trade arrangements between the United Kingdom, the EU and the rest of the world.
The uncertainty about the changes in financial sector is also high. As a key global financial center, London plays critical role in banking, accounting for large global shares in cross-order lending, investment banking, wholesale banking, interest rate trading, European equity trading, and foreign exchange trading, as well as in other market functions such as market infrastructure, insurance and asset management. Under future arrangements, banks may incur additional expense associated with moving operations out of London. Banks may also have to bear the cost of additional capital, liquidity, and total loss-absorbing requirements. The financial sector may be subject to changes in the financial services rules, depending on the negotiations. The Brexit has already triggered outflows from the London real estate market, and more significant declines in foreign investment in commercial real estate of the United Kingdom are likely in the coming years. Meanwhile, the complex process of the exit negotiations by itself could erode households and businesses confidence, leading to lower foreign investment and human capital flows, worsening financing conditions.
Brexit has also highlighted a problem in the EU governance structure: the conflict between the supranational institutions (the European Commission and the European Parliament) and the intergovernmental institution (the Council of Ministers). Before the sovereign debt crisis in 2011, supranationalism was on the rise: the creation of EMU, with a new supranational institution in the ECB, and the increased power of the European Parliament. However, after the debt crisis, intergovernmentalism has revived: a number of intergovernmental arrangements were created, such as the Fiscal Compact, the Single Resolution Fund, and the European Stability Mechanism. It has recently been recognized that many people viewed the existing supranational institutions as elitist, remote, and slow-moving. With Brexit, it is uncertain how the EU governance structures will evolve.
From the global perspective, Brexit is not an isolated case, but part of a rising wave worldwide against the global economic integration, or the specific pattern of globalization in the past few decades. Concerns about the impact of the global economic integration on the widening inequality, job losses, and wage stagnation, as well as the rising conflicts among different cultures, have in many countries enhanced the appeal of protectionism and inward-looking policies.
46
These uncertainties may have to some extent already deferred long-term business investment, impeded international trade, and curbed economic growth, and will continue to do so in the future.
UncertaintiesandrisksassociatedwithnegativeinterestratesZero used to be considered as the lower bound of interest rates, but not anymore. Currently, at least six central banks (five in Europe, plus Japan), with the GDP of these economies accounting for 25 per cent of the world total, have set their policy interest rates negative. Moreover, the yields of many long-term bonds, which are not set by central banks but determined by capital markets, are also below zero. For example, about 30 per cent of the government bonds outstanding in global bond markets yield a negative rate of return: meaning, investors are willing to accept a loss by holding these bonds, as the price paid by the investors today is greater than the interest payments and principle repayment in the future.
Some justifications can be made for those central banks to set their policy rates negative. For example, facing continued growth stagnation and deflationary pressures, these central banks intended to break the conventional zero lower bound in order to show their resolve to meet their policy objectives. Indeed, negative policy rates in these economies have produced some desirable effects through the interest rate, credit, portfolio, and exchange rate channels: declines in money market rates and lower bank lending rates, although inflation expectation continued to decline in these countries on the contrary.
However, in the longer run, a number of uncertainties and risks are associated with the negative policy rates and the negative yields on longer term bonds.
If the central banks hold negative policy rates for a protracted period and/or make the rates further below zero, risks to financial stability could escalate. For example, profitability of banks and other financial intermediaries would be significantly eroded, undermining their financial resilience and curbing their lending capacity, contrary to the original intention of the negative policy rates to encourage bank lending.
Moreover, the negative yields on longer term bonds, as well as the broad low interest rate environment, pose risks to the solvency of certain types of financial institutions, including insurance companies and pension funds17. The business models of insurance companies are very sensitive to low interest rates. During 2016, equity prices for many insurance companies have been declining more than that of other sectors and credit default swap spreads for these companies have increased. A rising systemic risk of insurance sector could trigger contagion to the broader financial sector. At the same time, due to negative and low interest rates, many pension funds face widening funding gaps, as the present value of future liabilities exceeds the market value of their assets.
17 For more detailed analysis, see International Monetary Fund Global Financial Stability Report, October, 2016 http://www.imf.org/external/pubs/ft/gfsr/2016/02/pdf/text.pdf
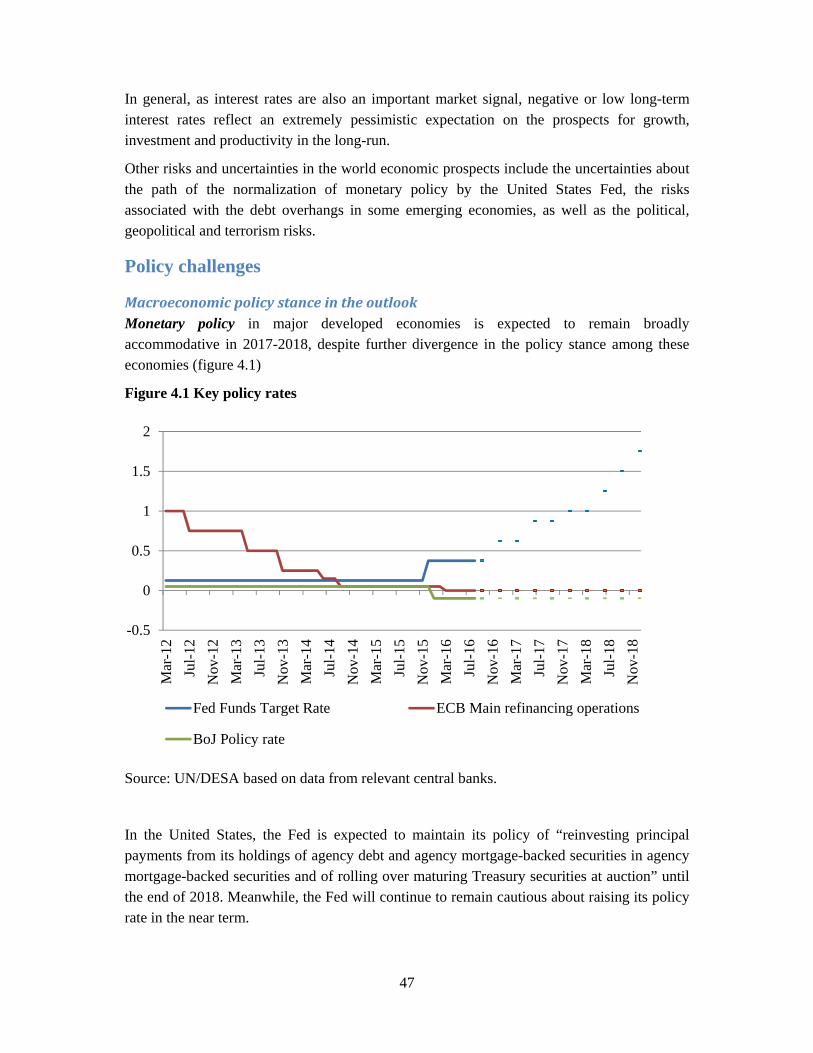
47
In general, as interest rates are also an important market signal, negative or low long-term interest rates reflect an extremely pessimistic expectation on the prospects for growth, investment and productivity in the long-run.
Other risks and uncertainties in the world economic prospects include the uncertainties about the path of the normalization of monetary policy by the United States Fed, the risks associated with the debt overhangs in some emerging economies, as well as the political, geopolitical and terrorism risks.
Policy challenges
MacroeconomicpolicystanceintheoutlookMonetary policy in major developed economies is expected to remain broadly accommodative in 2017-2018, despite further divergence in the policy stance among these economies (figure 4.1)
Figure 4.1 Key policy rates
Source: UN/DESA based on data from relevant central banks.
In the United States, the Fed is expected to maintain its policy of “reinvesting principal payments from its holdings of agency debt and agency mortgage-backed securities in agency mortgage-backed securities and of rolling over maturing Treasury securities at auction” until the end of 2018. Meanwhile, the Fed will continue to remain cautious about raising its policy rate in the near term.
-0.5
0
0.5
1
1.5
2
Mar
-12
Jul-1
2N
ov-1
2M
ar-1
3Ju
l-13
Nov
-13
Mar
-14
Jul-1
4N
ov-1
4M
ar-1
5Ju
l-15
Nov
-15
Mar
-16
Jul-1
6N
ov-1
6M
ar-1
7Ju
l-17
Nov
-17
Mar
-18
Jul-1
8N
ov-1
8
Fed Funds Target Rate ECB Main refinancing operations
BoJ Policy rate
48
The Bank of Japan (BOJ) is expected to continue implementing, until the end of 2018, the set of unconventional monetary policy measures announced in September 2016, which include two components: (1) a “quantitative and qualitative monetary easing with yield curve control” framework to anchor 10-year Japanese Government Bond yields at around current levels of 0 per cent; and (2) an explicit commitment to increase the monetary base until inflation overshoots the 2 per cent target.
The European Central Bank (ECB) will continue to maintain an extremely accommodative monetary policy stance that comprises three elements: policy interest rates at or below zero; Quantitative easing (QE) in the form of asset purchases in the amount of 80 billion euros per month; and targeted longer-term refinancing operations (TLTROs) intended to move banks to lend more money.
The Bank of England (BoE) reacted to the decision of the UK to leave the EU and the negative economic repercussions by cutting its policy interest rates by 25 basis points to 0.25 per cent and by increasing the volume of its QE measures. In the outlook, monetary policy in BOE is expected to be responsive to uncertainties and risks arising from new institutional arrangements in the process of exiting the EU.
Monetary policy stance varies significantly among developing countries and economies in transition.
Most central banks in the Commonwealth of Independent States (CIS) have reduced interest rates during 2016 in view of slowing inflation, some of them with significant margin; however in the largest economies of the region monetary easing is cautious.
Policy rates across major economies in developing East Asia are approaching or have reached historic low levels. With few exceptions, there remains some – albeit limited – room for further rate cuts in many economies, especially given the overall low inflationary environment. On the hand, three kay factors may weigh on the central banks in the region for their decision on further monetary easing: capital outflows, high levels of household and corporate debt, and impact of low interest rates on banks’ profit margin.
Monetary policy in South Asia continues to be moderately accommodative, on the back of subdued inflationary pressures and remaining output gaps in some economies. The accommodative stance is expected to continue in the forecast period, with some potential further easing in some countries.
In Western Asia, GCC countries have been gradually tightening monetary policy, following the movement of the United States Fed, due to the pegging of their currencies to the United States dollar. At the same time, facing the challenge of liquidity tightening, these countries are adopting different measures to boost liquidity, including injection of liquidity into the banking system through re-purchase agreement. In Turkey, after a couple cuts in interest rates in the second half of 2016, room for further monetary easing is limited in the face of the weak currency and high inflation.

49
In Latin America and the Caribbean, the monetary tightening cycle in South America is mostly over and some easing is expected for 2017-2018, in the face of declining inflation, stable or appreciating exchange rates and weak demand. The timing and scope of the easing path is, however, highly uncertain, especially in recession-hit Argentina and Brazil. The path of the United States Fed tightening and the degree of fiscal tightening in those countries which have planned to implement spending cuts are among the kay factors to determine the pace of monetary easing in this region. In Mexico, the central bank has increased interest rates three times in 2016 as the peso tumbled to a record low. In the outlook, the central bank is expected to remain focused on keeping inflationary pressures at a bay, particularly those emanating from a weak peso, despite subdued economic growth.
In Africa, weakening growth and rising inflationary pressures have complicated the conduct of monetary policy in the developing economies. During 2016, Angola, Mozambique, Nigeria and South Africa increased their key policy rates with the objectives of stemming capital outflows and preventing currency depreciation while containing rising inflation. However, the increase in borrowing costs will weigh on domestic economic activity, further constraining short-term growth. In contrast, a few African countries with easing or relatively low inflation, including Botswana, Kenya and Morocco, reduced their policy rates, reflecting the availability of more policy space in these economies to support growth. Amid large capital outflows and declining foreign exchange reserves, a few African countries devalued their exchange rates or removed currency pegs in 2016. For example, Nigeria removed its currency peg to the United States dollar in mid-2016, a move aimed at alleviating severe foreign currency shortages and reducing price distortions in the economy. The Nigerian naira subsequently depreciated sharply, losing more than 40 per cent of its value over just a few months.
Fiscal policy may be approaching an inflection point in some major developed economies, moving away from the tight fiscal austerity programmes that have been in place for the most part since 2010, towards a more expansive fiscal stance.
In the United States, fiscal policy is expected to remain broadly neutral in 2017-2018, with policy continuity broadly maintained, depending on the outcome of the election in November 2016. After 6 consecutive years of decline, national defence outlays are expected to stabilise in 2017. Total government spending (federal, state and local) will remain flat during 2017-2018. No significant tax changes are planned in the current budget. Infrastructure expansion is likely, regardless of the election result.
In Japan, the new fiscal stimulus programme announced in mid-2016 is expected to increase spending by national and local governments by 7.5 trillion yen, which includes 4.6 trillion yen in additional spending in FY2016. The additional spending allocated for FY 2016 is equivalent to around 0.9 per cent of GDP and a 4.8 per cent expansion from the original government budget for the fiscal year. The Government has postponed the next consumption tax increase to 2019 at earliest, and announced a significant expansion of public works spending.
50
Fiscal policy in Western Europe maintains a tightening stance overall, given institutional requirements such as the excessive-deficit mechanism of the European Union or because of political preferences. However, the negative impact from fiscal consolidation on growth is diminishing. Some countries, such as Germany and Austria, will see significant fiscal spending requirements in view of the large number of migrants and the challenge of integrating these into their societies and labour markets. In the United Kingdom, the decision to leave the EU has major implications for fiscal policy, with an expected increase in its budget deficit in coming years.
Among developing countries and economies in transition, fiscal policy stance continues to vary significantly from region to region. More detailed discussion on country-specific fiscal policy can be found in Chapter IV.
In the CIS, energy-exporting countries are expected to tighten government spending, while energy-importing countries will maintain largely a neutral or slightly expansionary fiscal stance; in some cases this will lead to higher public debt levels. For example, in the Russian Federation, while the budget for 2017-2019 is still under stipulation, spending is likely to be reduced in nominal terms, implying an even deeper real contraction; the authorities are planning to increase domestic borrowing and to mobilize household savings to channel them into investment.
Fiscal stance of economies in developing East Asia has been mostly expansionary and countercyclical in 2015-2016, amid weak regional growth and limited room for furthering monetary easing. Overall fiscal balance saw broad-based worsening across the region, resulting in higher public debt.
In South Asia, fiscal policies are stipulated to be in a moderately tight stance in most economies in South Asia, but in reality, some economies have implemented more expansionary policies. Budget deficits are expected to remain high in most economies. The region needs to increase its efforts to strengthen the tax base.
In Western Asia, fiscal policy is under consolidation in GCC countries, including significant cuts in spending and subsidies and increases in taxes, as well as new issuance of debt. For example, by the end of 2016, Saudi Arabia is expected to sell its first international bond of about $10 billion to finance its large budget deficit, which reached a record high of about 15 per cent in 2015. In some cases, privatization plans are also underway. The fiscal situation in conflict-affected countries has worsened in 2016, particularly in Iraq, Syria and Yemen. Meanwhile, weak revenue prospects continue in Jordan and Lebanon, and public debt levels are estimated to expand. Both countries continued to require international financial support for their efforts to accommodate the Syrian refugees. In Turkey, fiscal policy is expected to remain relatively tight.
Fiscal policy will remain tight in Latin America in the outlook period as Governments respond to lower commodity prices and macroeconomic imbalances. The fiscal adjustment will generally be gradual, with Governments trying to minimize the downward pressure on
51
aggregate demand. Some positive effects on investment are expected from more credible and stringent fiscal policy, including forward guidance.
In Africa, persistently low commodity prices have intensified fiscal pressures in the commodity-dependent economies. The decline in global oil prices has resulted in a decline in commodity-related fiscal revenue and higher external debt, amid weakened domestic currencies. As a result, many African countries announced budget cuts or fiscal reform measures. For example, Algeria, Angola and Congo announced significant budget cuts during 2016. Nigeria and Zambia have sought financial assistance from international organisations amid deterioration in their external and fiscal positions. While the projected recovery in commodity prices is expected to alleviate fiscal strains, downside risks remain to the sustainability of fiscal positions in Africa. Cutbacks or delays in much needed infrastructure investment in Africa, such as in the areas of healthcare, energy and transport, will constrain productivity growth, undermining progress on economic and social development.
TheneedsforreorientingtowardsamoreeffectivepolicymixThe macroeconomic policy stances as discussed in the section above are mostly based on the policy announcements made by the authorities of individual countries. These policy stances are, however, not necessarily the optimal options for these economies, nor for the global economy as whole. They may not be sufficient to extricate the world economy from the protracted quagmire of subdued growth, stagnated trade flows, feeble investment, flagging productivity and ballooned debt levels in the aftermath of the global crisis.
Moreover, many economies have excessively depended on monetary policy alone. Monetary policy has played an important role in the aftermath of the global crisis and remains crucial, but monetary policy cannot substitute the fiscal policy and other policies, including reforms of financial, goods and labour markets.
For example, in order to revive the dwindling productivity growth, measures are needed to improve educational system, invest more in worker training, promote capital investment, including infrastructure investment, increase spending on research and development, and reform regulations. All this is beyond monetary policy and in some cases is also be beyond the scope of fiscal policy.
A reorientation towards a more effective macroeconomic policy mix would exploit fiscal support along three routes.
First, countries that have sufficient fiscal space and face low borrowing costs should raise fiscal expenditures, in particular by expanding public investment in infrastructure, research and development and other areas that can lift potential growth. From a global perspective, the most effective strategy would be a coordinated fiscal stimulus by a group of large developed and emerging economies, similar to the G20 agreement on coordinated stimulus measures in 2009. This would ensure that a maximum number of countries in all regions benefit from the positive spillover effects, thus helping to raise the global multiplier. If the fiscal spending
52
were directed towards capacity-raising investment, the net impact on government debt would be even smaller.
Second, even where fiscal space is limited, there is ample room for Governments in both developed and developing countries to enhance the medium-term impact on growth and employment generation by improving the efficiency of fiscal measures. This could encompass a partial reallocation of public expenditures from consumption to investment, as well as a range of structural reforms aimed at strengthening employment and productivity.
Third, Governments in developing and transition economies should aim to gradually expand fiscal space by increasing revenues. This would allow increased investment in infrastructure, health, education and environmental protection measures, without incurring further debt.
Broadening the tax base, strengthening tax administration and increasing compliance can help create additional fiscal space for countercyclical policies and increased development spending. The reorientation of the policy mix should be part of a broader medium-term fiscal sustainability framework that will eventually bring the public debt burden down to more sustainable levels.
Enhancinginternationalpolicycoordinationunderthenew2030Agenda2016 marks the beginning of the implementation of the 2030 Agenda for Sustainable Development, which includes 17 Sustainable Development Goals (SDGs) and 169 targets, cross-cutting economic, social and environmental dimensions of sustainable development.
It is imperative to recognize that any efforts to revitalize global economic growth, attain full employment and maintain macroeconomic stability are the integral part, rather than exogenous, of the overall efforts to implement the 2030 Agenda. Sustained, inclusive and sustainable growth, full employment and macroeconomic stability are already included in the SDGs. Therefore, macroeconomic policy measures to support economic growth should be integrated with social and environmental policies as so to make balanced achievement in the SDG.
While a systematic integrative policy approach to the implementation of the 2030 Agenda can only be developed through the practice by the Member States and international organizations in the years to come, some ad hoc measures can be taken to improve international policy coherence and consistency in a number areas.
Boosting international trade
The central role of the WTO in the global economy must be reaffirmed, as the WTO provides a unique rules-based, transparent, non-discriminatory, open and inclusive multilateral trading system. Concerted efforts should be made to curb the rising number of restrictive measures on trade in goods and services since the global financial crisis, and to roll back protectionist measures.
The WTO members should expedite the implementation of the Trade Facilitation Agreement (TFA), in order to lower global trade costs. In this regard, international efforts are needed to
53
provide capacity building and technical assistance for developing countries in their implementation of TFA.
International coordination is needed to ensure consistency and complement among trade policy, investment policy and other public policies so as to revive the faltering development of global value chains (GVCs), which are important drivers of international trade and investment flows, as well as global growth. Accordingly, efforts are needed to support an open, transparent, and competitive services market, so as to facilitate the participation of service providers, especially from developing countries and low income countries, in GVCs,
International cooperative efforts are also needed to reduce trade financing gaps, which are found to be highest among the poorest countries, notably in Africa, developing Asia and Small Island developing states, as well as SMEs.
Promoting infrastructure investment
Increased investment in sustainable and resilient infrastructure is a prerequisite for achieving the 2030 Agenda, including the SDGs, and at the same time can also stimulate short-term global growth and boost potential growth in the longer run.
In the Addis Agenda, an integral part of the 2030 Agenda, countries agreed on actions to help overcome barriers to infrastructure investment on both the demand and supply sides. The Agenda encourages long-term institutional investors to allocate a greater percentage of their investment to infrastructure, particularly in developing countries. It is important for policy frameworks to be geared toward long-term investment, so as to mitigate the risk that global efforts for increased investment in infrastructure will focus on a limited number of countries, and only on sectors with potential cash flows. Incentive structures of many private investors need to be aligned with the long-term investment horizon necessary for many infrastructure projects.
Development banks play important roles in infrastructure investment. The Global Infrastructure Forum launched by the World Bank Group, in cooperation with other Multilateral Development Banks (MDBs) and UN-DESA in April 2016 can coordinate the efforts among MDBs, so that they can work together on infrastructure financing in several areas, such as project preparation and improving data and information, ensuring their focus on the poorest countries and the poorest members of the societies and ensuring infrastructure investment is resilient and aligned with sustainable development.
In addition, international policy cooperation and coordination need to be strengthened also in the areas such as international public finance and official development assistance (ODA), international tax cooperation, illicit financial flows, global financial safety net, governance reform of the IMF and World Bank Group, and refugees and migrants.
54
Section 5. Regional economic prospects
Developed economies
UnitedStatesGDP growth in the United States is expected to average 1.5 per cent in 2016, which allows for a modest uptick in growth in the second half of the year as inventory destocking eases. In 2017, more solid growth of 2 per cent is expected, which is broadly in line with potential. There is however considerable uncertainty regarding the future direction of US monetary, fiscal, trade and immigration policies in the context of the election in November, which may have far-reaching spillover effects on both domestic and global economic prospects.
By December 2015, economic conditions in the United States had strengthened sufficiently for the Federal Reserve (Fed) to introduce its first interest rate rise since rates were reduced to near-zero levels at the height of the financial crisis in December 2008. While the immediate financial market response to the Fed’s move was relatively subdued, the real economy has subsequently suffered a significant short-term setback, with annualized GDP growth of just 0.8-1.4 per cent recorded in 2015Q4-2016Q2. The sharper than expected deterioration in growth since the fourth quarter of 2015 primarily reflects a steep adjustment in non-farm inventories and a contraction in private sector non-residential investment, especially in oil-related sectors. While the inventory adjustment is a temporary phenomenon, the persistent weakness of investment is symptomatic of the broader global trend that continues to hamper productivity growth.
Labour productivity, measured as output per hour in the non-farm business sector, rose by less than 1 per cent in 2015 and declined at an annual rate of 0.6 per cent in the first and second quarters of 2016. Given the protracted period of weak investment in the United States and other large developed economies, as discussed in section 1, a sudden rebound in productivity growth is not anticipated. This will restrain short-term prospects for economic growth.
In the first half of 2016, private non-residential fixed investment declined at an annual rate of 2.8 per cent (figure 5.1). While this may in part be attributable to the modest tightening of bank lending conditions since the Fed’s interest rate move, it predominantly stems from structural adjustment to the low oil price in the energy sector and heightened economic uncertainty related to a number of factors, including the policy environment following the presidential election in the United States in November 2016.
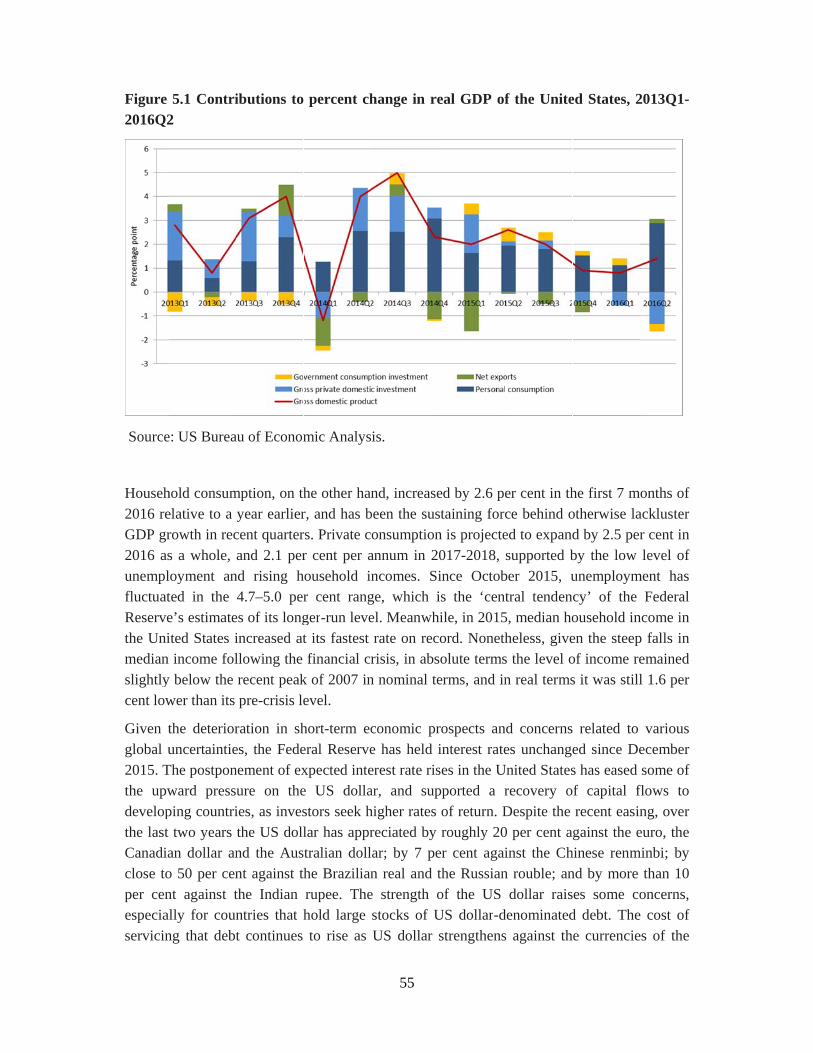
Figure 2016Q2
Source
Househ2016 reGDP gr2016 asunemplfluctuatReservethe Unimedian slightlycent low
Given tglobal u2015. Tthe upwdevelopthe last Canadiaclose toper cenespeciaservicin
5.1 Contri2
e: US Burea
hold consumelative to a rowth in recs a whole, loyment anted in the e’s estimateited States iincome fol
y below the wer than its
the deterioruncertaintie
The postponward pressuping countri
two years an dollar ano 50 per cennt against tlly for coun
ng that debt
ibutions to
au of Econom
mption, on thyear earlier
cent quarterand 2.1 per
nd rising h4.7–5.0 per
es of its longincreased atllowing the recent peakpre-crisis le
ration in shes, the Fedenement of exure on theies, as investhe US dollnd the Ausnt against ththe Indian ntries that ht continues
percent ch
mic Analys
he other hanr, and has brs. Private cr cent per a
household ir cent rangger-run levet its fastest financial cr
k of 2007 inevel.
hort-term eceral Reservexpected intee US dollastors seek hlar has apprtralian dollhe Brazilianrupee. Thehold large to rise as
55
hange in re
sis.
nd, increasebeen the susonsumption
annum in 2ncomes. Si
ge, which iel. Meanwhrate on recrisis, in abs
n nominal te
conomic pre has held ierest rate risar, and suphigher rates reciated by lar; by 7 pen real and te strength ostocks of UUS dollar
eal GDP of
ed by 2.6 pestaining forcn is projecte017-2018, ince Octobis the ‘cent
hile, in 2015cord. Nonethsolute termserms, and in
rospects aninterest rateses in the Upported a rof return. Droughly 20
er cent agaithe Russianof the US US dollar-dstrengthens
f the Unite
er cent in thce behind oed to expandsupported b
ber 2015, utral tenden
5, median hoheless, gives the level on real terms
nd concernses unchange
United Statesrecovery oDespite the 0 per cent ainst the Chn rouble; an
dollar raisdenominateds against th
ed States, 2
he first 7 motherwise lad by 2.5 perby the low unemploymcy’ of the ousehold inen the steepof income res it was still
related to ed since Des has eased f capital frecent easingainst the e
hinese renmnd by more es some co
d debt. Thee currencie
2013Q1-
months of ackluster r cent in level of
ment has Federal
ncome in p falls in emained l 1.6 per
various ecember some of
flows to ng, over euro, the
minbi; by than 10
oncerns, e cost of es of the
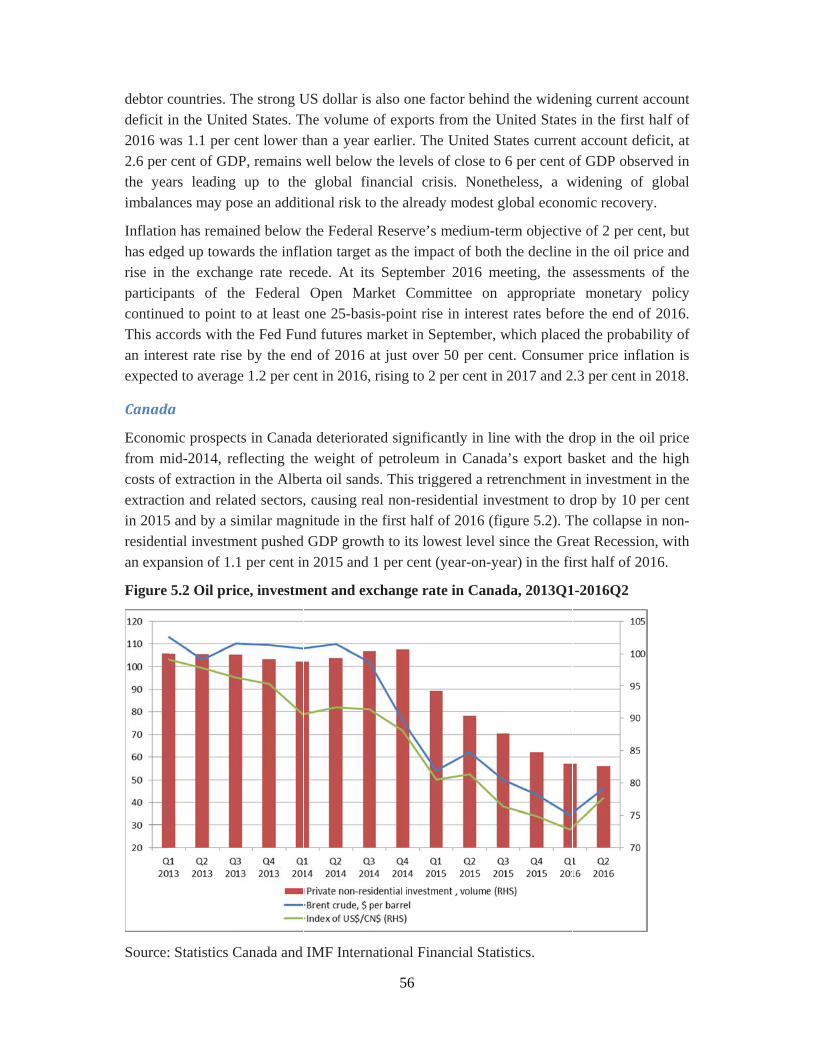
debtor cdeficit i2016 w2.6 per the yeaimbalan
Inflationhas edgrise in participcontinuThis acan interexpecte
Canada
Economfrom mcosts ofextractiin 2015residentan expa
Figure
Source:
countries. Tin the Unite
was 1.1 per ccent of GD
ars leading nces may po
n has remaiged up towa
the exchanpants of thued to point cords with rest rate riseed to averag
a
mic prospecmid-2014, ref extraction ion and rela5 and by a stial investm
ansion of 1.
5.2 Oil pri
: Statistics C
The strong Ued States. Tcent lower t
DP, remains up to the
ose an addit
ined below ards the inflange rate reche Federal
to at least the Fed Fune by the en
ge 1.2 per ce
ts in Canadeflecting thein the Albe
ated sectors,imilar magn
ment pushed1 per cent in
ce, investm
Canada and
US dollar isThe volume than a year well below
e global fintional risk to
the Federalation target cede. At its
Open Maone 25-basnd futures m
nd of 2016 aent in 2016,
da deteriorate weight oferta oil sand, causing renitude in th
d GDP grown 2015 and
ment and ex
IMF Intern
56
also one faof exports earlier. The
w the levels nancial crio the alread
l Reserve’s as the impa
s Septembearket Commis-point rise
market in Seat just over rising to 2
ted significaf petroleumds. This trigeal non-residhe first half wth to its low
1 per cent (
xchange rat
national Fina
actor behindfrom the Ue United Stof close to sis. Noneth
dy modest gl
medium-teact of both er 2016 memittee on e in interesteptember, wr 50 per cenper cent in
antly in linem in Canadaggered a retrdential inveof 2016 (figwest level si(year-on-ye
te in Canad
ancial Statis
d the widenUnited Statestates current6 per cent oheless, a wlobal econo
rm objectivthe decline
eeting, the appropriatet rates befo
which placent. Consume2017 and 2
e with the da’s export brenchment iestment to dgure 5.2). Tince the Grar) in the fir
da, 2013Q1
stics.
ning current s in the first account deof GDP obswidening ofomic recove
ve of 2 per cin the oil passessment
e monetaryre the end od the probaer price inf.3 per cent
drop in the obasket and tin investmendrop by 10
The collapseeat Recessirst half of 2
1-2016Q2
account t half of eficit, at erved in f global
ery.
cent, but price and s of the
y policy of 2016.
ability of flation is in 2018.
oil price the high nt in the per cent
e in non-on, with
2016.
57
The Canadian dollar has depreciated by about 20 per cent against the US dollar since mid-2014, illustrating the close correlation between the oil price and this bilateral rate. Consumer price inflation averaged 1.1 per cent in 2015, and is expected to rise to just 1.6 per cent in 2016. The Bank of Canada has kept monetary policy unchanged since July 2015, and considers inflation on track to reach its 2 per cent target in 2017.
Despite the sharp deterioration in terms of trade and loss of export revenue, household consumption has held up relatively well in Canada, with growth of 2.1 per cent per annum projected for 2016-2017. The unemployment rate, at 7 per cent, remains in line with its average level in 2014. Unemployment is expected to average 7.0 per cent in 2017 and 6.8 per cent in 2018.
Housing investment also remains strong, expanding by 3.8 per cent in 2015 and 4 per cent (year-on-year) in the first half of 2016. This strength is partly a reflection of the accommodative monetary and financial conditions.
In the budget of March 2016, the Government set out an ambitious plan of fiscal expansion focused on investment in basic infrastructure, marking a departure from the previous Government’s policy priority of achieving a balanced budget. While the shift in policy will allow the general government deficit to deteriorate towards 3 per cent of GDP in 2016, it will offer support to the flagging economy in 2017. Coupled with the modest revival in commodity prices and some competitiveness gains from the exchange rate depreciation, GDP growth in Canada is forecast to accelerate from 1.2 per cent in 2016 to 2.6 per cent in 2017.
Key risks to the outlook for Canada are dominated by the international environment, and in particular the outlook for the US economy; economic relations with the US, especially within the context of NAFTA; and the evolution of the oil price. Domestic uncertainties revolve around how quickly and effectively the fiscal stimulus will feed into the economy. A sharp slowdown in residential investment or house prices is also a risk.
Japan
Japan has seen some rebound in activity in the first half of 2016, partly reflecting additional monetary easing measures introduced in January. In the second quarter of 2016, GDP expanded by 0.2 per cent, marking the second consecutive quarter of positive growth. This was supported by rising household consumption and private residential investment, as well as some recovery in government investment. However, private non-residential investment and exports both declined in the first half of 2016, and the economy remains restrained by the strong exchange rate, which is one of the forces that have pushed the economy back into deflation. High frequency indicators of activity, including industrial production, retail sales, and PMIs, have been generally weak, and in 2016 as a whole, GDP growth is expected to reach just 0.5 per cent. Additional fiscal and monetary easing measures introduced in September 2016 can be expected to offer some support to the economy in the short-term, and
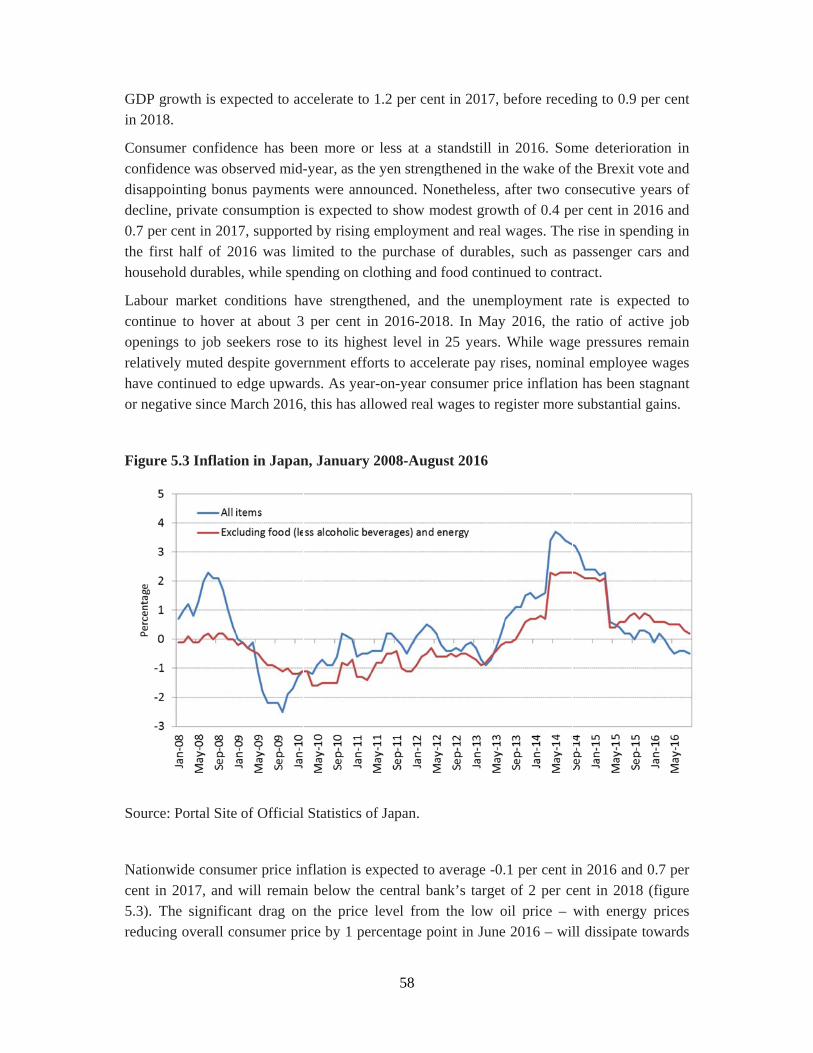
GDP grin 2018
Consumconfidedisappodecline,0.7 per the firsthouseho
Labour continuopeningrelativehave coor nega
Figure
Source:
Nationwcent in 5.3). Threducin
rowth is exp8.
mer confideence was obointing bonu, private cocent in 201t half of 20old durables
market coue to hover gs to job seely muted deontinued to ative since M
5.3 Inflatio
: Portal Site
wide consum2017, and
he significang overall co
pected to ac
ence has beserved mid-us paymentnsumption 7, supporte016 was lims, while spe
onditions haat about 3
eekers rose espite goveredge upwar
March 2016
on in Japan
e of Official
mer price inwill remain
ant drag ononsumer pr
ccelerate to
een more or-year, as thets were annis expected
ed by rising mited to theending on cl
ave strength per cent ito its highrnment effords. As year, this has al
n, January
Statistics o
nflation is en below then the price ice by 1 pe
58
1.2 per cen
r less at a se yen strengounced. No
d to show memploymen
e purchase lothing and
hened, andn 2016-201est level inorts to accelr-on-year colowed real w
2008-Augu
of Japan.
expected to e central balevel fromrcentage po
nt in 2017, b
standstill ingthened in thonetheless, a
modest grownt and real wof durablefood contin
d the unem18. In Mayn 25 years. lerate pay ronsumer prwages to re
ust 2016
average -0.ank’s target
m the low ooint in June
before reced
n 2016. Somhe wake of after two co
wth of 0.4 pewages. Thes, such as pnued to cont
mployment r 2016, the While wagises, nomin
rice inflationgister more
1 per cent iof 2 per c
oil price – 2016 – wil
ding to 0.9
me deteriorthe Brexit vonsecutive er cent in 2
e rise in spenpassenger ctract.
rate is experatio of ac
ge pressuresnal employen has been e substantial
in 2016 andent in 2018with energyll dissipate
per cent
ration in vote and years of
2016 and nding in cars and
ected to ctive job s remain ee wages stagnant l gains.
d 0.7 per 8 (figure y prices towards
59
the end of the year, but the strong yen and weak wage growth will continue to weigh on inflation.
In reaction to the stalled progress towards achieving the target of 2 per cent inflation, the Bank of Japan (BoJ) announced in September a new set of unconventional monetary policy measures aimed at boosting inflation and reviving growth. The BoJ’s new monetary policy strategy consists of two components. The first is a “quantitative and qualitative monetary easing with yield curve control” framework to anchor 10-year Japanese Government Bond yields at around current levels of 0 per cent. The second component is an explicit commitment to increase the monetary base until inflation overshoots the 2 per cent target. Both of these policy strategies are intended to complement the existing quantitative and qualitative easing measures of BOJ and the negative interest rate of - 0.1 per cent applied on banks’ current account balances held at the BOJ since January 2016.
The BOJ’s introduction of its new monetary policy framework came after the Japanese Government announced increased spending in the FY2016 supplementary budget and introduced a new fiscal stimulus package in August 2016, including 4.6 trillion yen additional spending for the current fiscal year and the postponement of the consumption tax increase planned for April 2017 to October 2019. The stimulus package amounts to 28.1 trillion yen, making it the third-largest ever implemented. It is expected to give a strong boost to government investment spending in 2017, which is forecast to contribute roughly 0.6 percentage points to GDP growth.
The rise in government investment will partially compensate for the persistently weak private sector non-residential investment, as export-oriented firms remain under pressure from the strong yen and sharp slowdown in global trade. Service industries have also been affected by the currency appreciation. While international visitor numbers continue to increase steadily, their direct expenditure in Japan has started to decline. Residential investment, on the other hand, has rebounded. Housing starts have been supported by Japan’s negative interest rates, which have allowed home-loan rates to fall to an all-time low level. With monetary policy expected to remain accommodative for the foreseeable future, strength in the housing sector is expected to accelerate.
While the additional fiscal and monetary easing measures that have been recently introduced will offer some support to the Japanese economy in the short term, there is considerable uncertainty regarding the longer-term economic prospects. Deflation is well-entrenched in expectations, and may not lift despite the commitment of the BoJ to an easier monetary stance. The evolution of wages over the next few years will be crucial in this context. In addition, Japan faces some imposing policy challenges, which include addressing the large overhang of government debt amid a lower rate of potential growth. While the slowdown in potential growth is largely driven by demographic developments, it also reflects the slower rate of productivity growth, which may prove persistent.
60
Australia
Australia has benefited from a stronger-than-expected recovery of commodity prices in 2016, coupled with both monetary and fiscal stimulus measures. GDP growth is projected at 2.8 percent, above its trend value of 2.6 percent. However, GDP growth for 2017 is expected to decelerate to 1.9 percent, following a slowdown of export growth from 6.3 percent in 2016 to 4.1 percent, reflecting the broad weakness of world trade and continuing rebalancing in China in particular. Meanwhile, imports are expected to accelerate to 2.4 percent after contracting by 0.2 percent in 2016 this year, as higher import prices acted as a strong restraint on import demand. The contribution of net trade to GDP growth, therefore, will slow markedly in 2017.
GDP growth is expected to pick up somewhat in 2018, on the strength of a recovery in fixed investment, which is expected to grow by 2.3 percent in 2018. This compares with decreases of 3 percent in 2016 and 0.7 percent in 2017. After two years of drastic cuts in mining investment, the drag on growth of shrinking mining investment is expected to loosen. Despite the fluctuations in growth, unemployment in expected to remain relatively stable at around 5.5 percent.
The current account deficit narrowed significantly in 2016, and is expected to see a further modest improvement in the next two years. Higher import prices will nevertheless, in combination with steady GDP growth, lead to upward pressure on inflation: from 1.2 in 2016 to 1.9 percent in 2017 and 2.3 percent in 2018, close to the central bank’s target.
The government budget is expected to widen slightly in 2017, partly reflecting new tax cuts for small and medium-sized businesses, which have been introduced in an effort to stem the decline in private sector investment. While government debt still remains low compared to other developed economies, it is expected to reach just over 40 per cent of GDP in 2017, which marks a 10 percentage point rise compared to only four years ago. This reflects the country’s continued vulnerability to swings in commodity prices.
Europe
Economic activity in Europe will remain subdued, with growth expected to stay at about 1.8 per cent in the EU for the period from 2016 to 2018. This implies a downward revision compared to the previous forecast, primarily due to the negative impact from the “Brexit”. On the upside, domestic demand will remain a major driver of growth, as low inflation rates and lower unemployment in some countries bolster private consumption and the expansive monetary policy stance supports business investment. At the same time, a number of factors will continue to prevent a more vibrant economic revival across the region. These factors include the major uncertainty stemming from the “Brexit”, which has already dented business investment in some of the key sectors both in the UK and its major European trading partners. In addition, structural issues such as the lack of labour market flexibility, impede the development of small and medium-sized companies in countries such as France and Italy. Linked to this, unemployment still remains high in a number of countries, with negative
61
effects on overall growth. High public and private debt levels constrain investment in some countries and lingering balance sheet problems in the banking sector put a drag on the proper functioning of the banking system. A number of risk factors could affect this baseline forecast, notably further negative fallout from the “Brexit”, more severe problems in the banking sector, a recurrence of the debt crisis in Greece and elections in numerous countries including Germany, France and the Netherlands in 2017.
The external sector has weathered the restrained global economic growth environment so far better than expected, largely owing to more dynamic internal demand and more solid intra-European trade. The “Brexit” and political instability in Turkey have so far had only a limited negative impact on export demand. In the outlook period, this trend of robust export demand will remain intact, as solid private consumption will underpin intra-European trade and some economies will benefit from a competitive euro exchange rate. A major drag on exports remains the economic weakness in Brazil and the Russian Federation and the slowdown in China. Linked to this, depressed levels of investment in commodity sectors, notably oil, continue to pose a challenge for exporters of investment goods such as plants and machinery. A major uncertainty will be the further development in the wake of the “Brexit”. For many companies that have invested in the United Kingdom, access to the single EU market has been a major business advantage, but the “Brexit” has upended the institutional framework for business decisions. While the United Kingdom has not yet given formal notice of leaving the EU, any such move would require a fundamental rearrangement of the economic relations. A pronounced interest on the UK side is to remove or at least limit the free movement of EU workers, while at the same time maintaining free access to the single EU market. However, various EU countries have already made clear that free access to the EU market does not come without any obligations in return and that adherence to the free movement of labour remains a core principle of the EU. Consequently, should the United Kingdom start the formal process of exiting from the EU, contentious negotiations would lie ahead with significant uncertainty for businesses, which in turn could lead to a more pronounced decrease in investment levels.
The employment situation has been improving for the region as a whole, with unemployment in the EU standing at 8.6 per cent and in the euro area at 10.1 per cent in July 2016. However, this overall picture encompasses significant national variation. Greece and Spain continue to register the highest unemployment rates in the region, at 23.5 per cent and 19.6 per cent, respectively, followed by a number of countries including France, Italy and Portugal that also experience double-digit unemployment rates. This is partly due to over-regulated labour markets that restrict young people from entering certain professions or make it difficult for small and medium-sized firms to hire new employees in the face of relatively high tax burdens and adjust work hours and labour capacity in line with changing output needs. Inefficient and complicated administrative procedures are a further major issue, often creating a general business environment that is not amenable to the creation of new enterprises. By contrast, other countries are experiencing relatively low unemployment rates, notably Germany, the United Kingdom and Hungary with 4.2 per cent, 5 per cent and 5.1 per cent,

62
respectively. Driving factors in these cases include internationally competitive economic sectors, more flexible labour markets and, as in the case of Germany, a more diversified vocational training system that provides a solid basis for promoting youth employment. For several countries, a major challenge will lie in integrating a large number of refugees into the labour market.
Given the continued tightening stance of fiscal policy in most countries, which is partly related to the high levels of public debt, and only hesitant structural reforms, monetary policy continues to play a disproportionate role. The European Central Bank (ECB) maintains an extremely accommodative monetary policy stance that comprises three elements: policy interest rates at or below zero, quantitative easing (QE) in the form of asset purchases of 80 billion euros per month; and targeted longer-term refinancing operations (TLTROs) intended to move banks to lend more money. Despite these policy actions, inflation remains significantly below the ECB’s policy target of below but close to 2 per cent, raising questions regarding the effectiveness of monetary policy and its adequacy given the nature of the economic challenges in the region.
Under its current policy stance, the ECB is facing two major challenges in the near-term in its policy-making process. The first challenge concerns the ECB’s policy operations; the amount of asset purchases by the ECB has already led to a significant reduction and shortage in available assets that satisfy the ECB’s purchase criteria. In addition, commercial market participants have been pushed out of the market by the actions of the ECB. Both points make the implementation of the ECB’s stated policy stance increasingly difficult. The second challenge concerns the ECB’s policy instruments; in the case of a new economic shock, the ECB runs the risk of having a reduced policy impact, given its already extremely loose policy stance. One possible scenario in this regard could be a more drastic negative impact of the “Brexit” on growth in the EU, in which case the EU may find it difficult to deploy meaningful policy instruments.
The Bank of England (BoE) reacted to the “Brexit” vote and the negative economic repercussions by cutting its policy interest rates by 25 basis points to 0.25 per cent and by increasing the volume of its QE measures. The lower interest rates and the prospect of further cuts will put further pressure on the pound, creating the risk of a significant increase in inflation through higher import prices.
Fiscal policy in the region maintains a tightening stance overall, given institutional requirements such as the excessive-deficit mechanism of the EU and because of political preferences. However, the negative impact from fiscal consolidation on growth is diminishing. Some countries, such as Germany and Austria, will have to increase fiscal spending in view of the large number of refugees and the challenge of integrating them into their societies and labour markets. Moreover, big parts of the major fiscal adjustments that were initiated across the region in the aftermath of the financial crisis have been completed. This is illustrated by the significant improvements in fiscal balances in various countries in the region, notably Ireland, Iceland, Lithuania and Greece. Despite these improvements,
63
relatively high public debt levels remain a challenge and risk factor. The currently low level of interest rates helps in sustaining these debt levels, but higher financing costs, especially if they occur suddenly in the form of a financial shock, hold the potential of severe, negative effects for national fiscal budgets.
In the United Kingdom, the decision to leave the EU has major implications for fiscal policy. Instead of a significant budget surplus by 2019 as envisaged some time ago, the country is now expected to face a further increase in its budget deficit, which stood at 4.4 per cent in 2015. As the British economy will experience a significant slowdown, tax revenues will decline, while spending requirements will increase, given the dislocations and adjustment needs caused by leaving the EU.
In the EU member states from Eastern Europe and the Baltics region, economic growth remains on a higher trajectory than in the EU-15, at about 3 per cent, as the countries continue to catch-up through capital accumulation and productivity growth. In 2016, however, the pace of economic expansion has slowed somewhat following the robust investment cycle of 2014-2015 that was driven by the expedited absorption of the 2007-2013 EU funds. Credit availability in the region is improving thanks to the continuing accommodative policy of the ECB and the ultra-low policy rates in the countries with flexible currencies (the Czech Republic, Hungary, Poland and Romania) .The impact of fiscal policy on growth is largely expansionary, as public spending is increasing in real terms (most noticeably in Poland), benefiting from higher tax intake and exceptionally low financing costs.
In the first half of 2016, Romania recorded the highest growth in Europe at 5 per cent. In Central Europe, the automotive industry, which is well integrated into the EU-15 production chain, has seen a strong performance, while attracting further FDI flows. The Baltic States, which are more exposed to trade with the Russian Federation than other countries in the group, exhibit a more modest growth pattern.
On the policy front, the resolution of foreign-exchange (Swiss franc and the euro) denominated consumer loan problem - prior to the global economic crisis of 2008-2009 a large number of households in Eastern Europe took such loans benefiting from low interest rates and expecting a steady appreciation of the domestic currencies - has become a contentious issue in Poland and Romania, as the suggested solutions shift the burden to the banking sector.
In the outlook period, the EU-11 is expected to see economic growth at about 3 per cent in the medium term. The full impact of the “Brexit” on the region has yet to be assessed, but the economies are likely to be affected by more modest EU funding; the weaker pound already weighs on the value of remittances they receive. The possible return of migrant workers from the UK may increase labor market tensions in a number of countries, but could also alleviate the serious demographic pressure in the Baltic States and emerging labor shortages in parts of Eastern Europe and facilitate business start-ups.
64
Economies in transition
TheCommonwealthofIndependentStates(CIS)
Following the severe terms-of-trade shock of 2014/15 and the consequent economic contraction in most of the CIS energy-exporters, the economies of the region have entered a period of tentative stabilisation. Economic activity in parts of the CIS continued to shrink in 2016, but at a much reduced pace. As a result of the more moderate contraction in the Russian Federation and the return to sluggish growth in Ukraine, the aggregate indicators of the region improved. The aggregate GDP of the CIS is estimated to have fallen by 0.4 per cent in 2016, following a decline of 3 per cent in 2015. In 2017, the region is expected to return to growth, but amid continued fragilities the expansion will be muted, at 1.2 per cent, picking up to 2.0 per cent in 2018. Lower commodity prices and persistent geopolitical tensions, along with structural constraints, such as an outdated capital stock, demographic pressures in the European part of the CIS and challenging business conditions, will continue to generate an inauspicious environment for growth in the region.
Domestic demand, both consumption and investment, remained very weak in the CIS amid stagnating or declining real wages, poor access to credit and high uncertainty. The continuing international sanctions against the Russian Federation, which limit access to capital markets, weigh on business sentiment and investment prospects. Investment weakened significantly in most countries in 2016, with especially large falls in Azerbaijan, Belarus and Moldova. By contrast, investment experienced a mild recovery in Ukraine after three years of precipitous contraction (figure 5.4). Net external demand was partly able to offset these adverse developments. The ongoing fiscal adjustment in energy-exporting countries added to contractionary forces. Falling remittances from the Russian Federation, which shrunk even further in 2016 despite the currency appreciation, have depressed incomes in the region’s small energy-importing countries, contributing to an increase in poverty levels. In Kyrgyzstan, lower gold output weighed on the overall economic performance. On the positive side, import-substitution polices in the Russian Federation have supported the performance of certain sectors, namely agriculture and chemical industry.
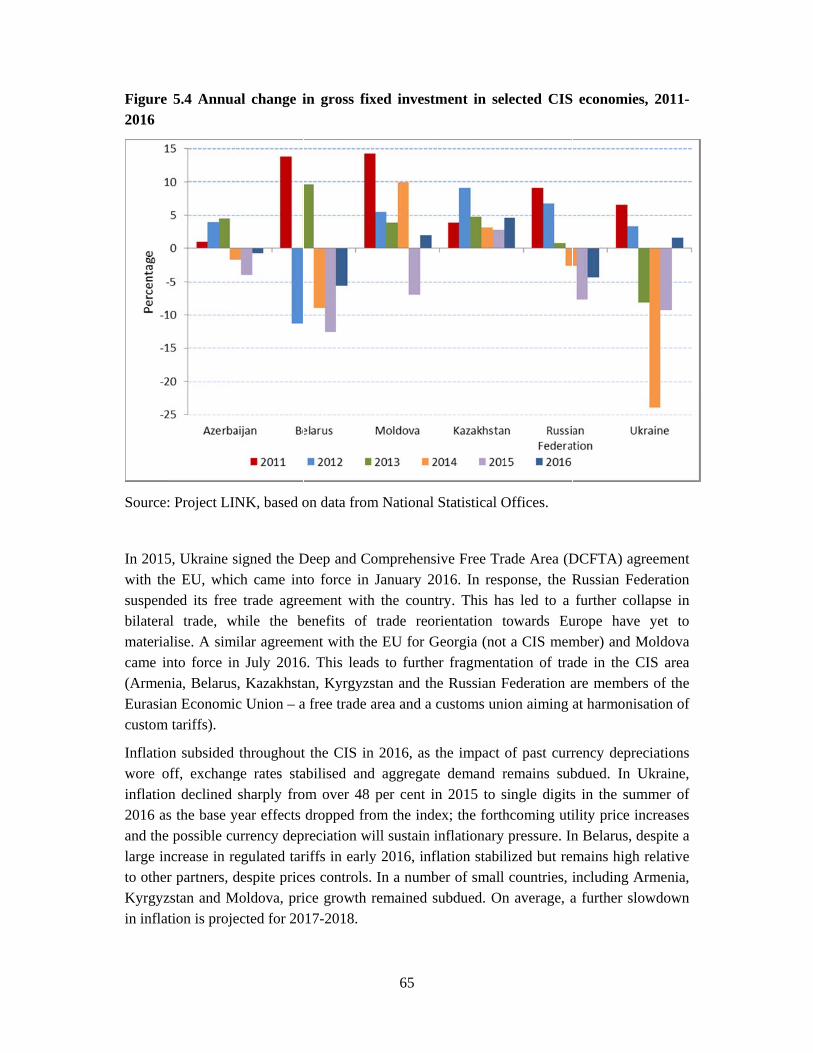
Figure 2016
Source:
In 2015with thsuspendbilateramateriacame in(ArmenEurasiacustom
Inflationwore oinflation2016 asand the large into otherKyrgyzin inflat
5.4 Annua
: Project LIN
5, Ukraine se EU, whicded its freeal trade, walise. A simnto force innia, Belarusan Economic
tariffs).
n subsided ff, exchangn declined s the base ypossible cu
ncrease in rer partners, dzstan and Mtion is proje
al change i
NK, based o
signed the Dch came inte trade agre
while the bilar agreem
n July 2016, Kazakhstac Union – a
throughoutge rates stasharply fro
year effects urrency depegulated tardespite price
Moldova, priected for 20
in gross fix
on data from
Deep and Cto force in
eement withbenefits of
ment with th6. This leadan, Kyrgyzsa free trade
t the CIS inabilised andom over 48
dropped fropreciation wriffs in earlyes controls.ice growth
017-2018.
65
xed investm
m National
omprehensiJanuary 20
h the counttrade reor
e EU for Gds to furthestan and thearea and a c
n 2016, as td aggregate
per cent inom the inde
will sustain iny 2016, infl. In a numbremained su
ment in sel
Statistical O
ive Free Tra016. In resptry. This harientation t
Georgia (notr fragmentae Russian Fcustoms uni
the impact oe demand rn 2015 to sex; the forthnflationary lation stabiler of small ubdued. On
lected CIS
Offices.
ade Area (Dponse, the Ras led to a towards Eut a CIS memation of traFederation aion aiming
of past currremains subsingle digitshcoming utipressure. In
lized but recountries, i
n average, a
economies
DCFTA) agRussian Fefurther col
urope havember) and Made in the Care memberat harmonis
rency deprebdued. In Us in the sumility price inn Belarus, dmains high including Aa further slo
s, 2011-
greement deration llapse in yet to
Moldova CIS area rs of the sation of
eciations Ukraine, mmer of ncreases despite a
relative Armenia, owdown
66
Labour markets in the region remained relatively resilient in view of ongoing output trends. In the Russian Federation, unemployment remained virtually at the level of 2015 despite the ongoing recession. However, the headline figure masks a sharp adjustment of real wages, frequent shifts to part-time work and a massive increase in wage arrears. In Ukraine, the muted recovery failed to make a dent in unemployment figures. In Belarus, the number of employed has continued to decline, although the unemployment rate remains low. In Kazakhstan, unemployment edged higher but remains low, as the economically active population continues to shrink. Returning migrant workers have put pressure on local labour markets in the small Central Asian countries.
Monetary policy was generally loosened throughout the CIS in 2016, against the background of slowing inflation. However, in the larger countries interest rates remain relatively high. While the shift towards inflation targeting following the introduction of free floating regimes in some countries facilitates adjustment to external shocks, it has also created new challenges, limiting the room for monetary easing. Given persistent concerns over exchange rate stability and inflation, the scope for countercyclical monetary policy was limited. In the Russian Federation, the policy rate was cut by a total of 100 basis points; as inflation still far exceeds the official target, further rate cuts are likely to be cautious. By contrast, Moldova cut rates rapidly (by a cumulative 1000 basis points) as inflation declined sharply over the year. In Armenia and Kazakhstan, despite ongoing deflationary trends and continued cuts, rates remain high. By contrast, monetary policy was tightened in Azerbaijan and Tajikistan, where the currencies came under severe pressure as a result of lower oil revenues and falling remittance inflows, respectively. Some CIS countries have put in place tight restrictions on the foreign exchange operations of businesses and households and cross-border transactions.
On the fiscal policy front, energy producers in the CIS had to adjust to a sustained period of low commodity prices. Even in countries that entered the downturn with significant fiscal buffers, consolidation measures were required to maintain stability of public finances and slow down the depletion of accumulated reserve funds. In the Russian Federation, public wages remained frozen and benefits were indexed below the inflation rate. Fiscal spending has also been tightened in Azerbaijan. In Kazakhstan, the adjustment, including the reduction of lending activities by the oil fund, has been accompanied by fiscal reforms to boost non-oil income. To compensate for the budgetary shortfall, as well as to attract FDI and to revitalise growth, partial privatization of state-owned assets is planned in several countries, the most extensive one in Kazakhstan. In the energy-importers, fiscal policy remains largely neutral or slightly expansionary, although the weaker remittance inflows from the Russian Federation exerted pressure on custom (import tariff) and indirect tax revenues. In Ukraine, tax reforms, including cuts in the payroll tax rate, had a negative impact on fiscal revenues. In Belarus, despite a positive general government balance, the public debt has increased sharply due to the impact of depreciation and quasi-fiscal operations. Large public debt is limiting fiscal options in the Kyrgyz Republic. The banking sector may remain a source of continued fiscal outlays in some countries.
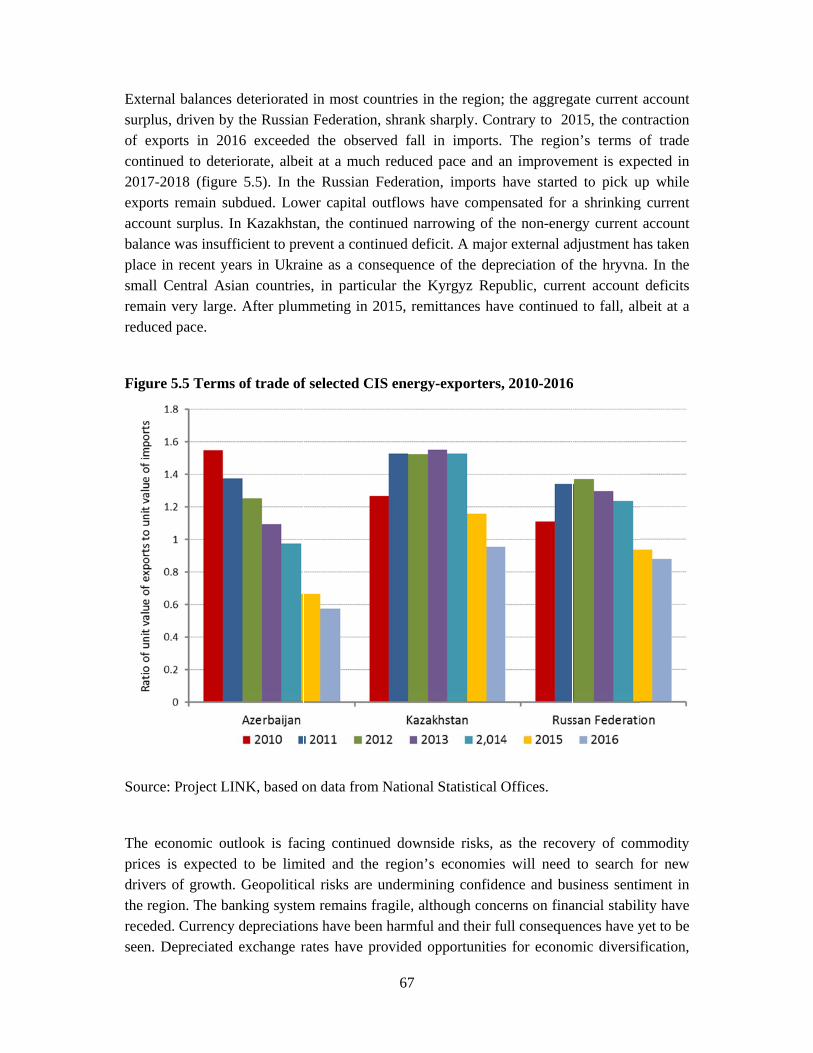
Externasurplus,of expocontinu2017-20exports accountbalanceplace insmall Cremain reduced
Figure
Source:
The ecoprices idrivers the regirecededseen. D
al balances , driven by orts in 201
ued to deter018 (figureremain sub
t surplus. Ine was insuffn recent yeaCentral Asia
very large.d pace.
5.5 Terms
: Project LIN
onomic outis expectedof growth.
ion. The band. Currency Depreciated
deterioratedthe Russian
16 exceedediorate, albe
e 5.5). In thbdued. Lown Kazakhstaficient to prears in Ukraan countrie After plum
of trade of
NK, based o
tlook is facd to be limi
Geopoliticnking systedepreciatioexchange r
d in most con Federationd the obse
eit at a muche Russian wer capital an, the contevent a cont
aine as a coes, in particmmeting in
f selected C
on data from
cing continuited and th
cal risks arem remains
ons have beerates have p
67
ountries in n, shrank shrved fall in
ch reduced Federationoutflows htinued narrotinued defic
onsequence cular the K2015, remi
CIS energy-
m National
ued downsihe region’s e underminifragile, althen harmful provided op
the region; harply. Conn imports. pace and an
n, imports have compenowing of thcit. A majorof the depr
Kyrgyz Repuittances hav
-exporters,
Statistical O
ide risks, aeconomies
ing confidenhough conceand their fupportunities
the aggregntrary to 20
The regionn improvemhave startednsated for ahe non-enerr external adreciation ofublic, curreve continued
2010-2016
Offices.
as the recovwill need
nce and buerns on fina
ull conseques for econom
gate current 015, the conn’s terms o
ment is expd to pick ua shrinkingrgy current djustment hf the hryvnaent account d to fall, alb
6
very of comto search
usiness sentiancial stabilences have ymic diversi
account ntraction of trade ected in
up while g current
account has taken a. In the
deficits beit at a
mmodity for new iment in lity have yet to be fication,
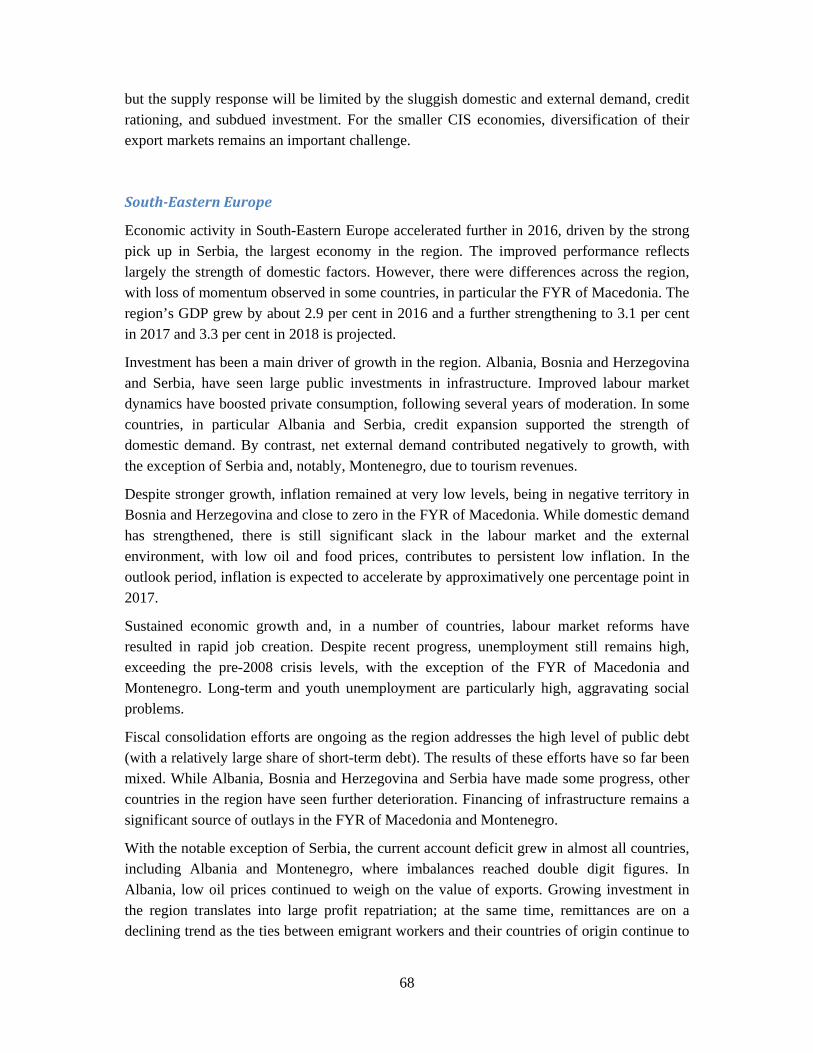
68
but the supply response will be limited by the sluggish domestic and external demand, credit rationing, and subdued investment. For the smaller CIS economies, diversification of their export markets remains an important challenge.
South‐EasternEurope
Economic activity in South-Eastern Europe accelerated further in 2016, driven by the strong pick up in Serbia, the largest economy in the region. The improved performance reflects largely the strength of domestic factors. However, there were differences across the region, with loss of momentum observed in some countries, in particular the FYR of Macedonia. The region’s GDP grew by about 2.9 per cent in 2016 and a further strengthening to 3.1 per cent in 2017 and 3.3 per cent in 2018 is projected.
Investment has been a main driver of growth in the region. Albania, Bosnia and Herzegovina and Serbia, have seen large public investments in infrastructure. Improved labour market dynamics have boosted private consumption, following several years of moderation. In some countries, in particular Albania and Serbia, credit expansion supported the strength of domestic demand. By contrast, net external demand contributed negatively to growth, with the exception of Serbia and, notably, Montenegro, due to tourism revenues.
Despite stronger growth, inflation remained at very low levels, being in negative territory in Bosnia and Herzegovina and close to zero in the FYR of Macedonia. While domestic demand has strengthened, there is still significant slack in the labour market and the external environment, with low oil and food prices, contributes to persistent low inflation. In the outlook period, inflation is expected to accelerate by approximatively one percentage point in 2017.
Sustained economic growth and, in a number of countries, labour market reforms have resulted in rapid job creation. Despite recent progress, unemployment still remains high, exceeding the pre-2008 crisis levels, with the exception of the FYR of Macedonia and Montenegro. Long-term and youth unemployment are particularly high, aggravating social problems.
Fiscal consolidation efforts are ongoing as the region addresses the high level of public debt (with a relatively large share of short-term debt). The results of these efforts have so far been mixed. While Albania, Bosnia and Herzegovina and Serbia have made some progress, other countries in the region have seen further deterioration. Financing of infrastructure remains a significant source of outlays in the FYR of Macedonia and Montenegro.
With the notable exception of Serbia, the current account deficit grew in almost all countries, including Albania and Montenegro, where imbalances reached double digit figures. In Albania, low oil prices continued to weigh on the value of exports. Growing investment in the region translates into large profit repatriation; at the same time, remittances are on a declining trend as the ties between emigrant workers and their countries of origin continue to
69
weaken. Foreign direct investment remains the main source of financing for the current account deficits.
The region remains closely linked with the EU, which will continue to influence economic prospects. A possible intensification of the refugee crisis would have negative implications for the region, disrupting trade flows and necessitating public expenses. The region’s dependence on external financing has not been overcome yet, leaving it vulnerable to a deterioration of global financing conditions.
Developing economies
Africa
Following a sharp deceleration in 2016, growth in Africa is expected to recover at a moderate pace going forward. Regional GDP is forecast to expand by 3.2 per cent in 2017 and 3.7 per cent in 2018, up from an estimated 1.7 per cent in 2016. The aggregate growth figures, however, mask a marked divergence in the growth prospects of the different African sub-regions (figure 5.6) and economies.
The projected upward trend in global oil and non-oil commodity prices for the next two years will, to a certain extent, ease growth pressures in the commodity exporters. Nevertheless, given that global commodity prices are projected to remain way below pre-2014 levels, a strong growth rebound in the highly commodity-dependent countries, including Algeria, Angola and Nigeria, appears unlikely. In contrast, the growth outlook is more favourable for countries such as Côte d’Ivoire, Ghana, Senegal and countries in the East African Community, including Ethiopia, Kenya and the United Republic of Tanzania. Growth in these economies will continue to be driven by robust private consumption and the continued implementation and completion of large infrastructure projects.
Figure
Source:
Buffetesignificpersisteactivityweaker increasiunfavousecurity
Africa aslowestpatentlymineralincludinmore fmacroeprivate
5.6 GDP g
: UN/DESA
ed by stroncant slowdowently low cy. Modest gl
external dingly chalurable weaty concerns.
as a whole it pace of ey diverse aml-rich countng Côte d’Ifavourable conomic mconsumptio
rowth in A
A.
ng externalwn in 2016commodity lobal growtemand for lenging do
ther conditio
is expected expansion imong the ctries weakenIvoire, Keny
business cmanagement,on and inves
Africa, by su
l and dome. For the hiprices resu
th and fragithe region.omestic clons, higher
to have expin more thcountries inned, there wya and Senclimate, on, growth in stment activ
70
ubregion, 2
estic headwghly commulted in a le investor . These glolimate in political an
panded by ahan two den the regionwere bright negal, continngoing infrthese econ
vity.
2001-2018
winds, growmodity-depen
considerabsentiments
obal headwiseveral A
nd policy un
a modest 1.7ecades, althn. While grspots in the
nued to expfrastructure omies conti
wth in Afrndent econoble deteriorworldwide inds were cAfrican concertainty a
7 per cent inhough growowth in thee region as pand at a st
developmeinued to be
rica experieomies in theration in ec
also contribcompoundeountries, inand an escal
n 2016, marwth performe oil-exportseveral eco
trong pace. ent and im
e driven by
enced a e region, conomic buted to d by an ncluding lation of
rking the mance is ting and onomies,
Amid a mproved resilient
71
Following the robust growth momentum of 5.5 per cent in 2016, East Africa is positioned to remain the fastest growing African subregion in 2017 and 2018. Growth is projected to be at least 6 per cent in both years, reflecting the subregion’s favourable macroeconomic fundamentals. Growth in Ethiopia, Kenya, Rwanda and the United Republic of Tanzania in the next two years will continue to be driven by the rapid expansion of domestic markets and strong infrastructure spending, particularly in the energy and transport sectors. In the sub-region’s net oil importers such as Kenya and Rwanda, economic activity will continue to benefit from low inflationary pressures, amid a sluggish recovery in oil prices. In addition, the adverse effect of prolonged drought that dampened 2016 growth in countries such as Ethiopia and Uganda is expected to dissipate in 2017. A potential escalation of social unrest in Ethiopia may however weigh on the short-term growth outlook.
Growth in West Africa is expected to rebound modestly to 3.0 per cent in 2017, as the projected increase in oil prices eases severe growth pressures in Nigeria. In 2016, the subregion’s aggregate GDP virtually stagnated, growing only by 0.1 per cent due to a contraction in the Nigerian economy. Nigeria’s growth was adversely affected by declining oil revenues, amid low oil prices and disruptions to oil production. Heightened financial market volatility and an escalation of security issues also affected investment flows. In contrast, the growth outlook for Cote d’Ivoire, Ghana and Senegal remains strong, underpinned by ongoing large infrastructure investments and progress on structural policies to improve the domestic business climate. In Guinea and Liberia, growth in 2017 is expected to strengthen further given the diminishing impact of the Ebola outbreak on economic activity.
Growth in North Africa is projected to increase to 3.5 per cent in 2017, contingent on a gradual improvement in the security situation in the subregion. In 2016, growth in the sub-region slowed to 2.6 per cent. Security threats and social unrest weighed on investor sentiments and adversely affected the subregion’s vital tourism industry, particularly in Egypt and Tunisia. The Libyan economy also continued to face significant political challenges and unrest in 2016, with spillover effects to its neighbouring countries. Given its high dependence on crude oil revenues, Algeria’s growth slowed in 2016. Growth in the Algerian economy, however, is expected to remain subdued in 2017 as planned cuts to government spending offset the boost from higher oil prices. Going forward, greater stability in the sub-region will support a rebound in exports and a recovery in tourist arrivals.
The growth outlook for Southern Africa is relatively subdued, with economic activity projected to improve modestly to 1.9 per cent and 2.6 per cent in 2017 and 2018, respectively. In 2016, growth in the subregion slowed to 1.0 per cent, as severe drought adversely affected growth in countries, such as Botswana, Lesotho, Malawi, Namibia and South Africa. In South Africa, growth is projected to improve going forward as the agriculture and mining sectors recover while inflationary pressures subside. However, higher political uncertainty may weigh on investor sentiments. Meanwhile, an improvement in oil revenues will support a modest recovery in Angola.
72
In the Central Africa subregion, growth is expected to strengthen from 2.4 per cent in 2016 to 3.4 per cent in 2017 and improve further to 4.2 per cent in 2018. The recovery in oil prices will revive export revenues and growth, particularly in Congo, Equatorial Guinea and Gabon. However, ongoing domestic political unrest in the Central African Republic and Gabon will restrain economic activity in these economies. In Cameroon, diminishing impact of lower oil revenues and continued strong public investment in infrastructure will support growth going forward.
External shocks compounded by adverse domestic developments have collectively contributed to rising vulnerabilities in many African countries. The prolonged low commodity price environment has intensified fiscal pressures in the region, particularly for the highly commodity-dependent economies. For some countries, the rapid deterioration in public finances has prompted Governments to introduce measures to preserve fiscal sustainability. Large oil exporters, including Algeria and Angola announced significant cuts to budget plans, while Nigeria removed fuel subsidies during the year. In addition, countries such as Nigeria and Zambia sought financial assistance from international organisations to alleviate growing budget shortfalls.
Amid large capital outflows and declining international reserves, exchange rates of commodity-dependent countries faced significant downward pressure in 2016. Reflecting the collapse in export income and rising concerns over fiscal sustainability, the domestic currencies of Angola, Mozambique and Zambia depreciated significantly during the year. For South Africa, global financial market volatility, domestic political uncertainty and concerns over the risk of a sovereign rating downgrade contributed to a further weakening of the rand. Faced with severe foreign currency shortages, Nigeria removed its currency peg to the US dollar in June. The Nigerian naira subsequently depreciated sharply, losing more than 40 per cent of its value in over just a few months.
The significant weakening of domestic currencies fueled inflationary pressures across many countries in the African region, particularly in the less diversified economies. The adverse impact of drought conditions on agriculture production and rising electricity tariffs also exerted upward pressure on consumer prices. Inflation accelerated to multi-year highs in Angola, Mozambique and Nigeria, with domestic prices growing at double-digit rates during the year. For Nigeria, the removal of fuel subsidies resulted in a sharp increase in retail petrol prices, exacerbating inflationary pressures. Amid rising consumer prices and production costs, several central banks increased key policy rates in 2016. Looking ahead, monetary policy is expected to remain tight in these economies. Against a backdrop of weakening growth, however, the increase in domestic borrowing costs will likely further constrain private consumption and investment activity, reflecting a rising dilemma in the conduct of monetary policy in these economies. In contrast, inflation in the net oil importers in the region stabilised or declined in 2016. For a few of these countries, such as Botswana, Kenya and Morocco, central banks reduced policy rates during the year, reflecting the availability of more policy space in these countries to stimulate growth.
73
Several risks and challenges remain to the growth outlook for the African region. On the external front, a reversal of the current recovering trend in global oil prices will result in further growth deterioration in oil exporting countries. A sharper-than-expected growth moderation in China will weigh on the region’s commodity exports. In addition, the actual realisation of “Brexit” resulting in an escalation of policy uncertainty will lead to a sharp deterioration in the growth outlook for the United Kingdom and Europe, posing a risk to the trade performance of countries such as Kenya and South Africa, given the importance of Europe as a major export destination.
Domestically, an escalation of security concerns, particularly in the Central, North and West African sub-regions, could also deter foreign investment and severely disrupt economic activity. Growing political unrest such as in Burundi, the Democratic Republic of the Congo, Gabon and Zimbabwe could also impact growth. For the highly agriculture-dependent economies such as Ethiopia and Malawi, growth will remain susceptible to weather-related shocks.
Importantly, the growth outlook for Africa is highly contingent on the ability of countries to mitigate the impact of external risks while containing domestic vulnerabilities. Although debt levels in Africa are still relatively low, the sharp widening of fiscal deficits has contributed to rising concerns over the increase in pace of debt accumulation in the region. In particular, tighter international financial conditions and further weakening of domestic currencies could lead to higher borrowing costs, given the structure of Africa’s external debt that is largely denoted in foreign currency, with relatively short maturities and in some cases, floating interest rates.
For many African economies, growth prospects going forward is dependent on the effectiveness of policy measures taken in adjusting to lower commodity prices. Amid increased pressure for fiscal consolidation, there is a risk that countries will resort to cutting expenditure on critical infrastructure such as in the areas of energy, transport and healthcare. This will lead to a worsening of existing structural bottlenecks and constrain productivity growth, undermining medium-term growth prospects and the realization of sustainable development.
Amid declining monetary and fiscal policy space, African economies will need to make substantial progress on reform measures in order to address domestic structural weaknesses. For the highly commodity-dependent economies, there is an urgent need to accelerate economic diversification efforts and rebuild policy buffers in order to enhance resilience to external shocks. In addition, double-digit unemployment rates in many African economies, including Algeria, Egypt, South Africa and Tunisia, significantly undermine progress towards sustainable and inclusive growth. In this aspect, policy initiatives to promote foreign direct investment in high value-added industries can help to create better quality jobs in the economy. Ongoing initiatives to foster closer regional economic integration, such as the Northern Corridor Integration Projects framework will improve connectivity and lower costs of doing business between countries, thus promoting growth and employment.
74
EastAsia
Growth in developing East Asia is estimated to have decelerated modestly to 5.5 per cent in 2016, down from 5.7 per cent in 2015. A growth rate of 5.6 per cent is expected for both 2017 and 2018. The overall regional growth estimate for 2016 has been revised downward from the previous forecast in April due to the underperformance of several larger economies, as the region witnessed exceptionally weak export growth. Domestic demand, in particular private consumption and public investment, continues to drive the regional economy. However, the weak performance of the external sector has had negative effects on consumer sentiments and a majority of the larger economies in the region are expected to see a slowdown in household spending growth at some points in 2017 and 2018. The region continues to be in a low-inflationary environment, which can be largely attributed to low energy and food prices. There are however encouraging signs of the region emerging from the two-year stretch of producer-price deflation. This could have a positive impact on corporate profits and investment incentives.
The regional effect of underperformance by some major economies has to some extent lessened by the stabilisation in China’s growth. With many economies facing limited monetary space, Governments are generally expected to maintain proactive fiscal interventions to support growth. Financial markets have been broadly stable in 2016 and most of the major economies have not seen further acceleration in domestic credit growth. The Renminbi’s exchange rate against the US dollar and its effective exchange rate depreciated consistently during 2016, with the former reaching the lowest level since 2010. For most of the other major currencies in the region, the effective exchange rate experienced less volatility in 2016 than in 2015. China’s growth figures for the first two quarters have somewhat alleviated near-term concerns over a drastic output slowdown. However, implications of China’s continued rebalancing will inevitably be felt by the region in the medium- and long-run through trade (including commodities) and financial channels, albeit to a varied extent across countries. High and rising corporate and household debts in some economies also pose downside risk to the regional growth.
China’s economy is estimated to have grown by 6.6 per cent in 2016, which is 0.2 percentage point above the previous forecast. Growth has been supported by robust consumption demand, with retail sales growth remaining stable throughout the year. Growth of fixed investment – and in particular infrastructure investment – also provided solid support to overall growth. A notable development is that fixed investment has been predominately driven by state-owned enterprises. Private investment fell sharply due to overcapacity, sluggish market demand, and higher corporate financing costs. While industrial profits have seen some overall recovery, there are also rising defaults on corporate debt. The Chinese economy is expected to grow by 6.5 per cent in both 2017 and 2018, continuing to be supported by favorable domestic demand and accommodative fiscal measures, including off-budget fiscal support through policy banks and public-private partnership.
75
The Republic of Korea’s growth is estimated to have moderately accelerated to 2.8 per cent in 2016, up from 2.6 per cent in 2015. Domestic demand remains relatively robust, with construction investment being a main growth driver. Construction investment is expected to maintain its favorable momentum in 2017. Export growth has remained sluggish owing to low global investment and weakened external competitiveness. Solid domestic demand is expected to keep the economy of the Republic of Korea growing by 2.8 - 2.9 per cent annually in 2017 and 2018. Economic activity will, however, be weighed down by weak employment growth and corporate restructuring of distressed firms that are facing rising insolvency risks.
Among the larger ASEAN economies, output growth in Indonesia, the Philippines, and Thailand is estimated to have accelerated in 2016, driven by stronger domestic demand. Indonesia is expected to grow 5.1 - 5.3 per cent annually during 2016-2018, up from 4.8 per cent in 2015. Private consumption benefitted from lower inflation, which also allowed Bank Indonesia to engage in multiple rate cuts. Policy measures, such as higher minimum wages and an increase in the tax-free threshold, were also introduced to support household incomes. The Philippines’ economy is estimated to have grown by 6.3 per cent in 2016, up from 5.9 per cent in 2015, and is expected to grow by 6.0 - 6.1 per cent annually during 2017-2018. Favorable employment conditions, higher remittances, higher public sector salaries, and higher government spending preceding the general election in May 2016 underpinned strong household spending. In Thailand, the economy is estimated to grow by 3.1 - 3.4 per cent annually during 2016-18, up from 2.8 per cent in 2015. Both public consumption and investment increased considerably, as a result of a public sector pay raise, higher social transfers and implementation of large-scale infrastructure projects. On the other hand, Malaysia is estimated to have seen the most notable slowdown in 2016 among the ASEAN economies, growing by 4.4 per cent in 2016, down from 5 per cent in 2015. The slowdown is a result of both subdued external trade and domestic demand. In particular, consumer spending – the main growth driver in recent years – was held back by less robust job markets and a decline in key agricultural outputs. Growth in Singapore is also expected to have decelerated to 1.7 per cent in 2016, down from 2.0 per cent in 2015, as a result of a slowdown of externally-oriented service sectors and manufacturing production. Growth is projected to accelerate to an annual rate of 2.4 - 2.6 per cent during 2017-18 on the back of a recovery in global and regional trade.
Hong Kong Special Administrative Region of China (Hong Kong SAR) and Taiwan Province of China are estimated to have experienced the slowest growth among larger economies in the region during 2016, growing by 1.4 per cent and 0.9 per cent respectively. In Hong Kong SAR, prolonged weakness in the external sector and recent asset market corrections undermined positive business sentiments. Private consumption remains a key growth driver, but retail sector performance is mixed amid a continued slowdown in tourism. In Taiwan Province of China, fixed investment continued its previous weak trend in 2016 and private consumption growth was dampened by weak or even negative real wage growth during the
76
year. Growth in both economies is expected to recover during 2017-18, conditional on improvements in external demand conditions.
Policy rates across major economies in the region are approaching or have reached historic low levels in 2016. With few exceptions, there remains some – albeit limited – room for further rate cuts, especially given the overall low inflationary environment. However, concerns regarding large capital outflows have weighed on central banks’ rate-cut decisions, as the region saw the greatest annual net capital outflow on record in 2015. High levels of household and corporate debt and narrowing banks’ profit margins have also factored into central banks’ decisions. The effectiveness of monetary easing appears to be on the wane as domestic credit growth has not accelerated despite the overall loose monetary stance across the region.
Facing limited room for furthering monetary easing, the fiscal stance in East Asia has been mostly expansionary and countercyclical. Overall fiscal balances worsened in 2015 across the region and this trend is projected to continue in the forecast period, resulting in higher public debt. Given the still relatively low – albeit rising – public debt levels (figure 5.7), the region’s economies could engage in more active fiscal intervention, particularly in the area of infrastructure and social spending, which would support the region’s long-term potential growth.
Existing estimates of fiscal multipliers show that the effectiveness of fiscal spending could vary significantly across economies in the region. In particular, fiscal multipliers of some smaller, open economies are estimated to be negative, which could be a product of country-specific characteristics, the choice of fiscal instruments, and areas where these instruments were applied. In this light, economies would have to identify the most effective means of fiscal intervention to ensure a positive impact on growth.
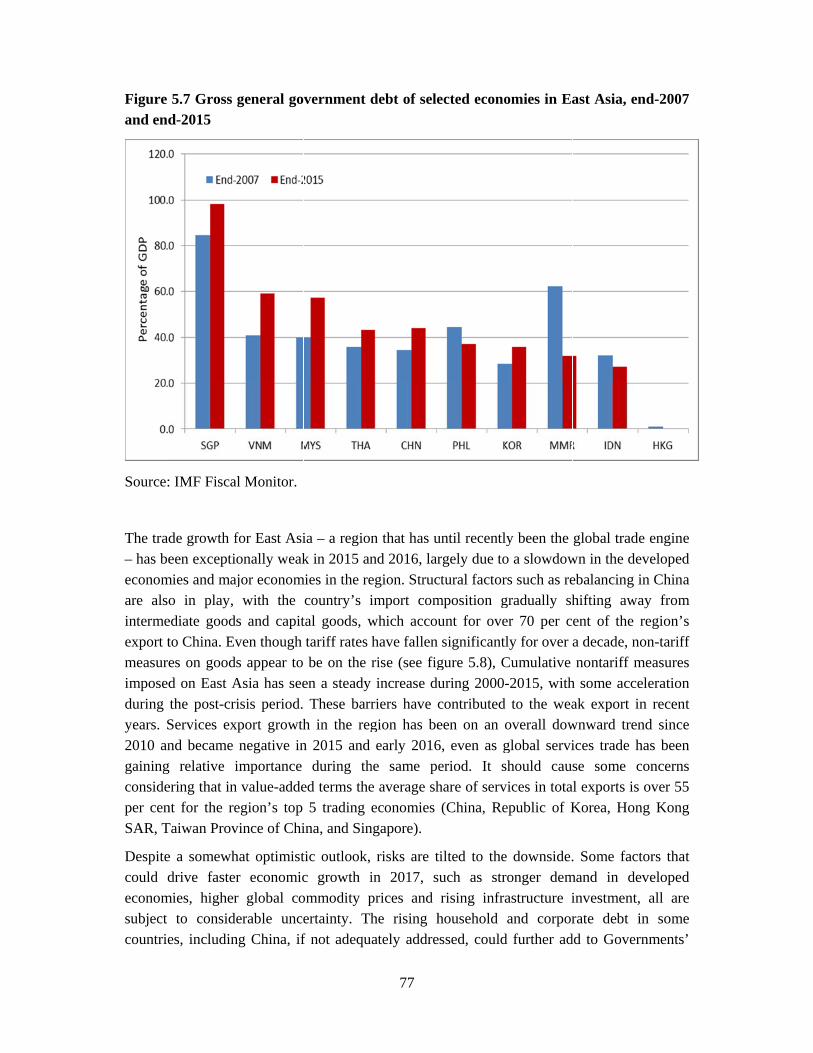
Figure and end
Source:
The trad– has beeconomare alsointermeexport tmeasureimposedduring years. S2010 angainingconsideper cenSAR, T
Despitecould deconomsubject countrie
5.7 Gross d-2015
: IMF Fisca
de growth feen excepti
mies and majo in play,
ediate goodto China. Eves on goodd on East Athe post-criServices exnd became
g relative iering that innt for the reTaiwan Prov
e a somewhdrive faster
mies, higherto conside
es, includin
general go
al Monitor.
for East Asionally weak
ajor economwith the
s and capitven though s appear to
Asia has seeisis period.
xport growthnegative in
importance n value-addeegion’s top vince of Chi
hat optimistr economicr global coerable unce
ng China, if
vernment d
ia – a regionk in 2015 an
mies in the recountry’s ital goods, wtariff rates be on the
en a steady These barrh in the regn 2015 and
during thed terms the
5 trading ina, and Sin
tic outlook, c growth iommodity pertainty. Thf not adequ
77
debt of sele
n that has und 2016, laregion. Strucimport comwhich accouhave fallen rise (see fig increase duriers have cgion has beearly 2016
he same pee average sheconomies
ngapore).
risks are tin 2017, sprices and he rising h
uately addre
ected econo
until recentlrgely due toctural factormposition gunt for ovesignificantl
gure 5.8), Curing 2000-contributedeen on an o6, even as geriod. It share of serv(China, Re
tilted to thesuch as str
rising infrahousehold
essed, could
omies in Ea
ly been the o a slowdowrs such as regradually sher 70 per cly for over
Cumulative -2015, with
d to the weaoverall dowglobal servishould cauvices in totaepublic of K
e downside.ronger demastructure iand corpor
d further ad
ast Asia, en
global tradewn in the deebalancing ihifting awaent of the a decade, nonontariff m
h some acceak export inwnward trenices trade hse some c
al exports is Korea, Hon
. Some factmand in deinvestment,rate debt i
dd to Gover
nd-2007
e engine eveloped in China ay from region’s on-tariff
measures eleration n recent nd since has been concerns
over 55 ng Kong
tors that eveloped all are in some rnments’
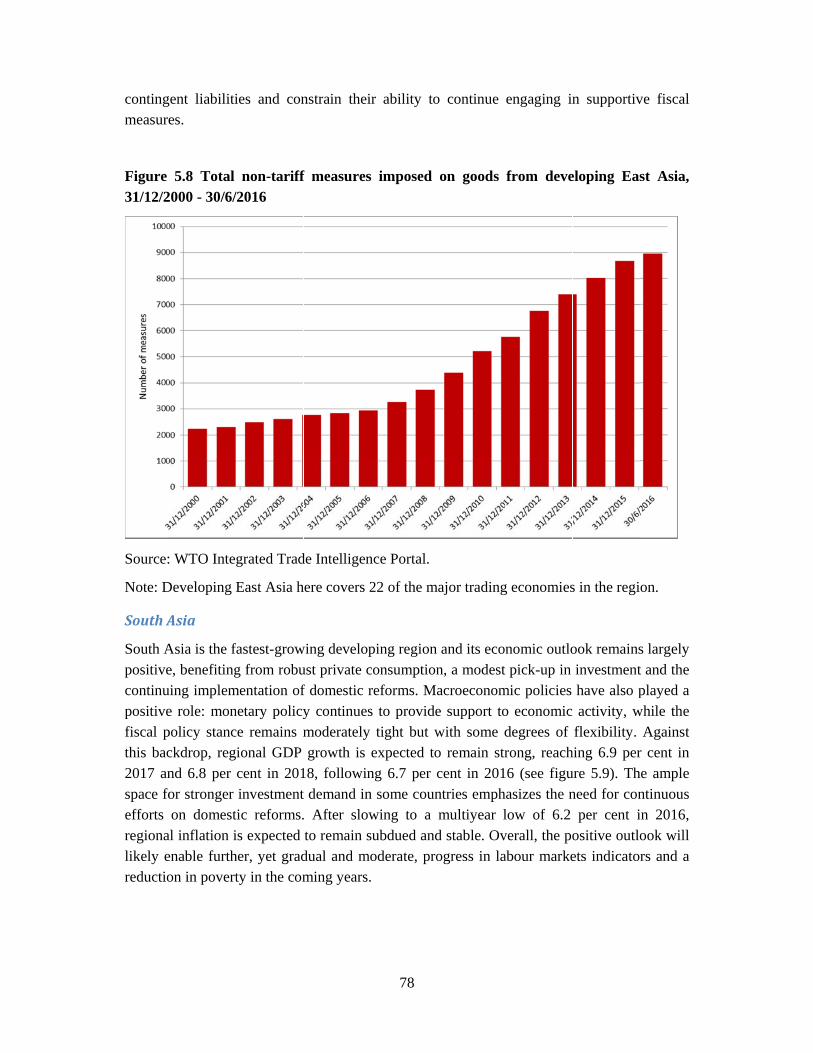
contingmeasure
Figure 31/12/2
Source:
Note: D
SouthA
South Apositivecontinupositivefiscal pthis bac2017 anspace foefforts regionalikely ereductio
gent liabilities.
5.8 Total 2000 - 30/6/
: WTO Integ
Developing E
Asia
Asia is the fe, benefitinguing impleme role: monpolicy stancckdrop, regnd 6.8 per or stronger on domest
al inflation ienable furthon in povert
ies and con
non-tariff/2016
grated Trad
East Asia h
fastest-growg from robu
mentation ofnetary policyce remains mional GDP cent in 201investment
tic reforms.is expected her, yet gradty in the com
nstrain thei
f measures
de Intelligen
here covers 2
wing developust private cf domestic ry continuesmoderately growth is
18, followint demand in. After slowto remain s
dual and moming years.
78
r ability to
s imposed
nce Portal.
22 of the ma
ping region consumptionreforms. Mas to provide
tight but wexpected to
ng 6.7 per cn some counwing to a subdued andoderate, pro
o continue
on goods
ajor trading
and its econn, a modest acroeconome support towith some do remain strcent in 201ntries emphmultiyear l
d stable. Ovogress in la
engaging in
from deve
g economies
nomic outlopick-up in
mic policies o economic degrees of rong, reach6 (see figuasizes the nlow of 6.2 verall, the poabour marke
n supportiv
eloping Eas
s in the regi
ook remainsinvestmenthave also pactivity, w
flexibility. hing 6.9 perure 5.9). Thneed for con
per cent iositive outloets indicato
ve fiscal
st Asia,
on.
s largely t and the played a
while the Against
r cent in he ample ntinuous in 2016, ook will rs and a
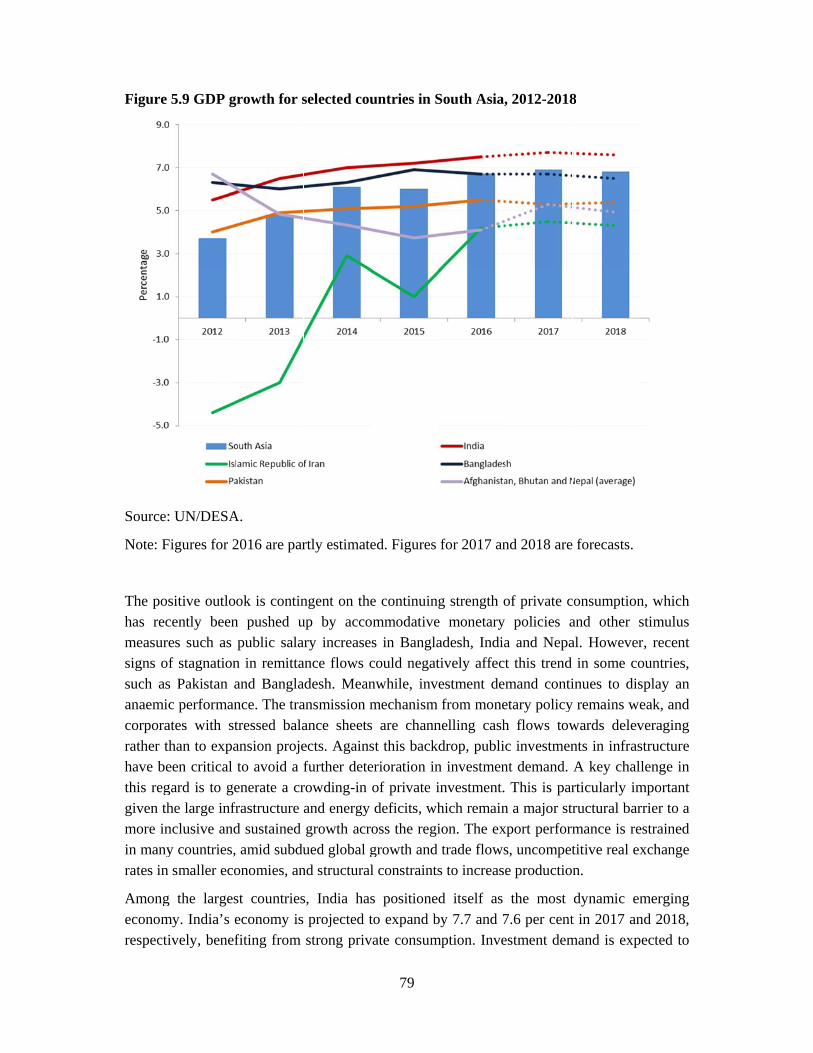
Figure
Source:
Note: F
The poshas recmeasuresigns ofsuch asanaemiccorporarather thhave bethis reggiven thmore inin manyrates in
Amongeconomrespecti
5.9 GDP g
: UN/DESA
Figures for 2
sitive outloocently beenes such as f stagnations Pakistan ac performan
ates with sthan to expaeen critical gard is to gehe large infrnclusive andy countries, smaller eco
g the largesmy. India’s eively, benef
rowth for s
A.
2016 are par
ok is continn pushed upublic sala
n in remittaand Banglance. The tratressed balaansion projeto avoid a enerate a crfrastructure d sustained amid subdu
onomies, an
st countrieseconomy isfiting from
selected cou
rtly estimate
ngent on theup by accoary increaseance flows cadesh. Meanansmission mance sheetsects. Againsfurther deterowding-in and energy growth acrued global g
nd structural
s, India has projected tstrong priv
79
untries in S
ed. Figures
e continuingommodatives in Banglacould negatnwhile, invmechanism s are channst this backerioration inof private ideficits, wh
ross the regigrowth and l constraints
s positioneto expand b
vate consum
South Asia,
for 2017 an
g strength oe monetary adesh, Indiatively affectestment demfrom mone
nelling cashdrop, publicn investmeninvestment. hich remainion. The extrade flows
s to increase
d itself as by 7.7 and 7mption. Inve
, 2012-2018
nd 2018 are
of private cpolicies a
a and Nepat this trend mand contietary policyh flows towc investmen
nt demand. This is par
n a major strxport performs, uncompete production
the most 7.6 per centestment dem
8
forecasts.
consumptionand other sal. However
in some coinues to dis
y remains wewards delevnts in infrasA key chalrticularly imructural barmance is retitive real exn.
dynamic emt in 2017 anmand is exp
n, which stimulus r, recent ountries, splay an eak, and veraging structure llenge in mportant rrier to a estrained xchange
merging nd 2018, pected to
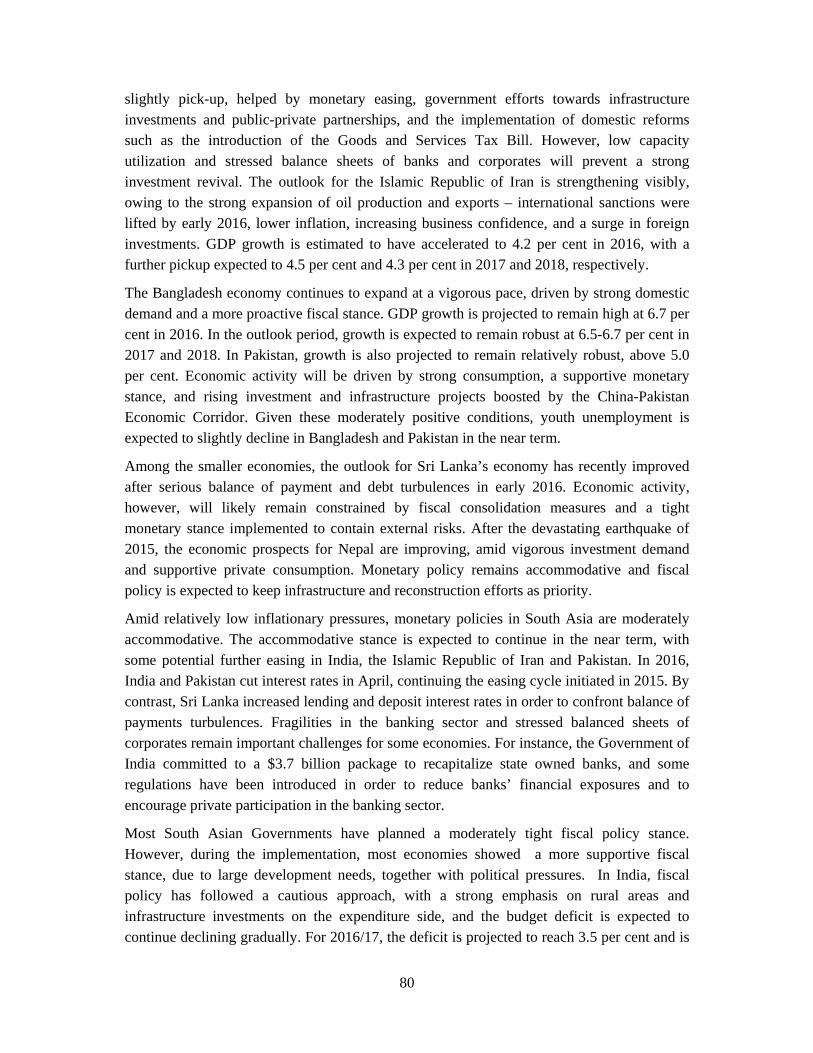
80
slightly pick-up, helped by monetary easing, government efforts towards infrastructure investments and public-private partnerships, and the implementation of domestic reforms such as the introduction of the Goods and Services Tax Bill. However, low capacity utilization and stressed balance sheets of banks and corporates will prevent a strong investment revival. The outlook for the Islamic Republic of Iran is strengthening visibly, owing to the strong expansion of oil production and exports – international sanctions were lifted by early 2016, lower inflation, increasing business confidence, and a surge in foreign investments. GDP growth is estimated to have accelerated to 4.2 per cent in 2016, with a further pickup expected to 4.5 per cent and 4.3 per cent in 2017 and 2018, respectively.
The Bangladesh economy continues to expand at a vigorous pace, driven by strong domestic demand and a more proactive fiscal stance. GDP growth is projected to remain high at 6.7 per cent in 2016. In the outlook period, growth is expected to remain robust at 6.5-6.7 per cent in 2017 and 2018. In Pakistan, growth is also projected to remain relatively robust, above 5.0 per cent. Economic activity will be driven by strong consumption, a supportive monetary stance, and rising investment and infrastructure projects boosted by the China-Pakistan Economic Corridor. Given these moderately positive conditions, youth unemployment is expected to slightly decline in Bangladesh and Pakistan in the near term.
Among the smaller economies, the outlook for Sri Lanka’s economy has recently improved after serious balance of payment and debt turbulences in early 2016. Economic activity, however, will likely remain constrained by fiscal consolidation measures and a tight monetary stance implemented to contain external risks. After the devastating earthquake of 2015, the economic prospects for Nepal are improving, amid vigorous investment demand and supportive private consumption. Monetary policy remains accommodative and fiscal policy is expected to keep infrastructure and reconstruction efforts as priority.
Amid relatively low inflationary pressures, monetary policies in South Asia are moderately accommodative. The accommodative stance is expected to continue in the near term, with some potential further easing in India, the Islamic Republic of Iran and Pakistan. In 2016, India and Pakistan cut interest rates in April, continuing the easing cycle initiated in 2015. By contrast, Sri Lanka increased lending and deposit interest rates in order to confront balance of payments turbulences. Fragilities in the banking sector and stressed balanced sheets of corporates remain important challenges for some economies. For instance, the Government of India committed to a $3.7 billion package to recapitalize state owned banks, and some regulations have been introduced in order to reduce banks’ financial exposures and to encourage private participation in the banking sector.
Most South Asian Governments have planned a moderately tight fiscal policy stance. However, during the implementation, most economies showed a more supportive fiscal stance, due to large development needs, together with political pressures. In India, fiscal policy has followed a cautious approach, with a strong emphasis on rural areas and infrastructure investments on the expenditure side, and the budget deficit is expected to continue declining gradually. For 2016/17, the deficit is projected to reach 3.5 per cent and is
81
on track to meet the medium-term target of 3.0 per cent. In Bangladesh and Pakistan, fiscal policy is becoming more expansionary, and thus deficits are expected to remain moderately high. In Sri Lanka, the fiscal deficit is relatively high and the efforts to reduce it are tilted to the revenue side, as the country displays one of the lowest tax-to-GDP ratios in the world. In recent months, Sri Lanka received a 3-year Extended Fund Facility of $1.5 billion from the IMF to support the reform agenda.
Against this backdrop, fiscal deficits are expected to remain elevated in most economies, and recent large increases in wages and other benefits in the public sector are likely to further reduce fiscal space. From a more medium-term perspective, the key fiscal challenge for the region is to strike a balance between improving tax revenues and promoting a supportive environment for the private sector, with a view to enhance the capacity to implement counter-cyclical policies. In fact, most economies are constrained by low tax-to-GDP ratios and high debt-to-GDP ratios. Despite increasing efforts to strengthen tax revenues and the efficiency of the tax system, significant delays and problems remain. For instance, high levels of informality represent a major challenge to the implementation and potential benefits of tax reforms across the region.
Despite the favourable outlook, South Asian economies face several downside risks. On the domestic front, the reform agenda could experience setbacks in some countries, while political instabilities might dampen investment prospects. Heightened regional geopolitical tensions could also weigh on the outlook. On the external front, the increase of interest rates in the United States represents another source of risk although the region’s financial markets show relatively low integration with global markets. Renewed episodes of high financialvolatility, including a sudden surge in external borrowing costs and large capital outflows, could significantly increase the difficulties to roll over debt, especially in countries with relatively low financial buffers and high US dollar denominated debt.
WesternAsia
The economic outlook for Western Asia remains weak and turbulent amid macroeconomic adjustments in oil-dependent economies, ongoing conflicts and long-lasting geopolitical concerns. Regional GDP growth declined from 2.9 per cent in 2015 to an estimated 2.2 per cent in 2016, mainly due to deteriorating economic conditions in the countries of the Cooperation Council for the Arab States of the Gulf (GCC), where lower oil prices seriously affected investment and government budgets. As a result, GCC countries had to undertake major reforms towards fiscal consolidation. Non-oil exporting economies exhibit a more heterogeneous outlook, but military conflicts and geopolitical tensions continue to curb investment and inhibit economic activity. In the outlook period, regional GDP growth is expected to remain subdued in 2017, but will likely improve more visibly in 2018 as international oil prices and domestic demand recover. Average economic growth is expected to reach 2.5 per cent in 2017 and 3.0 per cent in 2018.
GCC cpronoundeclininin Saudsince thcontractcountrieGovernwith theto constreach 2
Figure
Source:
Note: F
AmongmoderademandtogetherDespitein Jordcountriethe ecoestimateand sev
countries hnced in Omng from 3.2 di Arabia is he global ftion in nones are exp
nments are ie Fed’s tightrain and de.2 per cent i
5.10 GDP
: UN/DESA
Figures for 2
g the more date growth trd is expecter with secu
e recent impdan and Lebes experiennomy is in ed to have vere foreign
have been man, Saudi A
per cent inexpected to
financial crn-oil sectorspected to reincreasinglyhtening pathelay the recoin 2017, bef
growth for
A.
2016 are par
diversified rend, expan
ed to remainurity and pprovements banon as tcing militara perilous
contracted fn exchange
experienciArabia and tn 2015 to 2.0o reach a mrisis, amid s. In 2017, emain larg
y dependenth. Coupledovery. As a fore acceler
r selected co
rtly estimate
economies,nding by 3.1n resilient, bpolitical conin the term
the impact ry conflicts state. Econfurther in 2 constraints
82
ing a notithe United A0 per cent in
meagre 1.1 pfiscal austeinvestmen
gely subduet on debt finwith fiscal result, GDP
rating more
ountries in
ed. Figures
, the Turkis1 per cent inbut pressurencerns, are
ms of trade, wof the Syrsuch as Ira
nomies in th2016 due to s. The econ
iceable groArab Emiran 2016 (figuper cent in 2erity, tumblt and overaed as banknancing andconsolidatiP growth invisibly to 2
Western A
for 2017 an
sh economyn 2017 and 3es on fiscal
e likely to weak econorian crisis aq, the Syriahe Syrian Athe intensi
nomy of Ir
owth slowdates, with avure 5.10). In2016 - the sling investmall economik lending cd interest raion, these con GCC coun2.8 per cent
Asia, 2012-2
nd 2018 are
y is projecte3.5 per centl and monetweigh on
omic conditibecame moan Arab ReArab Repubfication of aq is expec
down - esverage GDPn particularslowest growment and aic activity continues tates will riseonditions ar
ntries is projin 2018.
2018
forecasts.
ed to contint in 2018. Dtary policy economic ions have pore widesprepublic and blic and Yemthe armed ccted to con
specially P growth , growth wth rate a severe in GCC to slow, e in line re likely jected to
nue on a Domestic
stances, activity.
prevailed read. In Yemen, men are conflicts
ntinue to
83
show positive growth in the outlook period, but this will be entirely driven by the expansion of oil production.
Labour markets have tended to deteriorate in both the GCC countries and the more diversified economies of the region, with unemployment rates on a modest rise. In particular, the slowdown in GCC countries has impeded job creation. Several countries are implementing labour market reforms to adjust to the more challenging economic conditions. For instance, recent labour market reforms in Saudi Arabia, Bahrain and Oman aim at prioritizing domestic workers. These measures are likely to affect the dominance of expatriate workers in in service sectors. By contrast, reforms in the United Arab Emirates, Kuwait and Qatar seek to increase the flexibility of labour markets by simplifying the mobility of foreign workers. In addition, non-economic factors continue to hamper labour markets across the region. Conflicts have caused large-scale unemployment in Iraq, the Syrian Arab Republic and Yemen, and negative spillover effects have been observed in Jordan, Lebanon and Turkey. Overall, the labour market situation is not expected to improve significantly in the near term, with structural unemployment remaining high, particularly among youth, and a widespread lack of decent work.
The inflation outlook remains tame in most economies amid subdued domestic demand and weak commodity prices. In GCC countries, inflation is expected to remain low and stable, below 4.0 per cent, following the trend of previous years. By contrast, inflation in Turkey has remained relatively high, well above the official target of 5.0 per cent, as the lira continued to depreciate, offsetting the effect of lower commodity prices. In the outlook period, inflation in Turkey is expected to remain relatively high.
The monetary policy stance is gradually tightening across the region. This trend is expected to continue following the expected increases in the Fed funds rate. It is highly unlikely that the GCC countries will abandon their pegs to the dollar, given their continued access to the international debt markets and potential support from other countries and multilateral institutions. Most of these economies also benefit from large international reserves and, despite increasing current account deficits, there are no signs of severe external constraints. Saudi Arabia’s foreign reserves stood at the equivalent of 29 months of imports of goods and services, while countries with lower reserves have already shown improvements in their current accounts, for example the United Arab Emirates. Nevertheless, liquidity conditions have deteriorated in most GCC countries throughout 2016, and borrowing costs have risen visibly. The interbank interest rates in Saudi Arabia reached in August the highest level since the financial crisis. Credit growth has also decelerated, particularly in Oman, Saudi Arabia and the United Arab Emirates. As GCC economies are projected to follow Fed’s interest rate decisions, monetary authorities might need to implement different measures, such as modifying reserve requirements, to boost liquidity.
The GCC countries are currently undertaking fiscal consolidation. Against the backdrop of lower oil prices, they have introduced a number of policy changes to address the rising deficits: spending and subsidy cuts, tax increases and new issuance of debt. Noticeably,

capital infrastruArabia a regionsome e(figure of strikifurther fiscal republic din Iraq, increasi
Figure
Source:
Note: F
There ageopoliconflict
expendituructure projeis expectednal value-aconomies. 5.11), but ping a balancexpenditureevenues. Indebt levels the Syrian
ing expendi
5.11 Fiscal
: UN/DESA
Figures for 2
are a numbeitical tensiots can worse
res have bects. With r
d to sell its fadded tax isDespite thepublic debt ce between e cuts and tn Turkey, fand containArab Repub
itures and ov
l deficits in
A and ESCW
2016 are est
er of risks ons are a pen the alrea
been less respect to nfirst internas also on these efforts, remains at the use of sthe introducfiscal policyn renewed pblic and Yever-reliance
n GCC coun
WA/UN.
timations.
to the regiopersistent dady severe i
84
affected, inew debt istional bondhe agenda, fiscal defica sustainab
sovereign wction of diry is expectpressures onemen has fue on debt fin
ntries, 2013
onal outlookdownside riimpact on t
illustrating suance, bef
d of about $and privati
cits have suble level. Powealth fundsrect and inded to reman the curren
urther worsenancing.
3-2016
k. The expsk for the the short an
the prioritfore the end10 billion. Tization planurged in molicymakerss, the level direct taxes ain tight, innt account. ened owing
ansion of aregion. An
nd medium-t
ty given td of the yeaThe introduns are unde
most GCC cs face the chand compoto increase
n order to mThe fiscal sto fragile re
armed confln escalationterm econo
to large ar Saudi uction of erway in countries hallenge sition of
e non-oil maintain situation evenues,
licts and n of the omic and
85
development prospects, preventing progress towards the Sustainable Development Goals. The regional outlook is contingent on the moderate rise of oil prices; an abrupt decline in oil prices can seriously affect the economic situation in oil-exporting economies. External economic developments might also affect the outlook in some economies. For instance, the projected path for interest rates in the United States might make it even more difficult to revive investment demand in GCC countries. A further deterioration of the economic situation in Egypt, including a sudden unravelling of balance of payment difficulties, might severely affect economic prospects in countries such as Jordan and Lebanon.
LatinAmericaandtheCaribbean
After the economy contracted for two consecutive years, economic growth is expected to return to Latin America and the Caribbean in the forecast period. The region’s aggregate GDP is projected to increase by 1.4 per cent in 2017 and by 2.3 per cent in 2018, following an estimated decline of 1.0 per cent in 2016. While the region continues to face significant internal and external headwinds, economic growth is forecast to gradually pick up in most countries. In line with earlier forecasts, South America is expected to see a modest cyclical recovery from the severe downturn of 2015/16, with Argentina and Brazil, the subregion’s two largest economies, set to emerge from recession. Several factors are likely to support this recovery; these include an increase in international commodity prices, more stable capital inflows and a gradual decline in inflation, which will likely give central banks room to ease monetary policy, thus supporting household consumption and private investment. On the other hand, rising unemployment and ongoing fiscal consolidation will continue to weigh on aggregate demand. The economic prospects for Mexico and Central America as well as the Caribbean have been slightly downgraded from earlier forecasts, partly due to weaker-than-expected activity in the United States. Despite an expected pick-up in growth, especially in the latter part of the forecast period, many economies in the two subregions will expand at only a modest pace owing to subdued external conditions, limited macroeconomic policy space and structural constraints.
There are several significant downside risks to the regional outlook, including potential consequences of faster-than-expected interest rate increases in the United States, a sharper-than-expected slowdown in China, a rise in protectionism, and a strong negative growth impact of fiscal consolidation. The subdued medium-term outlook for Latin America and the Caribbean pose a threat to the social achievements of the past decade, while also complicating the region’s path towards the SDGs. These challenges underscore the importance of reorienting macroeconomic and other policies across the region, with a view to promote investment in physical and human capital and strengthen the innovative capacities.
South America, which accounts for almost three quarters of the region’s total GDP, experienced a severe economic contraction for the second year in a row. After declining by 1.8 per cent in 2015, subregional output is estimated to have fallen by 2.3 per cent in 2016 amid recessions in Argentina, Brazil, Ecuador and the Bolivarian Republic of Venezuela, and slow growth in Chile and Colombia. Brazil has witnessed the deepest recession on record
86
over the past two years. The cumulative decline in economic output since late 2014 reached 8 per cent in the second quarter of 2016 as severe macroeconomic imbalances and a political crisis resulted in a sharp contraction of domestic demand. The Venezuelan economy faces an even deeper crisis amid large financing needs, shortages of basic goods, and upward spiralling inflation. GDP is estimated to have fallen by about 8 per cent in 2016, bringing the cumulative output contraction since 2013 to almost 20 per cent. Among the few bright spots in the subregion were Bolivia and Peru, with estimated growth in 2016 of 4.6 per cent and 3.8 per cent, respectively. Supported by strong government spending, both countries managed to largely defy the regional downturn. After showing some resilience in the early stages of the economic downturn, labour markets deteriorated considerably in 2016. Brazil’s unemployment rate reached 11.8 per cent in the third quarter of 2016, up from 6.3 per cent in late 2014. Argentina, Ecuador and Chile also registered marked increases in unemployment.
A closer examination of the expenditure components reveals a broad-based weakness. In most South American countries, fixed capital formation declined sharply in 2016, reflecting a downturn in investment in extractive industries, tight monetary policies, elevated corporate debt levels, weak business and consumer sentiment, and reductions in public investment. Household consumption also slowed, hit by rising unemployment, high inflation and tighter monetary policies. Brazil suffered a particularly severe contraction in private consumption of about 5 per cent. In most countries, the slump in private demand has been accompanied by lower Government spending, rendering fiscal policy pro-cyclical again.18 Government budgets have been under significant pressure since the commodity super cycle has come to an end, with primary deficits across the subregion rising rapidly (figure 5.12). Unlike most other countries in the region, which cut Government expenditures, Chile has been able to pursue a counter-cyclical fiscal policy in the past few years, benefiting from its low level of debt and firm credit rating. As both private and public domestic demand slowed considerably, only an increase in net exports prevented an even sharper downturn in output. Helped by sizeable currency depreciations in 2015, exports showed some modest growth over the past year, whereas imports declined – in some cases vigorously. In Brazil, for example, real exports of goods and services are estimated to have grown by about 6 per cent in 2016, while real imports fell by about 10 per cent.
18 See Alberola et al (2016), Fiscal policy and the cycle in Latin America: the role of financing conditions and fiscal rules, BIS Working Papers No 543.
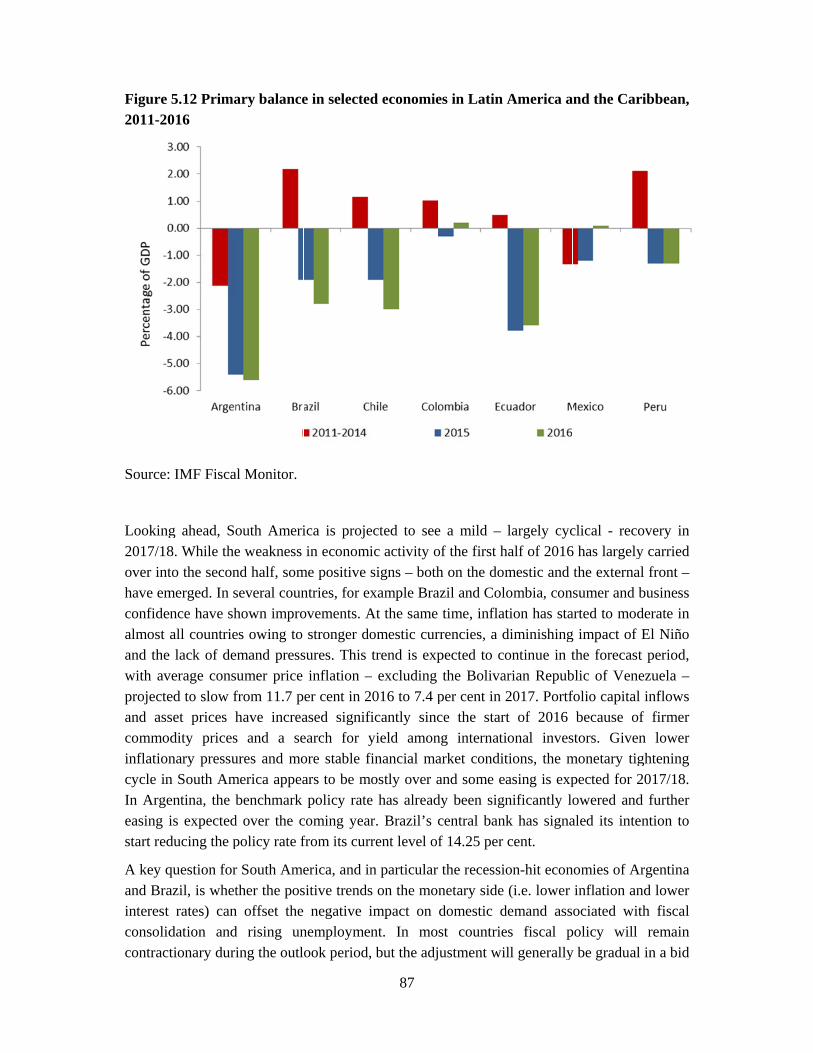
Figure 2011-20
Source:
Looking2017/18over inthave emconfidealmost and thewith avprojecteand asscommoinflationcycle inIn Argeeasing istart red
A key qand Brainterest consolidcontract
5.12 Prima016
: IMF Fisca
g ahead, So8. While theto the seconmerged. In sence have shall countrie
e lack of deverage consed to slow fset prices hdity pricesnary pressun South Amentina, the bis expectedducing the p
question forazil, is whet
rates) candation andtionary duri
ary balance
al Monitor.
outh Amerie weakness nd half, somseveral counhown improes owing to mand pressumer price
from 11.7 phave increas and a seures and momerica appeabenchmark
d over the cpolicy rate f
r South Amether the pos
n offset thed rising uning the outl
e in selected
ica is projein economi
me positive sntries, for exovements. A
stronger dosures. This
inflation –er cent in 2ased signifiearch for yore stable fars to be mpolicy rate
coming yearfrom its curr
erica, and insitive trends negative i
nemploymenook period,
87
d economie
ected to seeic activity osigns – bothxample Bra
At the same omestic curtrend is exp
– excluding 2016 to 7.4 pficantly sincyield amonfinancial maostly over a
e has alreadr. Brazil’s crent level o
n particular s on the moimpact on nt. In mo, but the adj
es in Latin
e a mild –of the first hh on the domazil and Col
time, inflatrrencies, a dpected to cothe Boliva
per cent in 2ce the starng internatiarket conditand some edy been signcentral bankf 14.25 per
the recessinetary side domestic dst countrieustment wi
America a
largely cychalf of 2016mestic and ombia, contion has stadiminishingontinue in t
arian Repub2017. Portf
rt of 2016 ional investions, the masing is expnificantly lok has signacent.
on-hit econ(i.e. lower
demand asses fiscal pll generally
nd the Car
clical - reco6 has largelythe externasumer and b
arted to modg impact of the forecast
blic of Venefolio capital
because ofstors. Givenmonetary tigpected for 2owered andaled its inte
nomies of Ainflation anociated wit
policy will y be gradual
ribbean,
overy in y carried al front – business derate in El Niño t period, ezuela – inflows f firmer n lower ghtening 2017/18. d further ention to
Argentina nd lower th fiscal
remain l in a bid
88
to avoid strong downward pressure on aggregate demand. In some cases, notably Argentina and Brazil, a more credible and stringent fiscal policy, including forward guidance, is expected to provide support for investment demand. Overall, the baseline forecast predicts a return to positive growth in Argentina and Brazil in 2017. The recovery is, however, expected to be relatively shallow, especially in Brazil, which continues to face immense structural and political challenges. The Bolivarian Republic of Venezuela is projected to remain in recession until at least 2017. Although growth in most other economies, including Chile and Colombia, is expected to gradually strengthen on the back of a recovery in domestic demand, the medium-term outlook remains clouded by long-standing structural weaknesses, including a strong dependence on commodities and low productivity growth.
The average growth forecasts for Mexico and Central America have been downgraded. This primarily reflects a weaker-than-expected performance of the Mexican economy, which is estimated to have grown by only 1.9 per cent in 2016. Economic activity has been largely driven by private consumption, whereas Government consumption, investment and exports weakened notably. Low oil prices, weak industrial production in the United States and tighter monetary and fiscal policy have weighed on domestic demand. In contrast to other Latin American economies, macroeconomic conditions in Mexico have remained stable, with consumer price inflation below 3 per cent and unemployment at about 4 per cent. However, the Mexican peso has come under persistent downward pressure. This can be attributed to a combination of factors such as the normalization of US monetary policy, the uncertainty about the outcome – and potential implications – of the US presidential election, the weak oil price and a rising current account deficit. Faced with a rapidly depreciating peso and concerns about a pass-through to inflation, Mexico’s central bank has hiked interest rates four times since late 2015. Going forward, the Mexican economy is projected to see a moderate strengthening of growth to 2.4 per cent in 2017, but the output gap will remain negative. With labour productivity stagnating in recent years, the Government hopes that structural reform efforts will promote competitiveness and help lift potential growth. However, limited macroeconomic policy space, combined with potential weaknesses in the US economy, will likely constrain growth in the medium term.
In Central America and the Caribbean, the economic situation and prospects vary considerably between countries. Strong domestic demand continues to boost economic activity in Costa Rica, the Dominican Republic, Nicaragua and Panama. To varying degrees, these countries benefit from buoyant public investment (particularly on infrastructure projects), robust private consumption (supported by remittance inflows), and a dynamic tourism industry. During the forecast period, they will remain among the region’s fastest-growing countries, with annual growth projected to exceed 4 per cent. In contrast, Cuba, Haiti and Jamaica recorded weak growth in 2016. Cuba’s economy has suffered from reduced support from the Bolivarian Republic of Venezuela and lower prices for nickel and sugarcane. Economic activity in Haiti and Jamaica was adversely affected by drought conditions as well as structural obstacles, including institutional weaknesses, tight fiscal budgets and high unemployment and underemployment. Suriname and Trinidad and Tobago
89
experienced significant contractions of GDP in 2016 as both countries were hit hard by the sharp drop in energy prices. All of these countries are projected to see a mild recovery in growth in 2017/18, but the deep-rooted structural issues and dependency on external factors will continue to cloud the economic prospects.
References Constantinescu, C., Mattoo, A., & Ruta, M. (2015). The global trade slowdown: cyclical or structural?. Policy Research working paper ; no. WPS 7158. Washington, DC: World Bank Group. Datt, G. and Ravallion, M. (1992), Growth and redistribution components of changes in poverty measures: A decomposition with application to Brazil and India in the 1980s, Journal of Development Economics, 38(2): 275-295.
Dell, M., Jones, B. F., & Olken, B. A. (2008). Climate change and economic growth: evidence from the last half century (No. w14132). National Bureau of Economic Research
European Central Bank (2016). Understanding the weakness in global trade : what is the new normal ? Occasional paper series : no. 178, Frankfurt am Main, European Central Bank.
Heal, G., & Park, J. (2013). Feeling the heat: Temperature, physiology & the wealth of nations (No. w19725). National Bureau of Economic Research.
Holland, D. and Jayadev, A. (2016). Modelling inequality and poverty. Mimeo.
Hoy, C. and Sumner, A. (2016). Gasoline, Guns, and Giveaways: Is There New Capacity for Redistribution to End Three Quarters of Global Poverty?. Center for Global Development Working Paper No. 433. Hoy and Sumner (2016)
International Monetary Fund (2016). Global trade : what’s behind the slowdown ? Chapter 2 of the October 2016 World Economic Outlook, Washington, DC : International Monetary Fund.
Ravallion, M. (2009). Do poorer countries have less capacity for redistribution?, Policy Research working paper; no. WPS 5046. Washington DC: World Bank Group.
Ravallion, M. (2013). How long will it take to lift one billion people out of poverty?, Policy Research working paper ; no. WPS 6325. Washington DC: World Bank Group.
Yoshida, N., Uematsu, H. and Sobrado, C. E. (2014). Is extreme poverty going to end ? an analytical framework to evaluate progress in ending extreme poverty. Policy Research working paper ; no. WPS 6740. Washington, DC: World Bank Group.

90
Appendix A. Global assumptions A. Key Assumptions
The United States Federal Reserve Board will raise its policy rate by 25 basis points
by the end of 2016. The Fed is also assumed to increase its policy rate by 50 basis points and 75 basis points in 2017 and 2018, respectively.
The price of Brent crude oil is projected to average $43 per barrel in 2016, $52 per barrel in 2017 and $61 per barrel in 2018.
Most major currencies are expected to depreciate against the US$ in 2017-18.
B. Monetary Policy Stances
Unconventional Conventional
United States
The Fed terminated its asset purchase programme in October 2014, which has so far not been associated with a rebound of long-term government bond yields in the United States of America.
Until the end of 2018, the Fed is expected to maintain its policy of “reinvesting principal payments from its holdings of agency debt and agency mortgage-backed securities in agency mortgage-backed securities and of rolling over maturing Treasury securities at auction”, broadly maintaining the size of its balance sheet.
The Fed will continue to remain cautious about raising its policy rate in the near term.
Our assumption is that the Fed will raise its policy by 25 basis points by the end of 2016. The Fed is also assumed to increase its policy rate by 50 basis points and 75 basis points in 2017 and 2018, respectively.
Japan Our assumption is that the Bank of Japan (BoJ) will maintain its policy of “QQE with yield curve control” until at least the end of 2018. The BoJ will continue to purchase Japanese government bonds to target a 0 yield on 10-year government bonds.
Our assumption is that BoJ will continue applying a negative interest rate to the Policy-Rate Balances in current accounts held by financial institutions at the Bank until at least end-2018.
Eurozone On March 2016, the ECB announced a significant loosening of the monetary stance, expanding its asset purchase programme, which is due to run to March 2017, with monthly purchases of public and private
In March 2016, the European Central Bank (ECB) cut the target rate on its main refinancing rate to 0%, and lowered the interest rate on the
91
sector securities amounting to €80 billion.
The ECB has indicated its readiness to increase or extend the QE if necessary, our assumption is that the asset purchase programme policy will be extended to December 2017.
deposit facility to -0.4%.
Our assumption is that policy interest rates will stay at current levels until end-2018.
United Kingdom
The BoE increased the volume of its asset purchases in the wake of the Brexit vote. Our assumption is that this increased volume will remain in place.
Our assumption is that the Bank of England will cut its policy by 15 basis points by the end of 2016, maintaining this level to end-2017. Bank of England will then increase its policy rate by 65 basis points in 2018.
China Our assumption is that People’s Bank of China (PBoC) will be less aggressive in cutting reserve requirement ratio during the forecast period. It is assumed that there will be at most two 50 basis-point reserve requirement ratio cuts in 2017.
Our assumption is that PBoC will continue to pursue a prudent monetary stance. Interbank rates should remain at the current low levels. It is assumed that there will not be aggressive policy rate cuts during the forecast period, conditioning on continued growth stabilization. Credit growth will continue to outpace GDP growth in 2016-2018, but at a rate lower than that in 2015.

Figure
Source:* UN/D
C.
United
Japan
A.A.1 Tota
: UN/DESADESA projec
Fiscal Poli States
al assets of
A, based on ctions from
cy Environ
The othe elwill rAfter expecstate achangJapandelay2019.The c31.3%In Aprogrgoveradditi
major cen
data from rem September
nment
outlook for Ulection in Nremain broa
6 consecucted to staband local) wges are plannn’s second ed for the s corporation
%. August 201
amme, exprnments byional spendi
92
tral banks,
elevant cenr 2016 onwa
US fiscal poNovember 2adly neutra
utive years bilise in 20will remain ned in the cincrease in
second time
n tax rate
6, the Gopected to ry 7.5 trillioing in FY20
, Dec 2006
tral banks.ard.
olicy is part016. Our asal in 2017-2of decline,17. Total gflat during
current budgn the conse, and is cur
was cut in
overnment raise spendon yen, whi016. The ad
- Dec 2018
tly dependessumption i2018. national d
government 2017-2018
get. sumption trrently sche
n April 201
announcedding by nich includes
dditional spe
*
nt on the ouis that fisca
defence outspending (
. No signifi
tax rate heduled for O
16 from 32
d a new snational ans 4.6 trillionending alloc
utturn of al policy
tlays are (federal, icant tax
has been October
2.1% to
stimulus nd local n yen in cated for
93
FY 2016 is equivalent to around 0.9 per cent of GDP and a 4.8 per cent expansion from the original government budget for the fiscal year.
Eurozone Fiscal policy will remain restrictive due to both institutional reasons such as excessive-deficit guidelines as well as political preferences in some countries. Some loosening of the fiscal policy stance will occur in a number of countries, owing to specific political circumstances. Germany and several other countries will see further public spending requirements in view of the large number of migrants. In the UK, the decision to leave the EU will necessitate significant fiscal spending reallocations and increases.
China Our assumption is that China will maintain a mildly expansionary fiscal stance in 2017-2018, with more active intervention in infrastructure investment and promotion of new strategic industries. On-budget deficit in 2016 is assumed to be higher than last year and will remain at similar levels in the next two years. In addition, significant fiscal support will also be provided through off-budget channels, such as policy banks, public-private partnership, and deployment of rising local government revenues from land sales.
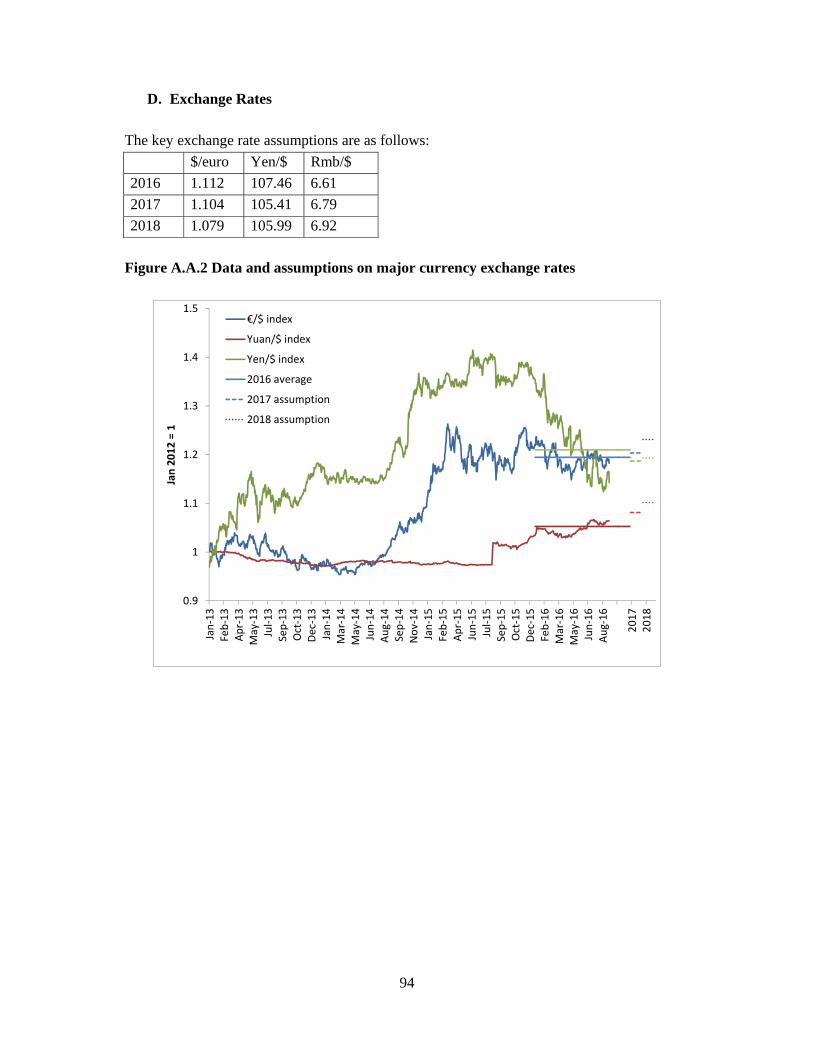
94
D. Exchange Rates
The key exchange rate assumptions are as follows: $/euro Yen/$ Rmb/$ 2016 1.112 107.46 6.61 2017 1.104 105.41 6.79 2018 1.079 105.99 6.92
Figure A.A.2 Data and assumptions on major currency exchange rates
0.9
1
1.1
1.2
1.3
1.4
1.5
Jan‐13
Feb‐13
Apr‐13
May‐13
Jul‐1
3Sep‐13
Oct‐13
Dec‐13
Jan‐14
Mar‐14
May‐14
Jun‐14
Aug‐14
Sep‐14
Nov
‐14
Jan‐15
Feb‐15
Apr‐15
Jun‐15
Jul‐1
5Sep‐15
Oct‐15
Dec‐15
Feb‐16
Mar‐16
May‐16
Jun‐16
Aug‐16
2017
2018
Jan 2012
= 1
€/$ index
Yuan/$ index
Yen/$ index
2016 average
2017 assumption
2018 assumption
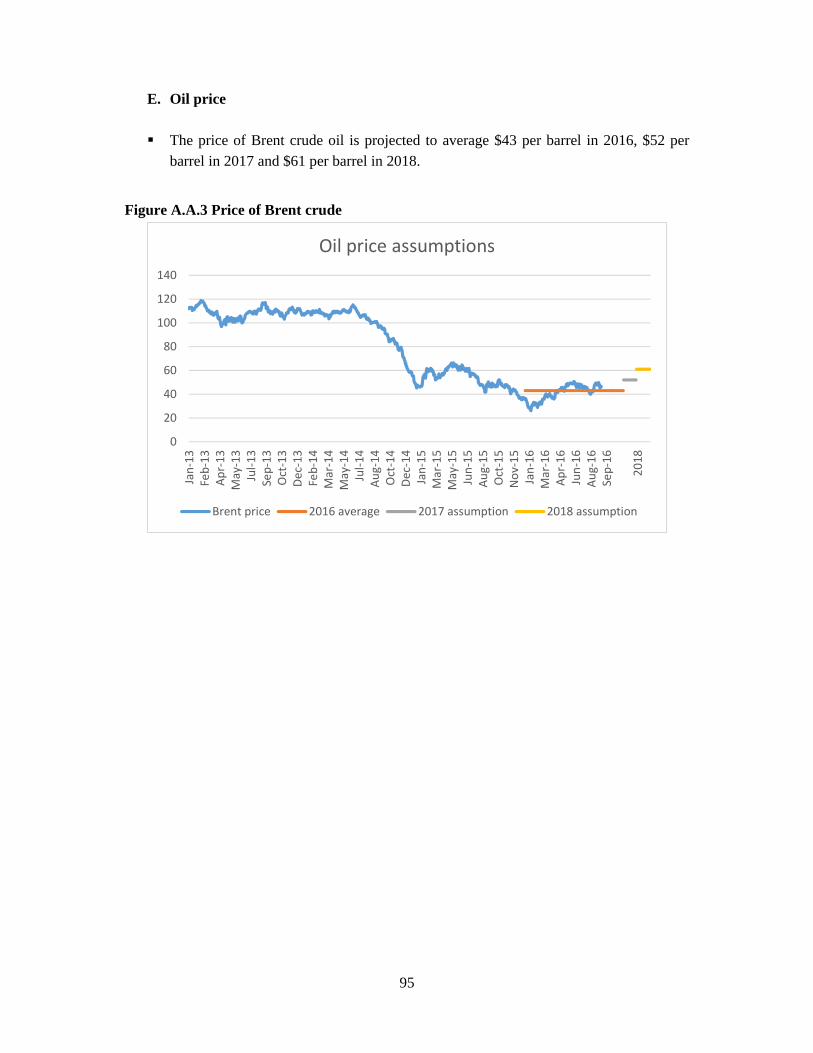
95
E. Oil price
The price of Brent crude oil is projected to average $43 per barrel in 2016, $52 per barrel in 2017 and $61 per barrel in 2018.
Figure A.A.3 Price of Brent crude
0
20
40
60
80
100
120
140
Jan‐13
Feb‐13
Apr‐13
May‐13
Jul‐1
3Sep‐13
Oct‐13
Dec‐13
Feb‐14
Mar‐14
May‐14
Jul‐1
4Au
g‐14
Oct‐14
Dec‐14
Jan‐15
Mar‐15
May‐15
Jun‐15
Aug‐15
Oct‐15
Nov
‐15
Jan‐16
Mar‐16
Apr‐16
Jun‐16
Aug‐16
Sep‐16
2018
Oil price assumptions
Brent price 2016 average 2017 assumption 2018 assumption
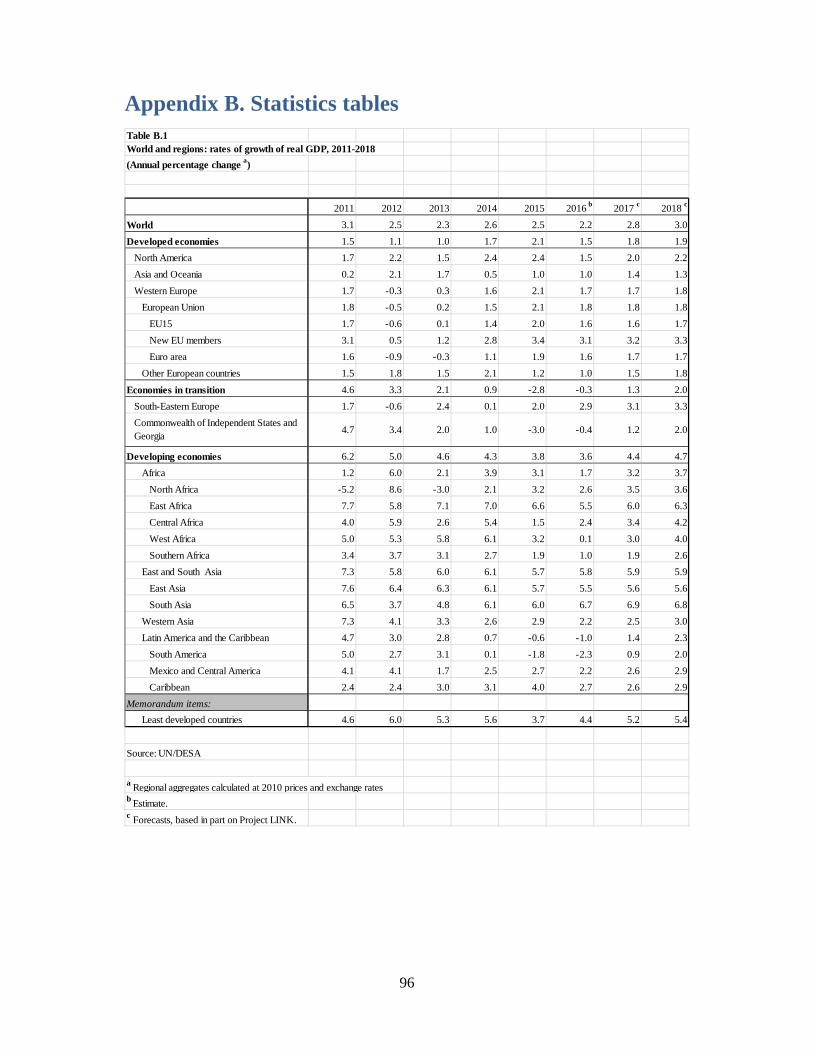
96
Appendix B. Statistics tables
Table B.1World and regions: rates of growth of real GDP, 2011-2018(Annual percentage change a)
2011 2012 2013 2014 2015 2016 b 2017 c 2018 c
World 3.1 2.5 2.3 2.6 2.5 2.2 2.8 3.0
Developed economies 1.5 1.1 1.0 1.7 2.1 1.5 1.8 1.9North America 1.7 2.2 1.5 2.4 2.4 1.5 2.0 2.2Asia and Oceania 0.2 2.1 1.7 0.5 1.0 1.0 1.4 1.3Western Europe 1.7 -0.3 0.3 1.6 2.1 1.7 1.7 1.8
European Union 1.8 -0.5 0.2 1.5 2.1 1.8 1.8 1.8EU15 1.7 -0.6 0.1 1.4 2.0 1.6 1.6 1.7New EU members 3.1 0.5 1.2 2.8 3.4 3.1 3.2 3.3Euro area 1.6 -0.9 -0.3 1.1 1.9 1.6 1.7 1.7
Other European countries 1.5 1.8 1.5 2.1 1.2 1.0 1.5 1.8
Economies in transition 4.6 3.3 2.1 0.9 -2.8 -0.3 1.3 2.0South-Eastern Europe 1.7 -0.6 2.4 0.1 2.0 2.9 3.1 3.3Commonwealth of Independent States and Georgia 4.7 3.4 2.0 1.0 -3.0 -0.4 1.2 2.0
Developing economies 6.2 5.0 4.6 4.3 3.8 3.6 4.4 4.7Africa 1.2 6.0 2.1 3.9 3.1 1.7 3.2 3.7
North Africa -5.2 8.6 -3.0 2.1 3.2 2.6 3.5 3.6East Africa 7.7 5.8 7.1 7.0 6.6 5.5 6.0 6.3Central Africa 4.0 5.9 2.6 5.4 1.5 2.4 3.4 4.2West Africa 5.0 5.3 5.8 6.1 3.2 0.1 3.0 4.0Southern Africa 3.4 3.7 3.1 2.7 1.9 1.0 1.9 2.6
East and South Asia 7.3 5.8 6.0 6.1 5.7 5.8 5.9 5.9East Asia 7.6 6.4 6.3 6.1 5.7 5.5 5.6 5.6South Asia 6.5 3.7 4.8 6.1 6.0 6.7 6.9 6.8
Western Asia 7.3 4.1 3.3 2.6 2.9 2.2 2.5 3.0Latin America and the Caribbean 4.7 3.0 2.8 0.7 -0.6 -1.0 1.4 2.3
South America 5.0 2.7 3.1 0.1 -1.8 -2.3 0.9 2.0Mexico and Central America 4.1 4.1 1.7 2.5 2.7 2.2 2.6 2.9Caribbean 2.4 2.4 3.0 3.1 4.0 2.7 2.6 2.9
Memorandum items:Least developed countries 4.6 6.0 5.3 5.6 3.7 4.4 5.2 5.4
Source: UN/DESA
a Regional aggregates calculated at 2010 prices and exchange ratesb Estimate.c Forecasts, based in part on Project LINK.

97
Table B.2Rates of growth of real GDP, 2011-2018(Annual percentage change)
2011 2012 2013 2014 2015 2016 a 2017 b 2018 b
Developed EconomiesNorth America
Canada 3.0 1.9 2.0 2.5 1.1 1.2 2.6 2.4United States of America 1.6 2.2 1.5 2.4 2.6 1.5 2.0 2.2
Asia and OceaniaAustralia 2.7 3.5 2.0 2.7 2.4 2.8 1.9 2.6Japan -0.5 1.7 1.6 -0.1 0.6 0.5 1.2 0.9New Zealand 1.8 2.8 1.7 3.0 3.0 2.5 2.5 2.5
European UnionEU-15
Austria 2.8 0.8 0.3 0.8 0.8 1.4 1.5 1.4Belgium 1.8 0.2 0.0 1.3 1.4 1.4 1.5 1.5Denmark 1.2 -0.1 -0.2 1.3 1.0 1.6 1.9 1.9Finland 2.6 -1.4 -1.1 -0.7 0.2 0.9 1.2 1.3France 2.1 0.2 0.7 0.7 1.2 1.3 1.6 1.6Germany 3.7 0.4 0.3 1.6 1.5 1.8 1.8 1.7Greece -9.1 -7.3 -3.2 0.7 -0.3 -0.3 1.7 2.0Ireland 2.6 0.2 1.4 8.5 26.3 3.9 3.1 2.9Italy 0.6 -2.8 -1.7 -0.3 0.6 0.9 1.2 1.3Luxembourg 2.6 -0.8 4.3 4.1 4.9 2.6 3.0 2.8Netherlands 1.7 -1.1 -0.5 1.4 2.0 1.6 1.8 2.0Portugal -1.8 -4.0 -1.1 0.9 1.5 1.4 1.4 1.3Spain -1.0 -2.6 -1.7 1.4 3.2 2.7 2.3 2.3Sweden 2.7 -0.3 1.2 2.3 4.1 3.1 2.5 2.3United Kingdom of Great Britain and Northern Ireland 2.0 1.2 2.2 3.1 2.2 1.6 0.9 1.3
New EU MemberBulgaria 1.6 0.2 1.3 1.5 3.0 2.5 2.9 3.0Croatia -0.3 -2.2 -1.1 -0.4 1.6 2.5 2.5 2.7Cyprus 0.4 -2.4 -5.9 -2.5 1.6 1.6 1.7 1.8Czech Republic 2.0 -0.9 -0.5 2.7 4.6 2.5 2.5 2.4Estonia 7.6 5.2 1.6 2.9 1.1 1.5 2.3 2.6Hungary 1.8 -1.7 1.9 3.7 2.9 2.0 2.5 2.5Latvia 6.2 4.0 3.0 2.4 2.7 2.1 2.6 2.9Lithuania 6.0 3.8 3.5 3.1 1.6 2.5 2.5 3.2Malta 2.1 2.5 2.6 3.5 6.2 3.2 2.8 2.8Poland 5.0 1.6 1.3 3.3 3.6 3.4 3.6 3.8Romania 1.1 0.6 3.5 3.1 3.8 5.0 4.2 3.8Slovakia 2.8 1.5 1.4 2.5 3.6 3.5 3.5 3.9Slovenia 0.6 -2.7 -1.1 2.9 2.1 2.0 2.3 2.5
Other EuropeanIceland 2.0 1.2 3.9 1.8 4.0 3.2 2.9 2.7Norway 1.0 2.7 1.0 2.2 1.6 0.9 1.6 1.9Switzerland 1.8 1.1 1.8 2.0 0.8 1.0 1.4 1.7
Economies in transitionSouth-Eastern Europe
Albania 2.5 1.6 1.4 1.8 2.8 3.1 3.5 4.4Bosnia and Herzegovina 0.9 -0.9 2.4 1.1 3.2 2.5 2.9 3.0Montenegro 3.2 -2.7 3.5 1.8 3.1 4.2 3.5 3.2Serbia 1.4 -1.0 2.6 -1.8 0.7 2.9 3.0 3.0The former Yugoslav Republic of Macedonia 2.3 -0.5 2.7 3.8 3.7 2.6 3.0 3.5
Commonwealth of Independent StatesArmenia 4.7 7.2 3.3 3.6 3.0 2.7 2.7 3.0Azerbaijan 0.1 2.2 5.8 2.8 1.1 -2.7 1.0 1.5Belarus 5.5 1.7 1.0 1.6 -3.8 -1.7 1.5 1.9Kazakhstan 7.3 5.0 6.0 4.3 1.2 0.3 1.4 2.5Kyrgyzstan 6.0 -0.1 10.5 4.3 4.0 0.5 1.9 2.3Republic of Moldova 6.8 -0.7 9.4 4.6 0.3 1.2 2.5 3.0Russian Federation 4.3 3.4 1.3 0.7 -3.7 -0.9 0.8 1.5Tajikistan 2.4 7.5 7.4 6.8 6.0 5.1 4.8 4.3Turkmenistan 14.7 11.1 10.2 10.3 6.5 6.0 6.1 6.5Ukraine 5.4 0.2 0.0 -6.6 -9.9 -0.1 1.9 3.2Uzbekistan 8.3 8.2 8.0 8.1 8.0 7.4 6.0 6.4
Georgia 7.2 6.4 3.3 4.6 2.8 2.8 3.0 4.2
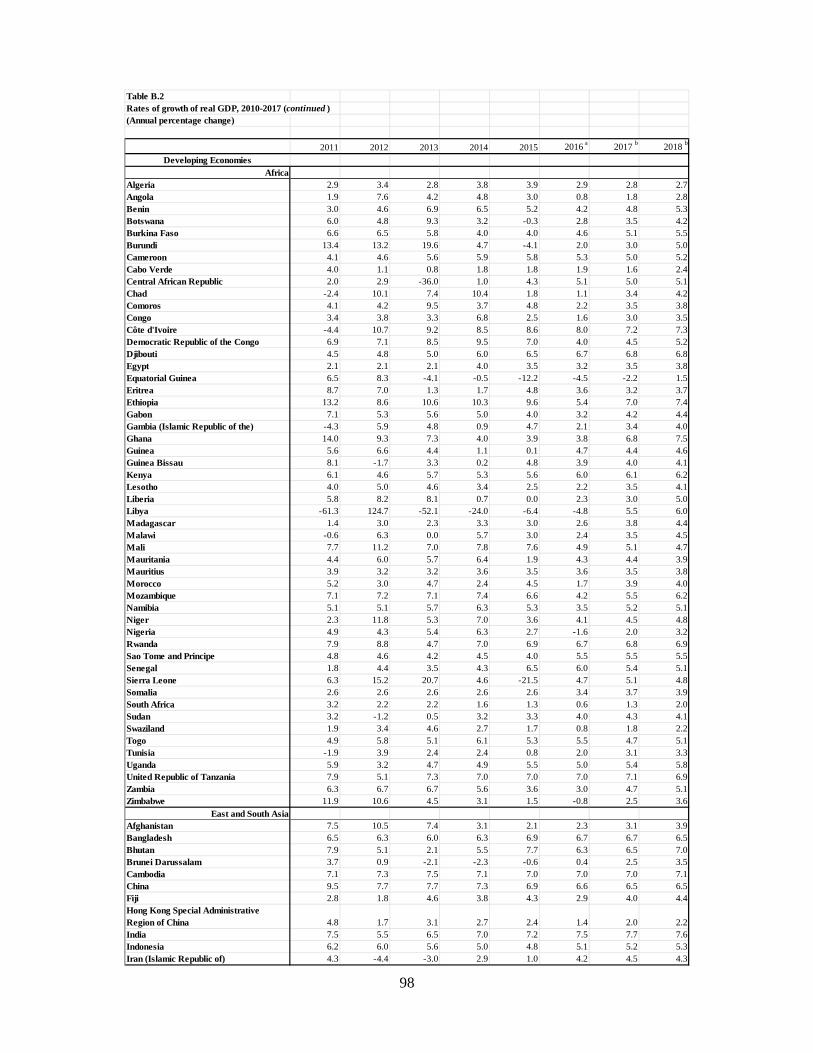
98
Table B.2Rates of growth of real GDP, 2010-2017 (continued )(Annual percentage change)
2011 2012 2013 2014 2015 2016 a 2017 b 2018 b
Developing EconomiesAfrica
Algeria 2.9 3.4 2.8 3.8 3.9 2.9 2.8 2.7Angola 1.9 7.6 4.2 4.8 3.0 0.8 1.8 2.8Benin 3.0 4.6 6.9 6.5 5.2 4.2 4.8 5.3Botswana 6.0 4.8 9.3 3.2 -0.3 2.8 3.5 4.2Burkina Faso 6.6 6.5 5.8 4.0 4.0 4.6 5.1 5.5Burundi 13.4 13.2 19.6 4.7 -4.1 2.0 3.0 5.0Cameroon 4.1 4.6 5.6 5.9 5.8 5.3 5.0 5.2Cabo Verde 4.0 1.1 0.8 1.8 1.8 1.9 1.6 2.4Central African Republic 2.0 2.9 -36.0 1.0 4.3 5.1 5.0 5.1Chad -2.4 10.1 7.4 10.4 1.8 1.1 3.4 4.2Comoros 4.1 4.2 9.5 3.7 4.8 2.2 3.5 3.8Congo 3.4 3.8 3.3 6.8 2.5 1.6 3.0 3.5Côte d'Ivoire -4.4 10.7 9.2 8.5 8.6 8.0 7.2 7.3Democratic Republic of the Congo 6.9 7.1 8.5 9.5 7.0 4.0 4.5 5.2Djibouti 4.5 4.8 5.0 6.0 6.5 6.7 6.8 6.8Egypt 2.1 2.1 2.1 4.0 3.5 3.2 3.5 3.8Equatorial Guinea 6.5 8.3 -4.1 -0.5 -12.2 -4.5 -2.2 1.5Eritrea 8.7 7.0 1.3 1.7 4.8 3.6 3.2 3.7Ethiopia 13.2 8.6 10.6 10.3 9.6 5.4 7.0 7.4Gabon 7.1 5.3 5.6 5.0 4.0 3.2 4.2 4.4Gambia (Islamic Republic of the) -4.3 5.9 4.8 0.9 4.7 2.1 3.4 4.0Ghana 14.0 9.3 7.3 4.0 3.9 3.8 6.8 7.5Guinea 5.6 6.6 4.4 1.1 0.1 4.7 4.4 4.6Guinea Bissau 8.1 -1.7 3.3 0.2 4.8 3.9 4.0 4.1Kenya 6.1 4.6 5.7 5.3 5.6 6.0 6.1 6.2Lesotho 4.0 5.0 4.6 3.4 2.5 2.2 3.5 4.1Liberia 5.8 8.2 8.1 0.7 0.0 2.3 3.0 5.0Libya -61.3 124.7 -52.1 -24.0 -6.4 -4.8 5.5 6.0Madagascar 1.4 3.0 2.3 3.3 3.0 2.6 3.8 4.4Malawi -0.6 6.3 0.0 5.7 3.0 2.4 3.5 4.5Mali 7.7 11.2 7.0 7.8 7.6 4.9 5.1 4.7Mauritania 4.4 6.0 5.7 6.4 1.9 4.3 4.4 3.9Mauritius 3.9 3.2 3.2 3.6 3.5 3.6 3.5 3.8Morocco 5.2 3.0 4.7 2.4 4.5 1.7 3.9 4.0Mozambique 7.1 7.2 7.1 7.4 6.6 4.2 5.5 6.2Namibia 5.1 5.1 5.7 6.3 5.3 3.5 5.2 5.1Niger 2.3 11.8 5.3 7.0 3.6 4.1 4.5 4.8Nigeria 4.9 4.3 5.4 6.3 2.7 -1.6 2.0 3.2Rwanda 7.9 8.8 4.7 7.0 6.9 6.7 6.8 6.9Sao Tome and Principe 4.8 4.6 4.2 4.5 4.0 5.5 5.5 5.5Senegal 1.8 4.4 3.5 4.3 6.5 6.0 5.4 5.1Sierra Leone 6.3 15.2 20.7 4.6 -21.5 4.7 5.1 4.8Somalia 2.6 2.6 2.6 2.6 2.6 3.4 3.7 3.9South Africa 3.2 2.2 2.2 1.6 1.3 0.6 1.3 2.0Sudan 3.2 -1.2 0.5 3.2 3.3 4.0 4.3 4.1Swaziland 1.9 3.4 4.6 2.7 1.7 0.8 1.8 2.2Togo 4.9 5.8 5.1 6.1 5.3 5.5 4.7 5.1Tunisia -1.9 3.9 2.4 2.4 0.8 2.0 3.1 3.3Uganda 5.9 3.2 4.7 4.9 5.5 5.0 5.4 5.8United Republic of Tanzania 7.9 5.1 7.3 7.0 7.0 7.0 7.1 6.9Zambia 6.3 6.7 6.7 5.6 3.6 3.0 4.7 5.1Zimbabwe 11.9 10.6 4.5 3.1 1.5 -0.8 2.5 3.6
East and South AsiaAfghanistan 7.5 10.5 7.4 3.1 2.1 2.3 3.1 3.9Bangladesh 6.5 6.3 6.0 6.3 6.9 6.7 6.7 6.5Bhutan 7.9 5.1 2.1 5.5 7.7 6.3 6.5 7.0Brunei Darussalam 3.7 0.9 -2.1 -2.3 -0.6 0.4 2.5 3.5Cambodia 7.1 7.3 7.5 7.1 7.0 7.0 7.0 7.1China 9.5 7.7 7.7 7.3 6.9 6.6 6.5 6.5Fiji 2.8 1.8 4.6 3.8 4.3 2.9 4.0 4.4Hong Kong Special Administrative Region of China 4.8 1.7 3.1 2.7 2.4 1.4 2.0 2.2India 7.5 5.5 6.5 7.0 7.2 7.5 7.7 7.6Indonesia 6.2 6.0 5.6 5.0 4.8 5.1 5.2 5.3Iran (Islamic Republic of) 4.3 -4.4 -3.0 2.9 1.0 4.2 4.5 4.3
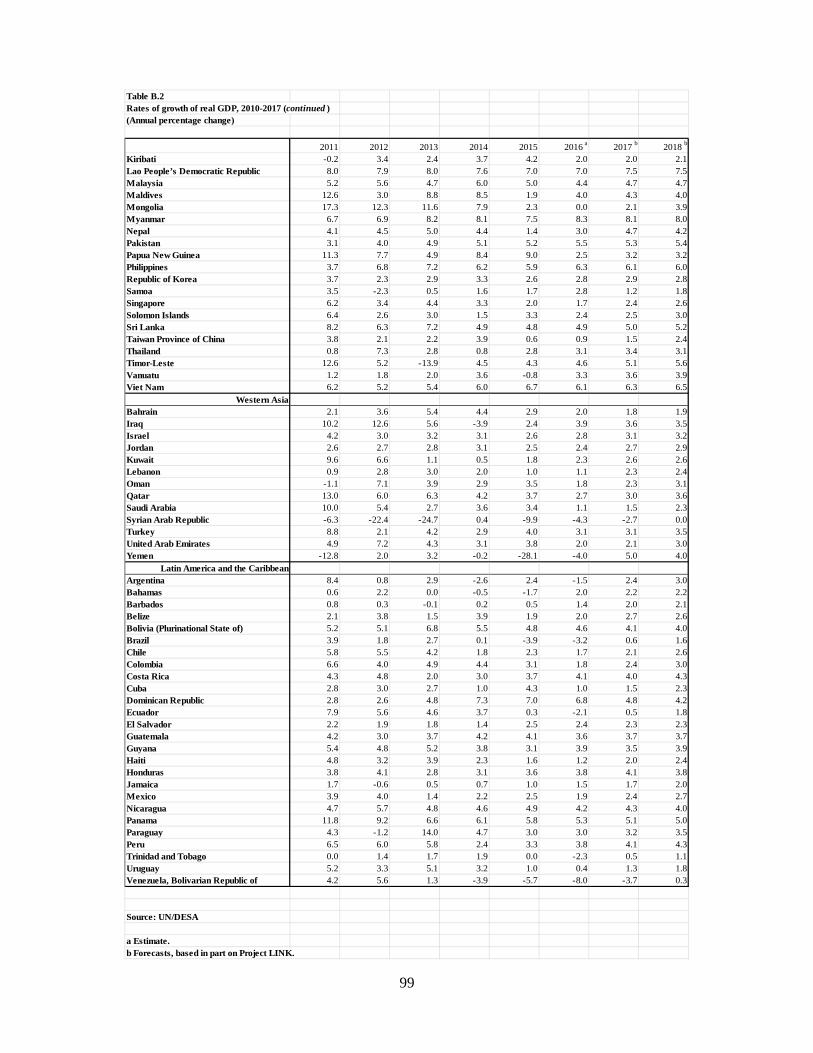
99
Table B.2Rates of growth of real GDP, 2010-2017 (continued )(Annual percentage change)
2011 2012 2013 2014 2015 2016 a 2017 b 2018 b
Kiribati -0.2 3.4 2.4 3.7 4.2 2.0 2.0 2.1Lao People’s Democratic Republic 8.0 7.9 8.0 7.6 7.0 7.0 7.5 7.5Malaysia 5.2 5.6 4.7 6.0 5.0 4.4 4.7 4.7Maldives 12.6 3.0 8.8 8.5 1.9 4.0 4.3 4.0Mongolia 17.3 12.3 11.6 7.9 2.3 0.0 2.1 3.9Myanmar 6.7 6.9 8.2 8.1 7.5 8.3 8.1 8.0Nepal 4.1 4.5 5.0 4.4 1.4 3.0 4.7 4.2Pakistan 3.1 4.0 4.9 5.1 5.2 5.5 5.3 5.4Papua New Guinea 11.3 7.7 4.9 8.4 9.0 2.5 3.2 3.2Philippines 3.7 6.8 7.2 6.2 5.9 6.3 6.1 6.0Republic of Korea 3.7 2.3 2.9 3.3 2.6 2.8 2.9 2.8Samoa 3.5 -2.3 0.5 1.6 1.7 2.8 1.2 1.8Singapore 6.2 3.4 4.4 3.3 2.0 1.7 2.4 2.6Solomon Islands 6.4 2.6 3.0 1.5 3.3 2.4 2.5 3.0Sri Lanka 8.2 6.3 7.2 4.9 4.8 4.9 5.0 5.2Taiwan Province of China 3.8 2.1 2.2 3.9 0.6 0.9 1.5 2.4Thailand 0.8 7.3 2.8 0.8 2.8 3.1 3.4 3.1Timor-Leste 12.6 5.2 -13.9 4.5 4.3 4.6 5.1 5.6Vanuatu 1.2 1.8 2.0 3.6 -0.8 3.3 3.6 3.9Viet Nam 6.2 5.2 5.4 6.0 6.7 6.1 6.3 6.5
Western AsiaBahrain 2.1 3.6 5.4 4.4 2.9 2.0 1.8 1.9Iraq 10.2 12.6 5.6 -3.9 2.4 3.9 3.6 3.5Israel 4.2 3.0 3.2 3.1 2.6 2.8 3.1 3.2Jordan 2.6 2.7 2.8 3.1 2.5 2.4 2.7 2.9Kuwait 9.6 6.6 1.1 0.5 1.8 2.3 2.6 2.6Lebanon 0.9 2.8 3.0 2.0 1.0 1.1 2.3 2.4Oman -1.1 7.1 3.9 2.9 3.5 1.8 2.3 3.1Qatar 13.0 6.0 6.3 4.2 3.7 2.7 3.0 3.6Saudi Arabia 10.0 5.4 2.7 3.6 3.4 1.1 1.5 2.3Syrian Arab Republic -6.3 -22.4 -24.7 0.4 -9.9 -4.3 -2.7 0.0Turkey 8.8 2.1 4.2 2.9 4.0 3.1 3.1 3.5United Arab Emirates 4.9 7.2 4.3 3.1 3.8 2.0 2.1 3.0Yemen -12.8 2.0 3.2 -0.2 -28.1 -4.0 5.0 4.0
Latin America and the CaribbeanArgentina 8.4 0.8 2.9 -2.6 2.4 -1.5 2.4 3.0Bahamas 0.6 2.2 0.0 -0.5 -1.7 2.0 2.2 2.2Barbados 0.8 0.3 -0.1 0.2 0.5 1.4 2.0 2.1Belize 2.1 3.8 1.5 3.9 1.9 2.0 2.7 2.6Bolivia (Plurinational State of) 5.2 5.1 6.8 5.5 4.8 4.6 4.1 4.0Brazil 3.9 1.8 2.7 0.1 -3.9 -3.2 0.6 1.6Chile 5.8 5.5 4.2 1.8 2.3 1.7 2.1 2.6Colombia 6.6 4.0 4.9 4.4 3.1 1.8 2.4 3.0Costa Rica 4.3 4.8 2.0 3.0 3.7 4.1 4.0 4.3Cuba 2.8 3.0 2.7 1.0 4.3 1.0 1.5 2.3Dominican Republic 2.8 2.6 4.8 7.3 7.0 6.8 4.8 4.2Ecuador 7.9 5.6 4.6 3.7 0.3 -2.1 0.5 1.8El Salvador 2.2 1.9 1.8 1.4 2.5 2.4 2.3 2.3Guatemala 4.2 3.0 3.7 4.2 4.1 3.6 3.7 3.7Guyana 5.4 4.8 5.2 3.8 3.1 3.9 3.5 3.9Haiti 4.8 3.2 3.9 2.3 1.6 1.2 2.0 2.4Honduras 3.8 4.1 2.8 3.1 3.6 3.8 4.1 3.8Jamaica 1.7 -0.6 0.5 0.7 1.0 1.5 1.7 2.0Mexico 3.9 4.0 1.4 2.2 2.5 1.9 2.4 2.7Nicaragua 4.7 5.7 4.8 4.6 4.9 4.2 4.3 4.0Panama 11.8 9.2 6.6 6.1 5.8 5.3 5.1 5.0Paraguay 4.3 -1.2 14.0 4.7 3.0 3.0 3.2 3.5Peru 6.5 6.0 5.8 2.4 3.3 3.8 4.1 4.3Trinidad and Tobago 0.0 1.4 1.7 1.9 0.0 -2.3 0.5 1.1Uruguay 5.2 3.3 5.1 3.2 1.0 0.4 1.3 1.8Venezuela, Bolivarian Republic of 4.2 5.6 1.3 -3.9 -5.7 -8.0 -3.7 0.3
Source: UN/DESA
a Estimate.b Forecasts, based in part on Project LINK.
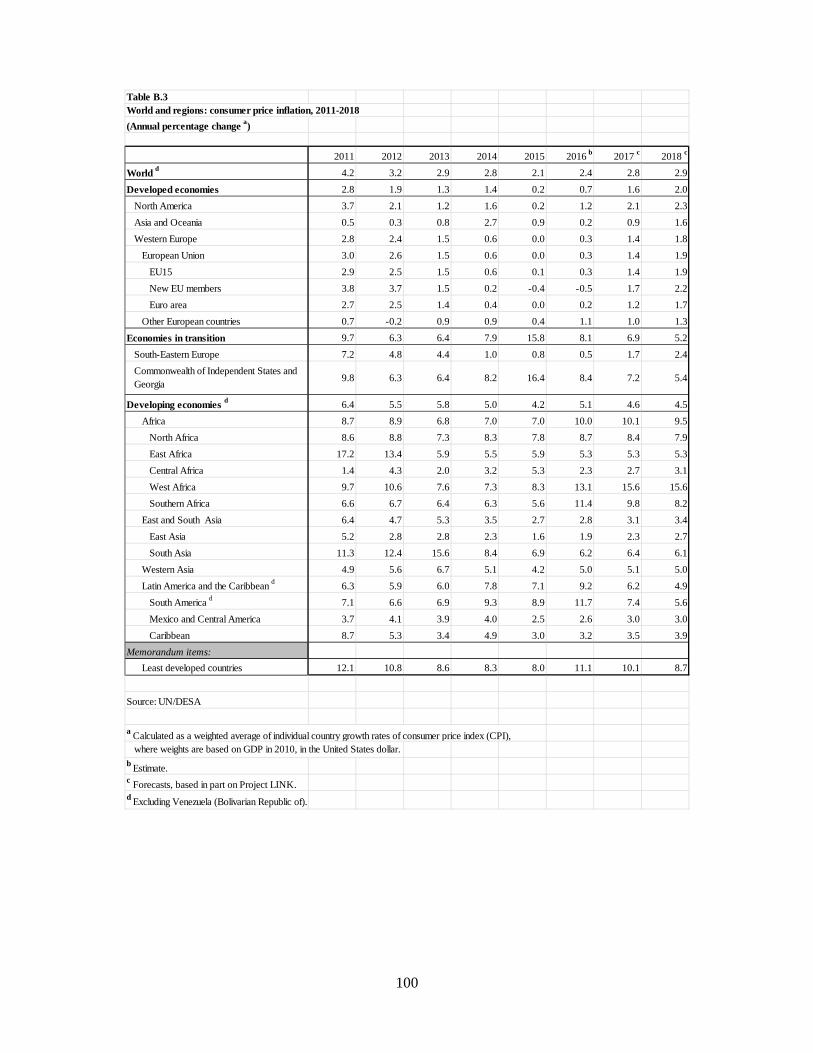
100
Table B.3World and regions: consumer price inflation, 2011-2018(Annual percentage change a)
2011 2012 2013 2014 2015 2016 b 2017 c 2018 c
World d 4.2 3.2 2.9 2.8 2.1 2.4 2.8 2.9
Developed economies 2.8 1.9 1.3 1.4 0.2 0.7 1.6 2.0North America 3.7 2.1 1.2 1.6 0.2 1.2 2.1 2.3Asia and Oceania 0.5 0.3 0.8 2.7 0.9 0.2 0.9 1.6Western Europe 2.8 2.4 1.5 0.6 0.0 0.3 1.4 1.8
European Union 3.0 2.6 1.5 0.6 0.0 0.3 1.4 1.9EU15 2.9 2.5 1.5 0.6 0.1 0.3 1.4 1.9New EU members 3.8 3.7 1.5 0.2 -0.4 -0.5 1.7 2.2Euro area 2.7 2.5 1.4 0.4 0.0 0.2 1.2 1.7
Other European countries 0.7 -0.2 0.9 0.9 0.4 1.1 1.0 1.3
Economies in transition 9.7 6.3 6.4 7.9 15.8 8.1 6.9 5.2South-Eastern Europe 7.2 4.8 4.4 1.0 0.8 0.5 1.7 2.4Commonwealth of Independent States and Georgia 9.8 6.3 6.4 8.2 16.4 8.4 7.2 5.4
Developing economies d 6.4 5.5 5.8 5.0 4.2 5.1 4.6 4.5Africa 8.7 8.9 6.8 7.0 7.0 10.0 10.1 9.5
North Africa 8.6 8.8 7.3 8.3 7.8 8.7 8.4 7.9East Africa 17.2 13.4 5.9 5.5 5.9 5.3 5.3 5.3Central Africa 1.4 4.3 2.0 3.2 5.3 2.3 2.7 3.1West Africa 9.7 10.6 7.6 7.3 8.3 13.1 15.6 15.6Southern Africa 6.6 6.7 6.4 6.3 5.6 11.4 9.8 8.2
East and South Asia 6.4 4.7 5.3 3.5 2.7 2.8 3.1 3.4East Asia 5.2 2.8 2.8 2.3 1.6 1.9 2.3 2.7South Asia 11.3 12.4 15.6 8.4 6.9 6.2 6.4 6.1
Western Asia 4.9 5.6 6.7 5.1 4.2 5.0 5.1 5.0Latin America and the Caribbean d 6.3 5.9 6.0 7.8 7.1 9.2 6.2 4.9
South America d 7.1 6.6 6.9 9.3 8.9 11.7 7.4 5.6Mexico and Central America 3.7 4.1 3.9 4.0 2.5 2.6 3.0 3.0Caribbean 8.7 5.3 3.4 4.9 3.0 3.2 3.5 3.9
Memorandum items:Least developed countries 12.1 10.8 8.6 8.3 8.0 11.1 10.1 8.7
Source: UN/DESA
a Calculated as a weighted average of individual country growth rates of consumer price index (CPI), where weights are based on GDP in 2010, in the United States dollar.
b Estimate.c Forecasts, based in part on Project LINK.d Excluding Venezuela (Bolivarian Republic of).
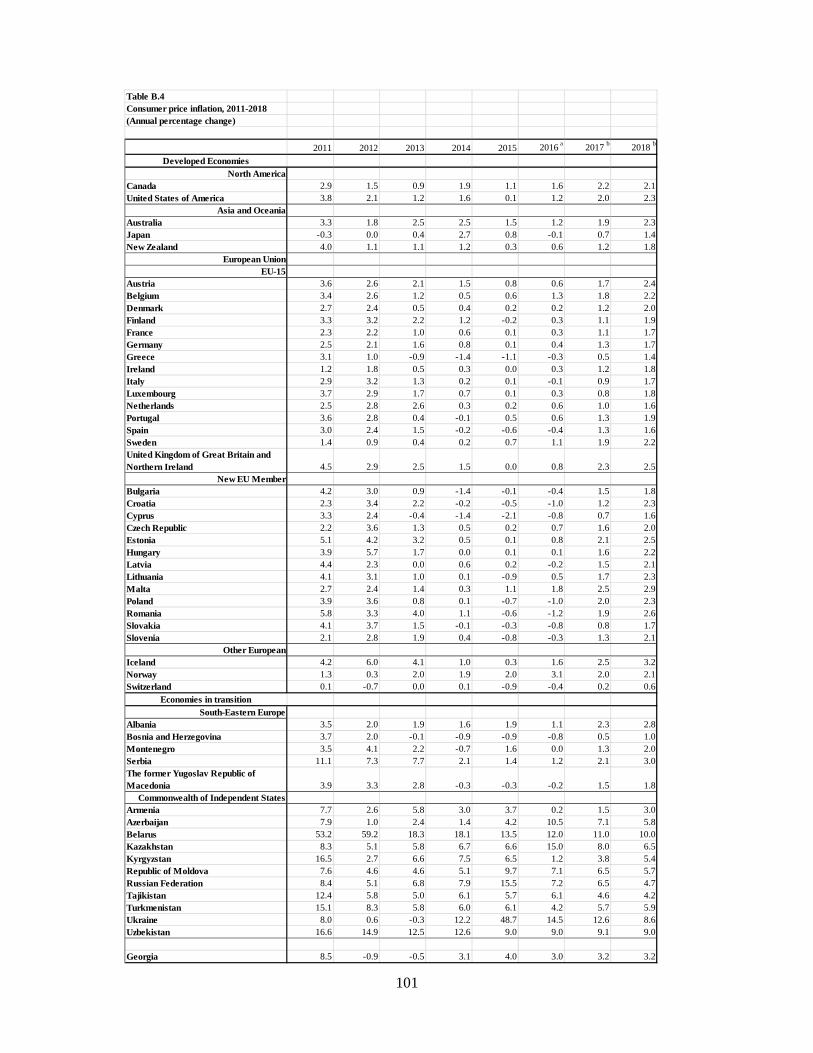
101
Table B.4Consumer price inflation, 2011-2018(Annual percentage change)
2011 2012 2013 2014 2015 2016 a 2017 b 2018 b
Developed EconomiesNorth America
Canada 2.9 1.5 0.9 1.9 1.1 1.6 2.2 2.1United States of America 3.8 2.1 1.2 1.6 0.1 1.2 2.0 2.3
Asia and OceaniaAustralia 3.3 1.8 2.5 2.5 1.5 1.2 1.9 2.3Japan -0.3 0.0 0.4 2.7 0.8 -0.1 0.7 1.4New Zealand 4.0 1.1 1.1 1.2 0.3 0.6 1.2 1.8
European UnionEU-15
Austria 3.6 2.6 2.1 1.5 0.8 0.6 1.7 2.4Belgium 3.4 2.6 1.2 0.5 0.6 1.3 1.8 2.2Denmark 2.7 2.4 0.5 0.4 0.2 0.2 1.2 2.0Finland 3.3 3.2 2.2 1.2 -0.2 0.3 1.1 1.9France 2.3 2.2 1.0 0.6 0.1 0.3 1.1 1.7Germany 2.5 2.1 1.6 0.8 0.1 0.4 1.3 1.7Greece 3.1 1.0 -0.9 -1.4 -1.1 -0.3 0.5 1.4Ireland 1.2 1.8 0.5 0.3 0.0 0.3 1.2 1.8Italy 2.9 3.2 1.3 0.2 0.1 -0.1 0.9 1.7Luxembourg 3.7 2.9 1.7 0.7 0.1 0.3 0.8 1.8Netherlands 2.5 2.8 2.6 0.3 0.2 0.6 1.0 1.6Portugal 3.6 2.8 0.4 -0.1 0.5 0.6 1.3 1.9Spain 3.0 2.4 1.5 -0.2 -0.6 -0.4 1.3 1.6Sweden 1.4 0.9 0.4 0.2 0.7 1.1 1.9 2.2United Kingdom of Great Britain and Northern Ireland 4.5 2.9 2.5 1.5 0.0 0.8 2.3 2.5
New EU MemberBulgaria 4.2 3.0 0.9 -1.4 -0.1 -0.4 1.5 1.8Croatia 2.3 3.4 2.2 -0.2 -0.5 -1.0 1.2 2.3Cyprus 3.3 2.4 -0.4 -1.4 -2.1 -0.8 0.7 1.6Czech Republic 2.2 3.6 1.3 0.5 0.2 0.7 1.6 2.0Estonia 5.1 4.2 3.2 0.5 0.1 0.8 2.1 2.5Hungary 3.9 5.7 1.7 0.0 0.1 0.1 1.6 2.2Latvia 4.4 2.3 0.0 0.6 0.2 -0.2 1.5 2.1Lithuania 4.1 3.1 1.0 0.1 -0.9 0.5 1.7 2.3Malta 2.7 2.4 1.4 0.3 1.1 1.8 2.5 2.9Poland 3.9 3.6 0.8 0.1 -0.7 -1.0 2.0 2.3Romania 5.8 3.3 4.0 1.1 -0.6 -1.2 1.9 2.6Slovakia 4.1 3.7 1.5 -0.1 -0.3 -0.8 0.8 1.7Slovenia 2.1 2.8 1.9 0.4 -0.8 -0.3 1.3 2.1
Other EuropeanIceland 4.2 6.0 4.1 1.0 0.3 1.6 2.5 3.2Norway 1.3 0.3 2.0 1.9 2.0 3.1 2.0 2.1Switzerland 0.1 -0.7 0.0 0.1 -0.9 -0.4 0.2 0.6
Economies in transitionSouth-Eastern Europe
Albania 3.5 2.0 1.9 1.6 1.9 1.1 2.3 2.8Bosnia and Herzegovina 3.7 2.0 -0.1 -0.9 -0.9 -0.8 0.5 1.0Montenegro 3.5 4.1 2.2 -0.7 1.6 0.0 1.3 2.0Serbia 11.1 7.3 7.7 2.1 1.4 1.2 2.1 3.0The former Yugoslav Republic of Macedonia 3.9 3.3 2.8 -0.3 -0.3 -0.2 1.5 1.8
Commonwealth of Independent StatesArmenia 7.7 2.6 5.8 3.0 3.7 0.2 1.5 3.0Azerbaijan 7.9 1.0 2.4 1.4 4.2 10.5 7.1 5.8Belarus 53.2 59.2 18.3 18.1 13.5 12.0 11.0 10.0Kazakhstan 8.3 5.1 5.8 6.7 6.6 15.0 8.0 6.5Kyrgyzstan 16.5 2.7 6.6 7.5 6.5 1.2 3.8 5.4Republic of Moldova 7.6 4.6 4.6 5.1 9.7 7.1 6.5 5.7Russian Federation 8.4 5.1 6.8 7.9 15.5 7.2 6.5 4.7Tajikistan 12.4 5.8 5.0 6.1 5.7 6.1 4.6 4.2Turkmenistan 15.1 8.3 5.8 6.0 6.1 4.2 5.7 5.9Ukraine 8.0 0.6 -0.3 12.2 48.7 14.5 12.6 8.6Uzbekistan 16.6 14.9 12.5 12.6 9.0 9.0 9.1 9.0
Georgia 8.5 -0.9 -0.5 3.1 4.0 3.0 3.2 3.2
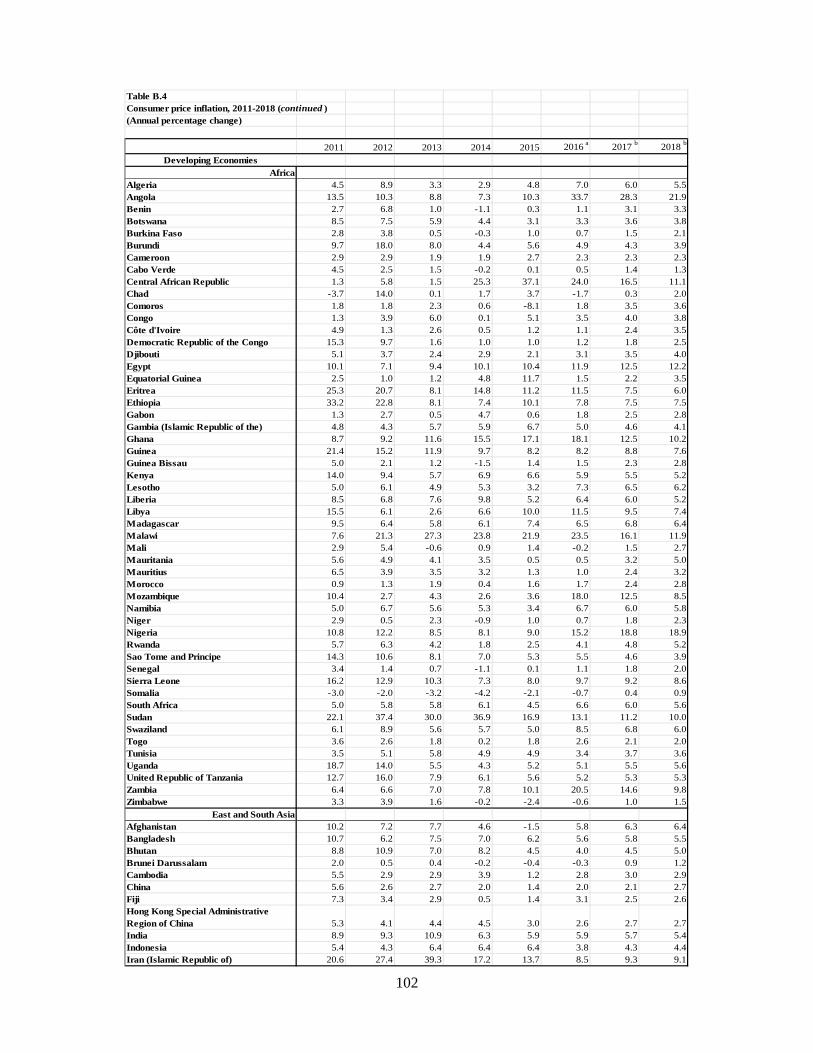
102
Table B.4Consumer price inflation, 2011-2018 (continued )(Annual percentage change)
2011 2012 2013 2014 2015 2016 a 2017 b 2018 b
Developing EconomiesAfrica
Algeria 4.5 8.9 3.3 2.9 4.8 7.0 6.0 5.5Angola 13.5 10.3 8.8 7.3 10.3 33.7 28.3 21.9Benin 2.7 6.8 1.0 -1.1 0.3 1.1 3.1 3.3Botswana 8.5 7.5 5.9 4.4 3.1 3.3 3.6 3.8Burkina Faso 2.8 3.8 0.5 -0.3 1.0 0.7 1.5 2.1Burundi 9.7 18.0 8.0 4.4 5.6 4.9 4.3 3.9Cameroon 2.9 2.9 1.9 1.9 2.7 2.3 2.3 2.3Cabo Verde 4.5 2.5 1.5 -0.2 0.1 0.5 1.4 1.3Central African Republic 1.3 5.8 1.5 25.3 37.1 24.0 16.5 11.1Chad -3.7 14.0 0.1 1.7 3.7 -1.7 0.3 2.0Comoros 1.8 1.8 2.3 0.6 -8.1 1.8 3.5 3.6Congo 1.3 3.9 6.0 0.1 5.1 3.5 4.0 3.8Côte d'Ivoire 4.9 1.3 2.6 0.5 1.2 1.1 2.4 3.5Democratic Republic of the Congo 15.3 9.7 1.6 1.0 1.0 1.2 1.8 2.5Djibouti 5.1 3.7 2.4 2.9 2.1 3.1 3.5 4.0Egypt 10.1 7.1 9.4 10.1 10.4 11.9 12.5 12.2Equatorial Guinea 2.5 1.0 1.2 4.8 11.7 1.5 2.2 3.5Eritrea 25.3 20.7 8.1 14.8 11.2 11.5 7.5 6.0Ethiopia 33.2 22.8 8.1 7.4 10.1 7.8 7.5 7.5Gabon 1.3 2.7 0.5 4.7 0.6 1.8 2.5 2.8Gambia (Islamic Republic of the) 4.8 4.3 5.7 5.9 6.7 5.0 4.6 4.1Ghana 8.7 9.2 11.6 15.5 17.1 18.1 12.5 10.2Guinea 21.4 15.2 11.9 9.7 8.2 8.2 8.8 7.6Guinea Bissau 5.0 2.1 1.2 -1.5 1.4 1.5 2.3 2.8Kenya 14.0 9.4 5.7 6.9 6.6 5.9 5.5 5.2Lesotho 5.0 6.1 4.9 5.3 3.2 7.3 6.5 6.2Liberia 8.5 6.8 7.6 9.8 5.2 6.4 6.0 5.2Libya 15.5 6.1 2.6 6.6 10.0 11.5 9.5 7.4Madagascar 9.5 6.4 5.8 6.1 7.4 6.5 6.8 6.4Malawi 7.6 21.3 27.3 23.8 21.9 23.5 16.1 11.9Mali 2.9 5.4 -0.6 0.9 1.4 -0.2 1.5 2.7Mauritania 5.6 4.9 4.1 3.5 0.5 0.5 3.2 5.0Mauritius 6.5 3.9 3.5 3.2 1.3 1.0 2.4 3.2Morocco 0.9 1.3 1.9 0.4 1.6 1.7 2.4 2.8Mozambique 10.4 2.7 4.3 2.6 3.6 18.0 12.5 8.5Namibia 5.0 6.7 5.6 5.3 3.4 6.7 6.0 5.8Niger 2.9 0.5 2.3 -0.9 1.0 0.7 1.8 2.3Nigeria 10.8 12.2 8.5 8.1 9.0 15.2 18.8 18.9Rwanda 5.7 6.3 4.2 1.8 2.5 4.1 4.8 5.2Sao Tome and Principe 14.3 10.6 8.1 7.0 5.3 5.5 4.6 3.9Senegal 3.4 1.4 0.7 -1.1 0.1 1.1 1.8 2.0Sierra Leone 16.2 12.9 10.3 7.3 8.0 9.7 9.2 8.6Somalia -3.0 -2.0 -3.2 -4.2 -2.1 -0.7 0.4 0.9South Africa 5.0 5.8 5.8 6.1 4.5 6.6 6.0 5.6Sudan 22.1 37.4 30.0 36.9 16.9 13.1 11.2 10.0Swaziland 6.1 8.9 5.6 5.7 5.0 8.5 6.8 6.0Togo 3.6 2.6 1.8 0.2 1.8 2.6 2.1 2.0Tunisia 3.5 5.1 5.8 4.9 4.9 3.4 3.7 3.6Uganda 18.7 14.0 5.5 4.3 5.2 5.1 5.5 5.6United Republic of Tanzania 12.7 16.0 7.9 6.1 5.6 5.2 5.3 5.3Zambia 6.4 6.6 7.0 7.8 10.1 20.5 14.6 9.8Zimbabwe 3.3 3.9 1.6 -0.2 -2.4 -0.6 1.0 1.5
East and South AsiaAfghanistan 10.2 7.2 7.7 4.6 -1.5 5.8 6.3 6.4Bangladesh 10.7 6.2 7.5 7.0 6.2 5.6 5.8 5.5Bhutan 8.8 10.9 7.0 8.2 4.5 4.0 4.5 5.0Brunei Darussalam 2.0 0.5 0.4 -0.2 -0.4 -0.3 0.9 1.2Cambodia 5.5 2.9 2.9 3.9 1.2 2.8 3.0 2.9China 5.6 2.6 2.7 2.0 1.4 2.0 2.1 2.7Fiji 7.3 3.4 2.9 0.5 1.4 3.1 2.5 2.6Hong Kong Special Administrative Region of China 5.3 4.1 4.4 4.5 3.0 2.6 2.7 2.7India 8.9 9.3 10.9 6.3 5.9 5.9 5.7 5.4Indonesia 5.4 4.3 6.4 6.4 6.4 3.8 4.3 4.4Iran (Islamic Republic of) 20.6 27.4 39.3 17.2 13.7 8.5 9.3 9.1
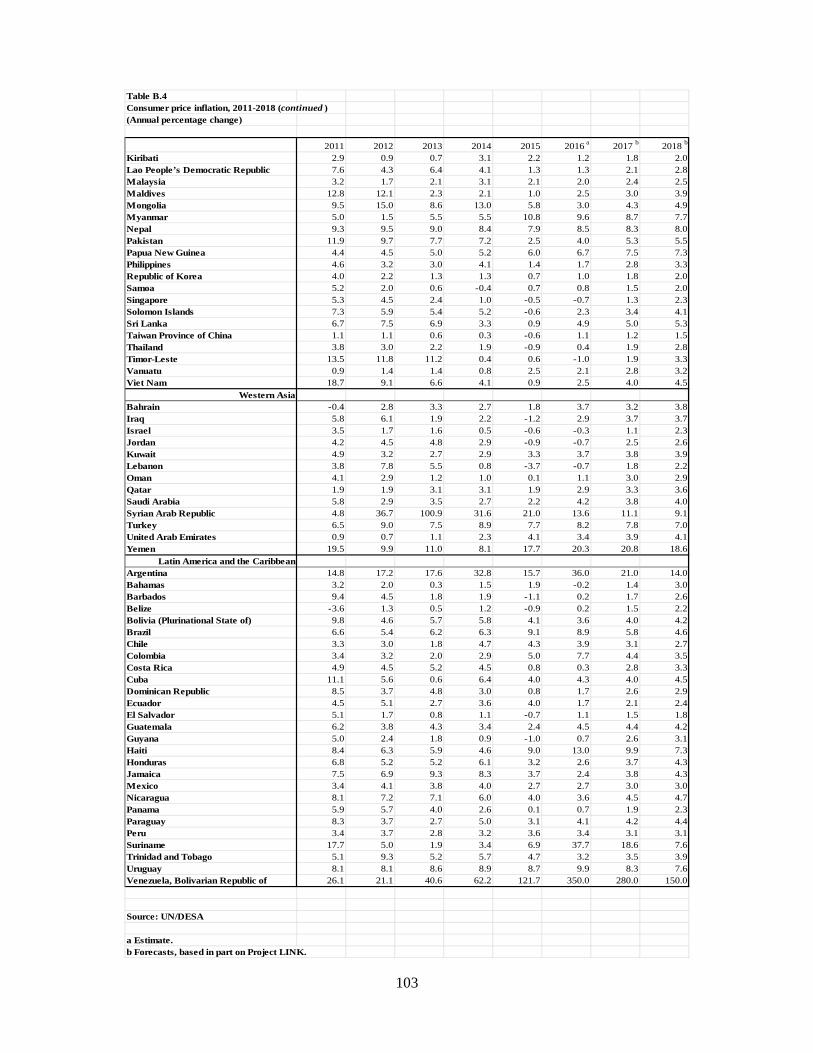
103
Table B.4Consumer price inflation, 2011-2018 (continued )(Annual percentage change)
2011 2012 2013 2014 2015 2016 a 2017 b 2018 b
Kiribati 2.9 0.9 0.7 3.1 2.2 1.2 1.8 2.0Lao People’s Democratic Republic 7.6 4.3 6.4 4.1 1.3 1.3 2.1 2.8Malaysia 3.2 1.7 2.1 3.1 2.1 2.0 2.4 2.5Maldives 12.8 12.1 2.3 2.1 1.0 2.5 3.0 3.9Mongolia 9.5 15.0 8.6 13.0 5.8 3.0 4.3 4.9Myanmar 5.0 1.5 5.5 5.5 10.8 9.6 8.7 7.7Nepal 9.3 9.5 9.0 8.4 7.9 8.5 8.3 8.0Pakistan 11.9 9.7 7.7 7.2 2.5 4.0 5.3 5.5Papua New Guinea 4.4 4.5 5.0 5.2 6.0 6.7 7.5 7.3Philippines 4.6 3.2 3.0 4.1 1.4 1.7 2.8 3.3Republic of Korea 4.0 2.2 1.3 1.3 0.7 1.0 1.8 2.0Samoa 5.2 2.0 0.6 -0.4 0.7 0.8 1.5 2.0Singapore 5.3 4.5 2.4 1.0 -0.5 -0.7 1.3 2.3Solomon Islands 7.3 5.9 5.4 5.2 -0.6 2.3 3.4 4.1Sri Lanka 6.7 7.5 6.9 3.3 0.9 4.9 5.0 5.3Taiwan Province of China 1.1 1.1 0.6 0.3 -0.6 1.1 1.2 1.5Thailand 3.8 3.0 2.2 1.9 -0.9 0.4 1.9 2.8Timor-Leste 13.5 11.8 11.2 0.4 0.6 -1.0 1.9 3.3Vanuatu 0.9 1.4 1.4 0.8 2.5 2.1 2.8 3.2Viet Nam 18.7 9.1 6.6 4.1 0.9 2.5 4.0 4.5
Western AsiaBahrain -0.4 2.8 3.3 2.7 1.8 3.7 3.2 3.8Iraq 5.8 6.1 1.9 2.2 -1.2 2.9 3.7 3.7Israel 3.5 1.7 1.6 0.5 -0.6 -0.3 1.1 2.3Jordan 4.2 4.5 4.8 2.9 -0.9 -0.7 2.5 2.6Kuwait 4.9 3.2 2.7 2.9 3.3 3.7 3.8 3.9Lebanon 3.8 7.8 5.5 0.8 -3.7 -0.7 1.8 2.2Oman 4.1 2.9 1.2 1.0 0.1 1.1 3.0 2.9Qatar 1.9 1.9 3.1 3.1 1.9 2.9 3.3 3.6Saudi Arabia 5.8 2.9 3.5 2.7 2.2 4.2 3.8 4.0Syrian Arab Republic 4.8 36.7 100.9 31.6 21.0 13.6 11.1 9.1Turkey 6.5 9.0 7.5 8.9 7.7 8.2 7.8 7.0United Arab Emirates 0.9 0.7 1.1 2.3 4.1 3.4 3.9 4.1Yemen 19.5 9.9 11.0 8.1 17.7 20.3 20.8 18.6
Latin America and the CaribbeanArgentina 14.8 17.2 17.6 32.8 15.7 36.0 21.0 14.0Bahamas 3.2 2.0 0.3 1.5 1.9 -0.2 1.4 3.0Barbados 9.4 4.5 1.8 1.9 -1.1 0.2 1.7 2.6Belize -3.6 1.3 0.5 1.2 -0.9 0.2 1.5 2.2Bolivia (Plurinational State of) 9.8 4.6 5.7 5.8 4.1 3.6 4.0 4.2Brazil 6.6 5.4 6.2 6.3 9.1 8.9 5.8 4.6Chile 3.3 3.0 1.8 4.7 4.3 3.9 3.1 2.7Colombia 3.4 3.2 2.0 2.9 5.0 7.7 4.4 3.5Costa Rica 4.9 4.5 5.2 4.5 0.8 0.3 2.8 3.3Cuba 11.1 5.6 0.6 6.4 4.0 4.3 4.0 4.5Dominican Republic 8.5 3.7 4.8 3.0 0.8 1.7 2.6 2.9Ecuador 4.5 5.1 2.7 3.6 4.0 1.7 2.1 2.4El Salvador 5.1 1.7 0.8 1.1 -0.7 1.1 1.5 1.8Guatemala 6.2 3.8 4.3 3.4 2.4 4.5 4.4 4.2Guyana 5.0 2.4 1.8 0.9 -1.0 0.7 2.6 3.1Haiti 8.4 6.3 5.9 4.6 9.0 13.0 9.9 7.3Honduras 6.8 5.2 5.2 6.1 3.2 2.6 3.7 4.3Jamaica 7.5 6.9 9.3 8.3 3.7 2.4 3.8 4.3Mexico 3.4 4.1 3.8 4.0 2.7 2.7 3.0 3.0Nicaragua 8.1 7.2 7.1 6.0 4.0 3.6 4.5 4.7Panama 5.9 5.7 4.0 2.6 0.1 0.7 1.9 2.3Paraguay 8.3 3.7 2.7 5.0 3.1 4.1 4.2 4.4Peru 3.4 3.7 2.8 3.2 3.6 3.4 3.1 3.1Suriname 17.7 5.0 1.9 3.4 6.9 37.7 18.6 7.6Trinidad and Tobago 5.1 9.3 5.2 5.7 4.7 3.2 3.5 3.9Uruguay 8.1 8.1 8.6 8.9 8.7 9.9 8.3 7.6Venezuela, Bolivarian Republic of 26.1 21.1 40.6 62.2 121.7 350.0 280.0 150.0
Source: UN/DESA
a Estimate.b Forecasts, based in part on Project LINK.

104
Table B.5World trade: growth in trade value of goods and non-factor services, by major country group, 2011-2018(Annual percentage change)
Region Flow 2011 2012 2013 2014 2015 2016 a 2017 b 2018 b
World Exports 18.2 1.5 2.7 1.8 -10.9 1.3 6.9 7.1Imports 18.4 1.1 2.4 1.7 -10.5 1.5 7.3 7.3
Developed economies Exports 15.5 -1.5 3.3 2.7 -10.0 2.2 5.6 6.2Imports 16.2 -1.9 1.6 2.5 -10.6 2.8 7.3 7.4
North America Exports 14.3 3.7 2.4 3.8 -6.4 0.2 7.6 9.4Imports 13.6 3.0 0.1 3.3 -4.5 0.4 10.6 10.9
Asia and Oceania Exports 11.6 -2.5 -6.8 1.0 -12.2 5.4 5.9 5.4Imports 23.1 5.4 -5.4 1.0 -17.1 -2.7 6.3 7.5
Europe Exports 16.5 -3.0 5.1 2.6 -11.0 2.5 4.9 5.1Imports 16.2 -5.1 3.5 2.5 -12.2 4.7 6.0 5.8
European Union Exports 16.0 -3.1 4.9 3.5 -10.9 2.7 4.9 5.0Imports 15.6 -5.2 3.2 3.2 -12.3 4.6 6.1 5.8
EU-15 Exports 15.5 -3.2 4.6 3.4 -10.8 2.3 4.6 4.8Imports 15.2 -5.2 3.0 3.0 -12.3 4.3 5.8 5.5
New EU Members Exports 19.6 -2.8 7.7 4.2 -11.2 5.6 6.8 7.0Imports 18.5 -4.7 4.5 4.2 -12.0 6.8 8.6 7.8
Euro area Exports 15.8 -3.3 5.1 3.5 -11.2 3.0 4.7 4.6Imports 15.9 -6.1 3.3 3.1 -13.0 4.4 6.3 5.9
Other Europe Exports 22.0 -1.4 6.9 -7.1 -12.6 0.3 5.7 6.6Imports 24.7 -3.9 7.9 -6.7 -10.5 5.9 4.8 5.8
Economies in transition Exports 31.0 2.8 -0.4 -5.4 -28.4 -6.7 14.1 12.2Imports 28.5 7.7 3.3 -9.0 -27.5 -6.9 10.1 9.2
South-Eastern Europe Exports 21.2 -6.4 16.3 4.6 -10.7 6.9 8.7 8.1Imports 20.0 -6.7 5.4 3.7 -13.5 6.9 7.2 7.8
Commonwealth of Independent States Exports 31.4 3.2 -1.0 -5.8 -29.2 -7.4 14.5 12.4Imports 29.2 8.8 3.2 -9.9 -28.5 -8.1 10.4 9.3
Developing countries Exports 20.9 5.2 2.2 1.3 -10.5 -0.7 7.3 8.0Imports 21.0 5.0 3.5 1.5 -9.1 1.9 8.0 7.0
Africa Exports 16.9 9.8 -12.2 -3.3 -23.8 -4.1 11.7 11.1Imports 16.3 3.6 0.6 2.3 -13.2 6.4 6.7 7.1
North Africa Exports -1.6 25.2 -16.8 -11.0 -21.5 -1.3 9.7 9.6Imports 4.0 14.2 -2.9 5.3 -11.7 13.1 5.8 6.9
East Africa Exports 16.6 6.0 6.2 6.8 -5.1 2.6 5.5 7.7Imports 19.4 6.7 6.4 7.9 -6.3 0.0 12.7 7.9
Central Africa Exports 25.5 -2.5 -2.6 -2.7 -33.6 -5.5 15.8 14.4Imports 16.2 8.6 -2.8 6.3 -13.8 -0.7 5.8 7.7
West Africa Exports 36.7 11.2 -24.9 7.6 -35.9 -8.1 18.3 15.6Imports 29.6 -15.3 9.9 0.4 -16.3 -4.9 4.0 6.1
Southern Africa Exports 22.8 -1.8 -1.6 -5.2 -19.2 -5.8 11.0 10.1Imports 21.7 3.6 -2.0 -2.3 -15.6 9.0 6.9 7.5
East and South Asia Exports 19.0 4.1 4.7 2.9 -6.2 -0.5 5.9 6.7Imports 22.0 4.6 3.3 1.3 -8.8 1.3 7.5 7.5
East Asia Exports 18.4 4.7 4.8 3.3 -5.3 -0.6 5.7 6.6Imports 21.8 4.6 4.4 1.7 -8.7 1.6 7.5 7.5
South Asia Exports 23.9 -0.6 4.7 -1.0 -14.1 1.0 7.8 7.8Imports 23.8 5.1 -4.2 -1.5 -8.8 -0.7 7.9 7.1
Western Asia Exports 35.4 10.5 1.1 -2.5 -22.3 -1.6 9.8 10.7Imports 20.2 7.2 5.1 2.0 -5.6 9.1 13.7 5.6
Latin America and the Caribbean Exports 17.8 1.7 0.2 0.9 -11.3 0.7 10.5 10.5Imports 19.9 5.6 4.9 1.7 -11.3 -4.2 5.2 6.1
South America Exports 17.9 -0.8 -2.0 -1.2 -16.6 3.1 12.8 13.1Imports 21.3 6.1 7.0 0.2 -17.2 -9.6 4.2 5.8
Mexico and Central America Exports 17.4 6.0 3.9 4.0 -3.7 -2.2 8.0 7.4Imports 17.8 5.5 2.5 4.1 -2.3 1.5 5.3 5.4
Caribbean Exports 18.9 1.7 0.6 2.9 -8.8 -0.6 5.3 6.6Imports 20.7 0.6 -1.1 2.8 -10.4 6.7 13.9 13.9
Least developed countries Exports 26.6 4.2 4.5 -0.9 -15.2 -2.4 11.0 11.3Imports 20.4 8.4 5.4 4.2 -8.5 4.4 9.3 8.2
Source: UN/DESA
a Estimate.b Forecast, based in part on Project LINK.
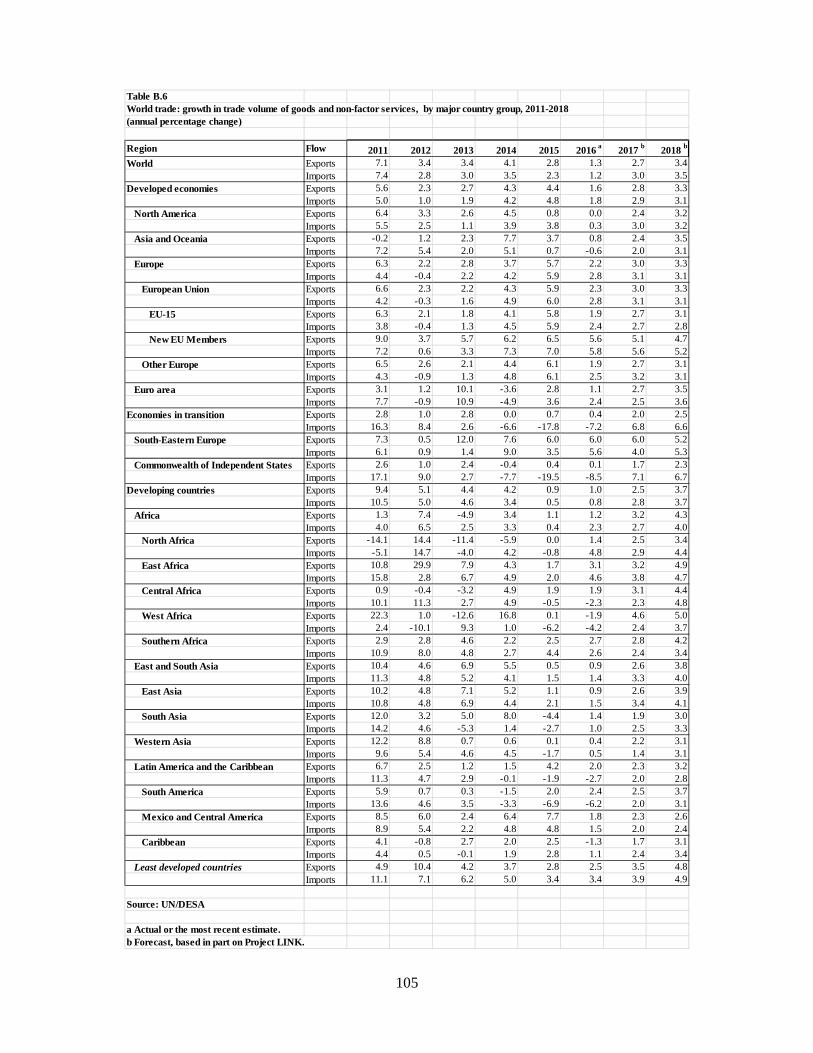
105
Table B.6World trade: growth in trade volume of goods and non-factor services, by major country group, 2011-2018(annual percentage change)
Region Flow 2011 2012 2013 2014 2015 2016 a 2017 b 2018 b
World Exports 7.1 3.4 3.4 4.1 2.8 1.3 2.7 3.4Imports 7.4 2.8 3.0 3.5 2.3 1.2 3.0 3.5
Developed economies Exports 5.6 2.3 2.7 4.3 4.4 1.6 2.8 3.3Imports 5.0 1.0 1.9 4.2 4.8 1.8 2.9 3.1
North America Exports 6.4 3.3 2.6 4.5 0.8 0.0 2.4 3.2Imports 5.5 2.5 1.1 3.9 3.8 0.3 3.0 3.2
Asia and Oceania Exports -0.2 1.2 2.3 7.7 3.7 0.8 2.4 3.5Imports 7.2 5.4 2.0 5.1 0.7 -0.6 2.0 3.1
Europe Exports 6.3 2.2 2.8 3.7 5.7 2.2 3.0 3.3Imports 4.4 -0.4 2.2 4.2 5.9 2.8 3.1 3.1
European Union Exports 6.6 2.3 2.2 4.3 5.9 2.3 3.0 3.3Imports 4.2 -0.3 1.6 4.9 6.0 2.8 3.1 3.1
EU-15 Exports 6.3 2.1 1.8 4.1 5.8 1.9 2.7 3.1Imports 3.8 -0.4 1.3 4.5 5.9 2.4 2.7 2.8
New EU Members Exports 9.0 3.7 5.7 6.2 6.5 5.6 5.1 4.7Imports 7.2 0.6 3.3 7.3 7.0 5.8 5.6 5.2
Other Europe Exports 6.5 2.6 2.1 4.4 6.1 1.9 2.7 3.1Imports 4.3 -0.9 1.3 4.8 6.1 2.5 3.2 3.1
Euro area Exports 3.1 1.2 10.1 -3.6 2.8 1.1 2.7 3.5Imports 7.7 -0.9 10.9 -4.9 3.6 2.4 2.5 3.6
Economies in transition Exports 2.8 1.0 2.8 0.0 0.7 0.4 2.0 2.5Imports 16.3 8.4 2.6 -6.6 -17.8 -7.2 6.8 6.6
South-Eastern Europe Exports 7.3 0.5 12.0 7.6 6.0 6.0 6.0 5.2Imports 6.1 0.9 1.4 9.0 3.5 5.6 4.0 5.3
Commonwealth of Independent States Exports 2.6 1.0 2.4 -0.4 0.4 0.1 1.7 2.3Imports 17.1 9.0 2.7 -7.7 -19.5 -8.5 7.1 6.7
Developing countries Exports 9.4 5.1 4.4 4.2 0.9 1.0 2.5 3.7Imports 10.5 5.0 4.6 3.4 0.5 0.8 2.8 3.7
Africa Exports 1.3 7.4 -4.9 3.4 1.1 1.2 3.2 4.3Imports 4.0 6.5 2.5 3.3 0.4 2.3 2.7 4.0
North Africa Exports -14.1 14.4 -11.4 -5.9 0.0 1.4 2.5 3.4Imports -5.1 14.7 -4.0 4.2 -0.8 4.8 2.9 4.4
East Africa Exports 10.8 29.9 7.9 4.3 1.7 3.1 3.2 4.9Imports 15.8 2.8 6.7 4.9 2.0 4.6 3.8 4.7
Central Africa Exports 0.9 -0.4 -3.2 4.9 1.9 1.9 3.1 4.4Imports 10.1 11.3 2.7 4.9 -0.5 -2.3 2.3 4.8
West Africa Exports 22.3 1.0 -12.6 16.8 0.1 -1.9 4.6 5.0Imports 2.4 -10.1 9.3 1.0 -6.2 -4.2 2.4 3.7
Southern Africa Exports 2.9 2.8 4.6 2.2 2.5 2.7 2.8 4.2Imports 10.9 8.0 4.8 2.7 4.4 2.6 2.4 3.4
East and South Asia Exports 10.4 4.6 6.9 5.5 0.5 0.9 2.6 3.8Imports 11.3 4.8 5.2 4.1 1.5 1.4 3.3 4.0
East Asia Exports 10.2 4.8 7.1 5.2 1.1 0.9 2.6 3.9Imports 10.8 4.8 6.9 4.4 2.1 1.5 3.4 4.1
South Asia Exports 12.0 3.2 5.0 8.0 -4.4 1.4 1.9 3.0Imports 14.2 4.6 -5.3 1.4 -2.7 1.0 2.5 3.3
Western Asia Exports 12.2 8.8 0.7 0.6 0.1 0.4 2.2 3.1Imports 9.6 5.4 4.6 4.5 -1.7 0.5 1.4 3.1
Latin America and the Caribbean Exports 6.7 2.5 1.2 1.5 4.2 2.0 2.3 3.2Imports 11.3 4.7 2.9 -0.1 -1.9 -2.7 2.0 2.8
South America Exports 5.9 0.7 0.3 -1.5 2.0 2.4 2.5 3.7Imports 13.6 4.6 3.5 -3.3 -6.9 -6.2 2.0 3.1
Mexico and Central America Exports 8.5 6.0 2.4 6.4 7.7 1.8 2.3 2.6Imports 8.9 5.4 2.2 4.8 4.8 1.5 2.0 2.4
Caribbean Exports 4.1 -0.8 2.7 2.0 2.5 -1.3 1.7 3.1Imports 4.4 0.5 -0.1 1.9 2.8 1.1 2.4 3.4
Least developed countries Exports 4.9 10.4 4.2 3.7 2.8 2.5 3.5 4.8Imports 11.1 7.1 6.2 5.0 3.4 3.4 3.9 4.9
Source: UN/DESA
a Actual or the most recent estimate.b Forecast, based in part on Project LINK.