Underwriter reputation and the decision to go public - AABRIaabri.com/manuscripts/10710.pdf ·...
20
Journal of Finance and Accountancy Underwriter reputation, Page 1 Underwriter reputation and the decision to go public Cheulho Lee Florida Memorial University ABSTRACT The existing literature on the role of underwriters has concentrated on underwriter certification, monitoring and marketing. However, these studies have apparently ignored the market timing role often ascribed to underwriters by practitioners. This study examines whether IPO timing is a function of the reputation of underwriters who have expertise in the financial market. In their advisory role, underwriters advise their client firms on offer timing, in addition to pricing decisions and, ultimately, distributing the shares to investors. Unlike auditors, lawyers and engineers, who are responsible only for specific elements of registration statements, underwriters are responsible for the timing decision, relying on information from all parties to the offering, knowledge of the issuer's industry performance, and expertise gained in continuous market participation. The more reputable underwriters have a comparative advantage in analyzing financial markets, because of scale economies in information acquisition and in search, than their less reputable counterparts. The more reputable underwriters are able to search more efficiently because of superior expertise in the new issue market gained from extensive experience, and because of a more extensive customer base. Because of the benefits from successful timing and the costs of poor timing advice, underwriters' reputation and, thus, value will depend in part on how well they time IPOs. This paper provides empirical evidence that the more reputable underwriters possess a greater proficiency than their lesser known counterparts, in taking companies public when the market valuation of comparable stocks in the same industry is high. Key Words: Underwriter reputation, go public
Transcript of Underwriter reputation and the decision to go public - AABRIaabri.com/manuscripts/10710.pdf ·...

Journal of Finance and Accountancy
Underwriter reputation, Page 1
Underwriter reputation and the decision to go public
Cheulho Lee Florida Memorial University
ABSTRACT
The existing literature on the role of underwriters has concentrated on underwriter certification, monitoring and marketing. However, these studies have apparently ignored the market timing role often ascribed to underwriters by practitioners. This study examines whether IPO timing is a function of the reputation of underwriters who have expertise in the financial market. In their advisory role, underwriters advise their client firms on offer timing, in addition to pricing decisions and, ultimately, distributing the shares to investors. Unlike auditors, lawyers and engineers, who are responsible only for specific elements of registration statements, underwriters are responsible for the timing decision, relying on information from all parties to the offering, knowledge of the issuer's industry performance, and expertise gained in continuous market participation.
The more reputable underwriters have a comparative advantage in analyzing financial markets, because of scale economies in information acquisition and in search, than their less reputable counterparts. The more reputable underwriters are able to search more efficiently because of superior expertise in the new issue market gained from extensive experience, and because of a more extensive customer base. Because of the benefits from successful timing and the costs of poor timing advice, underwriters' reputation and, thus, value will depend in part on how well they time IPOs. This paper provides empirical evidence that the more reputable underwriters possess a greater proficiency than their lesser known counterparts, in taking companies public when the market valuation of comparable stocks in the same industry is high.
Key Words: Underwriter reputation, go public
Journal of Finance and Accountancy
Underwriter reputation, Page 2
INTRODUCTION
The existing literature on the role of underwriters has concentrated on underwriter
certification [Booth and Smith (1986)], monitoring [Easterbrook (1984) and Hansen and Torregrosa (1992)] and marketing [Kraus and Stoll (1972) and Merton (1987)]. Booth and Smith (1986) develop a model based upon the assumption of asymmetric information between insiders who are shareholders and outsiders who are prospective subscribers to new issues. They suggest that issuing firms may be viewed as effectively “leasing” the brand name of an underwriter to certify that the issue price reflects available inside information. Consistent with this, Carter and Manaster (1990) show that the issuer’s choice of underwriter reputation is inversely related to short-run underpricing of IPOs. The argument that underwriters certify the fairness of offer price is based upon the certification hypothesis. This theory derives from the literature on the use of reputational capital to guarantee product quality. According to this hypothesis, the third party with reputational capital such as underwriters, lawyers, auditors, and venture capitalists certifies the quality of offering firms in the world of information asymmetry, Generally, the current literature concludes that underwriters, auditors, lawyers and venture capitalists certify the fairness of offer price individually or collectively. Easterbrook (1984) and Hansen and Torregrosa (1992) propose that there is a monitoring role for the underwriter. They argue that firms may use underwriters to obtain monitoring of the firm. They suggest that lead underwriter monitoring improves corporate performance and reduces agency costs, thereby raising the company’s intrinsic value. The lead underwriter obtains reputational capital for effective monitoring. Top managers demand this lead underwriter monitoring because it adds value. The behavior of their demand reflects that lead underwriter monitoring substitutes for other monitoring and that managers would like to avoid monitoring out of self-interest.
Prior studies also suggest that underwriters provide marketing services for capital-raising companies. Marketing services include searching the primary market, compensating buyers for their costs of providing funds and persuading investors to buy new securities [Kraus and Stoll (1972) and Hansen and Pinkerton (1982)]. Merton (1987) also suggests that if the firm undertakes an underwriting through an underwriter with broad distribution capabilities, then the firm can use the underwriting to both raise new capital and increase its investor base. If the underwriter succeeds in inducing new investors to purchase and follow the firm’s stock, then the benefits to the issuing firm can exceed simply the placement of the new securities. For example, this may lower the firm’s cost of capital.
Even though the existing literature provides valuable insight into the role of underwriters by suggesting that underwriters provide certification, monitoring and marketing services for capital-raising companies. However, these studies have apparently ignored the market timing role often ascribed to underwriters by practitioners. One example of this timing proposition is provided by Arkebauer (1991) who has been involved with taking companies public for over 20 years:
The timing of an IPO should be well calculated. All too often a company is in position to go public, but for any number of reasons market conditions may not be receptive at that particular time. Proceeding with it as planned could easily jeopardize a good IPO. Every market analyst and expert alive will tell you that even if your company is chafing at the bit to go public, if the market isn’t gungho

Journal of Finance and Accountancy
Underwriter reputation, Page 3
at the time, wait! Market makers, analysts, and economist have learned from hard experience over the last couple of decades that the market has been prone to take sudden reversals and leave underwriters and companies high and dry. So it’s worth playing is safe, and let the conditions of the time dictate whether or not you should proceed with your offering. It may seem that we protest too much. But by doing so, we may help you, the entrepreneur, keep intact your dream of going public and subsequently making those marketplace millions. It’s important to remember the old adage, “There’s a time and place for everything.” So it goes with an IPO. When the timing is right, the company should also be prepared to jump in as soon as the situation changes from bad times to good times and the IPO market starts to take off. The underwriter must be ready to put the IPO out quickly to take advantage of a booming market, as the value of an IPO stock may shoot up dramatically.-------A company’s successful entry in the market depends on many uncontrollable factors.-------It also depends on whether the company is engaged in a hot industry, one that’s in favor at the moment.-------The goal is to have every thing ready, when the magic words are spoken and the market windows open. For most major business decisions, timing is critical. For an IPO, however, the timing is absolutely crucial to its success or failure, and that’s a fact! (pp.25-pp.32)
This study examines whether IPO timing is a function of the reputation of underwriters who have expertise in the financial market. In their advisory role, underwriters advise their client firms on offer timing, in addition to pricing decisions and, ultimately, distributing the shares to investors. Unlike auditors, lawyers and engineers, who are responsible only for specific elements of registration statements, underwriters are responsible for the timing decision, relying on information from all parties to the offering, knowledge of the issuer's industry performance, and expertise gained in continuous market participation. Underwriters spend significant resources analyzing individual stocks, industries and overall markets.
The more reputable underwriters have a comparative advantage in analyzing financial markets, because of scale economies in information acquisition and in search, than their less reputable counterparts. The more reputable underwriters are able to search more efficiently because of superior expertise in the new issue market gained from extensive experience, and because of a more extensive customer base. Because of the benefits from successful timing and the costs of poor timing advice, underwriters' reputation and, thus, value will depend in part on how well they time IPOs. To address underwriters' role, it is examined whether the more reputable underwriters possess a greater proficiency in timing IPOs. This study employs proxies for underwriter reputation developed in the literature and new reasonable alternative proxies.
SAMPLE AND MEASUREMENT
Sample
The sample consists of IPO firms that went public between 1980 and 1991. These companies are found through the semiannual editions of the Investment Dealer's Digest: Corporate Financing Directory. The offering date is identified from the same source. The filing date is obtained from weekly editions of the Investment Dealer's Digest. The Standard Industrial

Journal of Finance and Accountancy
Underwriter reputation, Page 4
Classification (SIC) codes for both IPO and seasoned firms, and other information about seasoned firms, are retrieved from the Center for Research in Security Prices (CRSP) files. To be included in the IPO Sample, the following criteria are used:
(1) The offering is made through a firm commitment underwriting arrangement. Regulation A offerings and unit offerings are excluded (2) IPOs of financial institutions (SIC code 600-699) are excluded; also, foreign companies and American Depository Receipts (ADRs) are omitted. IPO firms are listed in the New York Stock Exchange (NYSE), the American Stock Exchange (AMEX), or the National Association of Securities Dealers Automated Quotation System (NASDAQ).
The resulting sample contains 2,154 IPOs which are drawn from 247 different (three digit SIC code) industries.
Underwriter Classification
Measuring the timing abilities of underwriters requires a measurable proxy for timing
ability. Assuming that higher reputation is associated with superior timing ability, this study focuses on possible proxies for underwriter reputation. Reputation does not readily lend itself to unambiguous calibration. As a proxy for an underwriter's reputation, this study initially utilizes the number of offerings underwritten by each underwriter. Arguably, the number of deals made in the IPO market by an underwriter is a reflection of that underwriter's reputation for proficiency in bringing firms to the market. Later, two other proxy variables will be considered for underwriter reputation.
The IPO sample is first divided into two sub-periods, 1980-1985 and 1986-1991. Then, underwriters are ranked within each sub-period by the number of offerings they brought to the market. Partitioning of the sample period is carried out because the reputation of a underwriter may change over time. If an IPO has more than one lead underwriter, the first underwriter listed in the Investment Dealer's Digest is given full credit for the issue. Within each period, the underwriters are further partitioned into two subgroups at the median of the distribution of the number of offerings.
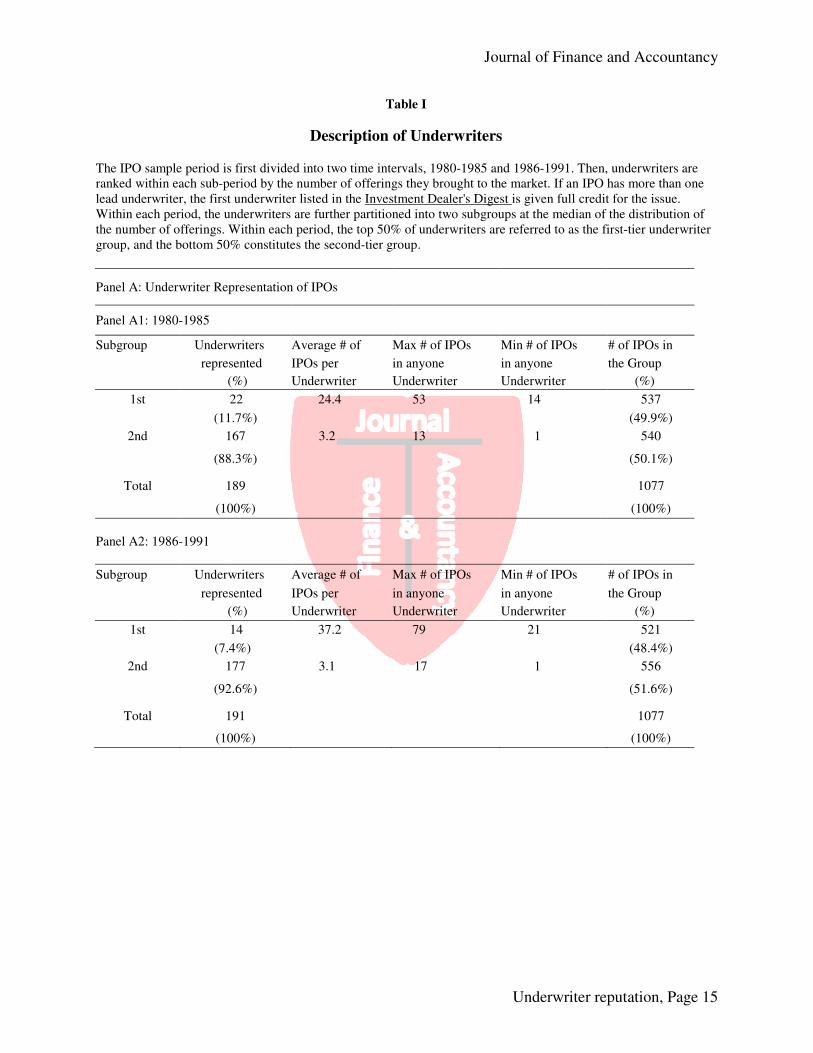
Because it is difficult to discern precisely the difference in prestige among underwriters, especially among the less prestigious underwriters, this two-tier system is employed. Within each period, the top 50% of underwriters are referred to as the first-tier underwriter group, and the bottom 50%, as the second-tier underwriter group. Panels A1 and A2 of the Table I provide the number of underwriters represented in each subgroup for each period and other descriptive statistics. It is shown that there is a high concentration in the IPO market. For the period 1980-1985, out of 189 different underwriters, only 22 underwriters (11.7%) brought forth about 50 % of the sample of IPO offerings. For the period 1986-1991, out of 191 different underwriters, only 14 underwriters (7.4%) captured about half the sample.
Panels Bl and B2 of the Table I provide the names of underwriters that belong to the first-tier underwriter group for each period in the sample. The top three underwriters are L.F. Rothschild, D.H. Blair and Prudential Bache during 1980-1985, and Alex Brown & Sons, Goldman Sachs & Co and Merrill Lynch during 1986-1991.

Journal of Finance and Accountancy
Underwriter reputation, Page 5
The excess return on the size-and-industry-matched index
IPO timing is measured by relying on the performance of an index composed of publicly owned companies engaged in the same or similar business. It is very difficult to determine the market value of firms before their IPO, because they do not have a market price. In addition, some IPO firms have little or no operating history. One way to determine the market value of the IPO firms is to compare their operational and financial performance with that of publicly owned companies in the same or similar industry. Thus, the timing decision of IPO firms is likely to be governed by the current market valuation of comparable firms in the same industry. Consistent with this argument, Lee (2010) shows that IPO firms are, on average, more likely to go public when the market valuation of comparable stocks in the same industry is at its peak.
This study examines the performance of the size-and-industry-matched index around IPOs to assess whether the more reputable underwriters possess a greater proficiency in timing of IPOs than their less reputable counterparts. The size-and-industry-matched index is composed of seasoned firms in the same industry which are close in terms of market capitalization. More precisely, in order to be included in the same industry, firms must be in the same three-digit SIC code as IPO firms that are listed on the NASDAQ for at least three years prior to the filing date of an IPO. This avoids including young IPOs in the industry indices. In addition, CRSP provides a year-end market capitalization for each issue in every year. The size-and-industry matched index comprises seasoned firms in the same three-digit SIC code, with sizes lying within a range five times larger than, and one fifth as large as, an IPO firm, in the offering year (20% * the size of an IPO firm - 500% * the size of an IPO firm).
This study utilizes excess returns which are raw returns adjusted for the NASDAQ market returns. These excess returns reflect the performance of stocks in the same industry relative to the market as a whole. To compute the excess return on the size-and-industry-matched index, the following procedure is employed:
(1) For each IPO, the return on the value-weighted NASDAQ market return is subtracted from the raw return on the size-and-industry-matched index. Each IPO has a corresponding portfolio return over the period (a to b)
(2) Then the cross-sectional average of excess returns across all IPOs is computed over the period (a to b)
this study employs the geometrically compounded (buy-and-hold) return, because Roll
(1983), Blume and Stambaugh (1983), and Conrad and Kaul (1993) show that there is a statistical bias due to measurement errors in accumulated single-period returns over long-event periods. For market returns, the value weighted NASDAQ market index is utilized in this study. Canina et al. (1995) suggest that using an equally-weighted market index may impart upward bias to a benchmark index due to the auto-correlation of the portfolio and individual securities, the bid-ask bounce effect, and the level of stock price. Without this kind of rebalancing bias, it might be more appropriate to use the equally-weighted NASDAQ market index, since the value--weighted NASDAQ index does not account for the return of the small cap stocks.
In what follows, Period 0 represents the time period between the filing date and the offering date. This period, often referred to as the waiting period or cooling period, is particularly important to the investigation of the issue of timing since the formal decision to go public occurs through registration with the Securities and Exchange Commission (SEC) and actual entry in the market occurs at the offering date. During the waiting period, underwriters' pre-selling activity
Journal of Finance and Accountancy
Underwriter reputation, Page 6
takes place. Pre-filing months are defined relative to the filing date, and post-offering months are defined relative to the offering date, where months are defined as successive 21-trading-day periods. For example, month -1 refers to 21-trading-days before the filing date and month +1 refers to 21 trading-days after the offering date. Thus, the period (-1, 0) refers to the period starting 2I-trading-days and concluding one-trading-day, before the filing date. Again, the period (0, + 1) represents the period beginning one-trading-day and ending 2I-trading-days after the offering date. Time Horizon
In order to assess the timing abilities of underwriters, it is necessary to define a time interval over which timing patterns are compared. Because a firm may be forced to go public when it needs funds rather than at some favorable time, differences in timing patterns may reflect differences in the timing of capital needs of firms, rather than differences in market timing ability. However, even if a firm is constrained by the time period in which it must raise funds, over shorter periods of time, it may have some timing flexibility. Besides, underwriters, in general, may only be capable of forecasting market conditions over a short horizon. Thus, to compare the timing performance of underwriters, it might be more appropriate to consider a short-term period over which underwriters can exercise timing flexibility. This study will investigate the timing patterns of underwriters up to one year before the filing date and one year after the offering date, with a particular emphasis on the waiting period.
It can be argued that an IPO is timed well if the market valuation of industry stocks appreciates before the filing date, since the increase in price during this period may capture the gain from delaying the decision to enter the market until the f1ling date. However, differential timing patterns over this period may not necessarily translate into the evidence of differential timing abilities. Since changes in industry conditions before the filing date can be observed on the filing date, any difference in timing patterns during this period may not be attributed to differing timing abilities. Rather, any difference in timing patterns may be ascribed to the fact that different firms need capital at different times. It can also be argued that IPO firms may simply tend to go public after unusually good periods of industry performance. Such practice is consistent with the evidence documented above. However, these simple decision rules make no prediction about performance during the waiting period. Thus, performance in the pre-filing period may not be a good indicator of timing ability.
It is propounded that the best basis for judging the relative timing performance of underwriters is the time period over which a forecast has to be made. Therefore, market conditions during the waiting period are particularly important in comparing the timing. ability of underwriters, since a forecast has to be made on the filing date, of what market conditions are likely to be over the waiting period. An IPO cannot be brought to the market instantaneously at all times, even if timing is propitious. There is a lag between the decision to enter the market and the time of actual entry. Once the decision to enter the market is made, the firm must register with the SEC, and wait for its approval. During this waiting period, pre-selling of the issue by the underwriter takes place. Changes in conditions of industry stocks during this period must be predicted and considered at the time of filing.
If there is a deterioration in market conditions after the filing date and before the offering date, an IPO firm has two choices: sell the issue at the lower price or cancel the issue and enter the market later. In canceling the issue, the firm has to weigh the price decline against the cost of

Journal of Finance and Accountancy
Underwriter reputation, Page 7
a subsequent registration and the loss of investment opportunities. Since the sample is composed of successful offerings, a deterioration in market conditions would imply firms' acceptance of a price decline, as opposed to cancellation of the issue. Thus, it is suggested that an IPO is timed well if the market valuation of industry stocks appreciates during the waiting period.
The relative timing performance of IPOs underwritten by different underwriters is studied using the excess return on the size-and-industry-matched index. Two tests are employed to assess the relative timing proficiency of different groups of underwriters: (1) the t-test of differences in average excess returns. (2) the sign test of differences in positive excess returns. Arguably, the sign test may be more appropriate because the results of the t-test could be influenced by a few large outliers in the excess returns. Furthermore, underwriters may possess the skill to forecast the direction of market movements but not the magnitude. Later, a regression analysis is also performed when the robustness of the findings is examined. The value-weighted market index is employed as the market index. EMPIRICAL FINDINGS
Timing Pattern Surrounding the Waiting Period
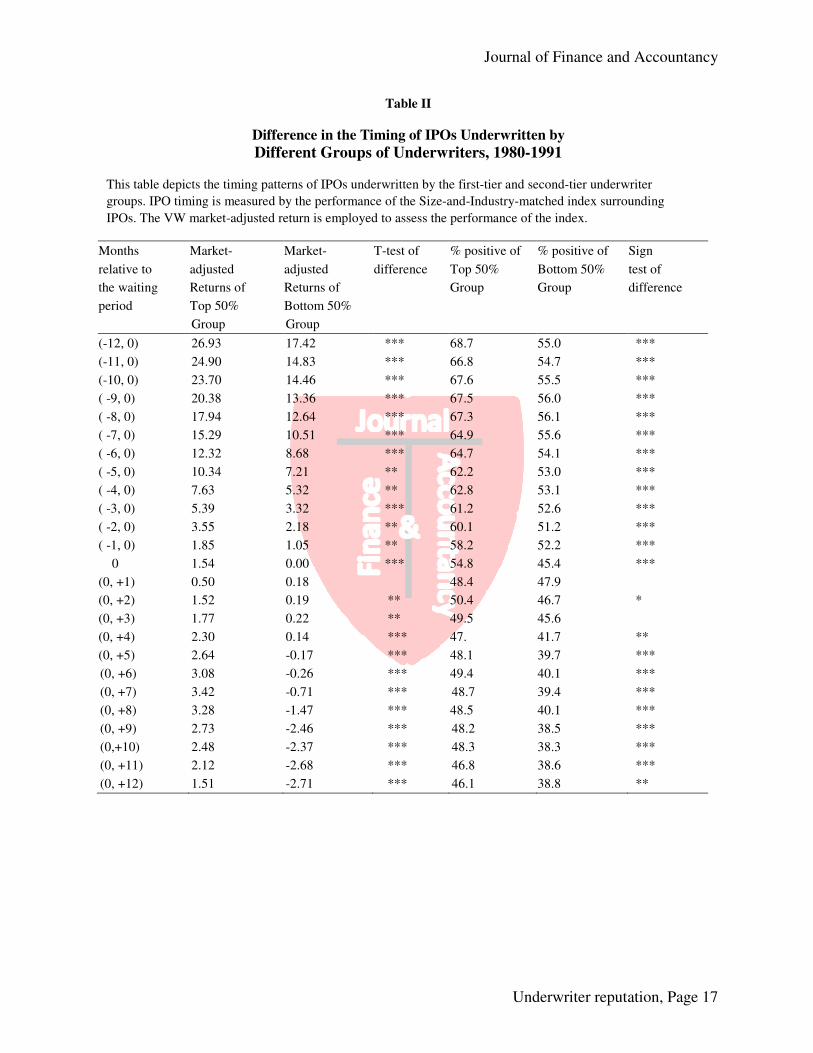
Table II reports the timing patterns of IPOs underwritten by the first-tier and second-tier underwriter groups. For the first-tier group, the one-year average market-adjusted return before the filing date is 26.93%. For the second-tier group, the average market-adjusted return for the same period is 17.42%. The difference in average market-adjusted returns is significant (at the 1 % level). The fraction of positive market adjusted returns for the same interval is 68.7 % for the first-tier group and 55.0% for the second-tier group. The difference in the fraction of positive market-adjusted returns is significant (at the 1 % level). As the interval shortens, the difference in average market adjusted returns and in the fraction of positive excess returns is still significant. For the first-tier group, the one-month average market-adjusted return before the filing date is 1.85%. For the second group, the average market-adjusted return for the same period is 1.05%. The difference is significant (at the 5% level). The fraction of positive market adjusted returns for the same interval is 58.2 % for the first group, 52.2% for the second group. The difference is significant (at the 1 % level).
For the first group, both a higher price run-up and a higher fraction of positive market-adjusted returns are observed before the filing date, as compared to the second group. This observation suggests that IPOs underwritten by the first-tier underwriter group take place when the market conditions before the filing date are more favorable. It appears that the timing pattern of IPOs underwritten by the first-tier group is indicative of superior timing ability on their part. However, as noted, interpretation should be made with caution. One explanation of the observed timing pattern of the first-tier group could be adherence to a simple rule of going public after a run-up in industry performance. Thus, it may not be that IPO firms underwritten by the first-tier underwriter group have a greater urgency for funds when industry conditions are more favorable, and IPO firms underwritten by the second-tier underwriter group need greater access to funds when industry conditions are less favorable.
On the other hand, after the offering date, the difference in the two groups become less pronounced than before the filing date. The one-year average market adjusted return after the offering date is 1.51% for the first-tier group, and -2.71% for the second-tier group. The difference is significant (at the 1% level). The difference in the fraction of positive

Journal of Finance and Accountancy
Underwriter reputation, Page 8
market-adjusted return is also significant (at the 5% level). The fraction of positive market-adjusted returns for the same interval is 46.1% for the first-tier group, and 38.8% for the second-tier group.
Timing Pattern During the Waiting Period
For the first group, the waiting period average excess return is 1.54%. For the second group, the same measure yields 0%. The difference is significant (at the 1% level). The fraction of positive excess returns for the same interval is 54.8% for the first group and 45.4% for the second group. The difference is significant (at the 1 % level). The first-tier group depicts a significantly higher fraction of positive excess returns and also a higher average excess return. This indicates that IPOs underwritten by the first-tier underwriter group take place when industry conditions during the waiting period are more favorable. This evidence is consistent with the conjecture that IPOs underwritten by the first-tier underwriter group are better timed, relative to the second-tier group, since industry conditions during the waiting period are not observable at the time of filing of IPOs. ALTERNATIVE EXPLANATIONS
The above results are consistent with the conjecture that underwriters in the first-tier group are more proficient than the second group of underwriters in taking firms public under more favorable market conditions, when timing performance is measured by the change in market-adjusted returns on the industry index over the waiting period. However, these changes in market-adjusted returns during the waiting period may have alternative explanations. Firstly, the difference in observed patterns during the waiting period may indicate that the more reputable underwriters have a greater proclivity to cancel their offerings during the waiting period, if their timing turns out to be wrong. Secondly, it may be due to a difference in the length of the waiting period. Thirdly, it may be due to dissimilar time patterns of capital needs of different firms. Fourthly, it may be an artifice of the underwriter ranking system used in this study. Finally, it may be the case that it is managers of firms who control timing of offerings, as opposed to underwriters. In this section, the validity of these alternative explanations is examined.
Willingness to Withdraw Offerings
Since the sample consists of successful IPOs, it is subject to a selection bias. The apparently better timing ability of the first group of underwriters may reflect the fact that the more reputable underwriters have a greater tendency to cancel the offerings, if timing turns out to be wrong. Such willingness on the part of the more prestigious underwriters to withdraw IPOs in the face of deteriorating market conditions may explain the apparent superiority of these underwriters in timing IPOs.
To investigate this possibility, 378 withdrawn and abandoned IPO filings are identified between 1980 and 1991 in the weekly editions of the Investment Dealer's Digest. These canceled IPOs are drawn from the same industries as the successful IPOs. These canceled IPOs originated through a firm commitment underwriting arrangement. A comparison is made between the IPO cancellation ratios of each group of underwriters. The cancellation ratio of IPOs is defined as the number of IPOs canceled by an underwriter group divided by the number of IPOs filed by that

Journal of Finance and Accountancy
Underwriter reputation, Page 9
group. The cancellation ratio is 11.5% (138 cancellations /1058 total filings) for the first group of underwriters and 18.0% (240 cancellations /1096 total filings) for the second group. The cancellation ratio of the second group is higher than that of the first group. This suggests that the less reputable group of underwriters is more likely to cancel their offerings. Thus, the superior timing performance of the more reputable underwriters does not appear to be driven by a greater tendency on their part to cancel IPOs.
Difference in the Waiting Period
A second possible explanation for the better timing performance of the first group may be related to the length of the waiting period. The failure of the less prestigious underwriters to take firms public under more favorable market conditions may reflect possibly inferior skills in executing an offering, rather than an inability to perceive good market conditions. Alternatively, the worse timing performance of the less reputable underwriters may be due to a delay in the Securities and Exchange Commission (SEC)'s review process. It is typical of smaller IPOs to be subjected to greater scrutiny, and thus, more time may be required to receive the SEC's approval. In either case, IPOs underwritten by the less reputable underwriters would tend to have longer waiting periods, which may undermine their timing abilities.
To consider this possibility, a comparison is made between the length of the waiting period of the first and second group. In fact, the waiting period is longer for the second group. The average waiting period is 40 trading days for the first group, and 49 trading days for the second group. To ascertain whether timing performance may be affected by the length of the waiting period, the length of the waiting period of the second group is artificially reset to that of the first group (40 days), and then, the second group's average market-adjusted return and the fraction of positive market-adjusted returns are calculated for that shorter period. The average market-adjusted return of the second group calculated this way is 0.15%, and the fraction of positive market-adjusted returns is 45.3%. The actual average market-adjusted return of the second group is 0%, and the actual fraction of positive market-adjusted returns is 45.4%. 'The actual average market adjusted return of the first group is 1.54%, and the actual fraction of positive market adjusted returns is 54.8%. These figures indicate that the first-tier group's performance is still superior to that of the second group. Therefore, empirical evidence indicates that the poor timing performance of the second group of underwriters is not driven by the longer waiting period for their IPOs. Difference in the Time Patterns of Capital Needs
Another concern is that the difference in timing patterns may be due to dissimilarity in the time patterns of capital needs of firms in the two groups, rather than a difference in timing proficiency. For example, IPO firms underwritten by the first-tier underwriter group may have a greater urgency to raise new funds when market conditions are favorable, while IPO firms underwritten by the second-tier underwriter group may need funds more when market conditions are less favorable.
To consider this possibility, the entire IPO sample is partitioned into two subgroups, depending upon market conditions before the filing date. It is then verified whether the observed timing pattern during the waiting period still holds true in the two subgroups. More specifically,
Journal of Finance and Accountancy
Underwriter reputation, Page 10
the whole sample is first divided into two subgroups. This is done according to whether the one-month pre-filing excess returns on the size-and-industry-matched Index are positive or negative. Within each subgroup, a comparison is then made between the performance of the first-tier and second-tier underwriter groups. This comparison is made in regard to the waiting period excess returns on the index, for each sample subgroup.
Panel A of Table III shows results when the one-month excess returns before the filing date are positive. The average excess return of the industry index during the waiting period is 2.15% for the IPOs underwritten by the first-tier underwriter and 0.58% for the IPOs underwritten by the second-tier underwriter group. The difference is significant (at the 5% level). The fraction of positive excess returns is 56.2% for the first group and 47.3% for the second group. The difference is significant (at the 1% level). Panel B of Table III shows results when the one-month excess returns before filing dates are negative. These results in general conform to those reported in Panel A. The average excess return of the industry index is 0.71% for the IPOs underwritten by the first-tier underwriter and -0.61 % for the IPOs underwritten by the second-tier underwriter group. The difference is significant (at the 10% level). The fraction of positive excess returns is 52.8% for the first group and 43.5% for the second group. The difference is significant (at the 5% level).
In sum, the results in Panels A and B of Table III suggest that regardless of market conditions before the filing date, IPO firms underwritten by the first-tier group of underwriters are more likely to go public when the market valuation of industry stocks is high, than those underwritten by the second group. This evidence is consistent with the conjecture that the superior timing proficiency of the first group of underwriters is not caused by the possibility that the IPO firms underwritten by these underwriters may need funds more when overall industry conditions are favorable.
Classification of Underwriters
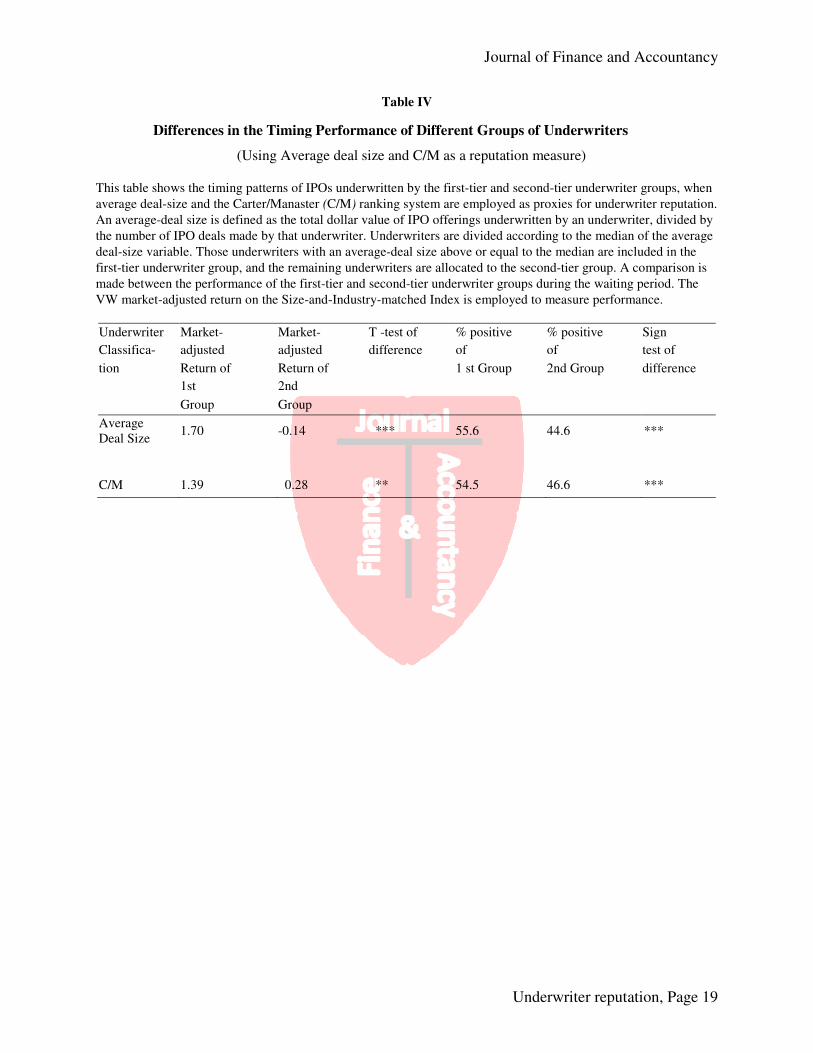
Another concern is that the better timing performance of the more reputable underwriters may be an artifice of the criteria used for classification of underwriters. Even though there is no reason to believe that the number of IPO deals underwritten by an underwriter introduces a systematic bias in measuring the "true" reputation of the underwriter, the robustness of the above findings is verified by using other ranking systems. One proxy for reputation is the average deal-size of the underwriter. An average-deal size is defined as the total dollar value of IPO offerings underwritten by an underwriter, divided by the number of IPO deals made by that underwriter. Underwriters are divided according to the median of the average deal-size variable. Those underwriters with an average-deal size above or equal to the median are included in the first-tier underwriter group, and the remaining underwriters are allocated to the second-tier group.
Using average deal-size does not change the conclusion that the more reputable underwriters take firms public under better market conditions. The results are reported in Row 2 of Table IV. The excess return on the industry index during the waiting period is 1.70% for the first-tier group, and -0.14% for the second-tier group. The difference is significant (at the 1% level). The fraction of positive excess returns is 55.6% for the first-tier group, compared to 44.6% for the second-tier group. The difference is significant (at the 1% level).
To further ascertain the robustness of timing performance, the Carter/Manaster ranking system is employed. Carter and Manaster (1990) determine an underwriter's level of prestige by

Journal of Finance and Accountancy
Underwriter reputation, Page 11
examining the placement of underwriter names in IPO tombstone advertisements. The results of this methodology is a prestige rating for each underwriter on a scale from zero (representing least prestigious) through nine (most prestigious). In this study, underwriters with a prestige rating between eight and nine are allotted to the first-tier group, and underwriters having a rating below eight are assigned to the second-tier group. However, using the Carter/Manaster measure in this study is problematic, because their sample years do not match those of this study. In addition, some underwriters of the sample used in this study are not listed in their list. If such is the case, those underwriters are assumed to belong to the second-tier group. As reported in Row 3 of Table IV, a similar picture emerges again. The difference in timing performance between the two groups is still significant. Underwriter Timing vs. Manager Timing
Another problem in examining timing performance is investigating whether underwriters or managers of issuing firms are responsible for timing. If issuing firms entrust their managers with the task of timing, it might be possible to develop another interpretation. The above results may support the alternative explanation that managers of issuing firms in the first-tier underwriter group possess superior timing abilities, as compared to their counterparts in the second-tier group. It may also be that often, timing decisions are ultimately arrived at through agreement between both parties concerned. In this case, it is virtually impossible to determine which party is responsible.
However, some arguments tend to support the view that it is more likely to be underwriters who are responsible for timing, rather than firm’s managers. In the firm-commitment offering, it is underwriters who bear flotation risk, contact investors during the waiting period, and also possess information about investors’ interest in the particular IPO, as well as previous ones. Also, entrepreneurs of IPO firms may not have as much experience as underwriters in matters concerning the financial market. However, these managers may have better information about the value of their firms and competitors. In this section, several tests are conducted which may lend support to the conclusion that underwriters do take up much responsibility, if not all, for timing decisions.
To verify the robustness of the role of underwriters in timing, probit regressions are employed. The dependent variable assumes a value of one for IPOs associated with the positive market-adjusted return on the industry index during the waiting period, and to those associated with the negative market-adjusted return, zero is assigned. As for independent variables, Group represents a zero-one dummy variable for underwriters. For the first group of underwriters, this variable takes the value of one, and for the second group, the value is zero. Regression results are also reported using a continuous variable for underwriter reputation, as opposed to a zero-one dummy variable. A firm size variable is used as a control variable, under the presumption that managerial timing is directly related to firm size.
Using firm size as a proxy for managerial timing assumes that managers of larger firms have greater abilities and/or information to forecast developments in the financial market and the industry, than managers of smaller firms. It is also noted that IPOs of big firms are usually underwritten by prestigious underwriters. Thus, if mutual correlation exists between the underwriter variable and the firm size variable, it would be difficult to interpret regression results. The regression procedures are carried out both by including and excluding IPO firm size as the control variable. The IPO firm size variable used here is the market capitalization at the end of

Journal of Finance and Accountancy
Underwriter reputation, Page 12
the offering year. To account for the fact that the size of the entire stock market varies over time, the market capitalization of an IPO firm is divided by the market value of the NASDAQ market index for each year. This relative firm size variable also takes inflation into consideration. In these regressions, a scaled variable of 10000*relative firm size is used as the firm size variable.
First, the number of offerings is employed as a proxy for underwriter reputation. Results are reported in Panel A of Table V. In the regression without firm size as a control variable (Regression 1), the coefficient of the underwriter dummy variable is positive and significant at the 1 % level (t = 4.08). Regression 2 shows that the coefficient of the continuous underwriter variable (the number of IPO deals) is also positive, and significant at the 1 % level (t = 4.79).
Regressions 3 and 4 show results when firm size is included as a control variable. In Regression 3, the coefficient of the underwriter dummy variable is positive and significant at the 1 % level (t = 3.37), while the firm size variable is less significant (t = 2.12). Regression 4 shows that the coefficient of the continuous underwriter variable is also positive, and significant at the 1 % level (t = 4.11). On the other hand, the firm size variable becomes even less significant (t = 1.91). Thus, the continuous underwriter variable has greater statistical significance than the zero-one dummy variable. In sum, these results are consistent with the view that the more reputable group of underwriters tends to take firms public when market conditions during the waiting period are more favorable, than do their less reputable counterparts.
Panel B of Table V reports similar results when the average deal-size is used as a proxy for underwriter reputation. In general, using the average deal-size also supports the conjecture that the more reputable underwriters take firms public under more favorable market conditions. In each regression, the coefficient of underwriter reputation has significant explanatory power. In the regression without firm size (Regression 1), the coefficient of the log of average deal-size is positive and significant at the 1 % level (t = 4.43). In the regression with firm size (Regression 2), the coefficient of the underwriter variable is still positive and significant at the 1 % level (t = 3.48), while the firm size variable is insignificant (t = 1.47). These results are consistent with the conclusion that the more reputable group of underwriters tends to take firms public under more favorable market conditions. CONCLUSION
This paper finds that the more reputable underwriters possess a greater proficiency than
their lesser known counterparts, in taking companies public when the market valuation of comparable stocks in the same industry is high. The existing literature on the role of underwriters has concentrated on underwriter certification and marketing. However, prior studies have apparently ignored the market timing role often ascribed to underwriters by practitioners. It is shown that IPO timing is a function of the reputation of underwriters who have expertise in the financial market. In their advisory role, underwriters advise their client firms on offer timing, in addition to pricing decisions and, ultimately, distributing the shares to investors.
Unlike auditors, lawyers and engineers, who are responsible only for specific elements of registration statements, underwriters are responsible for the timing decision, relying on information from all parties to the offering, knowledge of the issuer's industry performance, and expertise gained in continuous market participation. Underwriters spend significant resources analyzing individual stocks, industries and. overall markets.
The more reputable underwriters have a comparative advantage in analyzing financial markets, because of scale economies in information acquisition and in search, than their less
Journal of Finance and Accountancy
Underwriter reputation, Page 13
reputable counterparts. The more reputable underwriters are able to search more efficiently because of superior expertise in the new issue market gained from extensive experience, and because of a more extensive customer base. Because of the benefits from successful timing and the costs of poor timing advice, underwriters' reputation and, thus, value will depend in part on how well they time IPOs.
This paper presents empirical evidence that underwriters in the first-tier group are more proficient than the second group of underwriters in taking firms public under more favorable industry conditions, when timing performance is measured by the change in market-adjusted returns on the size-and-industry-matched index over the waiting period. These results are robust to a plethora of statistical tests and alternative explanations.
REFERENCES
Arkebauer, J.B., 1991, Cashing out: The entrepreneur’s guide to going public,
HarperBusiness
Asquith, P.; and D. Mullins, 1986, Equity issues and offering dilution, Journal of
Financial Economics 15, 61-90 Balvers, R.I., B. Mcdonald, and RE. Miller, 1988, Underpricing of new issues and the choice of auditor as a signal of underwriter reputation, The accounting
review 63, 605-622 . Beatty,R., and J. R.Ritter,1986, Underwriting, reputation, and the underpricing of initial public offerings, Journal of Financial Economics 15, 213-232
Blume, M., and R. Stambaugh, 1983, Biases in computed returns: An application to the
size effect, Journal of Financial Economics 12, 387-404
Booth, J.R, and R.L. Smith, II, 1986, Capital raising, underwriting and the certification
. hypothesis, Journal of Financial Economics 15, 262-281 Canina, L., and R Michaley and R. Thaler and K. Womack, 1995,. A warning about using the daily CRSP equa1ly-weighted index to compute long-run excess returns, Working Paper, Cornell University .
Carter, R., and S. Manaster; 1990,-lnitial public offerings and underwriter reputation,
Journal of Finance 45, 1045-1067
Chan, K. c., and N Chen, 1991,. Structual and return characteristics of small and large
Firms, Journal of Finance 46, 1467-1484
Choe, R, R. MaSulis, and V. Nanda, 1993, Common stock offerings across business
. cycle: Theory and. evidence, Journal of Empirical Finance 1, 3-31
Conrad, J., and G. Kaul, 1993, Long-run market reaction on biases in computed returns?,
Journal of Finance 48, 39-63
Easterbrook, F.H., 1984, Two agency cost explanation of dividends, American Economic
Review 74, 650-659
Hansen, R., and J. Pinkerton, 1982, Direct equity financing: A resolution of a paradox,
Journal of Finance 37, 651-665
Hansen, Robert, and Paul Torregrosa, 1992, Underwriter compensation and corporate
monitoring, Journal of Finance 47, 1537-1555
Journal of Finance and Accountancy
Underwriter reputation, Page 14
Howard & Co., 1980-1989, Going public: The IPO reporter (Philadelpia) Ibbotson, Roger, 1975, Price performance of common stock new issues, Journal of Financial Economics 3, 235-272 .
Ibbotson, Roger, Jady Sindelar, and Jay Ritter, 1988, Initial public offerings, Journal of
Applied Corporate Finance 1, 37-45. .
Jain, Bharat, and Omesh Kini, 1994, The post-issue operating performance of IPO firms, Journal of Finance 49, 1699-1726 Korajczyk, Robert, Deborah Lucas, and Robert Mcdonald, 1991, The effect of information
releases on the pricing and timing of equity issues, Review of Financial Studies 4, 685- 708 .
Kraus, H. Stoll, 1972, Price impacts of block trading on the New York Exchanges, Journal of Finance 27, 569-588 Lee, Cheulho, 2010, Market and industry valuations surrounding initial public offerings,
Proceedings of 2010 Academic and Business Research Institute Annual Conference
Lerner, Josh, 1994, Venture capitalists and the decision to go public, Journal of Financial
Economics 35, 293-316 .
Loughran. Tim, 1993, NYSE vs NASDAQ returns Market microstructure or the poor performance of initial public offerings?, Journal of Financial Economics 33, 241-260 Loughran, Tim, and Jay Ritter, 1995, The new issue puzzle, Journal of Finance 50, 23-51 Malone, Michael, 1991, Going public (Edward Burlingame Books)
Marsh, Paul, 1982, The choice between equity and debt, An empirical analysis, Journal of Finance 37, 121-144
Merton, Robert, 1987, A simple model of capital market equilibrium with incomplete information, Journal of Finance 42, 483-510 Masulis, Ronald, and Ashok Kowar, 1986, Seasoned equity offerings, Journal of financial
economics 15, 91-118 Megginson, William and Kathleen Weiss, 1991, Venture capitalist certification in initial public offerings, Journal of Finance 46, 879-903 Ritter, Jay, 1991, The long-run performance of initial public offerings, Journal of Finance 46, 3-27 Roll, Richard, 1983, On computing mean returns and the small firm premium, Journal of.
Financial Economics 12, 371-386 ,', '
Taggart, Robert, 1977, A model of corporate financing decisions, Journal of Finance 32, 1467-1484
Journal of Finance and Accountancy
Underwriter reputation, Page 15
Table I
Description of Underwriters
The IPO sample period is first divided into two time intervals, 1980-1985 and 1986-1991. Then, underwriters are ranked within each sub-period by the number of offerings they brought to the market. If an IPO has more than one lead underwriter, the first underwriter listed in the Investment Dealer's Digest is given full credit for the issue. Within each period, the underwriters are further partitioned into two subgroups at the median of the distribution of the number of offerings. Within each period, the top 50% of underwriters are referred to as the first-tier underwriter group, and the bottom 50% constitutes the second-tier group.
Panel A: Underwriter Representation of IPOs
Panel A1: 1980-1985
Subgroup Underwriters Average # of Max # of IPOs Min # of IPOs # of IPOs in
represented IPOs per in anyone in anyone the Group
(%) Underwriter Underwriter Underwriter (%)
1st 22 24.4 53 14 537
(11.7%) (49.9%)
2nd 167 3.2 13 1 540
(88.3%) (50.1%)
Total 189 1077
(100%) (100%)
Panel A2: 1986-1991
Subgroup Underwriters Average # of Max # of IPOs Min # of IPOs # of IPOs in
represented IPOs per in anyone in anyone the Group
(%) Underwriter Underwriter Underwriter (%)
1st 14 37.2 79 21 521
(7.4%) (48.4%)
2nd 177 3.1 17 1 556
(92.6%) (51.6%)
Total 191 1077
(100%) (100%)

Journal of Finance and Accountancy
Underwriter reputation, Page 16
Panel B: Rankings of Underwriters
Panel Bl: 1980-1985
Rank Underwriter # offerings % Offering Accumulated #
Amount ($mil.) Offerings
1 L F Rothschild 53 4.9 1411 53
2 D H Blair & Co 43 4.0 184 96
3 Prudential Bache 38 3.5 931 134
4 Kidder Peabody 34 3.2 864 168
5 Alex Brown and Sons 33 3.0 685 201
6 Drexel Burnham 32 3.0 626 233
7 Sherason Lehman 31 2.9 875 264
8 Hambrecht & Quist 26 2.4 426 290
9 Goldman Sachs & Co 23 2.1 755 313
10 Merrill Lynch 23 2.1 748 336
11 Dean Witter Reynolds 20 1.9 388 356
12 Rooney Pace Inc 19 1.8 88 375
13 Bear Steams 18 1.7 171 393
14 Donaldson Lufkin 18 1.7 302 411
15 E.F.Hutton Co & Inc 18 1.7 337 429
16 Morgan Stanley 18 1.7 929 447
17 Laidlaw Adams 17 1.6 93 464
18 Ladenburg Thalmann 15 1.4 105 479
19 Lehman Brothers 15 1.4 529 494
20 Smith Barney Harris 15 1.4 270 509
21 Advest Inc 14 1.3 72 523
22 Paulson Investment 14 1.3 53 537
Panel B2: 1986-1991
Rank Underwriter # offerings % Offering Accumulated #
Amount ($mil.) Offerings
1 Alex Brown and Sons 79 7.3 2008 79
2 Goldman Sachs & Co 51 4.7 4574 130
3 Merrill Lynch 49 4.6 4541 179
4 Drexel Burnham 47 4.4 1729 226
5 Morgan Stanley 40 3.7 1581 266
6 Paine Webber 39 3.6 1063 305
7 Kidder Peabody 34 3.1 1206 339
8 Smith Barney 32 3.0 1044 371 9 First Boston 30 2.8 2434 401
10 Shearson Lehman 27 2.5 1829 428
11 Robertson Colman 26 2.4 605 454
12 Montgomery Securities 24 2.2 626 478
13 Donaldson Lufkin 22 2.0 1193 500 14 Hambrecht & Quist 21 2.0 473 521
Journal of Finance and Accountancy
Underwriter reputation, Page 17
Table II
Difference in the Timing of IPOs Underwritten by Different Groups of Underwriters, 1980-1991
This table depicts the timing patterns of IPOs underwritten by the first-tier and second-tier underwriter
groups. IPO timing is measured by the performance of the Size-and-Industry-matched index surrounding
IPOs. The VW market-adjusted return is employed to assess the performance of the index.
Months Market- Market- T-test of % positive of % positive of Sign
relative to adjusted adjusted difference Top 50% Bottom 50% test of
the waiting Returns of Returns of Group Group difference
period Top 50% Bottom 50%
Group Group
(-12, 0) 26.93 17.42 *** 68.7 55.0 ***
(-11, 0) 24.90 14.83 *** 66.8 54.7 ***
(-10, 0) 23.70 14.46 *** 67.6 55.5 ***
( -9, 0) 20.38 13.36 *** 67.5 56.0 ***
( -8, 0) 17.94 12.64 *** 67.3 56.1 ***
( -7, 0) 15.29 10.51 *** 64.9 55.6 ***
( -6, 0) 12.32 8.68 *** 64.7 54.1 ***
( -5, 0) 10.34 7.21 ** 62.2 53.0 ***
( -4, 0) 7.63 5.32 ** 62.8 53.1 ***
( -3, 0) 5.39 3.32 *** 61.2 52.6 ***
( -2, 0) 3.55 2.18 ** 60.1 51.2 ***
( -1, 0) 1.85 1.05 ** 58.2 52.2 ***
0 1.54 0.00 *** 54.8 45.4 ***
(0, +1) 0.50 0.18 48.4 47.9
(0, +2) 1.52 0.19 ** 50.4 46.7 *
(0, +3) 1.77 0.22 ** 49.5 45.6
(0, +4) 2.30 0.14 *** 47. 41.7 **
(0, +5) 2.64 -0.17 *** 48.1 39.7 ***
(0, +6) 3.08 -0.26 *** 49.4 40.1 ***
(0, +7) 3.42 -0.71 *** 48.7 39.4 ***
(0, +8) 3.28 -1.47 *** 48.5 40.1 ***
(0, +9) 2.73 -2.46 *** 48.2 38.5 ***
(0,+10) 2.48 -2.37 *** 48.3 38.3 ***
(0, +11) 2.12 -2.68 *** 46.8 38.6 ***
(0, +12) 1.51 -2.71 *** 46.1 38.8 **

Journal of Finance and Accountancy
Underwriter reputation, Page 18
Table III
Test of Differences in the Waiting-Period Timing Patterns of IPOs Underwritten by Different Underwriter Groups, Contingent upon Pre-filing Market Conditions
The whole sample is first divided into two subgroups. This is done, depending on whether the one-month pre-filing excess returns on the size-and-industry-matched Index are positive or negative. Within each subgroup, a comparison is then made between the performance of the first-tier and second-tier underwriter groups. This comparison is made in regard to the waiting period excess returns on the index, for each sample subgroup. The VW market-adjusted return is employed to measure excess returns.
Panel A: When Excess Returns over the Period (-1, 0) are Positive
Periods Market- Market- T-test of % positive % positive Sign
relative to adjusted adjusted difference of the First of the test of
the waiting Returns of Returns of group% Second difference
period the First the Second group
group group
( -1, 0) 6.17 6.17 100.0 100.0
0 2.15 0.58 ** 56.2 47.3 ***
(0, +1) 0.51 0.43 49.2 48.3
Panel B: When Excess Returns over the Period (-1,0) are Negative
Periods Market- Market- T-test of % positive % positive Sign
relative to adjusted adjusted difference of the First of the test of
the waiting Return of Return of group% Second difference
period the First the Second group
group group
( -1, 0) -4.15 -4.54 0 0
0 0.71 -0.61 * 52.8 43.5 **
(0, +1) 0.50 -0.07 47.4 47.6
Journal of Finance and Accountancy
Underwriter reputation, Page 19
Table IV
Differences in the Timing Performance of Different Groups of Underwriters
(Using Average deal size and C/M as a reputation measure)
This table shows the timing patterns of IPOs underwritten by the first-tier and second-tier underwriter groups, when
average deal-size and the Carter/Manaster (C/M) ranking system are employed as proxies for underwriter reputation.
An average-deal size is defined as the total dollar value of IPO offerings underwritten by an underwriter, divided by
the number of IPO deals made by that underwriter. Underwriters are divided according to the median of the average
deal-size variable. Those underwriters with an average-deal size above or equal to the median are included in the
first-tier underwriter group, and the remaining underwriters are allocated to the second-tier group. A comparison is
made between the performance of the first-tier and second-tier underwriter groups during the waiting period. The
VW market-adjusted return on the Size-and-Industry-matched Index is employed to measure performance.
Underwriter Market- Market- T -test of % positive % positive Sign
Classifica- adjusted adjusted difference of of test of
tion Return of Return of 1 st Group 2nd Group difference
1st 2nd
Group Group
Average Deal Size
1.70 -0.14 *** 55.6 44.6 ***
C/M 1.39 0.28 ** 54.5 46.6 ***

Journal of Finance and Accountancy
Underwriter reputation, Page 20
Table V
Estimated Probit Regressions of the Waiting Period Market-adjusted Return
To verify the robustness of the role of underwriters in timing, probit regressions are employed. The dependent
variable assumes a value of one if IPOs are associated with positive VW market-adjusted (waiting period) returns on
the Size-and-Industry-matched Index, and 0 if related to negative market-adjusted returns. As for independent
variables, Group represents a zero-one dummy variable for underwriters. For the first-tier group of underwriters, this
variable takes the value of one, and for the second group, the value is zero. Regression results are also reported using
a continuous variable for underwriter reputation, as opposed to a zero-one dummy variable. A firm size variable is
used as a control variable, under the presumption that managerial timing is directly related to firm size. The
regression procedures are carried out both by including and excluding IPO firm size as the control variable. First, the
number of offerings is employed as a proxy for underwriter reputation. Second, the average deal-size is also used as
a measure for reputation. (The t statistics are in parentheses)
Panel A: Using the Number of Offerings as a Proxy for Investment Bank Reputation
No Intercept Group Log(count) Firm size Adj. R Sq F
1 0.45 0.09 0.008 16.66***
(28.09) (4.08) ***
2 0.38 0.04 0.012 22.94***
(14.28) (4.79) ***
3 0.45 0.08 0.005 0.010 10.59***
(26.71) (3.37) *** (2.12) **
4 0.38 0.04 0.004 0.013 13.33***
(14.25) (4.11) *** (1.91) *
Panel B: Using Average Deal-size as a Proxy for Investment Bank Reputation
No Intercept Log(average deal Firm size Adj. R Sq F size)
1 0.01 0.05 0.009 19.70***
(0.12) (4.43) ***
2 0.07 0.04 0.004 0.011 10.95***
(0.62) (3.48) *** (1.47)