UnderstandingValue Creation: The Shareholder Value … · Members Copy, Not for Commercial Sale...
15
www.IndianJournals.com Members Copy, Not for Commercial Sale Downloaded From IP - 115.248.73.67 on dated 30-Nov-2010 Understanding Value Creation: The Shareholder Value Perspective Latha Chari* and R. P. Mohanty** Abstract This paper explains the concepts of value from two perspectives, namely: stakeholders and shareholders. Value perception differs for different stakeholders. It is attempted here to explain the measures of value for stakeholders as well as for shareholders. Different methods used for computation of shareholder value are illustrated through a case example. The paper hopefully will serve as an instrument of communication to the professionals attempting to understand the all inclusive meaning of value as well as to the practitioners engaged in accounting/financial services/auditing functions. Keywords: Stakeholder Value, Shareholder Value, EVA, MVA, ROI, ROE, Value Based Measures. 1.0 Introduction: As a result of relentless and strong pressures on competition during the recent times, companies across the globe are applying various concepts like value innovation, value chain, value added, value analysis, value stream mapping, etc., with multiple objectives like cost reduction, enhancement of customer value, improvement in profitability and creation of sustainable value to shareholders. Uses of such concepts have grown in importance in creating competitive advantages. Kim and * Associate Professor, ITM Group of Institutions **Professor, ITM Group of Institutions, Vashi, Navi Mumbai Mauborgne (1997) mentioned that high-growth companies make their competitors irrelevant through a strategic logic, which they called as value innovation. Porter (1985) propagated the concept of value chain for a business unit, which helps to sustain competitive advantage based on cost or on differentiation or on both. Different methods have been used historically for improving functional effectiveness of products and services and the efficiency in the use of resources. In trying to respond to the super ordinate focus of maximization of value; firms have adopted a wide variety of
-
Upload
nguyendien -
Category
Documents
-
view
216 -
download
0
Transcript of UnderstandingValue Creation: The Shareholder Value … · Members Copy, Not for Commercial Sale...
ww
w.In
dia
nJo
urn
als.
com
Mem
ber
s C
op
y, N
ot
for
Co
mm
erci
al S
ale
Do
wn
load
ed F
rom
IP -
115
.248
.73.
67 o
n d
ated
30-
No
v-20
10
Understanding Value Creation: The ShareholderValue Perspective
Latha Chari* and R. P. Mohanty**
Abstract
This paper explains the concepts of value from two perspectives, namely:
stakeholders and shareholders. Value perception differs for different stakeholders.
It is attempted here to explain the measures of value for stakeholders as well as for
shareholders. Different methods used for computation of shareholder value are
illustrated through a case example. The paper hopefully will serve as an instrument
of communication to the professionals attempting to understand the all inclusive
meaning of value as well as to the practitioners engaged in accounting/financial
services/auditing functions.
Keywords: StakeholderValue, Shareholder Value, EVA, MVA, ROI, ROE, Value
Based Measures.
1.0 Introduction:
As a result of relentless and strong pressures oncompetition during the recent times, companiesacross the globe are applying various concepts likevalue innovation, value chain, value added, valueanalysis, value stream mapping, etc., with multipleobjectives like cost reduction, enhancement ofcustomer value, improvement in profitability andcreation of sustainable value to shareholders. Usesof such concepts have grown in importance increating competitive advantages. Kim and
* Associate Professor, ITM Group of Institutions**Professor, ITM Group of Institutions, Vashi, Navi Mumbai
Mauborgne (1997) mentioned that high-growthcompanies make their competitors irrelevantthrough a strategic logic, which they called as valueinnovation. Porter (1985) propagated the conceptof value chain for a business unit, which helps tosustain competitive advantage based on cost or ondifferentiation or on both. Different methods havebeen used historically for improving functionaleffectiveness of products and services and theefficiency in the use of resources. In trying torespond to the super ordinate focus ofmaximizationof value; firms have adopted a wide variety of
ww
w.In
dia
nJo
urn
als.
com
Mem
ber
s C
op
y, N
ot
for
Co
mm
erci
al S
ale
Do
wn
load
ed F
rom
IP -
115
.248
.73.
67 o
n d
ated
30-
No
v-20
10Understanding Value Creation: The Shareholder Value Perspective
THE STAKEHOLDER VALUE APPROACH:
THEORIES DEALING WITH VALUEMAXIMISATION:
Value creation in an organization is inherentlypositive, and involves a set of competencies andcapabilities at different levels, because they have apredominantly determining role in thetransformation of assets and processes, but in orderto effectively create value, it is essential forcompanies to define their goals in terms of valuecreation for whom and how to measure the same.There are two approaches that deal with the issueof value maximisation. They are:
approaches, including business process reengineering, corporate restructuring, outsourcing,venturing, and rejuvenation.
Companies often refer to customer value,
shareholders value, value for money, added value,
etc., without providing corresponding definitions
for understanding or measuring value. Value in
essence is a dynamic concept and it differs from
product to product, customer to customer, company
to company and across time. A clear understanding
)f the meaning of value and focus on value for
Ihom and how to measure such value, is essential
)r management of companies so that they can
nhance value. The objective of this paper is as
)llows:
•
•
The stakeholder value approach, and
The shareholder value approach.
•
•
•
To explain the theories that deal with the
issue of what value companies should focus
on;
To highlight the importance of shareholder
value and explain its measures critically;
To illustrate the calculation of shareholder
value measures and its decomposition into
value drivers using the case example of
ABB Ltd.
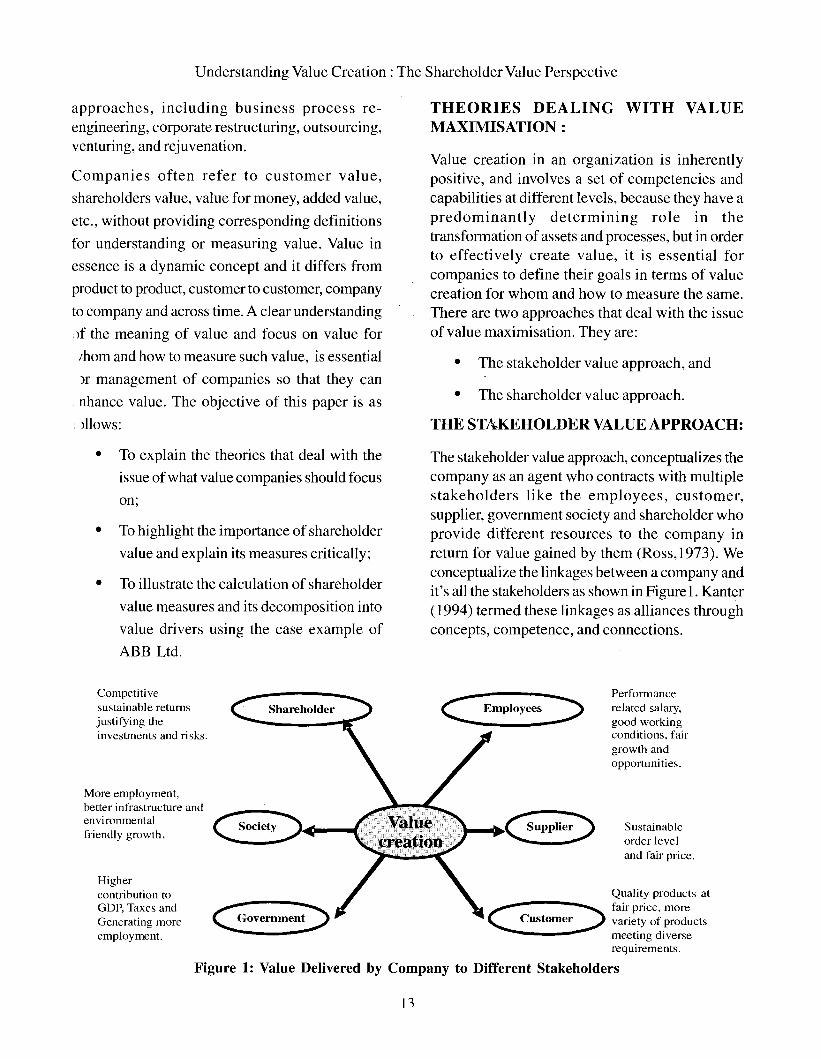
The stakeholder value approach, conceptualizes thecompany as an agent who contracts with multiplestakeholders like the employees, customer,supplier, government society and shareholder whoprovide different resources to the company inreturn for value gained by them (Ross,1973). Weconceptualize the linkages between a company andit's all the stakeholders as shown in Figure1. Kanter(1994) termed these linkages as alliances throughconcepts, competence, and connections.
Sustainableorder leveland fair price.
Performancerelated salary,good workingconditions, fairgrowth andopportunities.
~uPPlie~
::>------~
Shareholder
Goverumen~
Quality products at
C~ fair price, more
Customer.....,....., varie~y of .productsmeetmg diverserequirements.
Figure 1: Value Delivered by Company to Different Stakeholders
Highercontribution toGDP, Taxes andGenerating moreemployment.
Competitivesustainable returnsjustifying theinvestments and risks.
More employment,better infrastructure andenvironmentalfriendly growth.
ww
w.In
dia
nJo
urn
als.
com
Mem
ber
s C
op
y, N
ot
for
Co
mm
erci
al S
ale
Do
wn
load
ed F
rom
IP -
115
.248
.73.
67 o
n d
ated
30-
No
v-20
10LBS Journal of Management & Research
In order to improve the magnitude ofvalue perpetually,it is essential to measure the value created by thecompany to each category of stakeholder. Themeaning of the stakeholder value components andways for their measurement are discussed in thefollowing section.
Value to Customer:
Customer value is what "they get" relative to whatthey have to "give up". The financial valueprovided by a company to its customers can beascertained using the principle ofconsumer surplusin economics. In other words, whenever a customerbuys a product for final consumption, the valuecreated by a company to its customers is given bythe excess of the price a customer is willing t6 payfor a product over the price actually paid by him.
However, if tpe commodity sold is going to be usedfor the purpose offurther business or value creation,customer value created can be measured using theDiscounted Cash Flow method, i.e. Value tocustomer = (PV of net cash flows - AmountInvested).
Where, PV of net cash flows represents thediscounted net cash flows earned by the customerusing the product. Discounting is done at a rateequal to the cost ofcapital of the customer. AmountInvested = Price paid by the customer for theproduct.
Thus, we have two models for measurement ofvalue to customers under two differentcircumstances. The former model suffers from thedisadvantage that it cannot be easily applied andquantified for all products as the customer tastesand preferences can differ widely, thereby creatingvarious prices which different customers would bewilling to pay for a product, and also the samecustomer may be willing to pay different amountsat different points of time.
In addition to above, a company creates a lot of theintangible benefits to a satisfied customer likereduction in time spent for ordering, locatingvendors, price negotiations etc. for future
14
transactions thereby saving costs. The companyalso benefits out of creating a loyal customer andimproved brand image.
In a product market characterised by perfectcompetition, the value created by a company to itscustomers disappears if the customer can buy asimilar product from another company at the sameprice, terms and conditions. However, under suchconditions, companies differentiate their productsand thereby create value to customers.
Value to Suppliers:
Value created by a company to its suppliers is similarto the value created by it to customers, except forthe fact that the company pays out cash in returnfor goods/services here. In simple terms, value tosupplier can be expressed as: Value = [Pricereceived - Total Cost].
Under perfect competition, the company does notcreate any value to supplier because the suppliercan sell his product to any other company at thesame price, terms and conditions. However, if wetake the macro view, all companies put together docreate value for the supplier. If the supplier doesnot get any value added, he will discontinue hisbusiness.
Value to Employees:
Employees contribute the "Human Capital" to thecompany. In other words the contribution of theemployees is comparable with those of the owners,as human skills or intellectual capital contributedby the employees is also company specific just likeowner's capital. They also bear some risksassociated with the company. The value createdby a company to its employees can be summed upas the aggregate of the salary, bonus and incentivespaid to the employee in addition to intangibles likeskills development, reputation, and experience andso on. Thus, we have,
Value to employees = (Salary + Bonus + OtherPerquisites)

ww
w.In
dia
nJo
urn
als.
com
Mem
ber
s C
op
y, N
ot
for
Co
mm
erci
al S
ale
Do
wn
load
ed F
rom
IP -
115
.248
.73.
67 o
n d
ated
30-
No
v-20
10Understanding Value Creation: The Shareholder Value Perspective
In a perfectly competitive market condition, thereis no room for companies to provide lesscompensation (value) to employees than others. Ifany company pays less, then the employee willswitch to the company that pays him fairly. Hence,the value provided by the company will disappearas the employee can get paid the same returns inany other company he decides to work for.However, the intangible value added and personalpreferences of an employee bring in thedifferentiation, which enable value creation toemployees and help in their retention.
Value to Government:
The government contributes "free" resources likegood roads, public health system, administrationsystems, courts, laws, education, public safety andsuch other basic infrastructure. Further, theGovernment also enables the company to functionin a regulated environment by having systems, likelicensing, permission for investment abroad, etc.,for which it charges a fee. Value contributed to thegovernment, primarily is the aggregate of varioustaxes the government receives like corporateincome taxes, taxes on payrolls, taxes on sales,duties and excise, and other payments in the formof fee, like property taxes, tolls, surcharge, etc.ACompany creates value to Government when:
[Value returned to Government> value of freeresources consumed by company].
Value to Investors:
Value of a company to its investors is expressed asbelow:
Value to Investors = [PV of Cash returns - CashInvestments] .
Where
PV ofcash returns =PresentValue ofdividendsand market value realisable on sale of stock. Itis ascertained by applying the discount rate thatis equal to the cost of capital of the investor.
Cash Investments =money paid for purchaseof the security.
From the above, it can be said that theminimum value created by a Company to differentcategories of stakeholders can be measured.However, such value creation will be perceived asadequate only if the stakeholders feel that they arereceiving more val':le in return for the products givenor services rendered by them. The resourceexchanges will constantly reshape a company'sperceptions of their own value to others, updatetheir knowledge of useful assets and capabilities,and suggest new ways of organizing andcoordinating, all of which will contribute to aprocess of value innovation and growth.
The major drawbacks of this approach are asfollows:
The disadvantage of the method is that it is difficultto quantify the magnitu~e of consumption of freeresources and value them.
Value to Community :
The firm consumes scarce resources, without payingfor them. At the same time company also returns tothe community value in the form of moreemployment opportunities, better living conditions,may contribute to social causes, like literacy, health,etc. as a part of what we today call as "CorporateSocial Responsibility". Value created by thecompany is the net result of these positive andnegative contributions to the society which is partof Social Accounting.
15
•
•
•
It fails to measure intangible value createdby the company for its stakeholders, likeimprovement in employee skills due totraining, technologylknow-how transfer tosuppliers to improve quality of inputs, etc.
It fails to quantify the total value created bya company to each category of stakeholder,including financial and non financial value.
It also does not help find the aggregatevalue created by a company to all itsstakeholders put together. In the absenceof appropriate scoring mechanism, it

ww
w.In
dia
nJo
urn
als.
com
Mem
ber
s C
op
y, N
ot
for
Co
mm
erci
al S
ale
Do
wn
load
ed F
rom
IP -
115
.248
.73.
67 o
n d
ated
30-
No
v-20
10LBS Journal of Management & Research
becomes impossible to measure the valuecreation by a company in a holistic manner.
• It does not provide a single objectivefunction for value maximisation andmultiple objectives is no objective. Hence,when there are conflicting interests amongdifferent stakeholders, there is no clarity onwhose interests must be given priority andhow decisions should be taken.
Due to the above reasons, a company is unable toadopt maximising value to all its stakeholders asthe corporate financial goal. Adopting thestakeholder theory leaves the company with noclear cut management control or performancemanagement and measurement system, usingwhich the company can motivate and provideincentives for value-increasing behaviour among theemployees (Jensen, 2001). Hence, an alternativeapproach, namely the shareholder value approach,was suggested and is popularised by many authorslike Rappaport (200 I), Elbhar (1999).
Shareholder value maximisation approach:
The Shareholder value maximisation goal is basedon theory of firm (Simon, 1996), where anorganisation is viewed as an instrument in the controlofthe owners, who are the sole risk bearers and bearall the risks associated with the organization andcontribute capital for running it. They are also"residual claimants" and they get returns only afterall other factor contributors are compensated,including the Government. The value creationprocess and flow in a typical organisation followingshareholder value maximisation goal is illustrated inFigure 2 given below. From the figure, it can be seenthat for a Company operating in a market driveneconomy, the process of maximising value forshareholders is possible only if it creates value forall other stakeholders like customers, suppliers,employees and government.
16
Innovation
Value toemployees
Value tocustomers
Value toCompany
Figure 2: Linkages Between Stakeholder Value Enhancement and Value to Company.
The argument that maximising value toshareholders should be the corporate goal issupported by the following additional reasons:
• Since all other factor contributors have beencompensated, at the opportunity cost (in afree market economy) profits should belongto the shareholders.
• All other stakeholders have an opportunityto renegotiate their value periodically withthe organisation, however, there is noprovision in the Act where a shareholdercan ask for higher dividend than what theboard decides and the capital appreciationof the value of the share depends on thecapital market forces and overallperformance of the business at present andexpected future growth
Measuring Shareholder Value
There are two approaches to measuring shareholdervalue. In case of companies that are listed andwhose shares are traded in the market we havevalue measures that are based on the market priceof the shares. These measures help measure thevalue created in the capital markets for theshareholders. In this paper these measures areclassified under the heading of financial marketbased value measures. In case of companies that

ww
w.In
dia
nJo
urn
als.
com
Mem
ber
s C
op
y, N
ot
for
Co
mm
erci
al S
ale
Do
wn
load
ed F
rom
IP -
115
.248
.73.
67 o
n d
ated
30-
No
v-20
10Understanding Value Creation: The Shareholder Value Perspective
Figure : 3 Classification of Shareholder Value Measures
Where? is the number ofyears for which the sharewas held by the shareholder.
HPY= HPR-l
Market to Book Ratio (MB) measures the ratio ofmarket value of a share to its book value. Bookvalue of a share is the net worth divided by numberof outstanding shares. It represents the moneyswhich the company has received from itsshareholders and includes investments made bythe company on their behalf by retaining profits(internal accruals). MB ratio is calculated as givenbelow:
shareholder wealth is created, HPR of I means thatneither wealth is created nor destroyed, HPR ofless than I means that shareholder wealth isdestroyed. HPR of zero means that shareholder haslost all his investment.
PE = [Market Price Per Share / EarningsPer Share].
A high PE ratio generally indicates that the investorsthink that the company is performing well andexpect the long term return on investments to behigh due to high growth. A higher level of PE ratiothan past may also indicate more gains to existingshareholders who have invested into the sharesearlier. High PE can also result because of atemporary depression in earnings.
HPR actually measures wealth created for the periodfor which investment is held by the shareholder.Shareholders prefer to measure wealth created inpercentage terms on an annual basis. This iscalculated as Holding Period Yield (HPY) as givenbelow:
Price Earnings Ratio (PE) is another importantmeasure of shareholder wealth that is most popular.It represents the price that the investors are preparedto pay for the share for every rupee of earningsmade by the Company. It is calculated as follows:
Annual HPY = (HPR)_I/n_ J
Value basedmanagement measures(VBM)
Accountingmeasures
'-_""'! Intrinsic valuemeasures
Financial marketprice based measures
Financial marketprice based measures
HPR will always be equal to or greater than zero.A HPR value of greater than I means that
Holding Period Return (HPR) is a very popularmeasure of shareholder wealth. It is calculated,based on the change in the market price of aninvestment over the period for which it is held. Theformula for calculating HPR as suggested by Reilly& Brown (2008) is as follows:
HPR = (Ending value of investment) / (Beginningvalue of investment)
are unlisted, no market price is available andfinancial market based value measures cannot becalculated. Hence, shareholder value in such casesis measured using the accounting information andexpected performance. These measures are knownas intrinsic value measures. These measures canalso be calculated for the listed companies. Theintrinsic value measures measure the value createdby the management of the company throughefficient management of resources. It is expectedthat the value created for the shareholders in thecapital markets is derived from the intrinsic valuecreated by the management of the company. Thedifferent measures generally used to measure returnsto the shareholders are given in Figure 3 followedby a brief explanation of the measures and theircalculation.
17

ww
w.In
dia
nJo
urn
als.
com
Mem
ber
s C
op
y, N
ot
for
Co
mm
erci
al S
ale
Do
wn
load
ed F
rom
IP -
115
.248
.73.
67 o
n d
ated
30-
No
v-20
10LBS Journal of Management & Research
MB ratio =[Market Price Per Share / Book ValuePer Share}.
company is criticised and regarded as impracticalfor the following reasons:
•
•
•
•
Share prices of a company quoted in thestock market are an external assessment ofthe company's performance and health.They do not reflect actual performance ofthe company. It is an assessment ofcorporate performance against expectationsof the investors. Thus, they can severelypenalise the best performing company, andreward a company whose performance islow or average based on expectations(Koller et. al., 2005).
Stock market investors have limitedinformation about company's performanceand prospects, based on which they quoteprices in the market. The share price is thusa subjective statement of beliefs about thefuture and represents a perception (that is oneof many possible perceptions) about thecompany's prospects (Knight, 1998). It candeviate from the true value created by thecompany.
Too much offocus on maximising share pricesof the company can make managers feed themarket with misleading and fraudulentinformation to achieve their goals.
Moreover, the share prices in the short termare driven more by differences betweenactual performance and market expectationsand by changes in this expectations, thanby the level of performance per se.companies that consistently meet the highperformance expectations but don't exceedthemhave difficulty delivering high returns.The market may believe that managementis doing an outstanding job, but its approvalhas already been factored at the share price(Koller and Dobbs, 1998).
Intrinsic value measures
Intrinsic value measures used for measuringshareholder value can be classified in two differentgroups. They are:
It measures the value which the market perceivesthe company has created and has the potential tocreate. It is an absolute measure of shareholderwealth.
Market Value Added (MVA) is a measure ofshareholder wealth popularised by Stern Stewart&Co. It is calculated asfollows:
MVA = [Market Value of Capital EmployedIncluding Debt and Equity - Invested Capital}.
While all the above measures are used to measureshareholder wealth, the Holding period return, HPYmeasure the actual returns of an investment made inthe security for the specified period, taking intoaccount interim cash returns to shareholder. Othermeasures, like PE, MB ratio, MVA measure thewealth created by a company over the years andalso the perception of the future wealth creationpotential of the company (by the investors) for itsshareholders. This is because these measures use thebook value of capital invested which quantifies allthe investments made by the shareholders in thecompany till date and market price of share which isa reflection of expectations of the investors aboutthe \uture performance potential of the company andthe value of intangibles.
Thus, the corporate goal ofmaximising shareholdervalue means that corporate managers should worktowards increasing the market prices of shares.
Share Price or market prices of the shares of acompany are used to measure the wealth createdby a company for its shareholders. However, theuse of share prices to measure performance of a
MB ratio shows how the company is worthfor everyone rupee of shareholders money employed ascapital in the company. An MB ratio ofmore than1 means the company has added more value toshareholders than the capital contributed by themand vice versa.
• Accounting based measures, and18
ww
w.In
dia
nJo
urn
als.
com
Mem
ber
s C
op
y, N
ot
for
Co
mm
erci
al S
ale
Do
wn
load
ed F
rom
IP -
115
.248
.73.
67 o
n d
ated
30-
No
v-20
10Understanding Value Creation: The ShareholderValue Perspective
ROI is calculated as:
Return on Investment (ROI)
Return on Equity (ROE)
EPS - Earnings per Share
Dividend per share is measured as the total dividenddeclared by the company for the accounting periodupon the number of outstanding shares. It is theactual payment received by the shareholders. It isonly a measure of partial wealth for theshareholders. Shareholders total returns oninvestment comprise of both dividend and capitalreturns. Dividend yield is measured as follows:
Another problem of the ROJ and ROE is that it isimpossible to compare the returns for the knowledgecompany with that of an Industrial Company. Theindustrial company invests a lot in the fixed assets,while the knowledge company spends a lot ontraining, research, information but a smallpercentage is capitalized/ (Rappaport, 2001).
Dividend Per Share and Dividend Yield
It measures the dividend returns to a shareholderwho invests in the stock at current market prices.
Dividend Yield = [Dividend per Share!Market Price].
Since ROE is similar to ROJ, it has all thedisadvantages as ROI. Further, ROE is very sensitiveto the leverage and can give a misleading pictureof value created. ROE will increase as more thanoptimal debt is issued for financing at a rate lessthan return on investment. However, excessleverage actually contributes to financial risk and,the risk adjusted value decreases. So the ROE andshareholder value criterion is in conflict here.
Where shareholders'equity refers to the aggregateof paid up capital and reserves and surplusappearing as a part of shareholders' funds. Netincome is the profit after taxes and preferencedividend.
Value based management measures .•
ROI is one of the most popular measures used bythe companies for evaluating their performance. Itis also reported in the annual accounts as one ofthe key measures of success. It is also one of themain measures ofthe divisional performance.
Earnings per share = [Profits After Taxes andPreference Dividend/No. of Outstanding Shares].
ROI =[Net income + Interest (1 - tax rate)/ BookValue ofAssets].
Earnings per share represent the profits earned bythe Company and available for distribution to theshareholders for the accounting period. It iscalculated as given below:
Though Return on Investment is a popular measureincrease in ROJ is no guarantee of shareholder valuecreation. Only if ROJ exceeds the cost of capitalfor the company, shareholder value is created..Further ROJ is criticised as follows:
Traditional measures used to measure shareholdervalue are based on data drawn from the auditedaccounting records of the company. They includemeasures, like the Earnings per Share, Return onInvestment, Return on Equity, Dividend per Shareand Dividend Yield. A critical evaluation of thesemeasures is given below:
Accounting based measures
ROE measures the returns to providers ofequity funds. It is calculated as given below:
ROE = [Net Income / Book Value ofShareholders' Equity].
All the accounting measures discussed above arecriticised by different authors as measures notsuitable for measuring performance with theobjective of value enhancement. Ehrbar andStewart (1999) criticize these measures from theCEO's point of view, particularly, the rationale ofconnection of the CEO or CFO's bonuses to these
19
ww
w.In
dia
nJo
urn
als.
com
Mem
ber
s C
op
y, N
ot
for
Co
mm
erci
al S
ale
Do
wn
load
ed F
rom
IP -
115
.248
.73.
67 o
n d
ated
30-
No
v-20
10LBS Journal of Management & Research
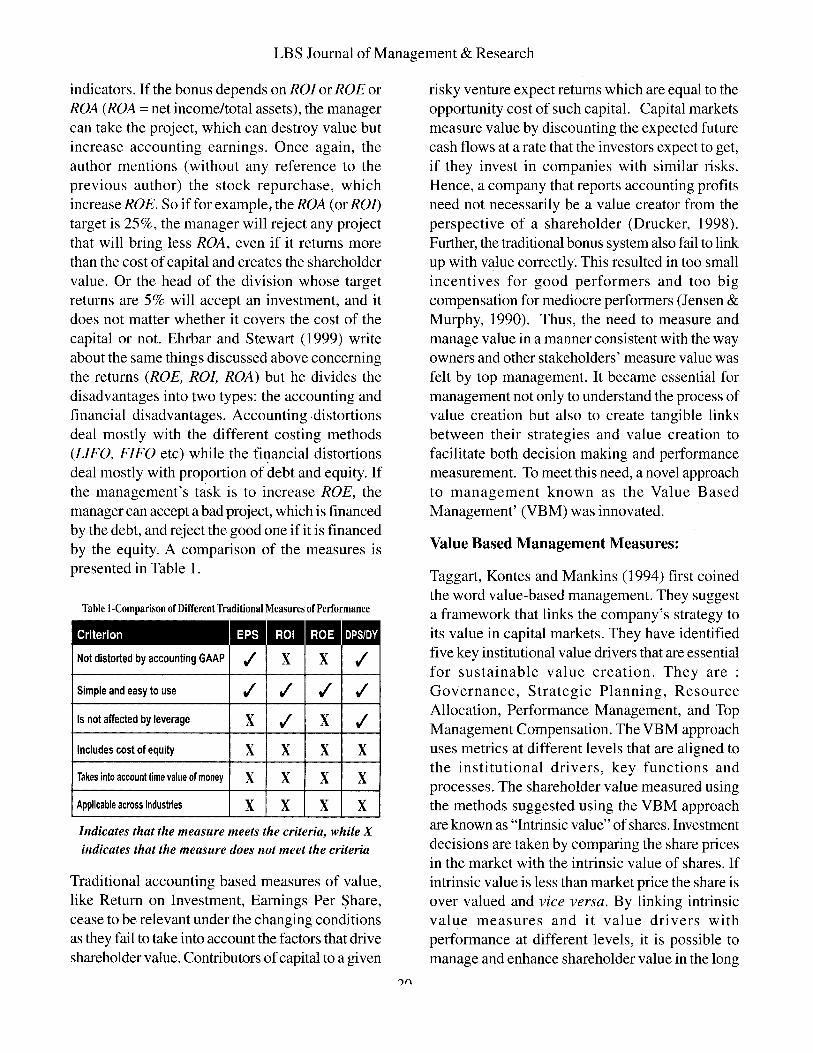
Indicates that the measure meets the criteria, while X
indicates that the measure does not meet the criteria
Traditional accounting based measures of value,like Return on Investment, Earnings Per Share,cease to be relevant under the changing conditionsas they fail to take into account the factors that driveshareholder value. Contributors ofcapital to a given
indicators. If the bonus depends on ROI or ROE orROA (ROA =net income/total assets), the managercan take the project, which can destroy value butincrease accounting earnings. Once again, theauthor mentions (without any reference to theprevious author) the stock repurchase, whichincrease ROE. So if for examplet the ROA (or ROJ)target is 25%, the manager will reject any projectthat will bring less ROA, even if it returns morethan the cost of capital and creates the shareholdervalue. Or the head of the division whose targetreturns are 5% will accept an investment, and itdoes not matter whether it covers the cost of thecapital or not. Ehrbar and Stewart (1999) writeabout the same things discussed above concerningthe returns (ROE, ROI, ROA) but he divides thedisadvantages into two types: the accounting andfinancial disadvantages. Accounting .distortionsdeal mostly with the different costing methods(LIFO, FIFO etc) while the fi~ancial distortionsdeal mostly with proportion of debt and equity. Ifthe management's task is to increase ROE, themanager can accept a bad project, which is financedby the debt, and reject the good one if it is financedby the equity. A comparison of the measures ispresented in Table 1.
Value Based Management Measures:
Taggart, Kontes and Mankins (1994) first coinedthe word value-based management. They suggesta framework that links the company's strategy toits value in capital markets. They have identifiedfive key institutional value drivers that are essentialfor sustainable value creation. They are :Governance, Strategic Planning, ResourceAllocation, Performance Management, and TopManagement Compensation. The VBM approachuses metrics at different levels that are aligned tothe institutional drivers, key functions andprocesses. The shareholder value measured usingthe methods suggested using the VBM approachare known as "Intrinsic value" of shares. Investmentdecisions are taken by comparing the share pricesin the market with the intrinsic value of shares. Ifintrinsic value is less than market price the share isover valued and vice versa. By linking intrinsicvalue measures and it value drivers withperformance at different levels, it is possible tomanage and enhance shareholder value in the long
risky venture expect returns which are equal to theopportunity cost of such capital. Capital marketsmeasure value by discounting the expected futurecash flows at a rate that the investors expect to get,if they invest in companies with similar risks.Hence, a company that reports accounting profitsneed not necessarily be a value creator from theperspective of a shareholder (Drucker, 1998).Further, the traditional bonus system also fail to linkup with value correctly. This resulted in too smallincentives for good performers and too bigcompensation for mediocre performers (Jensen &Murphy, 1990). Thus, the need to measure andmanage value in a manner consistent with the wayowners and other stakeholders' measure value wasfelt by top management. It became essential formanagement not only to understand the process ofvalue creation but also to create tangible linksbetween their strategies and value creation tofacilitate both decision making and performancemeasurement. To meet this need, a novel approachto management known as the Value BasedManagement' (VBM) was innovated.
oTt -X X ~
~ ~ ~
~ X ~
X X X
X X X
X X X
Not distorted by accounting GAAP I ~-
Simple and easy to use ~
Is not affected by leverage X
Includes cost of equity X
Takes into accounllime value of money X
Applicable across industries X
Criterion EPS
')()
ww
w.In
dia
nJo
urn
als.
com
Mem
ber
s C
op
y, N
ot
for
Co
mm
erci
al S
ale
Do
wn
load
ed F
rom
IP -
115
.248
.73.
67 o
n d
ated
30-
No
v-20
10Understanding Value Creation: The Shareholder Value Perspective
run. The different definitions of shareholder valueusing the intrinsic value measure approach bydifferent authors and method adopted for itsmeasurement are given below:
Shareholder value is defined by Rappaport (200 I)as "The total economic value of an equity. Thisvalue of the Company is known as the corporatevalue while the value of the equity portion is namedshareholder value". The value of a company canbe represented in the form of equation as givenbelow:
Corporate Value = [Value of Debt +Shareholder Value].
Equation (I) above can be rearranged to arrive atthe shareholder value as given below:
Shareholder value = [Corporate Value Value of Debt].
In this formula the value of debt represents themarket value of debt, unfounded pension liabilitiesand also the market value of other claims such aspreference shares. The corporate value is the valueof the total firm or business unit. It is calculated asthe aggregate of the following components:
• The present value of cash flows fromoperations during the forecast period.
• "Residual value", which represents thevalue of the business attributable to theperiod beyond the forecast period.
• The current value of marketablesecurities and other investments that canbe converted to cash and are notessential to operating business.
The above method of arriving at the shareholdervalue of a Company is also known as the discountedcash flow method (DCF).
Other authors who have defined shareholder valueinclude "value as being the difference between thecorporate value and debt whereby the corporatevalue is the sum of the future or free cash flowsdiscounted at the WACC". The free cash flowsthemselves are made up of the individual cash flows
21
for each year of the growth duration or competitiveadvantage period or the residual value. Thus, cashflow is named free in the sense that it could bedistributed to shareholders. The consulting firmshave attempted to define shareholder value as beingthe sum of discounted value of all cash flow fromthe Company to the owner, including what isdistributed when the Company is sold or dissolved.
Sensing the need for a comprehensive metric formeasurement and management of shareholdervalue, metrics were devised, such as EconomicValue Added (EVA). Cash Flow Return onInvestment (CFROI), Shareholder Value Added(SVA), Economic profits and Economic Earnings,etc. All the above metrics are rooted in the conceptthat reported earnings are subject to accountingdistortions and do not take iq,to account the totalcost of capital. Hence, financial performancemeasure used to measure intrinsic value of sharemust look at the returns that exceed the total cost ofcapital. Each metric also uses the principles ofDiscounted Cash Flow (Myers, 1996). Whileeconomic profits and economic earnings are variantsof EVA, the other two metrics differ in theircalculations. The meaning, calculation of some ofthe important metrics given above along with theirrelative merits and demerits are given below.
Economic Value Added (EVA)
EVA is trade marked measure of shareholder value.It is aimed to be a measure that tells what hashappened to the wealth of shareholders. EVA isbased on the concept that earning a return greaterthan the cost of capital increases value (of acompany), and earning less destroys value. It iscalculated as:
Economic Value Added = [NOPAT (Invested Capital x WACC)].
Where, NOPAT =Net operating cash profits ofthecompany after taxes but before any Interestexpenditure, WACC = weighted average cost ofcapital ofthe company.
ww
w.In
dia
nJo
urn
als.
com
Mem
ber
s C
op
y, N
ot
for
Co
mm
erci
al S
ale
Do
wn
load
ed F
rom
IP -
115
.248
.73.
67 o
n d
ated
30-
No
v-20
10LBS Journal of Management & Research
Invested capital = the economic capital invested inthe business includes both equity and debt but doesnot include non-interest bearing current liabilities.
Weighted average cost of capital (WACC) iscalculated as:
WACC = [Cost of Equity x Proportion of equityfrom capital + Cost of debt x Proportion ofdebtfrom capital x (I -tax rate)}.
Economic profit is excess of NOPAT over a capitalcharge, Capital Charge represents invested capitaland WACC. In other words, economic profit is theprofits (or returns) the company must generate inorder to satisfy the lenders and shareholders whohave "rented" capital to the company.
Cashjlow return on investment (CFROI)
Cash Flow Return on Investments, or CFROI, is ameasure of Company performance developed andtrademarked by Holt Value and Associates. It isbased on the assumption that a company can bemodelled as a project that generates cash over theuseful life of its underlying assets and investments.
Under this framework, CFROI is the implied return onthese cash flows, or equivalently, the implied discountrate in the discounted cash flow model in which:
• The initial cash outlay is the amountrequired to replicate the asset base (bothdepreciable and non-depreciable) of thecompany, and
• The terminal cash flow includes theliquidation value ofthe company's nondepreciable assets.
Shareholder value added (SVA)
Shareholder value added is a measure that is similarto the DCF method of arriving at shareholder value.The DCF method arrives at the economic valueresulting from the forecasted scenario whileshareholder value added measures the change invalue over the forecast period. It is calculated as(Rappaport, 2001):
22
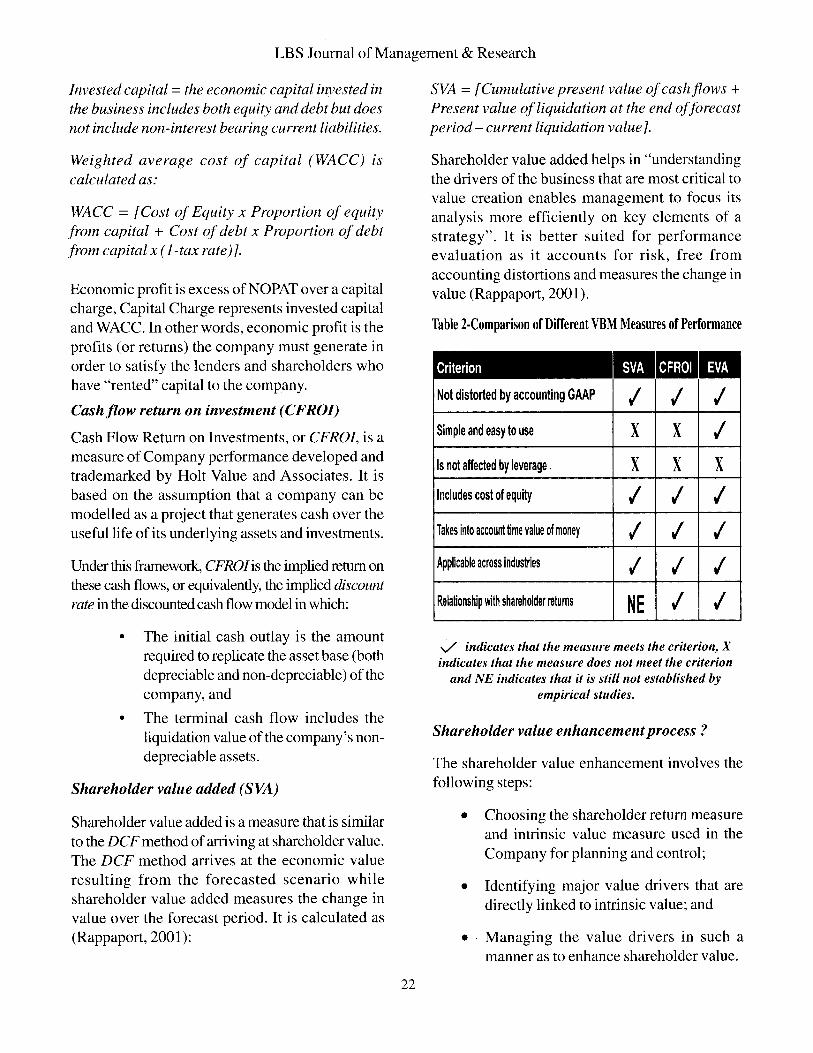
SVA =[Cumulative present value ofcash flows +Present value ofliquidation at the end offorecastperiod - current liquidation value}.
Shareholder value added helps in "understandingthe drivers of the business that are most critical tovalue creation enables management to focus itsanalysis more efficiently on key elements of astrategy". It is better suited for performanceevaluation as it accounts for risk, free fromaccounting distortions and measures the change invalue (Rappaport, 2001).
Table 2·Comparison of Different VBM Measures of Performance
Criterion
Not distorted by accounting GAAP I I I I I I-
Simple and easy to use I X I X IIs not affected by leverage, X X XIncludes cost of equity I I ITakes into account time value of money I I IApplicable across industries I I IRelalionship with shareholder returns I NE I I
V indicates that the measure meets the criterion, Xindicates that the measure does not meet the criterion
and NE indicates that it is still not established byempirical studies.
Shareholder value enhancementprocess?
The shareholder value enhancement involves thefollowing steps:
• Choosing the shareholder return measureand intrinsic value measure used in theCompany for planning and control;
• Identifying major value drivers that aredirectly linked to intrinsic value; and
• Managing the value drivers in such amanner as to enhance shareholder value.
ww
w.In
dia
nJo
urn
als.
com
Mem
ber
s C
op
y, N
ot
for
Co
mm
erci
al S
ale
Do
wn
load
ed F
rom
IP -
115
.248
.73.
67 o
n d
ated
30-
No
v-20
10
Understanding Value Creation: The Shareholder Value Perspective
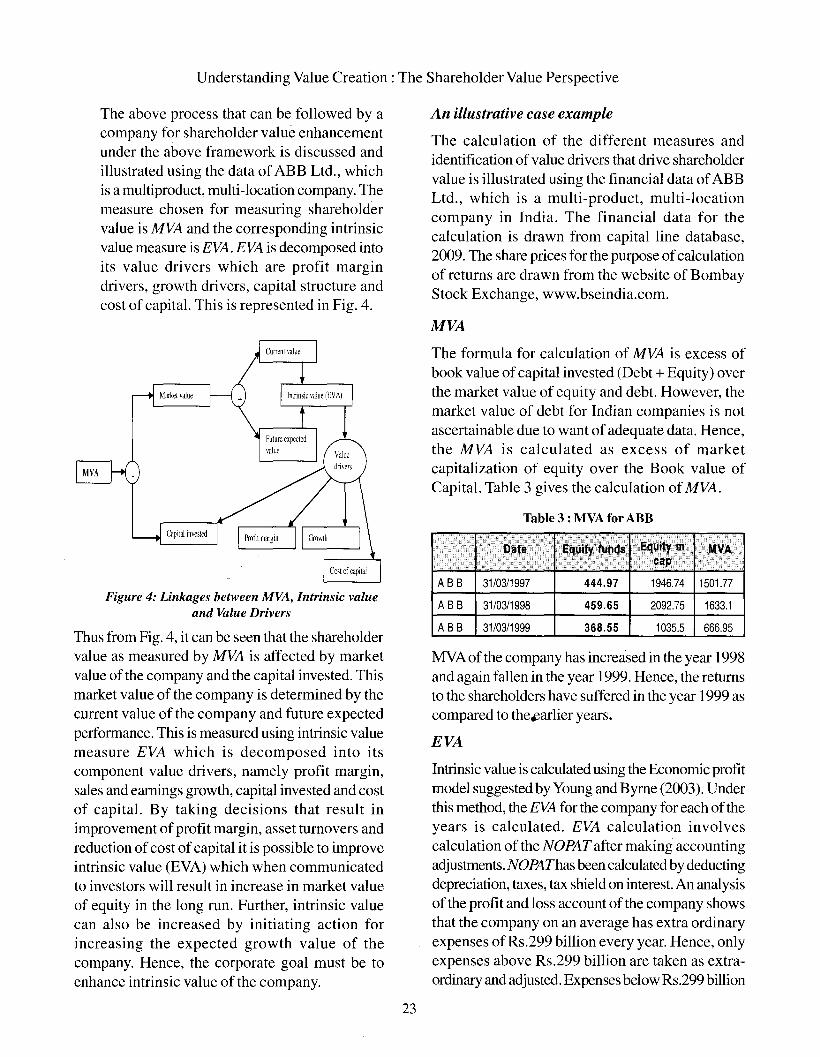
The above process that can be followed by acompany for shareholder value enhancementunder the above framework is discussed andillustrated using the data of ABB Ltd., whichis a multiproduct, multi-location company. Themeasure chosen for measuring shareholdervalue is MVA and the corresponding intrinsicvalue measure is EVA. EVA is decomposed intoits value drivers which are profit margindrivers, growth drivers, capital structure andcost of capital. This is represented in Fig. 4.
An illustrative case example
The calculation of the different measures andidentification ofvalue drivers that drive shareholdervalue is illustrated using the financial data ofABBLtd., which is a multi-product, multi-locationcompany in India. The financial data for thecalculation is drawn from capital line database,2009. The share prices for the purpose ofcalculationof returns are drawn from the website of BombayStock Exchange, www.bseindia.com.
MVA
Table 3 : MVA for ABB
The formula for calculation of MVA is excess ofbook value ofcapital invested (Debt + Equity) overthe market value of equity and debt. However, themarket value of debt for Indian companies is notascertainable due to want of adequate data. Hence,the MVA is calculated as excess of marketcapitalization of equity over the Book value ofCapital. Table 3 gives the calculation of MVA.
2092.75 1633.1
1946.74 1501.77
459.65
444.97
A BB 31/03/1998
A BB 31/03/1997Figure 4: Linkages between MVA, Intrinsic value
and Value Drivers
EVA
MVA ofthe company has increased in the year 1998and again fallen in the year 1999. Hence, the returnsto the shareholders have suffered in the year 1999 ascompared to theearlier years.
Intrinsic value is calculated using the Economic profitmodel suggested by Young and Byrne (2003). Underthis method, the EVA for the company for each oftheyears is calculated. EVA calculation involvescalculation of the NOPAT after making accountingadjustments. NOPAThas been calculated by deductingdepreciation, taxes, tax shield on interest. An analysisof the profit and loss account of the company showsthat the company on an average has extra ordinaryexpenses ofRs.299 billion every year. Hence, onlyexpenses above Rs.299 billion are taken as extraordinary and adjusted. Expenses below Rs.299 billion
Thus from Fig. 4, it can be seen that the shareholdervalue as measured by MVA is affected by marketvalue of the company and the capital invested. Thismarket value of the company is determined by thecurrent value of the company and future expectedperformance. This is measured using intrinsic valuemeasure EVA which is decomposed into itscomponent value drivers, namely profit margin,sales and earnings growth, capital invested and costof capital. By taking decisions that result inimprovement of profit margin, asset turnovers andreduction of cost of capital it is possible to improveintrinsic value (EVA) which when communicatedto investors will result in increase in market valueof equity in the long run. Further, intrinsic valuecan also be increased by initiating action forincreasing the expected growth value of thecompany. Hence, the corporate goal must be toenhance intrinsic value of the company.
A BB 31/03/1999 368.55 1035.5 666.95
23
ww
w.In
dia
nJo
urn
als.
com
Mem
ber
s C
op
y, N
ot
for
Co
mm
erci
al S
ale
Do
wn
load
ed F
rom
IP -
115
.248
.73.
67 o
n d
ated
30-
No
v-20
10LBS Journal of Management & Research
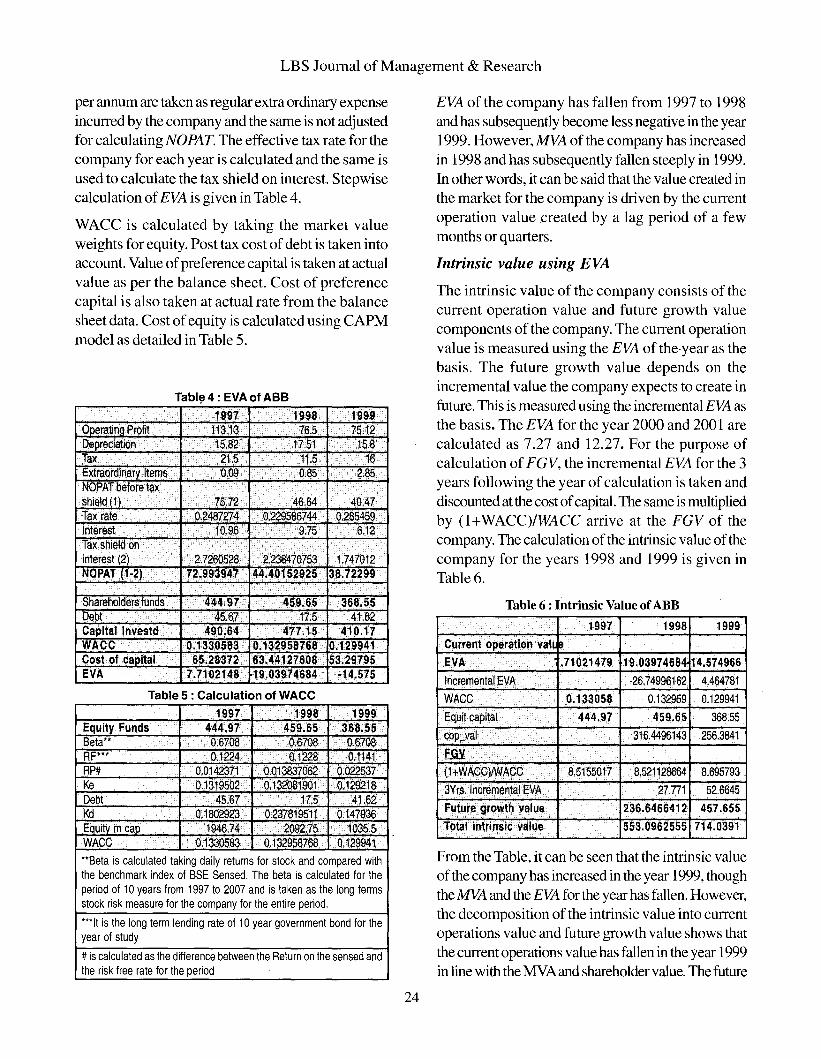
per annum are taken as regular extra ordinary expenseincurred by the company and the same is not adjustedfor calculating NOPAT. The effective tax rate for thecompany for each year is calculated and the same isused to calculate the tax shield on interest. Stepwisecalculation ofEVA is given in Table 4.
WACC is calculated by taking the market valueweights for equity. Post tax cost of debt is taken intoaccount. Value ofpreference capital is taken at actualvalue as per the balance sheet. Cost of preferencecapital is also taken at actual rate from the balancesheet data. Cost ofequity is calculated using CAPMmodel as detailed in Table 5.
17Equity Funds 4 7 4 3Beta**RF***RP# 0.0 0.(Ke 0.1 n 0.'DebtKd O. Jj!l:Jj!; 0.1479Eauitv mcaD 146.7;
n~1'13:
WACC o. 3058: 0.1299**Beta is calculated taking daily returns for stock and compared withthe benchmark index of BSE Sensed. The beta is calculated for theperiod of 10 years from 1997 to 2007 and is taken as the long termsstock risk measure for the company for the entire period.
***It is the long term lending rate of 10 year government bond for theyear of study
#is calculated as the difference between the Return on the sensed andthe risk free rate for the period
Table 5 : Calculation of WACC
1997 1998 1999
19.03974684 14.574966
-26.74996162 4.464781
0.132959 0.129941
368.55
256.3841
8.695793
52.6645
457.655
553.0962555 714.0391
EVA of the company has fallen from 1997 to 1998and has subsequently become less negative in the year1999. However, MVA of the company has increasedin 1998 and has subsequently fallen steeply in 1999.In other words, it can be said that the value created inthe market for the company is driven by the currentoperation value created by a lag period of a fewmonths or quarters.
Intrinsic value using EVA
The intrinsic value of the company consists of thecurrent operation value and future growth valuecomponents of the company. The current operationvalue is measured using the EVA of the·year as thebasis. The future growth value depends on theincremental value the company expects to create infuture. This is measured using the incremental EVA asthe basis. The EVA for the year 2000 and 2001 arecalculated as 7.27 and 12.27. For the purpose ofcalculation of FGV, the incremental EVA for the 3years following the year of calculation is taken anddiscounted at the cost ofcapital. The same is multipliedby (l+WACC)IWACC arrive at the FGV of thecompany. The calculation of the intrinsic value of thecompany for the years 1998 and 1999 is given inTable 6.
From the Table, it can be seen that the intrinsic valueofthe company has increased in the year 1999, thoughthe MVA and the EVA for the year has fallen. However,the decomposition of the intrinsic value into currentoperations value and future growth value shows thatthe current operations value has fallen in the year 1999in line with the MYA and shareholder value. The future
Table 6 : Intrinsic Value ofABB
16
6.12
15.8
2.85
40.47
41.62
75.121999
410.17
368.55
-14.575
0.285459
1.747012
0.12994153.29795
~8.72299
6517.5
477.150.13295876863.4412760819.03974684
1997 I 1998
0.09 I 0.85
113.13 I 76.5
490.64
444.9745.67
65.283720.1330583
7.7102148
Tax rate
Shareholders funds
ax
Tabl~ 4: EVA of ABB
Cost of caDital
Ooeratina Profit
Capital Investd
Extraordinary Items
Depreciation
EVA
Tax shielo oninterest (2)
NOPATbefore taxshield 11
Debt
NOPAT (1-2)
WACC
Interest
24
ww
w.In
dia
nJo
urn
als.
com
Mem
ber
s C
op
y, N
ot
for
Co
mm
erci
al S
ale
Do
wn
load
ed F
rom
IP -
115
.248
.73.
67 o
n d
ated
30-
No
v-20
10Understanding Value Creation: The Shareholder Value Perspective
growth value, however, has increased. Hence, theincrease in future growth value is attributed to the actual
increment in EVA achieved by the company in thesubsequent years.
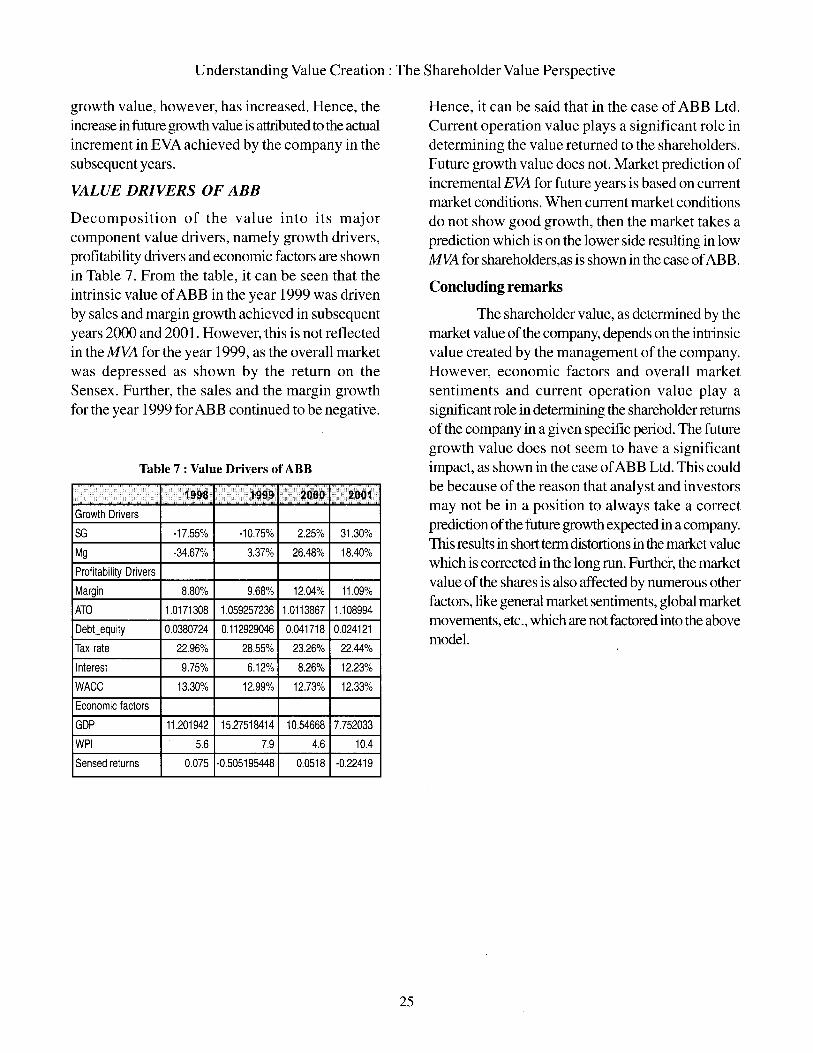
VALUE DRIVERS OF ABB
Decomposition of the value into its majorcomponent value drivers, namely growth drivers,
profitability drivers and economic factors are shownin Table 7. From the table, it can be seen that theintrinsic value ofABB in the year 1999 was drivenby sales and margin growth achieved in subsequentyears 2000 and 2001. However, this is not reflectedin the MVA for the year 1999, as the overall marketwas depressed as shown by the return on the
Sensex. Further, the sales and the margin growthfor the year 1999 for ABB continued to be negative.
Table 7 : Value Drivers of ABB
<~~~~ ....~ ..~~.~ ... I~~~' ....~.~~.~ ...
Growth Drivers
SG -17.55% -10.75% 2.25% 31.30%
Mg -34.67% 3.37% 26.48% 18.40%
Profitability Drivers
Margin 8.80% 9.68% 12.04% 11.09%
ATO 1.0171308 1.059257236 1.0113867 1.108994
Debt_equity 0.0380724 0.112929046 0.041718 0.024121
Tax rate 22.96% 28.55% 23.26% 22.44%
Interest 9.75% 6.12% 8.26% 12.23%
WAGG 13.30% 12.99% 12.73% 12.33%
Economic factors
GDP 11.201942 15.27518414 10.54668 7.752033
WPI 5.6 7.9 4.6 10.4
Sensed returns 0.075 -0.505195448 0.0518 -0.22419
25
Hence, it can be said that in the case of ABB Ltd.Current operation value plays a significant role indetermining the value returned to the shareholders.Future growth value does not. Market prediction ofincremental EVA for future years is based on currentmarket conditions. When current market conditionsdo not show good growth, then the market takes aprediction which is on the lower side resulting in lowMVA for shareholders,as is shown in the case ofABB.
Concluding remarks
The shareholder value, as determined by themarket value ofthe company, depends on the intrinsicvalue created by the management of the company.However, economic factors and overall marketsentiments and current operation value playasignificant role in determining the shareholder returnsof the company in a given specific period. The futuregrowth value does not seem to have a significantimpact, as shown in the case ofABB Ltd. This couldbe because ofthe reason that analyst and investorsmay not be in a position to always take a correctprediction ofthe future growth expected in a company.This results in short term distortions in the market valuewhich is corrected in the long run. Further, the marketvalue ofthe shares is also affected by numerous otherfactors, like general market sentiments, global marketmovements, etc., which are not factored into the abovemodel.
ww
w.In
dia
nJo
urn
als.
com
Mem
ber
s C
op
y, N
ot
for
Co
mm
erci
al S
ale
Do
wn
load
ed F
rom
IP -
115
.248
.73.
67 o
n d
ated
30-
No
v-20
10LBS Journal of Management & Research
Reference:
1. Drucker P (1998), The InformationExecutives Truly Need to Know, HarvardBusiness Review on Measuring CorporatePerformance, Boston: Harvard BusinessSchool Press.
2. Ehrbar Al and Stewart III B (1999), "TheEVA Revolution." Journal of AppliedCorporate Finance, 12 (Summer 1999):18-31.
3. Jensen M C (2001), "Value maximization,Stakeholder theory, and the corporate objectivefunction", Journal of Applied CorporateFinance, Vol 14, No.3, pp. 8-21.
4. JensenM C and Murphy KJ (1990), "CEOIncentives: its'Not How MuchYou Pay, ButHow," Harvard Business Review, pp. 138153.
5. Kanter, R. M. (1994), 'CollaborativeAdvantage: Successful PartnershipsManage the Relationship, Not Just theDeal.' Harvard Business Review, Vol. 74No.4, pp. 96-108.
6. Kim, W. C. and R. Mauborgne (1997),'Value Innovation: The Strategic Logic ofHigh Growth', Harvard Business Review(January-February).
7. Koller T, Goedhart M and Wessels D(2005), Valuation: Measuring andManaging the Value ofCompanies, Wiley,McKinsey and Company.
8. Knight James A. (1998) Value BasedManagement: Developing a SystematicApproach to Creating Shareholder Value,New York, USA: Mc Graw-HillCompanys.
26
9. Koller Timothy and Dobbs Richard F(1998), The Expectations Treadmill, TheMcKinsey Quarterly, Number 3.
10. MyersR.(1996), "On EVA", CFO, Vol. 12,October 1996.
11. Porter, Michael E. (1985), CompetitiveAdvantages, The Free Press. New York.
12. Rappaport, Alfred (2001), CreatingShareholder Value: The New Standard forBusiness Performance, New York, USA:The Free Press, (A Division of Simon andSchuster INC.), ed.2.
13. Reilly F K and Brown K C (2008)Investment Analysis and PortfolioManagement, ed.8, South WesternCengage Learning.
14. Ross, S.A. (1973), The Economic Theoryof Agency: The Principal's Problem",American Economic. Review, May issue.
15. Simon, HerbertAA. (1996) "A Comparisonof Organisation Theories", The Review ofEconomic Studies, Vol. 20, pp 40- 48.
16. Taggart JM, Kontes P and Mankins M(1994), The Value Imperative: Managingfor Superior Shareholder Returns, NewYork: The Free press.
17. Young Sand O'Byrne, (2003), EVA andValue Based Management, Tata McGrawHill, New Delhi ed.l.