How does UK healthcare spending compare with other countries?
Upload
jon-thompsonCategory
view
221download
0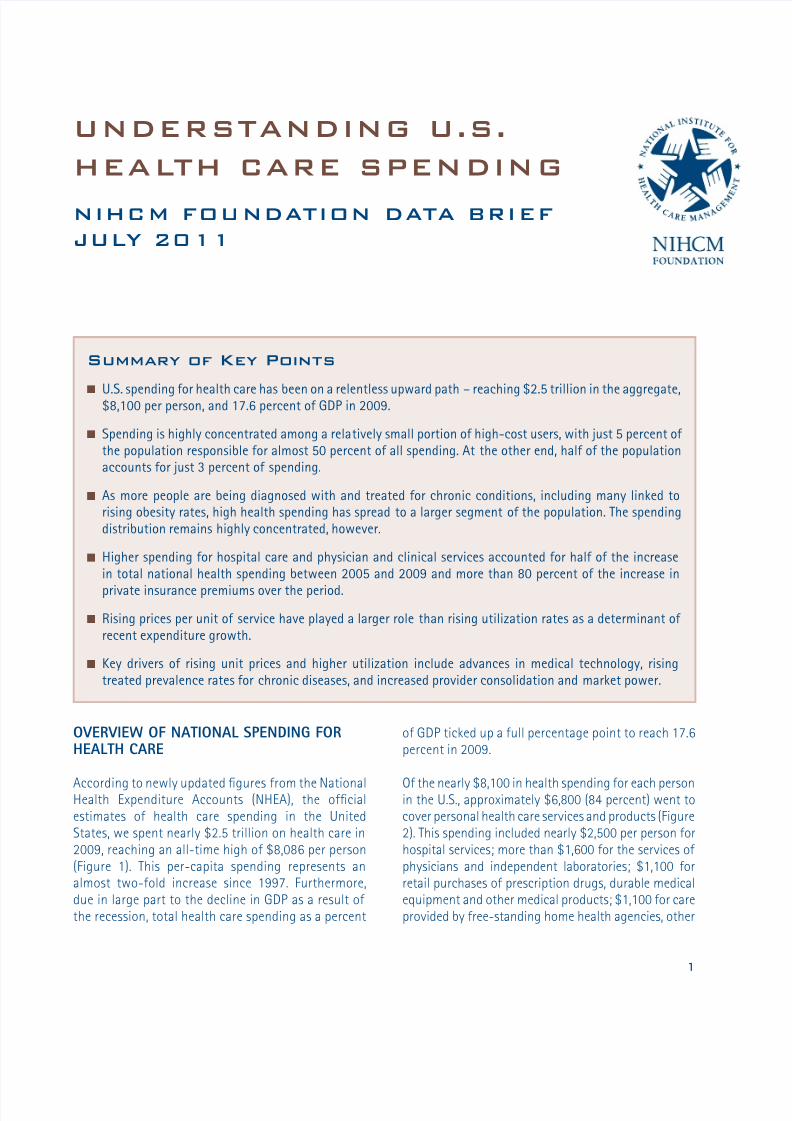
8/6/2019 Understanding US Healthcare Spending-July 2011- NIHCM
http://slidepdf.com/reader/full/understanding-us-healthcare-spending-july-2011-nihcm 1/15
Ovvw Of NONl SNN fOHlH C
According to newly updated gures from the NationalHealth Expenditure Accounts (NHEA), the ofcialestimates of health care spending in the UnitedStates, we spent nearly $2.5 trillion on health care in2009, reaching an all-time high of $8,086 per person(Figure 1). This per-capita spending represents analmost two-fold increase since 1997. Furthermore,due in large part to the decline in GDP as a result of the recession, total health care spending as a percent
of GDP ticked up a full percentage point to reach 17.6percent in 2009.
Of the nearly $8,100 in health spending for each personin the U.S., approximately $6,800 (84 percent) went tocover personal health care services and products (Figure2). This spending included nearly $2,500 per person forhospital services; more than $1,600 for the services of physicians and independent laboratories; $1,100 forretail purchases of prescription drugs, durable medicalequipment and other medical products; $1,100 for careprovided by free-standing home health agencies, other
UNDERSTANDING U.S.
HEALTH CARE SPENDING
NIHCM FUNDATIN DATA BRIEF
JUL 2011
1
Summary of Key Points
n U.S. spending for health care has been on a relentless upward path – reaching $2.5 trillion in the aggregate,$8,100 per person, and 17.6 percent of GDP in 2009.
n Spending is highly concentrated among a relatiely small portion of high-cost users, with just 5 percent of the population responsible for almost 50 percent of all spending. At the other end, half of the populationaccounts for just 3 percent of spending.
n As more people are being diagnosed with and treated for chronic conditions, including many linked torising obesity rates, high health spending has spread to a larger segment of the population. The spendingdistribution remains highly concentrated, howeer.
n Higher spending for hospital care and physician and clinical serices accounted for half of the increasein total national health spending between 2005 and 2009 and more than 80 percent of the increase in
priate insurance premiums oer the period.
n Rising prices per unit of serice hae played a larger role than rising utilization rates as a determinant of recent expenditure growth.
n Key driers of rising unit prices and higher utilization include adances in medical technology, risingtreated prealence rates for chronic diseases, and increased proider consolidation and market power.

8/6/2019 Understanding US Healthcare Spending-July 2011- NIHCM
http://slidepdf.com/reader/full/understanding-us-healthcare-spending-july-2011-nihcm 2/15
2
Understanding U.S. Health Care Spending
long-term care providers, and in other non-traditionalsettings; and about $550 for services of dentists andother non-physician health care professionals.a
The remaining 16 percent of national health spendingis for government-funded public health activities, theadministrative costs of public insurance programs, thenet cost of private insurance, and government andnon-commercial investments in health care research,
structures, and equipment.b
b The net cost of priate health insurance is dened as the differencebetween total premiums collected and the payments made on behalf of enrollees to coer all of their medical costs. As such, it includes alladministratie costs, rate credits and diidends paid to beneciariesand stockholders, taxes paid to the goernment, additions to reseres,and prots (or losses). Research and deelopment expenditures bycommercial (for-prot) manufacturers of drugs, medical equipmentand medical supplies are assumed to be recouped through productsales in these sectors and are captured in the spending reportedearlier for these sectors.
1997 1998 1999 2000 2001 2002 2003 2004 2005 2006 2007 2008 2009
13.7% 13.7% 13.8% 13.8% 14.5% 15.4% 15.9% 16.0% 16.0% 16.1% 16.2% 16.6% 17.6%% GDP
National Health Expenditures (trillions)
Per Capita Health Spending
0.0
0.5
1.0
1.5
2.0
2.5
3.0
$0
$4,000
$5,000
$6,000
$1,000
$2,000
$3,000
$7,000
$8,000
$9,000
1.11.2
1.31.4
1.5
1.6
1.8
1.9
2.0
2.2
2.3
2.4
2.5
$4,166$4,362
$4,599$4,878
$5,240
$5,682
$6,098
$6,458
$6,827
$7,198
$7,561
$7,845$8,086
FGUR 1. NATNA HATH PNDTURS, TTA, PR CAPTA, AND AS A PRCNT F GDP,1997-2009
Source: NHCM Foundation analysis of data from the National Health xpenditure Accounts, aailable at https://www.cms.go/NationalHealthxpendData/.
a Hospital serices include inpatient and hospital-based outpatient, homehealth, nursing home and hospice care, as well as the cost of inpatientpharmacy and resident physicians. Physician and clinical serices reectthe care proided by physicians (MDs and Ds) in their ofces and free-standing outpatient care settings and serices billed independentlyby laboratories. ther long-term care proiders include free-standingnursing homes and rehabilitation facilities and continuing careretirement communities with on-site nursing facilities (assisted liing).ther non-traditional settings and proiders include school and worksitehealth clinics, residential mental health/substance abuse treatmentcenters, some ambulance proiders, and serices proided throughMedicaid home and community-based waiers. ther non-physicianhealth care professionals include chiropractors, optometrists, podiatrists,priate-duty nurses, and physical, occupational and speech therapists.

8/6/2019 Understanding US Healthcare Spending-July 2011- NIHCM
http://slidepdf.com/reader/full/understanding-us-healthcare-spending-july-2011-nihcm 3/15
3
NIHCM Data Brief n July 2011
$8,086
Per Capita Spending on Personal Health Care$6,797 = 84% of total spending
[-------------------------------- --------------------------------]
Hospital Care
Dental & Other Professional Services
Prescription Drugs, DME & Other Medical Products
Public Health
Physician & Clinical Services
Home Health & Other LTC Facilities and Services
Public Program Administration and Net Cost of Private Health Insurance
Investment
2,471 1,646 548 1,066 1,066 530 251 508
FGUR 2. CMPNNTS F NATNA HATH SPNDNG PR CAPTA, 2009
Source: NHCM Foundation analysis of data from the National Health xpenditure Accounts, aailable at https://www.cms.go/NationalHealthxpendData/.
10
20
30
40
50
60
70
80
90
100
0
10 15.60 10020 30 40 50 60 70 80 90
95 99
0.0 0.1 0.5
3.1
6.0
11.0
19.8
36.4
100.0
79.8
52.5
1.4
C u m u l a t i v e P e r c e n t o f T o t a l S p e n d i n g
Percent of Civilian Non-Institutionalized Population Ordered by Health Care Spending Level
Source: NHCM Foundation analysis of data from the National Health xpenditure Accounts, aailable at https://www.cms.go/NationalHealthxpendData/.
FGUR 3. DSTRUTN F HATH CAR SPNDNG, 2008

8/6/2019 Understanding US Healthcare Spending-July 2011- NIHCM
http://slidepdf.com/reader/full/understanding-us-healthcare-spending-july-2011-nihcm 4/15
4
Understanding U.S. Health Care Spending
CONCNON Of SNN fO HlHC SvCS
Our analysis of data from the 2008 Medical Expenditure
Panel Survey (MEPS) illustrates the extent to whichspending for health care services is concentratedamong a small number of high-cost users. The MEPSdata reect payments from public and private third-party payers and out-of-pocket spending for healthcare services for the civilian, non-institutionalizedpopulation (and, thus, capture only a subset of thetotal national health spending reected in the NHEAdata). In 2008, the spending reported via MEPS totaled$1.15 trillion.
As shown in Figure 3, 15.6 percent of the civilian,non-institutionalized population had no health carespending at all in 2008 and the half of the populationwith the lowest spending accounted for only 3.1
percent of all expenditures. In contrast, 63.6 percentof all spending was incurred by the 10 percent of the population with the highest spending. The top 5percent of the population accounted for almost half (47.5 percent) of all spending, and the top 1 percentof the population was responsible for 20.2 percent of spending.
Mean annual expenditures were correspondinglyskewed as well, with those in the bottom half of
Lowest 50% Top 50% Top 30% Top 10% Top 5% Top 1%
$233
$7,317
$11,196
$23,992
$35,820
$76,476
$0
$10,000
$20,000
$30,000
$40,000
$50,000
$60,000
$70,000
$80,000
FGUR 4. MAN PNDTUR PR PRSN, FRM T HGH SPNDNG GRUPS, 2008
Source: NHCM Foundation analysis of data from the 2008 Medical xpenditure Panel Surey, aailable at http://www.meps.ahrq.go/mepsweb/data_stats/meps_query.jsp
8/6/2019 Understanding US Healthcare Spending-July 2011- NIHCM
http://slidepdf.com/reader/full/understanding-us-healthcare-spending-july-2011-nihcm 5/15
5
NIHCM Data Brief n July 2011
the spending distribution incurring an average of just $233 in spending per person during 2008 whilethose in the top half of spending had mean per capitaspending of $7,317 (Figure 4). For those in the top 10,
top 5, and top 1 percent of spending, these guresincreased exponentially to $23,992, $35,820, and$76,476, respectively.
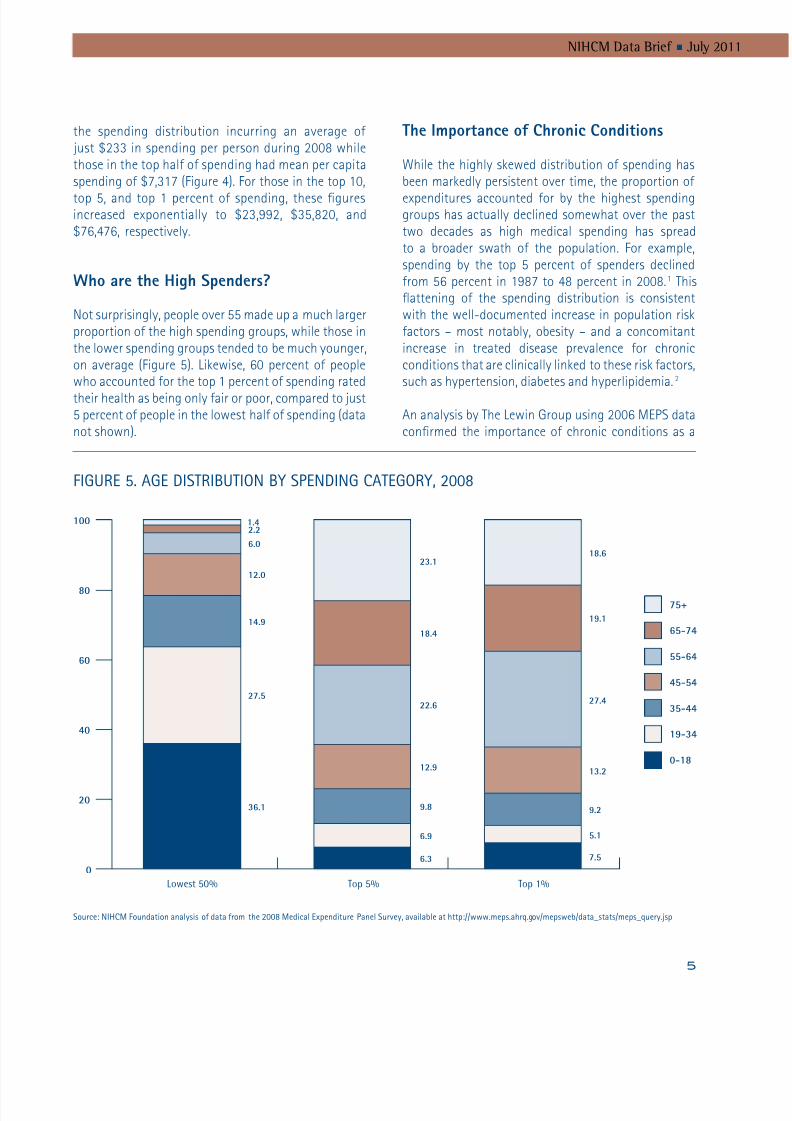
who are the High Spenders?
Not surprisingly, people over 55 made up a much largerproportion of the high spending groups, while those inthe lower spending groups tended to be much younger,on average (Figure 5). Likewise, 60 percent of peoplewho accounted for the top 1 percent of spending ratedtheir health as being only fair or poor, compared to just5 percent of people in the lowest half of spending (datanot shown).
he mportance o Chronic Conditions
While the highly skewed distribution of spending hasbeen markedly persistent over time, the proportion of
expenditures accounted for by the highest spendinggroups has actually declined somewhat over the pasttwo decades as high medical spending has spreadto a broader swath of the population. For example,spending by the top 5 percent of spenders declinedfrom 56 percent in 1987 to 48 percent in 2008.1 Thisattening of the spending distribution is consistentwith the well-documented increase in population riskfactors – most notably, obesity – and a concomitantincrease in treated disease prevalence for chronicconditions that are clinically linked to these risk factors,such as hypertension, diabetes and hyperlipidemia.2
An analysis by The Lewin Group using 2006 MEPS dataconrmed the importance of chronic conditions as a
Lowest 50% Top 5% Top 1%
0
20
40
60
80
100 1.42.2
6.0
12.0
14.9
27.5
36.1
6.3
6.9
9.8
12.9
22.6
18.4
23.1
7.5
5.1
9.2
13.2
27.4
19.1
18.6
75+
65-74
55-64
45-54
35-44
19-34
0-18
FGUR 5. AG DSTRUTN SPNDNG CATGR, 2008
Source: NHCM Foundation analysis of data from the 2008 Medical xpenditure Panel Surey, aailable at http://www.meps.ahrq.go/mepsweb/data_stats/meps_query.jsp

8/6/2019 Understanding US Healthcare Spending-July 2011- NIHCM
http://slidepdf.com/reader/full/understanding-us-healthcare-spending-july-2011-nihcm 6/15
6
Understanding U.S. Health Care Spending
driver of high health care spending.
3
People with atleast one chronic health condition were two to fourtimes more likely than the general population to havespending in the top 5 percent, with the risk increasingas the number of chronic conditions rose. The linkwith obesity-related conditions was also evident inthis work. Nearly half of all people in the top 5 percentof spending reported having hypertension, one-thirdhad lipid disorders (high cholesterol), and more thanone-quarter had diabetes.
Chronic conditions are also a likely reason why some
people have high spending over an extended period,particularly when multiple chronic conditions are present.A recent analysis of MEPS data by Cohen and Yu providesevidence of the degree of persistence from one year to thenext in spending patterns for a given individual (Figure6).4 They found that 18 percent of people who were inthe top 1 percent spending category in 2007 remained inthe top-spending category in 2008. For the top 5 percentand top 10 percent spending categories, the comparable
retention gures were 31 and 43 percent, increasing tonearly two-thirds retention from year to year amongthose in the top 30 percent of spending.
H MOS COSly CONONS
Across the full civilian non-institutionalizedpopulation, not just those with high medical spending,the ve most expensive health conditions are heartdisease, cancer, trauma, mental disorders andpulmonary conditions. Various analyses using MEPS
data from 1996 to 2006 have consistently identiedthese conditions as individually accounting for the 5largest shares of total medical spending, with theircombined contribution to overall spending pegged at33 to 37 percent, depending on the year of data.5,6,7 Aseparate analysis by Thorpe et al. revealed that higherspending for these ve conditions alone accounted formore than 30 percent of the increase in health carespending between 1987 and 2000.8
P e r c e n t w i t h S a m e R a n k i n g i n 2 0 0 8
Percentile Rank by Health Care Spending, 2007
0%
20%
10%
30%
40%
50%
60%
70%
80%
Bottom 50% Top 50% Top 30% Top 20% Top 10% Top 5% Top 1%
74.6% 75.4%
63.6%
55.0%
42.7%
30.9%
18.2%
Source: Cohen S and u . “The Concentration and Persistence in the eel of Health xpenditures oer Time: stimates for the U.S. Population, 2007-2008.” Agency for
Healthcare Research and Quality, Statistical rief #309. December 2010.
FGUR 6. PRSSTNC N HATH CAR SPNDNG vR TM, 2007-2008

8/6/2019 Understanding US Healthcare Spending-July 2011- NIHCM
http://slidepdf.com/reader/full/understanding-us-healthcare-spending-july-2011-nihcm 7/15
7
NIHCM Data Brief n July 2011
H SCOS vN SNN OwH
Nationa Spending
Between 2005 and 2009, total national health spendingincreased from $2,021 billion to $2,486 billion, or by23 percent. A portion of this increase is attributable togrowth in the population. When population growth isaccounted for by examining per-capita health spending,we see spending growth of 18.4 percent over the veyears – from $6,827 per person to $8,086 (Figure 7).
Figure 8 shows the relative contribution of the varioushealth care sectors to this $1259 growth in per-capitaspending. Hospital spending increased by $422 perperson over this period (a 21 percent increase over
the 2005 base), and this increase was responsiblefor fully one-third of the total growth in spending.Spending for physician and clinical services was thenext largest contributor to overall spending growth,rising by $229 and accounting for 18 percent of thetotal growth. Rising spending for dental and otherhealth professional services contributed 6 percent tototal spending growth, while the remaining sectors
$0
$3,000
$2,000
$1,000
$4,000
$5,000
$6,000
$7,000
$8,000
$9,000
2005
2049
1417
473
869
910
1109
$8,086
$6,827
2471
1646
548
1066
1066
1289
2009
$2,021 billionTotal Spending $2,486 billion 23.0% increase
Other Spending(Non-Personal Health Care)
Prescription Drugs, DME &Other Medical Products
Home Health & Other LTCFacilities and Services
Dental & Other ProfessionalServices
Physician & Clinical Services
Hospital Care
18.4% Increase
FGUR 7. GRTH N CMPNNTS F NATNA HATH SPNDNG PR CAPTA, 2005-2009
Source: NHCM Foundation analysis of data from the National Health xpenditure Accounts, aailable at https://www.cms.go/NationalHealthxpendData/.

8/6/2019 Understanding US Healthcare Spending-July 2011- NIHCM
http://slidepdf.com/reader/full/understanding-us-healthcare-spending-july-2011-nihcm 8/15
8
Understanding U.S. Health Care Spending
each accounted for approximately 12 to 16 percentof expenditure growth. In the “other spending”category, the major driver of increased spending wasfor government public health activities (which grewroughly 32 percent in the ve years – data not shown),followed by growth in investments (which grew about15 percent over the period).
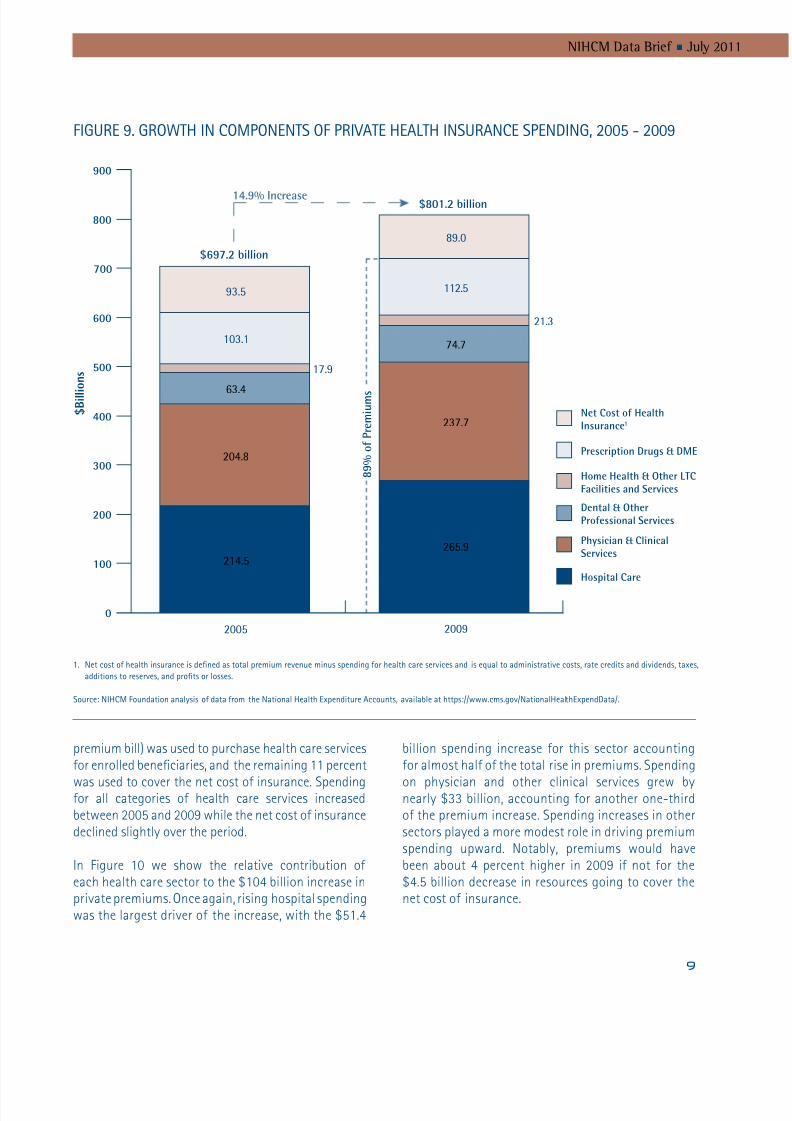
riate Heath Care remiums
Over this same ve-year period (2005-2009), nationalspending on premiums for private health insuranceincreased by nearly 15 percent, from $697 billion to$801 billion (Figure 9). In 2009, all but $89 billion of the private premium dollars (89 percent of the total
$0
$600
$400
$200
$800
$1,000
$1,200
$1,400
Hospital Care
$422
34% of TotalChange
Physician &Clinical Services
$229
18% of Total
Home Health& Other LTC
Facilities andServices
$197
16% of Total
Prescription
Drugs, DME &
Other MedicalProducts
$180
14% of Total
Other
Spending
$156
12% of Total
Dental & Other
Professional
Services
$75
6% of Total
Total Change
in Per Capita
Spending
$1,259
FGUR 8. SCTRS DRvNG GRTH N PR CAPTA HATH SPNDNG, 2005 - 2009
Source: NHCM Foundation analysis of data from the National Health xpenditure Accounts, aailable at https://www.cms.go/NationalHealthxpendData/.
8/6/2019 Understanding US Healthcare Spending-July 2011- NIHCM
http://slidepdf.com/reader/full/understanding-us-healthcare-spending-july-2011-nihcm 9/15
9
NIHCM Data Brief n July 2011
premium bill) was used to purchase health care servicesfor enrolled beneciaries, and the remaining 11 percent
was used to cover the net cost of insurance. Spendingfor all categories of health care services increasedbetween 2005 and 2009 while the net cost of insurancedeclined slightly over the period.
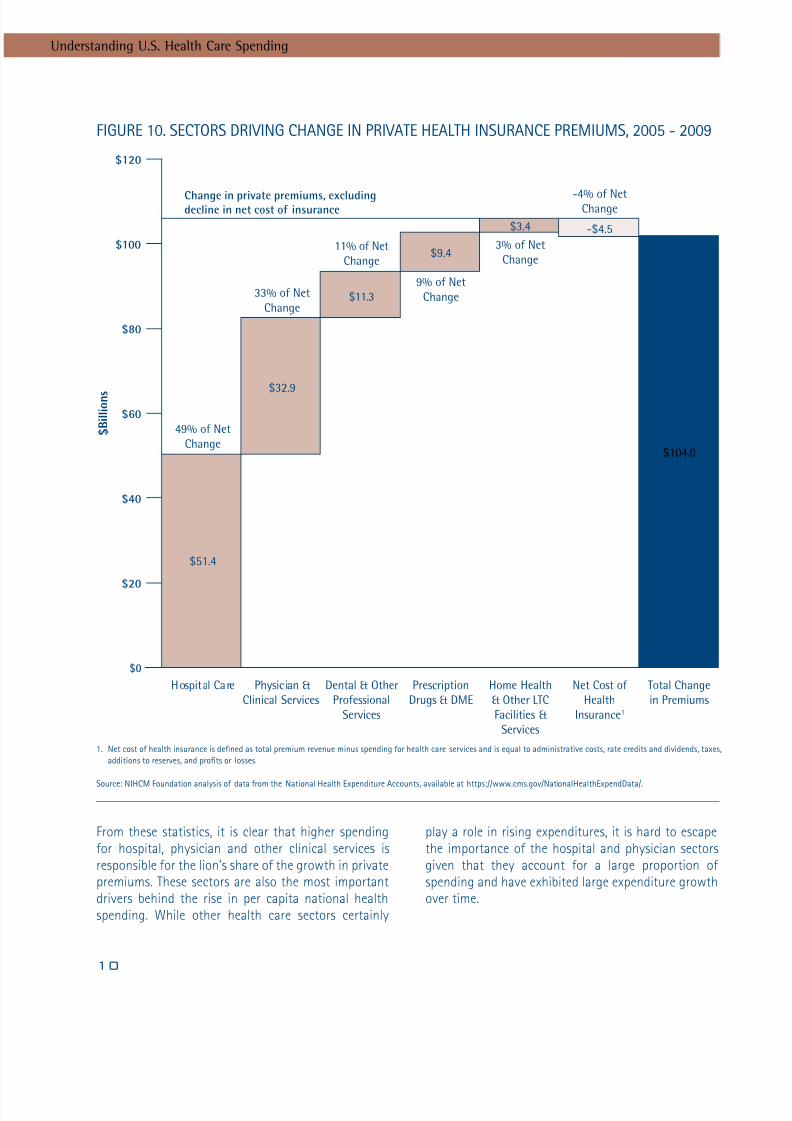
In Figure 10 we show the relative contribution of each health care sector to the $104 billion increase inprivate premiums. Once again, rising hospital spendingwas the largest driver of the increase, with the $51.4
billion spending increase for this sector accountingfor almost half of the total rise in premiums. Spending
on physician and other clinical services grew bynearly $33 billion, accounting for another one-thirdof the premium increase. Spending increases in othersectors played a more modest role in driving premiumspending upward. Notably, premiums would havebeen about 4 percent higher in 2009 if not for the$4.5 billion decrease in resources going to cover thenet cost of insurance.
14.9% Increase
0
300
200
100
400
500
600
700
800
900
2005 2009
Net Cost of HealthInsurance1
Prescription Drugs & DME
Home Health & Other LTCFacilities and Services
Dental & OtherProfessional Services
Physician & ClinicalServices
Hospital Care
214.5
204.8
63.4
103.1
17.9
93.5
265.9
237.7
74.7
112.5
21.3
89.0
$801.2 billion
8 9 % o
f P r e m i u m s
$697.2 billion
$ B i l l i o n s
FGUR 9. GRTH N CMPNNTS F PRvAT HATH NSURANC SPNDNG, 2005 - 2009
1. Net cost of health insurance is dened as total premium reenue minus spending for health care serices and is equal to administratie costs, rate credits and diidends, taxes,
additions to reseres, and prots or losses.
Source: NHCM Foundation analysis of data from the National Health xpenditure Accounts, aailable at https://www.cms.go/NationalHealthxpendData/.
8/6/2019 Understanding US Healthcare Spending-July 2011- NIHCM
http://slidepdf.com/reader/full/understanding-us-healthcare-spending-july-2011-nihcm 10/15
10
Understanding U.S. Health Care Spending
From these statistics, it is clear that higher spendingfor hospital, physician and other clinical services isresponsible for the lion’s share of the growth in privatepremiums. These sectors are also the most importantdrivers behind the rise in per capita national healthspending. While other health care sectors certainly
play a role in rising expenditures, it is hard to escapethe importance of the hospital and physician sectorsgiven that they account for a large proportion of spending and have exhibited large expenditure growthover time.
$0
$60
$40
$20
$80
$100
$120
Change in private premiums, excludingdecline in net cost of insurance
Hospital Care Physician &
Clinical Services
Dental & Other
Professional
Services
Prescription
Drugs & DME
Home Health
& Other LTC
Facilities &
Services
Net Cost of
Health
Insurance1
Total Change
in Premiums
49% of Net
Change
33% of Net
Change
11% of Net
Change
9% of Net
Change
3% of Net
Change
-4% of NetChange
$51.4
$32.9
$11.3
$9.4
$3.4 -$4.5
$104.0
$ B i l l i o n s
FGUR 10. SCTRS DRvNG CHANG N PRvAT HATH NSURANC PRMUMS, 2005 - 2009
1. Net cost of health insurance is dened as total premium reenue minus spending for health care serices and is equal to administratie costs, rate credits and diidends, taxes,
additions to reseres, and prots or losses.
Source: NHCM Foundation analysis of data from the National Health xpenditure Accounts, aailable at https://www.cms.go/NationalHealthxpendData/.

8/6/2019 Understanding US Healthcare Spending-July 2011- NIHCM
http://slidepdf.com/reader/full/understanding-us-healthcare-spending-july-2011-nihcm 11/15
11
NIHCM Data Brief n July 2011
fCOS BHN H SNN NCSS
Higher Unit rices s. Higher Utiization
Spending increases in any sector can be caused byhigher prices for each unit of service and/or by a highervolume of services. Parsing the factors responsiblefor increased health care spending is complex, butthe weight of the evidence indicates that spendingincreases in recent years have been driven more bygrowth in the unit price of services than by growth inthe volume of services consumed. Unit price increasesreect both general ination and growth in healthcare prices in excess of ination. Utilization increasesare computed as the residual growth in spending afteraccounting for growth in unit price.
Depending on the data used, recent estimates of therelative importance of these factors suggest thatunit price increases are one-and-a-half to threetimes more important than changes in utilization.For example, the most recent analysis of the NationalHealth Expenditure Accounts data by members of the government team responsible for compiling andanalyzing the data found that general ination andmedical price ination accounted for 60 percent of the
change in personal health care spending from 2008to 2009, while non-price factors were responsiblefor the remaining 40 percent of spending growth.9 A PriceWaterhouseCoopers analysis of employer-sponsored health premium data collected through theKaiser Family Foundation determined that 75 percentof the 6.1 percent growth in premiums between 2006and 2007 was due to price factors, and 25 percentwas attributable to changes in utilization.10 Likewise,the analysis of data for the 2011 Milliman MedicalIndex attributes most of the growth in family medicalspending between 2010 and 2011 to increases in
average unit price in the inpatient, outpatient,physician, and pharmacy sectors.11 And an analysis byUnitedHealth Group of its own claims experience for2009 indicates that unit price pressures – especiallyfor inpatient and outpatient services and somewidely prescribed drugs – explained two-thirds of itsincreased medical costs.12
riers o Higher Unit rices and HigherUtiization
The above reports and other published research
describe a number of factors that can contribute tounit price increases in excess of general ination and/or to higher utilization. These systemic factors affectgrowth in both public and private health spendingand include:
n new medical technology, which is broadly denedas changes to the procedures, equipment, andprocesses used to deliver medical care.13 Whilesome of these changes have the potential toreduce the cost of caring for a given patient,many new technologies not only increaseper-patient costs but also expand utilization tonew patient populations.10,11,14 Likewise, whilesome technological advances bring benets thatoutweigh any added costs,15 others increase costswithout adding commensurate benets.16
n growing rates of obesity, a concomitant rise inthe incidence and prevalence of many chronicconditions, and increasing treated prevalence ratesfor chronic conditions;2,8,10,12,17,18
nfee-for-service payment incentives that encouragea higher volume of services and fail to promoteeffective coordinated management of chronicconditions;12,19
n growing economic prosperity (real GDP per capita),which works to reinforce demand for health careservices and expand use of new technologies;14
n expanding insurance coverage, which also fuelshealth care demand and use of new technologies14,20
and can dampen the incentive of providers of care
to become more productive to the extent thatpatients are insulated from the cost of inefcientproduction;
n defensive medicine and more intensive use of diagnostic testing;10 and
n an aging population.10

8/6/2019 Understanding US Healthcare Spending-July 2011- NIHCM
http://slidepdf.com/reader/full/understanding-us-healthcare-spending-july-2011-nihcm 12/15
12
Understanding U.S. Health Care Spending
Additional factors affect the prices that private insurersmust pay for health care services and, thus, are relevantprimarily for understanding the growth in privateinsurance premiums.c These factors include:
n ongoing provider consolidation and enhancednegotiating strength vis-à-vis insurers, resultingin an ability to extract higher payment rates frominsurers;10,11,12,21,22,23,24,25
n demand for broad provider networks from purchasersof health insurance, which further limits insurers’ability to negotiate aggressively with providers onprice;10 and
n cost shifting and price discrimination, when providerswith a strong market position attempt to recoupshortfalls from public payers and uncompensatedcare by charging higher prices to private payers.10,11,26
Estimates of the extent to which each of these factorscontribute to overall spending growth vary widely,depending on the study methods and data used andthe time period considered. There is, however, generalconsensus that technological change is a major driverof spending increases while defensive medicine andpopulation demographics are minor factors in spending
growth – even though these latter factors may contributesignicantly to high per-capita spending at a point intime.27 The increasing burden from chronic diseases,particularly those related to burgeoning obesity rates, isalso frequently singled out as an important contributorto spending growth in the past few decades. Until weare successful in tackling the key underlying causes of medical spending ination, we will continue to facerising private health care premiums and rising nationalspending for health care.
c y and large, priate insurers negotiate payment rates with proidersand are subject to market forces. n contrast, most payment rates usedby public payers are set through administered pricing systems and arelargely immune from proider power in specic geographic markets.

8/6/2019 Understanding US Healthcare Spending-July 2011- NIHCM
http://slidepdf.com/reader/full/understanding-us-healthcare-spending-july-2011-nihcm 13/15
13
NIHCM Data Brief n July 2011
1 NIHCM Foundation analysis of data from the 2008 Medical ExpenditurePanel Survey, available at http://www.meps.ahrq.gov/mepsweb/data_stats/meps_query.jsp, and Yu WW and Ezzati-Rice TM. “Concentrationof Health Care Expenditures in the U.S. Civilian NoninstitutionalizedPopulation.” AHRQ Statistical Brief #81, May 2005.
2 Thorpe KE, Florence CS, Howard DH, Joski P. “The Rising Prevalence of Treated Disease: Effects on Private Health Insurance Spending.” HealthAffairs , W5-317-W5-325. June 27, 2005.
3 The Lewin Group. “Individuals Living in the Community with ChronicConditions and Functional Limitations: A Closer Look.” Report to theOfce of the Assistant Secretary for Planning and Evaluation. January2010.
4 Cohen SB, Yu W. “The Concentration and Persistence in the Level of Health Expenditures over Time: Estimates for the U.S. Population, 2007-2008.” Agency for Healthcare Research and Quality. Statistical Brief #309. December 2010.
5 Olin GL, Rhoades JA. “The Five Most Costly Medical Conditions, 1997 and2002: Estimates for the U.S. Civilian Non-institutionalized Population.”Agency for Healthcare Research and Quality. Statistical Brief #80. May2005.
6 Soni A. “The Five Most Costly Medical Conditions, 2000 and 2004:Estimates for the U.S. Civilian Non-institutionalized Population.” Agencyfor Healthcare Research and Quality. Statistical Brief #167. March 2007.
7 Soni A. “The Five Most Costly Medical Conditions, 1996 and 2006:Estimates for the U.S. Civilian Non-institutionalized Population.” Agencyfor Healthcare Research and Quality. Statistical Brief #248. July 2009.
8 Thorpe KE, Florence CS, Joski P. “Which Medical Conditions Account forthe Rise in Health Care Spending?” Health Affairs , W4-437-W4-445.August 25, 2004.
9 Martin A, Lassman D, Whittle L, Catlin A and the National Health
Expenditure Accounts Team. “Recession Contributes to Slowest AnnualRate of Increase in Health Spending in Five Decades.” Health Affairs ,30(1):11-22. January 2011.
10 PriceWaterhouseCoopers. “The Factors Fueling Rising Health Care Costs2008.” Report prepared for America’s Health Insurance Plans. December2008.
11 Milliman, Inc. “2011 Milliman Medical Index.” May 2011.
12 UnitedHealth Group. “Why Are Health Care Costs Rising?” March 2010.
13 Kaiser Family Foundation. “How Changes in Medical Technology AffectHealth Care Costs.” Snapshots: Health Care Costs. March 2007.
14 Smith S, Newhouse JP, Freeland MS. “Income, Insurance, and Technology:Why Does Health Spending Outpace Economic Growth?” Health Affairs ,28(5):1276-84. September/October 2009.
15 Cutler DM, McClellan M. “Is Technological Change in Medicine Worth It?”
Health Affairs , 20(5):11-29. September/October 2001.16 Chandra A, Skinner JS. “Technology Growth and Expenditure Growth in
Health Care.” NBER Working Paper No. 16953. April 2011.
17 Thorpe KE, Ogden LL, Galactionova K. “Chronic Conditions Accountfor Rise in Medicare Spending from 1987 to 2006.” Health Affairs ,29(4):718-24. April 2010.
18 Thorpe KE, Florence CS, Howard DH, Joski P. “The Impact of Obesity onRising Medical Spending.” Health Affairs , W4-480-W4-486. October 20,2004.
19 Adigozel O, Pellathy TM, Singhal S. “Why Understanding Medical Risk isKey to U.S. Health Reform.” The McKinsey Quarterly , June 2009.
20 Finkelstein A. “The Aggregate Effects of Health Insurance: Evidence fromthe Introduction of Medicare.” Quarterly Journal of Economics , 122(1):1-37, 2007.
21 Vogt WB, Town R. “How Has Hospital Consolidation Affected the Priceand Quality of Hospital Care?” Robert Wood Johnson FoundationSynthesis Project. Research Synthesis Report No. 9, February 2006.
22 Vogt WB. “Hospital Market Consolidation: Trends and Consequences.”Expert Voices , NIHCM Foundation, November 2009.
23 Chernew ME, Sabik LM, Chandra A, Gibson TB, Newhouse JP. “GeographicCorrelation Between Large-Firm Commercial Spending and MedicareSpending.” American Journal of Managed Care , 16(2):131-8. February2010.
24 Ofce of Massachusetts Attorney General. “Examination of Health CareCost Trends and Cost Drivers.” Report for Annual Public Hearing. March16, 2010.
25 Berenson RA, Ginsburg PB, Kemper N. “Unchecked Provider Clout inCalifornia Foreshadows Challenges to Health Reform.” Health Affairs ,29(4):1-7. April 2010.
26 Frakt AB. “How Much Do Hospitals Cost Shift? A Review of the Evidence.”Milbank Quarterly , 89(1):90-130. March 2011.
27 Ginsburg PB. “High and Rising Health Care Costs: Demystifying U.S.Health Care Spending.” Robert Wood Johnson Foundation SynthesisProject. Research Synthesis Report No. 16, October 2008.
ENDNTES

8/6/2019 Understanding US Healthcare Spending-July 2011- NIHCM
http://slidepdf.com/reader/full/understanding-us-healthcare-spending-july-2011-nihcm 14/15
14
Understanding U.S. Health Care Spending
About The NIHCM Foundation
The National nstitute for Health Care Management Research and ducational Foundation is a nonprot
organization whose mission is to promote improement in health care access, management and quality.
About This Brief
This NHCM Foundation brief was written by Julie A. Schoenman, PhD ([email protected]), Director of Research and Deelopment, and Nancy Chockley, MA ([email protected]), President and C.

8/6/2019 Understanding US Healthcare Spending-July 2011- NIHCM
http://slidepdf.com/reader/full/understanding-us-healthcare-spending-july-2011-nihcm 15/15
1225 19th Street NW
Suite 710
Washington, DC 20036
202.296.4426
202.296.4319 (fax)
www.nihcm.org