Understanding the Water–Food–Energy Nexus for Supporting ...
11
HAL Id: hal-03279542 https://hal.archives-ouvertes.fr/hal-03279542 Submitted on 6 Jul 2021 HAL is a multi-disciplinary open access archive for the deposit and dissemination of sci- entific research documents, whether they are pub- lished or not. The documents may come from teaching and research institutions in France or abroad, or from public or private research centers. L’archive ouverte pluridisciplinaire HAL, est destinée au dépôt et à la diffusion de documents scientifiques de niveau recherche, publiés ou non, émanant des établissements d’enseignement et de recherche français ou étrangers, des laboratoires publics ou privés. Understanding the Water–Food–Energy Nexus for Supporting Sustainable Food Production and Conserving Hydropower Potential in China Wenfeng Liu, Hong Yang, Qiuhong Tang, Xingcai Liu To cite this version: Wenfeng Liu, Hong Yang, Qiuhong Tang, Xingcai Liu. Understanding the Water–Food–Energy Nexus for Supporting Sustainable Food Production and Conserving Hydropower Potential in China. Frontiers in Environmental Science, Frontiers, 2019, 7, pp.50. 10.3389/fenvs.2019.00050. hal-03279542
Transcript of Understanding the Water–Food–Energy Nexus for Supporting ...
HAL Id: hal-03279542https://hal.archives-ouvertes.fr/hal-03279542
Submitted on 6 Jul 2021
HAL is a multi-disciplinary open accessarchive for the deposit and dissemination of sci-entific research documents, whether they are pub-lished or not. The documents may come fromteaching and research institutions in France orabroad, or from public or private research centers.
L’archive ouverte pluridisciplinaire HAL, estdestinée au dépôt et à la diffusion de documentsscientifiques de niveau recherche, publiés ou non,émanant des établissements d’enseignement et derecherche français ou étrangers, des laboratoirespublics ou privés.
Understanding the Water–Food–Energy Nexus forSupporting Sustainable Food Production andConserving Hydropower Potential in China
Wenfeng Liu, Hong Yang, Qiuhong Tang, Xingcai Liu
To cite this version:Wenfeng Liu, Hong Yang, Qiuhong Tang, Xingcai Liu. Understanding the Water–Food–Energy Nexusfor Supporting Sustainable Food Production and Conserving Hydropower Potential in China. Frontiersin Environmental Science, Frontiers, 2019, 7, pp.50. �10.3389/fenvs.2019.00050�. �hal-03279542�
ORIGINAL RESEARCHpublished: 24 April 2019
doi: 10.3389/fenvs.2019.00050
Frontiers in Environmental Science | www.frontiersin.org 1 April 2019 | Volume 7 | Article 50
Edited by:
Rabi Mohtar,
Texas A&M University, United States
Reviewed by:
Fouad H. Jaber,
Texas A&M University, United States
Xu Zhao,
Hohai University, China
Lei Cheng,
Wuhan University, China
Yuanyuan Yin,
Institute of Tibetan Plateau Research
(CAS), China
*Correspondence:
Xingcai Liu
Specialty section:
This article was submitted to
Freshwater Science,
a section of the journal
Frontiers in Environmental Science
Received: 15 August 2018
Accepted: 01 April 2019
Published: 24 April 2019
Citation:
Liu W, Yang H, Tang Q and Liu X
(2019) Understanding the
Water–Food–Energy Nexus for
Supporting Sustainable Food
Production and Conserving
Hydropower Potential in China.
Front. Environ. Sci. 7:50.
doi: 10.3389/fenvs.2019.00050
Understanding theWater–Food–Energy Nexus forSupporting Sustainable FoodProduction and ConservingHydropower Potential in ChinaWenfeng Liu 1,2, Hong Yang 1,3, Qiuhong Tang 4,5 and Xingcai Liu 1,4*
1 Eawag, Swiss Federal Institute of Aquatic Science and Technology, Duebendorf, Switzerland, 2 Laboratoire des Sciences du
Climat et de l’Environnement, LSCE/IPSL, CEA-CNRS-UVSQ, Université Paris-Saclay, Gif-sur-Yvette, France, 3Department
of Environmental Sciences, MUG, University of Basel, Basel, Switzerland, 4 Key Laboratory of Water Cycle and Related Land
Surface Processes, Institute of Geographic Sciences and Natural Resources Research, Chinese Academy of Sciences,
Beijing, China, 5College of Resources and Environment, University of Chinese Academy of Sciences, Beijing, China
Optimizing water–food–energy (WFE) relations has been widely discussed in recent
years as an effective approach for formulating pathways toward sustainable agricultural
production and energy supply. However, knowledge regarding the WFE nexus is
still largely lacking, particularly beyond the conceptual description. In this study, we
combined a grid-based crop model (Python-based Environmental Policy Integrated
Climate—PEPIC) with a hydropower scheme based on the Distributed Biosphere
Hydrological (DBH) model to investigate the WFE interplays in China concerning irrigated
agricultural production and hydropower potential. The PEPIC model was used to
estimate crop yields and irrigation water requirements under various irrigated cropland
scenarios, while the DBH model was applied to simulate hydrological processes and
associated hydropower potential. Four major crops, i.e., maize, rice, soybean, and
wheat, were included for the analyses. Results show that irrigation water requirements
present high values (average about 400mm yr−1) in many regions of northern China,
where crop yields are much higher on irrigated land than on rainfed land. However,
agricultural irrigation has largely reduced hydropower potential up to 50% in some regions
due to the substantial withdrawal of water from streams. The Yellow River basin, the Hai
River basin, and the Liao River basin were identified as the hotspot regions concerning
the WFE interactions and tradeoffs. Further expansion the irrigated cropland would
increase the tradeoffs between supporting sustainable food production and conserving
hydropower potential in many parts of China. The results provide some insights into
the WFE nexus and the information derived is useful for supporting sustainable water
management, food production while conserving the potential for hydropower generation
in China.
Keywords: water–food–energy nexus, irrigation water requirements, crop yields, hydropower potential, PEPIC,
DBH
Liu et al. Understanding WFE Nexus in China
INTRODUCTION
Water, food, and energy are the most important resourcessupporting the development of human society. Due to the highlyintrinsic linkages between them, it is essential to manage thethree sectors in an integrated way. The Water–Food–Energy(WFE) nexus was emerged as a concept to deal with the complexrelations among the three sectors. The WFE nexus was firstlyhighlighted by the Bonn 2011 Nexus Conference through itsbackground paper (Hoff, 2011). It is vital to optimize the WFEnexus for the purpose of achieving the ambitious SustainableDevelopment Goals (SDGs) ratified by the United Nations inSeptember 2015, as 10 out of the 17 SDGs are related to the WFEnexus (Bieber et al., 2018). Our planet is facing great challenges tofeed the growing and increasingly affluent population. Thinkingand acting with a WFE concept is the key to improving overallresource use efficiency (Ringler et al., 2013). However, currentresearch on theWFE nexus is still on the initial phase with a largenumber of review papers focusing on clarifying its definitionand out looking the major research directions (Perrone andHornberger George, 2014; Smajgl et al., 2016; Liu J. et al.,2017; Cai et al., 2018; D’odorico et al., 2018). Without detailedunderstanding of the WFE nexus and tradeoffs, it is difficult touse the WFE concept to facilitate the success of SDGs by 2030(Galaitsi et al., 2018).
Water, especially that for irrigation, is recognized as thecentral position in framing the WFE nexus (Cai et al., 2018;D’odorico et al., 2018). As the largest water consumer, irrigationaccounts for about 70% of global water withdrawal and isresponsible for 40% of total grain production (Ringler et al.,2013). Hydropower is the most important renewable energyresources, which receive increasing attention worldwide (Stickleret al., 2013; Liu et al., 2016c). There is a conflict between irrigationwater withdrawal and hydropower generation, especially in dryseasons. For instance, Zeng et al. (2017) found that 54% ofglobal installed hydropower has competitive relationships withirrigation. On the other hand, irrigation pumping could behigh energy consuming. Concerning resource use efficiency,optimizing the WFE nexus does not always correspond tomaximum crop yields, with the potential to save water andenergy (Zhang et al., 2017). Therefore, using the irrigation as aconnection provides good case to demonstrate the WFE nexusand understand its complex interplays.
China is particularly facing great challenges associated with
optimizing the WFE, as it has to use <10% of the global arableland to feed one fifth of the global population. Water resources
distribute extremely unevenly in China, with very low wateravailability in the northern parts of the country. Furthermore,irrigation is important to increase crop yields there (Piao et al.,2010). The annual average of gross hydropower potential inmainland China was estimated as high as 650 GW (billion watt)over the period 1971–2000 (Liu et al., 2016c). However, it isstill lacking in the literature that explores the extent to whichthe WFE nexus is interrelated and which regions are facingmore challenges. In order to fill in this research gap, we used aunique approach by coupling a grid-based large-scale crop model(Python-based Environmental Policy Integrated Climate, PEPIC)
with a hydrological model (Distributed Biosphere Hydrological,DBH) to estimate irrigation water requirements, crop yields, andhydropower potential in mainland China. The WFE interplayswere investigated by considering various irrigation scenarios withrespect to four major crops: maize, rice, soybean, and wheat. Thestudy will identify the hotspot regions regarding the WFE nexusand provide a preliminary reference for the integrated resourcesmanagement in China.
MATERIALS AND METHODS
The PEPIC ModelThe PEPIC model (Liu et al., 2016a) was used to simulateirrigation water requirements and crop yields. PEPIC is agrid version of the EPIC (Environmental Policy IntegratedClimate) model (Williams et al., 1984). The EPIC model wasinitially developed to estimate the effects of soil erosion on soilproductivity in the mid-1980s. Since its inception, EPIC wascontinuously extended to simulate a wide range of complexprocesses related to crop growth, e.g., hydrology, soil erosion, soiltemperature, carbon dynamics, and nutrient cycles (Williams,1995; Izaurralde et al., 2006). EPIC has been widely used andvalidated around the world (Gassman et al., 2005). However,EPIC is a field level model. The grid-based PEPIC modelfacilitates the application of EPIC on large scales with high spatialresolutions. The PEPIC model has been used to simulate cropyields, crop water use, and irrigation water requirements (Liuet al., 2016a). It performed well on simulating national cropyields, which match the data reported by FAO around year 2000.The PEPIC model can also capture the interannual variability ofcrop yields caused by climate forcing (Müller et al., 2017). Beyondthis, PEPIC was successfully used to simulate global nutrientcycling, e.g., nitrogen losses (Liu et al., 2016b), and phosphoruscycles (Liu et al., 2018) relating to production of major crops ona global scale. We used the calibrated PEPIC in this study.
PEPIC simulates crop growth at a daily scale. Dailypotential biomass is simulated by considering an energy–biomassconversion approach. Potential biomass is reduced by a majorplant stress (including temperature, water, nutrient, aeration, andsalinity) to get the actual biomass. Crop yields are then estimatedby multiplying a crop-specific harvest index and actual biomassaccumulation when crop is mature. In this study, both rainfedand irrigated cultivations were simulated separately. For irrigatedcropland, irrigation water requirements were estimated by usingan automatic irrigation application approach. With this method,PEPIC applies water for irrigation automatically with sufficientamount of water when plant water stress limits potential biomassincreases by a given threshold, e.g., 10% used in this study. Thisstrategy can eliminate the plant water stress and is widely usedin large scale crop modeling (Folberth et al., 2016; Liu et al.,2016b). The annual irrigation water requirements were calculatedby summing up the applied water in each irrigation event duringthe whole growing season. An irrigation efficiency of 0.378 (Rostet al., 2008) was used for the whole of China in this study.
PEPIC requires digital elevation model (DEM), slope, climate,soil, fertilizer, and crop calendar as input data. Climatedata, including precipitation, maximum and minimum daily
Frontiers in Environmental Science | www.frontiersin.org 2 April 2019 | Volume 7 | Article 50
Liu et al. Understanding WFE Nexus in China
temperature, wind speed, and relative humidity, were obtainedfrom Weedon et al. (2014). Soil data were downloaded fromthe ISRIC-WISE dataset (Batjes, 2006). Fertilizer data, includingnitrogen and phosphorus of mineral fertilizer and manure, werederived from the EarthStat dataset (Mueller et al., 2012; Westet al., 2014). Crop calendar, including planting date and cropgrowth period, was based on the SAGE dataset (Sacks et al., 2010).The simulation period of this study is 1981–2010 with the first20 years treating as spin-off period to phase out the impacts ofunknown initial soil conditions. Four major crops, maize, rice,soybean and wheat, were simulated in the mainland of Chinawith a spatial resolution of 0.5◦.
The Hydropower Scheme Based on theDBH ModelA hydropower scheme (HPS) was developed based on the DBHmodel to estimate the gross hydropower potential (GHP) underdifferent irrigation scenarios. The DBH model is a spatiallydistributed model integrating hydrological processes and soil-vegetation-atmosphere transfer processes (Tang et al., 2007,2008). It incorporates a land surface model SiB2 (Sellers et al.,1996) and a distributed hydrological scheme. The hydrologicalscheme in the DBH model is based on geomorphologicalcharacteristics to estimate the surface and subsurface flow. Bothsaturated and unsaturated overland flows are considered in themodel. The area-amount relationship for effective precipitationand the part of precipitation that becomes runoff, is used toestimate the overland flow. A linear reservoir routing modelis used for large scale hydrological routing simulation (Liuet al., 2016d; Liu X. et al., 2017). The DBH model was initiallydeveloped and calibrated for large-scale hydrological simulationsin the Yellow River basin (Tang et al., 2008) and showedfairly good performance. It was then improved for hydrologicalsimulations taking human impact into account at a spatialresolution of half-degree and was verified in China (Liu et al.,2016c, 2019) and the globe (Liu et al., 2016d; Liu X. et al., 2017)with monthly and annual hydrological observations.
GHP is defined as the total energy of available runoff fallingto the lowest level of a specific region. Based on the DBH model,flows for GHP estimation are considered from (1) cell-internalrunoff (Q1) that falls from the mean to the minimum elevation(h1) of the considered cell and (2) inflow (Q2) that falls fromthe minimum elevation of the upstream cell to the minimumelevation (h2) of the considered cell (Liu et al., 2016c). In theHPS,GHP at each grid cell is estimated as:
GHP = Q1× h1× g + Q2× h2× g (1)
where Q1 and Q2 are the cell-internal flow and the inflow(m3 s−1, cubic meter per second), respectively; h1 and h2 arethe hydraulic head defined above (m); and g is gravitationalacceleration (m s−2).
The HPS was coupled with the PEPIC model to representthe links between hydropower and agricultural irrigation at largescale (Figure 1). To do this, HPS was fed with irrigation waterrequirements at the monthly scale, which were estimated bythe PEPIC model. HPS runs at a daily time step; therefore, the
FIGURE 1 | Flow chart for the hydropower potential scheme (HPS).
monthly irrigation requirements were evenly disaggregated intodaily values. The estimated irrigation water requirements by thePEPIC model were provided for the flow routing process inthe DBH model. Discharge was withdrawn from the consideredcell and then its adjacent grid cells (up to four adjacent gridcells) if necessary to fulfill the irrigation requirements before theGHP estimation. GHP was calculated based on the remainingdischarge and the natural hydraulic head along the river network.At each grid cell, 20% of daily streamflow was arbitrarily reservedfor environmental flows (Hanasaki et al., 2008; Pastor et al.,2014). The withdrawn water in HPS will be lower than theestimated irrigation water requirements if streamflow is notsufficient. Annual GHP was aggregated based on daily values ateach grid cell. In this study, we focused on GHP and no reservoirregulation was applied in the HPS. The feedback of irrigation onrunoff generation was not considered, from which uncertainty indischarge simulations may arise in some regions (Liu et al., 2019).
Irrigated Cropland ScenariosIn this study, the MIRCA-2000 land use data (Portmann et al.,2010) were used as the benchmark of cropland for wheat,rice, maize, and soybean. The MIRCA-2000 dataset providescrop-specific irrigated and rainfed land use data for 26 cropsthroughout the whole world around the period 1997–2003. Weconsidered 12 irrigated cropland scenarios on the basis of theMIRCA-2000 dataset: the baseline scenario (represents the realityaround year 2000, then the national average irrigated croplandwas about 70% of the total cropland, with substantial regionalvariations); the zero scenario (no irrigated land, that is, the wholecropland as rainfed land), and 10 incremental irrigated cropland(i.e., 10, 20, 30, 40, 50, 60, 70, 80, 90, and 100%) scenarios, whichtake respective fractions of total cropland to irrigated land in eachgrid. It should be noted that the baseline scenario is differentfrom the 70% incremental irrigated cropland scenario, as the laterconsiders the equal percentage of cropland as irrigated land in allthe river basins and grids. In the study, we kept the total croplandarea unchanged, but adjusted the fraction of irrigated land tototal cropland. These 12 irrigated cropland scenarios were used
Frontiers in Environmental Science | www.frontiersin.org 3 April 2019 | Volume 7 | Article 50

Liu et al. Understanding WFE Nexus in China
to examine the effects of varied irrigation water withdrawals onthe hydropower potentials for mainland China and its 10 majorriver basins (Figure 2A).
RESULTS
Irrigation Water RequirementsFigure 2A shows the spatial distribution of area-weightedaverage of irrigation water requirements of the four crops, underthe 100% irrigated cropland scenario, representing the maxirrigation water requirements. Irrigation water requirements ofthe four major crops present very high values (400mm yr−1,millimeter per year) in the north parts of China, e.g., in theHai River basin, the Liao River basin, the middle of the Yellow
River basin, and the north part of the Huai River basin. Thehighest values are found in the northwest part of China withirrigation water requirements>500mm yr−1. On the other hand,the irrigation water requirements are small in the southern partsof China, with values generally below 100mm yr−1.
Irrigated cropland based on the MIRCA-2000 dataset (thebaseline scenario) mainly located in the north parts of China,especially in the Hai River basin, the Huai River basin, and theYellow River basin with high values over 200 kha (thousandhectares) in one grid (Figure 2B). Multiplying the irrigationwater requirements with irrigated cropland of the four majorcrops, the Hai River basin required the largest amount of waterup to 18 km3 yr−1 (cubic kilometer per year), followed by theYellow River basin (13 km3 yr−1), the Northwest River basins
FIGURE 2 | Maps of irrigation water requirements over cropland (A) and total irrigation land area in each 0.5 degree grid cell (B) of the four crops. Irrigation water
requirements were estimated by considering the whole cropland (the MIRCA-2000 dataset) as irrigated land for each crop and then aggregated by using
area-weighted average of maize, rice, soybean, and wheat. Ten large river basins (presenting on the top panel) in the mainland of China were used to aggregated
regional information, including the Hai River basin (HaiR), the Huai River basin (HuaiR), the Liao River basin (LiaoR), the Northwest River basins (NwR), the Pearl River
basin (PeR), the Southeast River basins (SeR), the Songhua River basin (ShR), the Southwest River basins (SwR), the Yangtze River basin (YaR), and the Yellow River
basin (YeR).
Frontiers in Environmental Science | www.frontiersin.org 4 April 2019 | Volume 7 | Article 50
Liu et al. Understanding WFE Nexus in China
(10 km3 yr−1), and the Huai River basin (10 km3 yr−1) (Table 1).The Yangtze River basin has the largest irrigated cropland area intotal, while its irrigation water requirements are relatively smalldue to the relatively high rainfall (3.1 km3 yr−1).
Effects of Irrigation on Crop YieldsThe area-weighted average of rainfed yields (the zero scenario) ofthe four major crops shows high values in the east parts of China,over 5 ton ha−1 yr−1 (ton per hectare per year), while the rainfedyields are particularly low (<1 ton ha−r yr−1) in the northwestparts of China (Figure 3A). Therefore, irrigation in these lowrainfed yield regions can greatly improve crop yields, especiallyin the Northwest River basins and the middle of the YellowRiver basin (Figure 3B). It is not surprising that the differences incrop yields (Figure 3B) between the full irrigated and full rainfedcultivation show similar spatial patterns to the irrigation waterrequirements under the 100% scenarios (Figure 2A). At the riverbasin level, irrigation under the baseline scenario can increasecrop production by 5.5 times of that under the zero scenario inthe Northwest River basins, followed by the Yellow River basin(by 40%), and the Hai River basin (by 38%) (Table 1). As forthe whole mainland of China, current irrigation (the baselinescenario) increases its crop production by 13%.
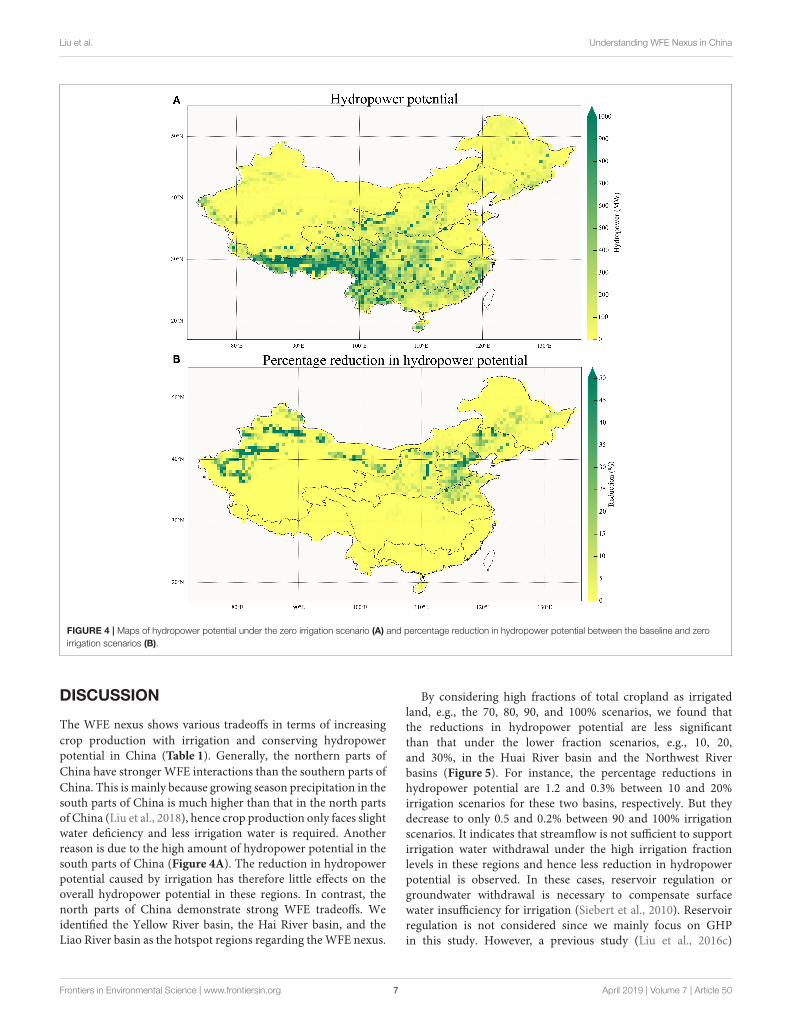
Hydropower Potential Under the Zero andBaseline ScenariosUnder the zero irrigation scenario, i.e., without irrigation waterwithdrawal, the hydropower potential is mainly concentratedin the southwest parts of China (Figure 4A), including the
Southwest River basins and the head of the Yangtze River basin,with high values >1,000 MW (million watt). This is mainlybecause there are abundant water resources and large elevationdifferences in these areas. The hydropower potential is relativelysmall in the north parts of China, especially in the vast regions ofthe Northwest River basins, which is lower than 100 MW.
Water used for irrigation under the baseline scenario haslargely reduced the hydropower potential in the north partsof China (Figure 4B). In some areas of the Northwest Riverbasins and the Yellow River basin, the percentage reductionin hydropower potential is more than 50%. At the river basinlevel, the baseline irrigation results in the largest reduction ofhydropower potential in the Yellow River basin by 10,354 MW(Table 1), which accounts for about 17% of its hydropowerpotential in the condition of zero irrigation. The percentagereductions in hydropower potential in the Hai River basin, theLiao River basin, and the Huai River basin are 11, 10, and 6%,respectively. At the national level, the percentage reduction isonly 1.8%, mainly because the reduction in hydropower potentialis very small in the four southern river basins of China, i.e., theSouthwest River basins, the Yangtze River basin, the Pearl Riverbasin, and the Southeast River basins, where the irrigation waterrequirements are very small relative to their water resources.
Water-Food-Energy Nexus Under VariousIrrigated Cropland ScenariosAgricultural irrigation has strong effects on the WFE nexus inthe north parts of China, especially in the Yellow River basin,the Hai River basin, and Liao River basin, i.e., increases in crop
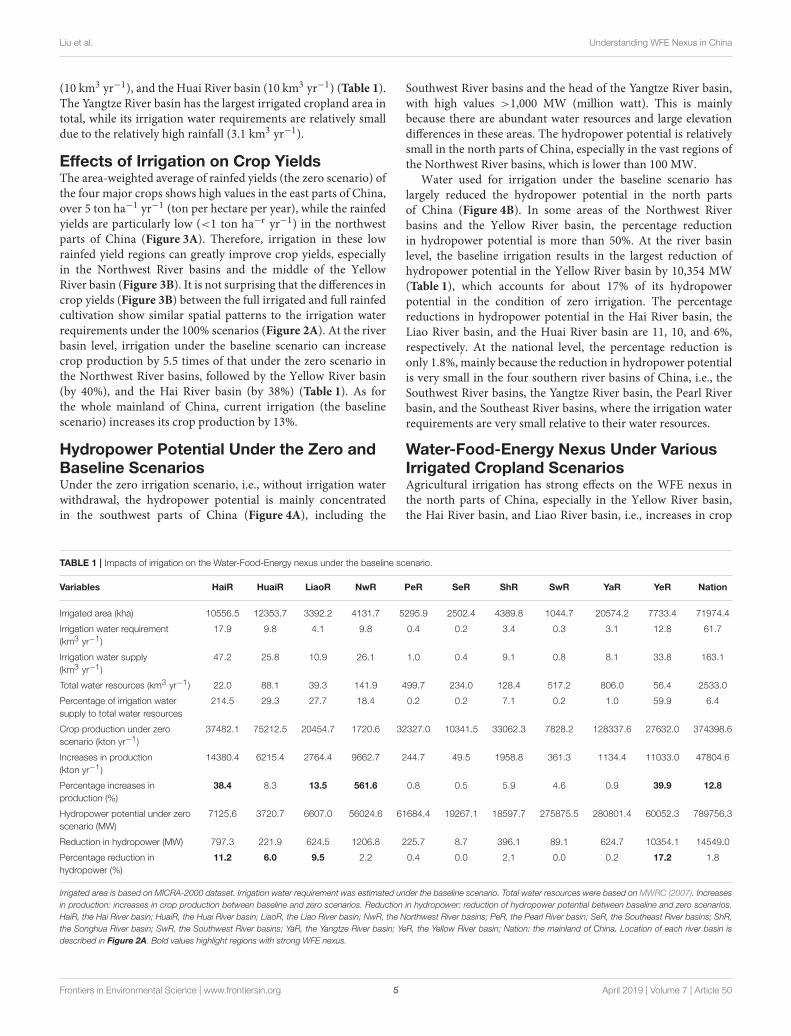
TABLE 1 | Impacts of irrigation on the Water-Food-Energy nexus under the baseline scenario.
Variables HaiR HuaiR LiaoR NwR PeR SeR ShR SwR YaR YeR Nation
Irrigated area (kha) 10556.5 12353.7 3392.2 4131.7 5295.9 2502.4 4389.8 1044.7 20574.2 7733.4 71974.4
Irrigation water requirement
(km3 yr−1)
17.9 9.8 4.1 9.8 0.4 0.2 3.4 0.3 3.1 12.8 61.7
Irrigation water supply
(km3 yr−1)
47.2 25.8 10.9 26.1 1.0 0.4 9.1 0.8 8.1 33.8 163.1
Total water resources (km3 yr−1) 22.0 88.1 39.3 141.9 499.7 234.0 128.4 517.2 806.0 56.4 2533.0
Percentage of irrigation water
supply to total water resources
214.5 29.3 27.7 18.4 0.2 0.2 7.1 0.2 1.0 59.9 6.4
Crop production under zero
scenario (kton yr−1)
37482.1 75212.5 20454.7 1720.6 32327.0 10341.5 33062.3 7828.2 128337.6 27632.0 374398.6
Increases in production
(kton yr−1)
14380.4 6215.4 2764.4 9662.7 244.7 49.5 1958.8 361.3 1134.4 11033.0 47804.6
Percentage increases in
production (%)
38.4 8.3 13.5 561.6 0.8 0.5 5.9 4.6 0.9 39.9 12.8
Hydropower potential under zero
scenario (MW)
7125.6 3720.7 6607.0 56024.6 61684.4 19267.1 18597.7 275875.5 280801.4 60052.3 789756.3
Reduction in hydropower (MW) 797.3 221.9 624.5 1206.8 225.7 8.7 396.1 89.1 624.7 10354.1 14549.0
Percentage reduction in
hydropower (%)
11.2 6.0 9.5 2.2 0.4 0.0 2.1 0.0 0.2 17.2 1.8
Irrigated area is based on MICRA-2000 dataset. Irrigation water requirement was estimated under the baseline scenario. Total water resources were based on MWRC (2007). Increases
in production: increases in crop production between baseline and zero scenarios. Reduction in hydropower: reduction of hydropower potential between baseline and zero scenarios.
HaiR, the Hai River basin; HuaiR, the Huai River basin; LiaoR, the Liao River basin; NwR, the Northwest River basins; PeR, the Pearl River basin; SeR, the Southeast River basins; ShR,
the Songhua River basin; SwR, the Southwest River basins; YaR, the Yangtze River basin; YeR, the Yellow River basin; Nation: the mainland of China. Location of each river basin is
described in Figure 2A. Bold values highlight regions with strong WFE nexus.
Frontiers in Environmental Science | www.frontiersin.org 5 April 2019 | Volume 7 | Article 50

Liu et al. Understanding WFE Nexus in China
FIGURE 3 | Maps of rainfed crop yields (A) and differences between irrigated crop yields and rainfed crop yields (B) of maize, rice, soybean, and wheat. Rainfed crop
yields were estimated by considering the whole cropland (the MIRCA-2000 dataset) as rainfed land for each crop and then aggregated by using area-weighted
average of the four crops. Irrigated crop yields were estimated by using the same way as rainfed crop yields but considering the whole cropland as irrigated land.
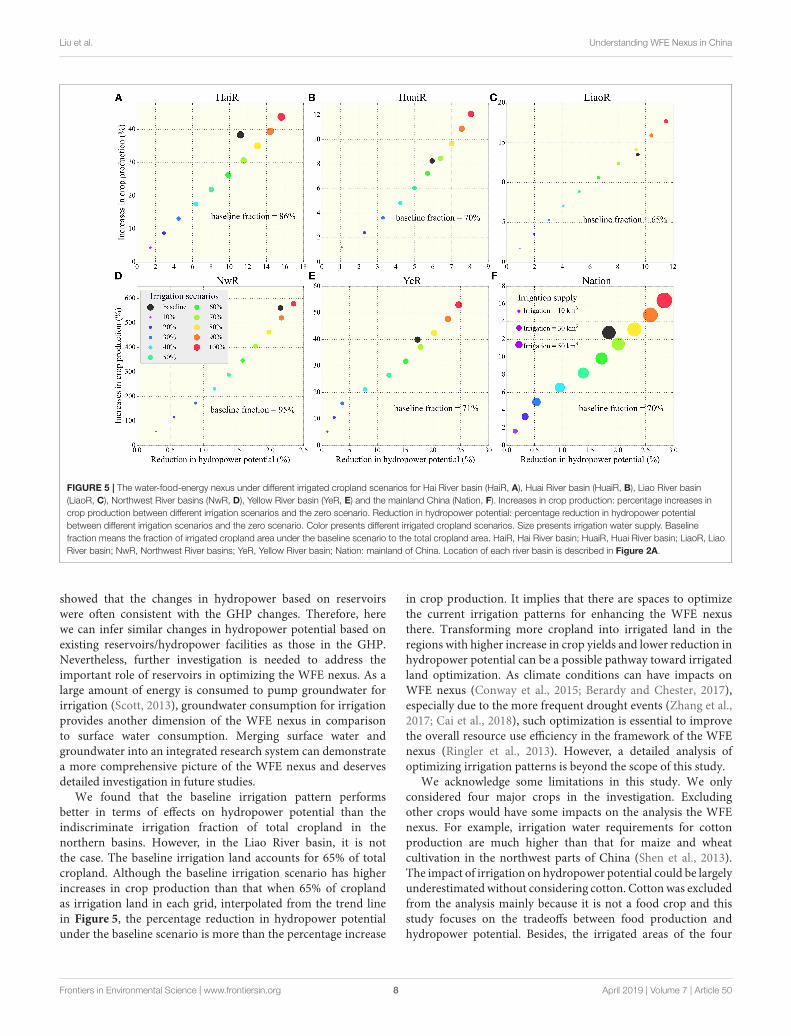
production by more than 10% accompanied with reduction inhydropower potential by over 10%. Besides, the Northwest Riverbasins and the Huai River basin have also relative strong WFEnexus. Crop production increases by 560% in the NorthwestRiver basins due to irrigation, although the reduction inhydropower potential is relatively small (2.2%). In the Huai Riverbasin, both the increase in crop production and the reduction inhydropower potential reach 6% (Table 1). Therefore, we focus onthese five hotspot river basins and the mainland China to furtherinvestigate the impacts of irrigation under 10 different scenarioson theWFE nexus (Figure 5). Generally, the impacts of irrigationon the WFE nexus get more evident with increasing irrigatedareas. The Yellow River basin demonstrates the most significantresponses, that is, crop production could increase by 53% underthe 100% irrigation scenario compared to crop production underthe zero scenario, while hydropower potential would decrease
by 25%. At the national level, crop production would have 16%increases and reduction in hydropower potential is about 2.8%.
For the five presented basins and also the mainland Chinain Figure 5 except the Liao River basin, points for thebaseline scenario locate at the upper and left side of thepoints for the other different irrigation fraction scenarios. Thismeans that the distribution of current irrigation land (thebaseline scenario) has advantages on the WFE nexus overthe indiscriminate irrigation fraction scenarios. For example,about 86% of total cropland in the Hai River basin is irrigatedland under the baseline scenario. If we consider 86% oftotal cropland in each grid as irrigated land, irrigation wouldresult in the same increases (about 38%) in crop productioncompared to the baseline scenario, while it may cause about2% more reduction in hydropower potential relative to thebaseline condition.
Frontiers in Environmental Science | www.frontiersin.org 6 April 2019 | Volume 7 | Article 50
Liu et al. Understanding WFE Nexus in China
FIGURE 4 | Maps of hydropower potential under the zero irrigation scenario (A) and percentage reduction in hydropower potential between the baseline and zero
irrigation scenarios (B).
DISCUSSION
The WFE nexus shows various tradeoffs in terms of increasing
crop production with irrigation and conserving hydropowerpotential in China (Table 1). Generally, the northern parts of
China have stronger WFE interactions than the southern parts of
China. This is mainly because growing season precipitation in thesouth parts of China is much higher than that in the north partsof China (Liu et al., 2018), hence crop production only faces slightwater deficiency and less irrigation water is required. Anotherreason is due to the high amount of hydropower potential in thesouth parts of China (Figure 4A). The reduction in hydropowerpotential caused by irrigation has therefore little effects on theoverall hydropower potential in these regions. In contrast, thenorth parts of China demonstrate strong WFE tradeoffs. Weidentified the Yellow River basin, the Hai River basin, and theLiao River basin as the hotspot regions regarding theWFE nexus.
By considering high fractions of total cropland as irrigatedland, e.g., the 70, 80, 90, and 100% scenarios, we found thatthe reductions in hydropower potential are less significantthan that under the lower fraction scenarios, e.g., 10, 20,and 30%, in the Huai River basin and the Northwest Riverbasins (Figure 5). For instance, the percentage reductions inhydropower potential are 1.2 and 0.3% between 10 and 20%irrigation scenarios for these two basins, respectively. But theydecrease to only 0.5 and 0.2% between 90 and 100% irrigationscenarios. It indicates that streamflow is not sufficient to supportirrigation water withdrawal under the high irrigation fractionlevels in these regions and hence less reduction in hydropowerpotential is observed. In these cases, reservoir regulation orgroundwater withdrawal is necessary to compensate surfacewater insufficiency for irrigation (Siebert et al., 2010). Reservoirregulation is not considered since we mainly focus on GHPin this study. However, a previous study (Liu et al., 2016c)
Frontiers in Environmental Science | www.frontiersin.org 7 April 2019 | Volume 7 | Article 50
Liu et al. Understanding WFE Nexus in China
FIGURE 5 | The water-food-energy nexus under different irrigated cropland scenarios for Hai River basin (HaiR, A), Huai River basin (HuaiR, B), Liao River basin
(LiaoR, C), Northwest River basins (NwR, D), Yellow River basin (YeR, E) and the mainland China (Nation, F). Increases in crop production: percentage increases in
crop production between different irrigation scenarios and the zero scenario. Reduction in hydropower potential: percentage reduction in hydropower potential
between different irrigation scenarios and the zero scenario. Color presents different irrigated cropland scenarios. Size presents irrigation water supply. Baseline
fraction means the fraction of irrigated cropland area under the baseline scenario to the total cropland area. HaiR, Hai River basin; HuaiR, Huai River basin; LiaoR, Liao
River basin; NwR, Northwest River basins; YeR, Yellow River basin; Nation: mainland of China. Location of each river basin is described in Figure 2A.
showed that the changes in hydropower based on reservoirswere often consistent with the GHP changes. Therefore, herewe can infer similar changes in hydropower potential based onexisting reservoirs/hydropower facilities as those in the GHP.Nevertheless, further investigation is needed to address theimportant role of reservoirs in optimizing the WFE nexus. As alarge amount of energy is consumed to pump groundwater forirrigation (Scott, 2013), groundwater consumption for irrigationprovides another dimension of the WFE nexus in comparisonto surface water consumption. Merging surface water andgroundwater into an integrated research system can demonstratea more comprehensive picture of the WFE nexus and deservesdetailed investigation in future studies.
We found that the baseline irrigation pattern performsbetter in terms of effects on hydropower potential than theindiscriminate irrigation fraction of total cropland in thenorthern basins. However, in the Liao River basin, it is notthe case. The baseline irrigation land accounts for 65% of totalcropland. Although the baseline irrigation scenario has higherincreases in crop production than that when 65% of croplandas irrigation land in each grid, interpolated from the trend linein Figure 5, the percentage reduction in hydropower potentialunder the baseline scenario is more than the percentage increase
in crop production. It implies that there are spaces to optimizethe current irrigation patterns for enhancing the WFE nexusthere. Transforming more cropland into irrigated land in theregions with higher increase in crop yields and lower reduction inhydropower potential can be a possible pathway toward irrigatedland optimization. As climate conditions can have impacts onWFE nexus (Conway et al., 2015; Berardy and Chester, 2017),especially due to the more frequent drought events (Zhang et al.,2017; Cai et al., 2018), such optimization is essential to improvethe overall resource use efficiency in the framework of the WFEnexus (Ringler et al., 2013). However, a detailed analysis ofoptimizing irrigation patterns is beyond the scope of this study.
We acknowledge some limitations in this study. We onlyconsidered four major crops in the investigation. Excludingother crops would have some impacts on the analysis the WFEnexus. For example, irrigation water requirements for cottonproduction are much higher than that for maize and wheatcultivation in the northwest parts of China (Shen et al., 2013).The impact of irrigation on hydropower potential could be largelyunderestimated without considering cotton. Cottonwas excludedfrom the analysis mainly because it is not a food crop and thisstudy focuses on the tradeoffs between food production andhydropower potential. Besides, the irrigated areas of the four
Frontiers in Environmental Science | www.frontiersin.org 8 April 2019 | Volume 7 | Article 50
Liu et al. Understanding WFE Nexus in China
crops in the whole of China account for about 80% of the totalirrigated areas of the 26 major crops in the country includedin Portmann et al. (2010). Based on our estimation, for all the26 crops, the total irrigation water requirements will be 25%higher. Consequently, the reduction of hydropower potentialwill be ∼25% higher. Also, the estimated values by large-scalemodels are subject to high uncertainties due to model structureand parameters. For example, a previous study shows thatthe selection of different potential evapotranspiration methodsbuilt-in PEPIC can have large effect on the estimation of cropyields and irrigation water requirements (Liu et al., 2016a).Large uncertainty arisen from hydrological models includingDBH were reported (Schewe et al., 2014; Liu X. et al., 2017),which indicates that improving model structure and parametersis needed. Although the uncertainty issue is out of scope ofthis preliminary analysis, it is in our agenda to address thisissue in detail. Despite these limitations, this study providesthe first attempt to illustrate the WFE nexus with respect towater, food, and hydropower potential relations. The informationis of importance for understanding the WFE nexus in Chinaand for formulating appropriate policies to tackle the nexusrelated challenges.
CONCLUSIONS
In this study, the PEPIC crop model was coupled with the DBHhydrological model to investigate the WFE nexus in mainlandChina under various irrigated cropland scenarios. The northernparts of China show strong WFE nexus and tradeoffs due tolarge amount of irrigation water requirements and relatively lowwater resources there, while irrigation had only little effects onthe WFE nexus in the southern basins of China. The YellowRiver basin, the Hai River basin, and the Liao River basin wereidentified as the hotspot regions regarding the tradeoffs in theWFE nexus, where more attention should be paid for detailedinvestigation. The current irrigated cropland generally presentsgood performance compared to the indiscriminate irrigationfraction of total cropland. Still, there are spaces for improving thedistribution of irrigated cropland to maximize the WFE benefits.Complexity and uncertainties in studying the WFE nexus callfor more comprehensive research to promote the usefulness of
this concept as a robust tool for managing emerging challengesrelated to integrated and efficientmanagement of water, food, andenergy sectors.
This paper addressed the WFE nexus by specifyingquantitatively the tradeoffs between food production increasesthrough irrigation expansion (increased water withdrawal)and the loss of hydropower potential due to the reductionof streamflow. The information is useful for supportingintegrated management of water resources for energy and foodsustainability in China. However, the study did not go furtherto address the economic/social significance of the tradeoffs,as such analysis would be location/river basin specific. It isbeyond the scope of this study to judge whether a specific riverbasin/region/country should choose to forego its hydropowerpotential in order to gain more food production. Such adecision would need much more information on socioeconomicconditions, regional development strategies, environmentalstatus, etc. This would be the topic of our future study. Finally,we should like to mention that although this study focuseson China, the approaches developed can be used in othercountries and basins in the world for addressing the WFEnexus quantitatively.
AUTHOR CONTRIBUTIONS
WL, HY, and XL designed the research.WL run the PEPICmodeland analyzed the data and wrote themanuscript. XL run the DBHmodel. All authors participated in the interpretation of resultsand the writing and editing processes.
ACKNOWLEDGMENTS
This study was supported by the funding from the Swiss FederalInstitute of Aquatic Science and Technology (Eawag) and theWorld Food System Center at ETH Zürich. WL acknowledgesthe support received from the Early Postdoctoral MobilityFellowship awarded by the Swiss National Science Foundation(P2EZP2_175096). XL was supported by funding from theNational Natural Science Foundation of China (41877164). QTwas supported by funding from the National Natural ScienceFoundation of China (41730645).
REFERENCES
Batjes, N. H. (2006). ISRIC-WISE Derived Soil Properties on a 5 by 5 Arc-Minutes
Global Grid (version 1.1). Wageningen: ISRIC–World Soil Infromation.
Berardy, A., and Chester, M. V. (2017). Climate change vulnerability in the food,
energy, and water nexus: concerns for agricultural production in Arizona
and its urban export supply. Environmental Research Letters 12, 035004.
doi: 10.1088/1748-9326/aa5e6d
Bieber, N., Ker, J. H., Wang, X., Triantafyllidis, C., Van Dam,
K. H., Koppelaar, R. H. E. M., et al. (2018). Sustainable
planning of the energy-water-food nexus using decision making
tools. Energy Policy 113, 584–607. doi: 10.1016/j.enpol.2017.
11.037
Cai, X., Wallington, K., Shafiee-Jood, M., and Marston, L. (2018).
Understanding and managing the food-energy-water nexus–opportunities
for water resources research. Adv. Water Resour. 111, 259–273.
doi: 10.1016/j.advwatres.2017.11.014
Conway, D., Van Garderen, E. A., Deryng, D., Dorling, S., Krueger, T., Landman,
W., et al. (2015). Climate and southern Africa’s water–energy–food nexus. Nat.
Clim. Chang. 5, 837–846. doi: 10.1038/nclimate2735
D’odorico, P., Davis, K. F., Rosa, L., Carr, J. A., Chiarelli, D., Dell’angelo,
J., et al. (2018). The global food-energy-water nexus. Rev. Geophys. 56,
456–531. doi: 10.1029/2017RG000591
Folberth, C., Skalsky, R., Moltchanova, E., Balkovic, J., Azevedo, L. B.,
Obersteiner, M., et al. (2016). Uncertainty in soil data can outweigh climate
impact signals in global crop yield simulations. Nat. Commun. 7:11872.
doi: 10.1038/ncomms11872
Galaitsi, S., Veysey, J., and Huber-Lee, A. (2018). “Where is the added value?
A review of the water-energy-food nexus literature,” in: SEI Working Paper
(Stockholm: Stockholm Environment Institute).
Frontiers in Environmental Science | www.frontiersin.org 9 April 2019 | Volume 7 | Article 50
Liu et al. Understanding WFE Nexus in China
Gassman, P. W., Williams, J. R., Benson, V. W., Izaurralde, R. C., Hauck, L. M.,
Jones, C. A., et al. (2005). Historical development and applications of the EPIC
and APEX Models. Ames: Working Paper 05-WP 397.
Hanasaki, N., Kanae, S., Oki, T., Masuda, K., Motoya, K., Shirakawa, N.,
et al.(2008). An integrated model for the assessment of global water resources–
part 1: model description and input meteorological forcing. Hydrol. Earth Syst.
Sci. 12, 1007–1025. doi: 10.5194/hess-12-1007-2008
Hoff, H. (2011). “Understanding the Nexus,” in Background Paper for the
Bonn 2011 Nexus Conference: The Water, Energy and Food Security Nexus
(Stockholm: Stockholm Environment Institute).
Izaurralde, R. C., Williams, J. R., Mcgill, W. B., Rosenberg, N. J., and
Jakas, M. C. Q. (2006). Simulating soil C dynamics with EPIC: model
description and testing against long-term data. Ecol. Modell. 192, 362–384.
doi: 10.1016/j.ecolmodel.2005.07.010
Liu, J., Yang, H., Cudennec, C., Gain, A. K., Hoff, H., Lawford, R., et al. (2017).
Challenges in operationalizing the water–energy–food nexus. Hydrol. Sci. J. 62,
1714–1720. doi: 10.1080/02626667.2017.1353695
Liu, W., Yang, H., Ciais, P., Stamm, C., Zhao, X., Williams, J. R., et al. (2018).
Integrative crop-soil-management modeling to assess global phosphorus
losses from major crop cultivations. Glob. Biogeochem. Cycles 32, 1074–1086.
doi: 10.1029/2017GB005849
Liu, W., Yang, H., Folberth, C., Wang, X., Luo, Q., and Schulin, R. (2016a). Global
investigation of impacts of PET methods on simulating crop-water relations
for maize. Agric. For. Meteorol. 221, 164–175. doi: 10.1016/j.agrformet.2016.
02.017
Liu, W., Yang, H., Liu, J., Azevedo, L. B., Wang, X., Xu, Z., et al.
(2016b). Global assessment of nitrogen losses and trade-offs with
yields from major crop cultivations. Sci. Total Environ. 572, 526–537.
doi: 10.1016/j.scitotenv.2016.08.093
Liu, X., Liu,W., Yang, H., Tang, Q., Flörke,M.,Masaki, Y., et al. (2019).Multimodel
assessments of human and climate impacts on mean annual streamflow in
China. Hydrol. Earth Syst. Sci. 23, 1245–1261. doi: 10.5194/hess-23-1245-2019
Liu, X., Tang, Q., Cui, H., Mu, M., Gerten, D., Gosling, S. N., et al. (2017).
Multimodel uncertainty changes in simulated river flows induced
by human impact parameterizations. Environ. Res. Lett. 12:025009.
doi: 10.1088/1748-9326/aa5a3a
Liu, X., Tang, Q., Voisin, N., and Cui, H. (2016c). Projected impacts of climate
change on hydropower potential in China. Hydrol. Earth Syst. Sci. 20,
3343–3359. doi: 10.5194/hess-20-3343-2016
Liu, X., Tang, Q., Zhang, X., and Leng, G. (2016d).Modeling the Role of Vegetation
in Hydrological Responses to Climate Change. Hoboken, NJ: Wiley & Sons, Inc.
doi: 10.1002/9781118971772.ch10
Mueller, N. D., Gerber, J. S., Johnston, M., Ray, D. K., Ramankutty, N., and Foley, J.
A. (2012). Closing yield gaps through nutrient and water management. Nature
490, 254–257. doi: 10.1038/nature11420
Müller, C., Elliott, J., Chryssanthacopoulos, J., Arneth, A., Balkovic, J., Ciais,
P., et al. (2017). Global gridded crop model evaluation: benchmarking,
skills, deficiencies and implications. Geosci. Model Dev. 10, 1403–1422.
doi: 10.5194/gmd-10-1403-2017
MWRC, theMinistry ofWater Resources of the People’s Republic of China. (2007).
The Bulletin of Water Resources of China 2006 [in Chinese].
Pastor, A. V., Ludwig, F., Biemans, H., Hoff, H., and Kabat, P. (2014). Accounting
for environmental flow requirements in global water assessments.Hydrol. Earth
Syst. Sci. 18, 5041–5059. doi: 10.5194/hess-18-5041-2014
Perrone, D., and Hornberger George, M. (2014). Water, food, and energy security:
scrambling for resources or solutions? Wiley Interdiscipl. Rev. Water 1, 49–68.
doi: 10.1002/wat2.1004
Piao, S. L., Ciais, P., Huang, Y., Shen, Z. H., Peng, S. S., Li, J. S., et al. (2010). The
impacts of climate change on water resources and agriculture in China. Nature
467, 43–51. doi: 10.1038/nature09364
Portmann, F. T., Siebert, S., and Doll, P. (2010). MIRCA2000-global monthly
irrigated and rainfed crop areas around the year 2000: a new high-resolution
data set for agricultural and hydrological modeling. Global Biogeochem. Cycles
24:GB1011. doi: 10.1029/2008GB003435
Ringler, C., Bhaduri, A., and Lawford, R. (2013). The nexus across water,
energy, land and food (WELF): potential for improved resource use
efficiency? Curr. Opin. Environ. Sustain. 5, 617–624. doi: 10.1016/j.cosust.2013.
11.002
Rost, S., Gerten, D., Bondeau, A., Lucht, W., Rohwer, J., and Schaphoff, S.
(2008). Agricultural green and blue water consumption and its influence on
the global water system. Water Resour. Res. 44:W09405. doi: 10.1029/2007WR
006331
Sacks, W. J., Deryng, D., Foley, J. A., and Ramankutty, N. (2010). Crop planting
dates: an analysis of global patterns. Global Ecol. Biogeogr. 19, 607–620.
doi: 10.1111/j.1466-8238.2010.00551.x
Schewe, J., Heinke, J., Gerten, D., Haddeland, I., Arnell, N. W., Clark, D. B., et al.
(2014). Multimodel assessment of water scarcity under climate change. Proc.
Nat. Acad. Sci. U.S.A. 111, 3245–3250. doi: 10.1073/pnas.1222460110
Scott, C. A. (2013). Electricity for groundwater use: constraints and opportunities
for adaptive response to climate change. Environ. Res. Lett. 8:035005.
doi: 10.1088/1748-9326/8/3/035005
Sellers, P. J., Randall, D. A., Collatz, G. J., Berry, J. A., Field, C. B., Dazlich,
D. A., et al. (1996). A revised land surface parameterization (SiB2) for
atmospheric GCMs 0.1. Model formulation. J. Clim. 9, 676–705. doi: 10.1175/
1520-0442(1996)009<0676:ARLSPF>2.0.CO;2
Shen, Y. J., Li, S., Chen, Y. N., Qi, Y. Q., and Zhang, S. W. (2013). Estimation
of regional irrigation water requirement and water supply risk in the arid
region of Northwestern China 1989–2010. Agric. Water Manag. 128, 55–64.
doi: 10.1016/j.agwat.2013.06.014
Siebert, S., Burke, J., Faures, J. M., Frenken, K., Hoogeveen, J., Doll, P., et al. (2010).
Groundwater use for irrigation–a global inventory. Hydrol. Earth Syst. Sci. 14,
1863–1880. doi: 10.5194/hess-14-1863-2010
Smajgl, A., Ward, J., and Pluschke, L. (2016). The water–food–
energy nexus – realising a new paradigm. J. Hydrol. 533, 533–540.
doi: 10.1016/j.jhydrol.2015.12.033
Stickler, C. M., Coe, M. T., Costa, M. H., Nepstad, D. C., McGrath, D. G., Dias, L.
C. P., et al. (2013). Dependence of hydropower energy generation on forests in
the Amazon Basin at local and regional scales. Proc. Natl. Acad. Sci. U.S.A. 110,
9601–9606. doi: 10.1073/pnas.1215331110
Tang, Q. H., Oki, T., Kanae, S., and Hu, H. P. (2007). The influence of precipitation
variability and partial irrigation within grid cells on a hydrological simulation.
J. Hydrometeorol. 8, 499–512. doi: 10.1175/JHM589.1
Tang, Q. H., Oki, T., Kanae, S., and Hu, H. P. (2008). Hydrological cycles change in
the yellow river basin during the last half of the twentieth century. J. Clim. 21,
1790–1806. doi: 10.1175/2007JCLI1854.1
Weedon, G. P., Balsamo, G., Bellouin, N., Gomes, S., Best, M. J., and Viterbo, P.
(2014). The WFDEI meteorological forcing data set: WATCH Forcing Data
methodology applied to ERA-Interim reanalysis data. Water Resour. Res. 50,
7505–7514. doi: 10.1002/2014WR015638
West, P. C., Gerber, J. S., Engstrom, P. M., Mueller, N. D., Brauman, K. A., Carlson,
K. M., et al. (2014). Leverage points for improving global food security and the
environment. Science 345, 325–328. doi: 10.1126/science.1246067
Williams, J. R. (1995). “The EPIC model,” in Computer Models of Watershed
hydrology, ed V. P. Singh (Highlands Ranch: Water Resources Publications),
909–1000.
Williams, J. R., Jones, C. A., and Dyke, P. T. (1984). A modeling approach to
determining the relationship between erosion and soil productivity. Trans. Asae
27, 129–144. doi: 10.13031/2013.32748
Zeng, R., Cai, X., Ringler, C., and Zhu, T. (2017). Hydropower versus
irrigation—an analysis of global patterns. Environ. Res. Lett. 12:034006.
doi: 10.1088/1748-9326/aa5f3f
Zhang, J., Campana, P. E., Yao, T., Zhang, Y., Lundblad, A., Melton, F., et al. (2017).
The water-food-energy nexus optimization approach to combat agricultural
drought: a case study in the United States. Appl. Energy 227, 449–464.
doi: 10.1016/j.apenergy.2017.07.036
Conflict of Interest Statement: The authors declare that the research was
conducted in the absence of any commercial or financial relationships that could
be construed as a potential conflict of interest.
Copyright © 2019 Liu, Yang, Tang and Liu. This is an open-access article distributed
under the terms of the Creative Commons Attribution License (CC BY). The use,
distribution or reproduction in other forums is permitted, provided the original
author(s) and the copyright owner(s) are credited and that the original publication
in this journal is cited, in accordance with accepted academic practice. No use,
distribution or reproduction is permitted which does not comply with these terms.
Frontiers in Environmental Science | www.frontiersin.org 10 April 2019 | Volume 7 | Article 50