Understanding the Scottish Rural Economy · rural economy, using the available data; develops the...
74
AGRICULTURE, ENVIRONMENT AND MARINE research social Understanding the Scottish Rural Economy
Transcript of Understanding the Scottish Rural Economy · rural economy, using the available data; develops the...

AGRICULTURE, ENVIRONMENT AND MARINE
researchsocial
Understanding the ScottishRural Economy

1
Understanding the Scottish Rural Economy
23 FEBRUARY 2018
AUTHORS: Eva Kleinert, Graeme Beale, Neil Henderson, Neil Davidson, RESAS (Rural & Environment Science & Analytical Services)

2
Contents
Main Findings........................................................................................................... 3
List of Acronyms ..................................................................................................... 5
Defining the Rural Economy .................................................................................. 6
Comparing industry sectors in rural and urban Scotland..................................... 11
The largest and smallest sectors in rural Scotland .............................................. 15
The share of Agriculture, Fishing and Forestry for the rural economy ................ 18
Rural growth over time......................................................................................... 21
Employment and Unemployment in Rural Scotland .......................................... 26
Employment by sector, excluding small businesses and self-employment ......... 28
Employment by Sector, including small businesses and self-employment ......... 30
Patterns of Employment ...................................................................................... 33
The Structure of the Private Sector in Rural Scotland ...................................... 34
Private Sector Employment ................................................................................. 37
Structure of the Private Sector in Rural Scotland ................................................ 39
UK Sectoral Productivity ...................................................................................... 41
Earnings and the Gender Pay Gap ...................................................................... 42
Access and Convenience of Services ................................................................. 44
Travel Patterns ....................................................................................................... 47
Housing .................................................................................................................. 47
Overview ................................................................................................................. 48
Annex 1: Statistical Annex ................................................................................... 50
Annex 2: Urban and Rural Definitions ................................................................. 60
Randall Definition rebased-2017 ......................................................................... 61
Fourfold RESAS Classification ............................................................................ 62
Annex 3: Sources .................................................................................................. 66
Annex 4: UK Standard Industrial Classification of Economic Activities ......... 68

3
Main Findings
The economy of rural Scotland is both similar to, and tightly integrated with the economy of urban Scotland. However, distinct differences, often related to distance and scarcity, remain between urban and rural economies. The rural economy has undergone significant structural change over the past twenty years. This working paper sets out our current understanding of the Scottish rural economy, using the available data; develops the information on household and employment data and points to key challenges for the rural economy including broadband services, and fuel poverty. This paper does not deal with natural capital, ecosystem services or the wider public benefits supplied to or by businesses in rural Scotland. However, it supports a more detailed approach towards defining the rural economy as particularly industry sectors in Mainly Rural parts of Scotland develop differently than in the Islands and Remote Rural areas.
Key Findings
The largest sectors of both the rural and urban economy are ‘Public Administration’ and ‘Distribution, Wholesale and Retail’ in terms of their Gross Value Added. In Islands and Remote areas, ‘Real Estate’ (11% GVA of the total economy in Islands and Remote) and ‘Construction’ (9% GVA) come next, whereas in more accessible Mainly Rural areas ‘Manufacturing’ (14% GVA) and ‘Real Estate’ (12% GVA) are the third and fourth largest sectors.
‘Agriculture, Fisheries and Forestry’ account for 4% of the GVA in Islands and Remote and 3% in Mainly Rural Scotland. On Scottish average, the sector accounts for 1.3% of the GVA. It is the smallest employer in Mainly Rural Scotland (4.4%) and the fifth smallest employer in the Islands and Remote areas (7.7%).
Overall GVA growth since 1997 has been positive for rural Scotland and highest in Mainly Rural areas. The fastest growing sector is ‘Business Services’ (up by 169 %) and the smallest growth was in ‘Agriculture, Fisheries and Forestry’ (up by 34%). Growth rates for the Islands and Remote Rural Scotland are largest in Construction (up by 131%). The worst performing sectors here are ‘Agriculture, Fisheries and Forestry’ with no growth and ‘Financial Services’ with a decline of 29%.
GVA growth between 2007 and 2015 has been positive across Scotland and strongest in Mainly Rural areas (24%), followed by GVA growth in Larger Cities and Islands and Remote Rural areas (both 19%) and Urban with Substantial Rural areas (14% GVA growth since 2007).

4
The rural economy is highly variable in economic performance between sectors and local authorities. Aberdeenshire and Highland councils have the largest GVA in most sectors; the island authorities are much smaller in employment and GVA terms.
Women living in Remote Rural Scotland have the lowest annual income of any group, and the largest median Gender Pay gap being at £5,076.
Unemployment is lower in Rural Scotland than urban Scotland, and employment and activity rates are higher, though East Ayrshire in particular has unemployment far above the national average. Rural out-migration may mitigate this difference.
The pattern of employment is different in Rural Scotland. More people are in part time employment in Remote Rural Scotland (31%) than urban Scotland (27%); and self- employment is more common in Remote Rural Scotland (22%) than urban Scotland (10%).
Households in rural areas show differences between Accessible Rural and Remote Rural Scotland. Accessible Rural areas are characterised by higher incomes, and better access to household services, and lower levels of fuel poverty.
68% of private sector employees in Remote Rural Scotland are in small businesses. This compares with 54% of private sector employees in Accessible Rural Scotland and only 32% of private sector employees in the Rest of Scotland.

5
List of Acronyms
BEIS Department for Business, Energy and Industrial
Strategy
FTE Full-time equivalent
GVA Gross Value Added
HIE Highlands and Islands Enterprise
IDBR Inter-Departmental Business Register
ONS Office for National Statistics
PAYE Pay As You Earn
PCA Principal Component Analysis
RESAS Rural & Environment Science & Analytical Services
SEB Scottish Economic bulletin
SG Scottish Government
VAT Value-added tax

6
Defining the Rural Economy There is not an agreed definition of the rural economy in Scotland, and often people use the term as a synonym for agriculture. In this paper, we take the approach that what matters in Scotland’s rural economy is what is produced, built, delivered etc. in Rural Scotland and by people living there. As a result, we have looked across all sectors and employment categories to give as full a picture as possible of Scotland’s rural economy today. The first challenge when defining the rural economy, is to establish which areas of Scotland count as rural. Whilst this may seem straightforward, there are real challenges due to data availability, and so for different questions different definitions need to be applied. For social survey data there is a standardised approach to defining whether respondents or households are in urban Scotland, or varying degrees of rurality or more Remote Rural Scotland. Definitions for social survey data are updated using data from the National Records of Scotland on population and transport data on remoteness. Currently, there is no equivalent standardised measurement approach for rural economy data as economic data such as Gross Value Added is only available at the local authority level and not at a disaggregate data zone level. So while for social survey data we can distinguish areas in Scotland at a much smaller level, for economic data we need to define which local authority is considered rural or urban. In previous RESAS work we have made use of the Randall definition of Rural Scottish local authorities, first developed in 1985. The Randall definition is binary and only distinguishes between rural and urban. It is solely based on population density (see table below). As a result of using the Randall definition it is hard to get a nuanced picture of the variety within rural Scotland, and the two-fold approach is seen as being a too simplistic instrument for analysis. In order to get a more holistic and detailed picture of rural Scotland, this paper applies a new classification of the rural economy taking more factors into account that are considered rural, both in the literature and in existing classifications. As a result of a statistical analysis (see methodological annex), the new RESAS Classification clusters local authorities according to their level of rurality and establishes four different groups, which are labelled as “Larger Cities”, “Urban with Substantial Rural areas”, “Mainly Rural” and “Islands and Remote” (see figure 1 below).

7
Figure 1: RESAS Classification of the rural economy
This new classification of the rural economy does not replace the main Scottish Government Urban/Rural classification which should be used for all non-economic data. The classification is based on a quantitative analysis that allows us to identify key drivers of rurality such as the relative share of population in pensionable age and broadband connectivity. An index was calculated that ranks local authorities according to their degree of rurality. In a second step, these local authorities are then divided into four groups according to their share of population living in urban settlements. Because this index for the RESAS classification of the rural economy does not neatly follow the share of the urban population, some local authorities are classed differently than the share of their urban population would suggest. South Ayrshire and Angus for example have more than 50% of their population living in large urban and other urban areas and thus should be classed Urban with Substantial Rural. However, because according to their RESAS score they clearly are more rural than Stirling and other more urban areas, they are classed as Mainly Rural. While the island authorities and Argyll and Bute are classed as Islands and Remote Rural due to their RESAS score and the low share of urban population, Highland is classed as Mainly Rural despite the remoteness of large parts of the local authority. This is mainly due to Inverness. Dumfries and Galloway and Scottish Borders are also classed as Mainly Rural and not Island and Remote

8
Rural due to their relatively lower share of population living in settlements under 10,000 and generally higher population density compared to the island authorities. These examples illustrate that the RESAS classification as all other Urban/Rural classifications is an aggregation of data and thus simplifies the heterogeneity of the Scottish rural economy. However, as it is based on wide range of data and quantitative analysis, the classification is a useful tool to describe the rural economy.

9
Table 1 Urban/ Rural classifications
SG Main Urban Rural classification: The Randall Definition: The RESAS Classification:
According to the Scottish Government Urban/Rural classification, rural Scotland is defined as settlements with a population of less than 3,000. A settlement is defined to be a group of high density postcodes whose combined population rounds to 500 people or more. By analysing drive times to larger settlements, we can divide rural Scotland into Accessible Rural and Remote Rural. On the standard Urban/Rural classification, around 98% of Scotland’s landmass and around 19% of its population are identified as rural. The classification allows for a range of analyses at differing levels, each of which makes it possible to talk in progressively more detail about the statistics for rural households. The data sourced from the Inter-Departmental Business Register for example use the Urban/Rural sixfold classification. These figures exclude self-employment and businesses that are not VAT registered. The Urban/Rural classification is also not applicable to economic data, as for example Gross Value Added figures are only provided at the local authority level and not at the data zone level.
The Randall definition identifies rural local authorities with a population density below one person per hectare. As it is at local authority level it tends to over-state the rural population (e.g. the populations of Stirling, Perth and Inverness are considered ‘rural) and understate the rural area (e.g. East Lothian and South Lanarkshire are considered ‘urban’). According to the Randall definition of rurality, 89% of Scotland's landmass and 29% of its population is classified as rural (rebased 2017). However, as most economic data is only available at LA level, Randall still serves a useful purpose.1 The definitions are included in the annex 2 to this paper.
The RESAS definition groups the economies of local authorities according to their degree of rurality. Rurality is defined as a combination of various factors such as demographic and geographical data, broadband connectivity and access to services. Local authorities are divided into four groups and cut-off points have been chosen based on the local authorities’ share of the population living in large urban or other urban areas. More than 90% of the population live in large urban areas in the most urban group – classed as ‘Larger Cities’. This group is followed by ‘Urban with Substantial Rural areas’ where more than 50% of the population live in large and other urban areas. Less than 20% of the population live in urban and other urban areas in ‘Islands and Remote areas’ and the rest is defined as ‘Mainly Rural’.
1 Details on the Randall definition are here: http://www.gov.scot/Publications/2009/08/071 15535/14.

10
Details of the areas covered by the three definitions are shown in the three maps below. Map one follows the SG Urban/Rural classification to data zones, the second map applies the Randall definition to local authorities and the third map uses the new RESAS Classification for local authorities.
11
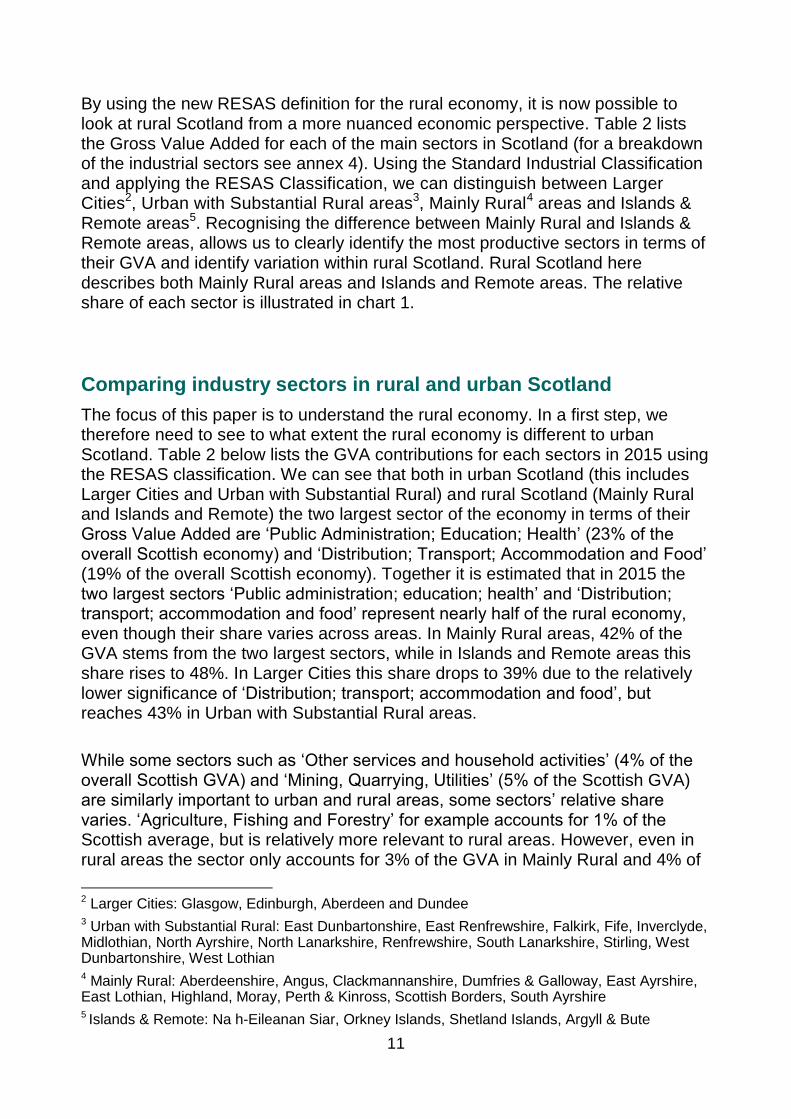
By using the new RESAS definition for the rural economy, it is now possible to look at rural Scotland from a more nuanced economic perspective. Table 2 lists the Gross Value Added for each of the main sectors in Scotland (for a breakdown of the industrial sectors see annex 4). Using the Standard Industrial Classification and applying the RESAS Classification, we can distinguish between Larger Cities2, Urban with Substantial Rural areas3, Mainly Rural4 areas and Islands & Remote areas5. Recognising the difference between Mainly Rural and Islands & Remote areas, allows us to clearly identify the most productive sectors in terms of their GVA and identify variation within rural Scotland. Rural Scotland here describes both Mainly Rural areas and Islands and Remote areas. The relative share of each sector is illustrated in chart 1.
Comparing industry sectors in rural and urban Scotland
The focus of this paper is to understand the rural economy. In a first step, we therefore need to see to what extent the rural economy is different to urban Scotland. Table 2 below lists the GVA contributions for each sectors in 2015 using the RESAS classification. We can see that both in urban Scotland (this includes Larger Cities and Urban with Substantial Rural) and rural Scotland (Mainly Rural and Islands and Remote) the two largest sector of the economy in terms of their Gross Value Added are ‘Public Administration; Education; Health’ (23% of the overall Scottish economy) and ‘Distribution; Transport; Accommodation and Food’ (19% of the overall Scottish economy). Together it is estimated that in 2015 the two largest sectors ‘Public administration; education; health’ and ‘Distribution; transport; accommodation and food’ represent nearly half of the rural economy, even though their share varies across areas. In Mainly Rural areas, 42% of the GVA stems from the two largest sectors, while in Islands and Remote areas this share rises to 48%. In Larger Cities this share drops to 39% due to the relatively lower significance of ‘Distribution; transport; accommodation and food’, but reaches 43% in Urban with Substantial Rural areas.
While some sectors such as ‘Other services and household activities’ (4% of the overall Scottish GVA) and ‘Mining, Quarrying, Utilities’ (5% of the Scottish GVA) are similarly important to urban and rural areas, some sectors’ relative share varies. ‘Agriculture, Fishing and Forestry’ for example accounts for 1% of the Scottish average, but is relatively more relevant to rural areas. However, even in rural areas the sector only accounts for 3% of the GVA in Mainly Rural and 4% of
2 Larger Cities: Glasgow, Edinburgh, Aberdeen and Dundee 3 Urban with Substantial Rural: East Dunbartonshire, East Renfrewshire, Falkirk, Fife, Inverclyde, Midlothian, North Ayrshire, North Lanarkshire, Renfrewshire, South Lanarkshire, Stirling, West Dunbartonshire, West Lothian 4 Mainly Rural: Aberdeenshire, Angus, Clackmannanshire, Dumfries & Galloway, East Ayrshire, East Lothian, Highland, Moray, Perth & Kinross, Scottish Borders, South Ayrshire 5 Islands & Remote: Na h-Eileanan Siar, Orkney Islands, Shetland Islands, Argyll & Bute

12
the GVA in Islands and Remote Rural areas. Unsurprisingly, ‘Finance’ is relatively more important to Larger Cities (13%) than to Mainly Rural (2%) and Islands and Remote Rural (1%). ‘Business Services’ (10% of the Scottish GVA) is bigger in Larger Cities (13%) than in Mainly Rural (9%) and Islands and Remote Rural Scotland (7%).
There are a number of data challenges which means there can be problems in providing a robust analysis. For example, there are challenges in allocation of business, such as around head office locations, but there is not a clear way to simplify that for publication, and it is not clear if this has a specific urban/ rural effect.
To summarize, data on GVA in 2015 shows how the Scottish rural economy is different from the urban economy. The following section now examines differences within the rural economy.

13
Table 2: Rural and Urban GVA by Sector 2015 Industry Sector Larger
Cities GVA
£m
Urban with Substantial Rural GVA
£m
Mainly Rural
GVA £m
Islands and
Remote GVA £m
Total GVA
£m
Larger Cities
GVA%
Urban with Substantial
Rural GVA%
Mainly Rural
GVA%
Islands and
Remote GVA%
Total
Agriculture, Fish and Forestry 124 365 998 120 1,607 0.2% 1% 3% 4% 1% Mining, Quarrying, Utilities 3,153 1,759 1807 225 6,944 6% 4% 6% 7% 5%
Manufacturing 3,375 6,028 4,600 259 14,262 6% 15% 15% 8% 11%
Construction 2,144 3,428 2,336 284 8,192 4% 8% 7% 9% 6% Distribution; transport; accommodation and food 8,567 8,194 6,523 699 23,983 16% 20% 21% 21% 19% Information and Communications 2,907 1,294 491 67 4,759 6% 3% 2% 2% 4%
Finance 6,618 1,212 484 25 8,339 13% 3% 2% 1% 7%
Real Estate 4,638 4008 3,745 366 12,757 9% 10% 12% 11% 10% Business Services 6,952 3185 2,745 237 13,119 13% 8% 9% 7% 10% Public administration; education; health 1,1875 9,456 6,433 872 28,636 23% 23% 21% 27% 23% Other services and household activities 1,767 1,617 1,166 118 4,668 3% 4% 4% 4% 4%
Total GVA 52,120 40,546 31,328 3,272 127,266 100% 100% 100% 100% 100%
Source: ONS local authority level GVA Statistics, as at August 2017 (Using Scottish Government RESAS Classification 2018)

14
Chart 1: The three largest and smallest industry sectors in terms of GVA share in Mainly Rural and Islands and Remote Rural Scotland, 2015
Source: ONS local authority level GVA Statistics, as at August 2017 (Using Scottish Government RESAS Classification 2018)

15
The largest and smallest sectors in rural Scotland
To understand the Scottish rural economy, chart 1 above illustrates the three largest and three smallest sectors of the economy in Mainly Rural and Islands and Remote Rural Scotland in 2015.
Unsurprisingly, we see that the two largest sectors are ‘Distribution; Transport; Accommodation and Food’ and ‘Public Administration, Education and Health’. However, while the former sector accounts for 21% in both areas, the latter is relatively more important to Islands and Remote areas as 27% of the GVA in the areas stem from and ‘Public Administration, Education and Health’, but only 21% of the GVA in Mainly Rural areas.
Additionally, we see that while the third largest sector in Mainly Rural areas is Manufacturing (15% of the area GVA), it only accounts for 8% of the GVA in Islands and Remote. Here, Real Estate is the third largest sector (11% of the GVA). It needs to be highlighted that Real Estate accounts for 12% in Mainly Rural Scotland, which makes it the fourth largest sector.
The three smallest sectors in 2015 account for around 7% of rural economies. ‘Agriculture, Fishing and Forestry’ generates 3% of the GVA in Mainly Rural Scotland and 4% of the GVA in the Islands and Remote areas. The Scottish average is 1.3%. ‘Information and Communications’ accounts for 2% in both areas and Finance for 2% in Mainly Rural and 1% in Islands and Remote.
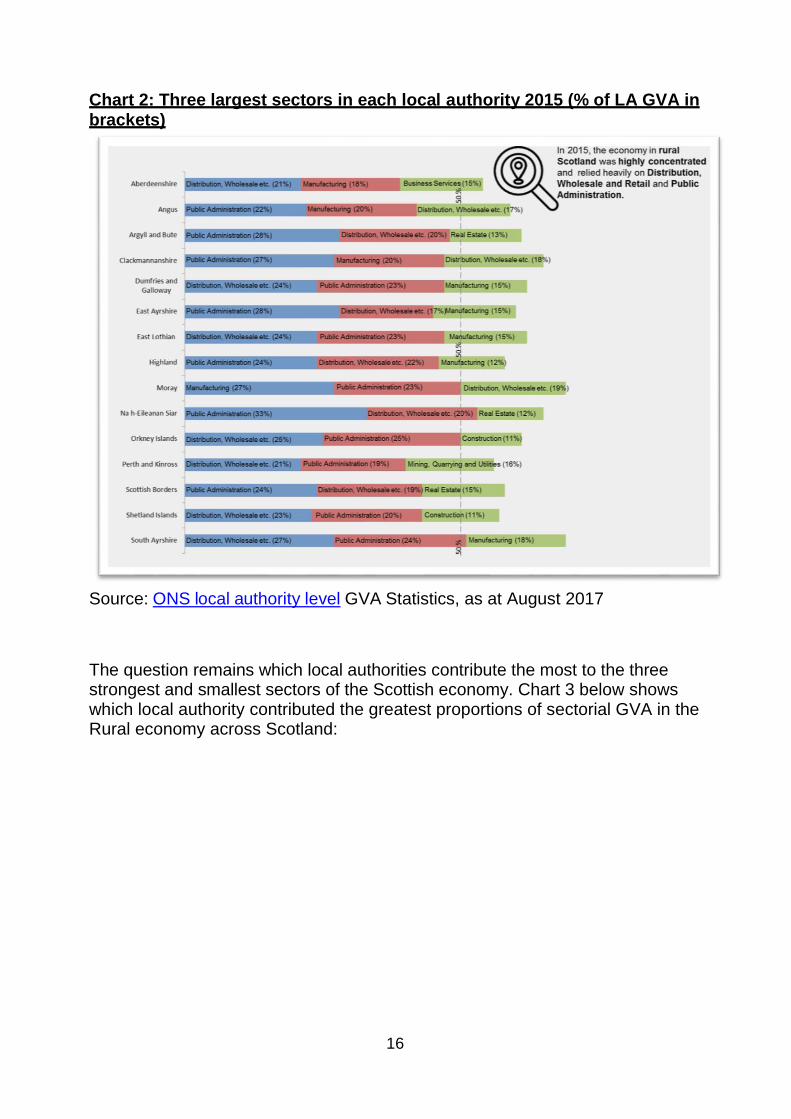
Because the RESAS classification aggregates data, it does not fully capture the heterogeneity of rural Scotland. Chart 2 illustrates the three largest sectors for each rural local authority. Overall, we see that as expected Distribution and Public Administration are amongst the three largest sectors in every local authority. Manufacturing is amongst the three largest sectors in Aberdeenshire (18% of local GVA), Angus (20%), Clackmannanshire (20%), Dumfries and Galloway (15%), East Ayrshire (15%), East Lothian (15%) Highland (12%), Moray (27%) and South Ayrshire (18%). Construction contributes substantially to the economy in Orkney Islands (11%) and Shetland Islands (11%), whereas ‘Real Estate’ accounts for 15% of the economy in Scottish Borders, 12% in Na h-Eileanan Siar and 13% in Argyll and Bute. ‘Business Services’ is the third largest sector in Aberdeenshire (15%) and 16% of the GVA in Perth and Kinross stems from ‘Mining, Quarrying and Utilities’.
16
Chart 2: Three largest sectors in each local authority 2015 (% of LA GVA in brackets)
Source: ONS local authority level GVA Statistics, as at August 2017
The question remains which local authorities contribute the most to the three strongest and smallest sectors of the Scottish economy. Chart 3 below shows which local authority contributed the greatest proportions of sectorial GVA in the Rural economy across Scotland:

17
Chart 3: Largest contributions to Sector by local authorities of rural economy, 2015
Source: ONS local authority level GVA Statistics, as at August 2017 The large and populous local authorities – Highland and Aberdeenshire – dominate the overall performance of Scotland’s rural economies. Nevertheless, the two sectors with a relatively large rural contribution are ‘Manufacturing’ and ‘Agriculture, Fishing and Forestry’. As discussed above, on Scottish average the Agriculture sector only accounts for about 1% of the GVA. A third of this stems from Aberdeenshire (14%), Angus (10%) and Highland (8%). Aberdeenshire and Highland – followed by Moray – also contribute substantially to the Manufacturing sectors. Aberdeenshire, Highland and Perth and Kinross dominate the rural economy’s contribution to the Scottish economy in the Distribution, Public Administration and Information and Communications sectors. Perth and Kinross are the third biggest contributor amongst the rural local authorities to the Scottish Distribution and Public Administration sector with 2% of the Scottish Public Administration GVA and 3% of the Distribution GVA generated in the local authority.

18
The share of Agriculture, Fishing and Forestry for the rural
economy
Scotland’s rural economy is often equated with ‘Agriculture, Fishing and Forestry’. However, with a total GVA of £1.6 billion (see table 2), ‘Agriculture, Fishing and Forestry’ only accounts for about 1% of the overall Scottish economy. Even in rural Scotland, the GVA share of the sector is marginal compared to other sectors of the economy. The largest contributor to the sector unsurprisingly is the rural economy. Of the £1.6 billion GVA nearly 70% is generated in Mainly Rural and Islands and Remote areas. Chart 4 below illustrates which local authorities contribute the most. In Angus and Orkney Islands, 8% of the overall GVA is based on ‘Agriculture, Fishing and Forestry’, followed by East Ayrshire with 6%. In contrast to this, the sector only accounts for 1% of the GVA in Clackmannanshire and South Ayrshire and 2% in Moray, Argyll and Bute and Perth and Kinross.
Chart 4: GVA share of Agriculture Fish & Forestry of rural local authorities,
2015
Source: ONS local authority level GVA Statistics, as at August 2017 Examining sectors independently from each other does not reflect how interconnected these are. This is for example the case for the sector ‘Agriculture, Forestry and Fishing’ that is – among others – linked with ‘Accommodation and Food Services’ and ‘Sustainable Tourism’ in particular. Chart 5 illustrates the importance of those two sectors to the rural economy. It

19
needs to be highlighted here that in contrast to all previous graphs, the data does not stem from the ONS, but from the Inter-Departmental Business Register, produced via the Annual Business Survey. This data is structured differently so it is possible to dive deeper into individual sectors. It also allows us to more closely examine sectors that are connected with other industrial sectors which helps us to understand that sectors within the rural economy are not independent. However, data from the Inter-Departmental Business Register excludes the ‘Finance’ sector, parts of the agriculture and the public sector and also excludes non registered VAT businesses and self-employment. Hence, the data presented below does not reflect the GVA share of ‘Sustainable tourism’ and ‘Accommodation and food services’ of the overall economy, but is helpful in order to show the significance of not only agriculture, but also its surrounding sectors. The agricultural sector contributes to food production, preservation of natural resources, employment and sustainable development of the rural territory. Besides agriculture, the two sectors tourism and food and accommodation are therefore affected by these areas. Chart 5: Private Sector GVA share of ‘Sustainable Tourism’ and ‘Accommodations and Food Services’, 2015
Source: Inter-Departmental Business Register, as at March 2016 (Using RESAS Classification 2018)

20
Following the RESAS Classification, data from the Annual Business Survey show that in 2015, accommodation and food services accounted for 7.9% of the GVA in Mainly Rural parts of Scotland (chart 5). This however only includes the private sectors and thus excludes the public sector, which, as we know from the previous section, accounts for a third of the GVA in Remote Rural Scotland. In rural areas of Scotland, accommodation and food services accounts for 4.6% to the economy which is similar to the cities. In Urban with Substantial Rural areas, the sector only contributes 3.1% to the economy. We can see similar trends for the sustainable tourism sector that is relatively more important for remote areas, followed by rural and urban areas. Chart 6 shows the contributions of each rural local authority to ‘Sustainable Tourism’ in 2015 and the sector growth between 2009 and 2015. Chart 6: 2015 GVA performance of Mainly Rural and Islands & Remote local authorities in the ‘Sustainable Tourism’ sector and changes between 2009 and 2015
Source: Scottish Annual Business Statistics, as at August 2017 (using RESAS Classification, 2018) In 2015, Highland, Aberdeenshire and Perth and Kinross dominated the ‘Sustainable Tourism’ sector in rural Scotland. Aberdeenshire has also seen the strongest relative growth as the sector’s GVA has increased by 156%. In other

21
words, Aberdeenshire’s Sustainable Tourism has grown by 2.5 times between 2009 and 2015. There has been positive growth in all local authorities with the exception of Scottish Borders (down by 32%), Angus (-17%) and Orkney Islands (down by 4%).
Rural growth over time
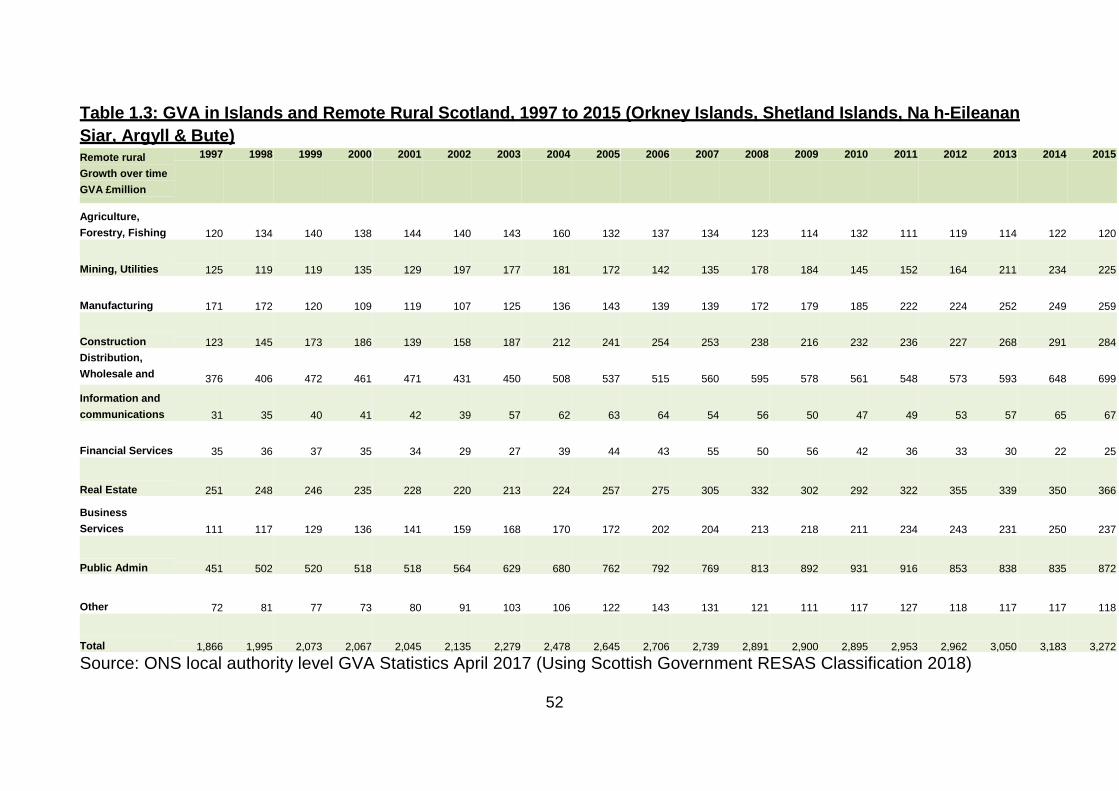
This positive trend of a growing rural economy is also captured by chart 6 below that highlights the sectors that have grown strongest since 1997 in rural Scotland. The data used here stems from the ONS and includes all sectors and both the public and private sector. Scotland’s Mainly Rural economy has nearly doubled between 1997 and 2015, from around £16.4 billion in 1997 to around £31.3 billion in 2015 (91% increase), while the economy in Islands and Remote areas has grown from £1.9 billion in 1997 to £3.3 billion in 2015 (74% increase). For a more detailed breakdown see table 1.2 and 1.3 in annex. Figure 2 below illustrates the sectors that have grown strongest and weakest between 1997 and 2015.
Figure 2: Relative GVA performance of strongest and weakest growth sectors in rural local authorities – between 1997 and 2015 (1997=100)
Source: Inter-Departmental Business Register, as at March 2016 (Using Scottish Government RESAS Classification 2018) Here, seven sectors out of eleven are most striking: ‘Business Services’, ‘Other Services and Household Activities’, ‘Information and Communications’,

22
‘Construction’, ‘Agriculture, Fishing and Forestry’, ‘Manufacturing’ and ‘Financial Services’. While the former four sectors have shown the strongest relative GVA growth between 1997 and 2015, the latter three have grown the least in relative terms. ‘Business Services’ accounts for 7% (Islands and Remote) to 9% (Mainly Rural) of the GVA in rural areas. This sector has grown by 169% since 1997 in Mainly Rural areas. ‘Other services and household activities’ accounting for 4% in both rural areas has grown by 148% in Mainly Rural areas. Therefore, these two sectors have shown the strongest GVA increase in the area. In Islands and Remote Rural areas, ‘Information and Communications’ and ‘Construction’ have grown strongest. ‘Information and Communications Services; accounts for 2% in Island and Remote Rural areas and has more than doubled since 1997. ‘Construction’ accounts for 9% of the GVA in the area and has even increased by 131%. On the other end of the scale, we find that ‘Agriculture, Fishing and Forestry’ – accounting for 3% (Mainly Rural) to 4% (Islands and Remote) – has shown the lowest GVA growth in rural Scotland with no growth at all in Islands and Remote and a growth of 34% in Mainly Rural Scotland. ‘Manufacturing’ – accounting for 15% of the GVA in Mainly Rural – has increased by 41% in Mainly Rural Scotland and lastly Financial Services (1% of the GVA in Islands and Remote) is the only sector in rural Scotland that has shrunk by 29% in Islands and Remote Rural Scotland. Looking at the medium term trends for 2007-2015 (chart 7), covering the period of the credit crunch and recession, we can see that overall the Scottish economy has grown since 2007 with stark increases particularly after 2012. What is more, we see that the Mainly Rural economy has grown strongest (up by 24%), followed by the Islands and Remote Scotland and Larger Cities (both up by 19%) and Urban with Substantial Rural areas (up by 14 %). In real terms, the economy in Mainly Rural Scotland has grown from £25.3 billion to £31.3 billion, and in the Islands and Remote Rural areas from £2.7 billion to £3.3 billion (see tables 1.2 and 1.3 in annex 1).

23
Chart 7: GVA relative growth, by area, 2007 to 2015 (2007=100)
Source: Inter-Departmental Business Register, as at March 2016 (Using
Scottish Government RESAS Classification 2018)
However, there are significant differences between rural and Remote Rural areas of Scotland and also between the sectors. For simplicity, chart 8 only shows the three sectors with the strongest growth and the three sectors with the weakest growth or even decline. Overall, we can see that growth rates in more remote parts of Scotland (Islands and Remote) range wider than in mostly rural areas with the highest increase of more than 86 % in Manufacturing and 67% in Mining and Utilities. While the majority of sectors have grown at least slightly, we find that ‘Financial Services’ have diminished by more than half and ‘Agriculture, Fishing and Forestry’; and ‘Other Services’ have also shrunk to 90% of their 2007 value. In more accessible Mainly Rural areas, the ‘Financial Sector’, ‘Agriculture, Fishing and Forestry’ and the ‘Information and Communication’ Sector have lower GVA than in 2007. The rural economy has generally grown between 1997 and 2015 and has also significantly grown between 2007 and 2015. However, we need to clearly distinguish between Mainly Rural and the Islands and Remote parts of Scotland. This is because even though the overall rural economy has grown, growth rates and also the sectors affected vary crucially between areas.

24
Agriculture, Fishing and Forestry in the most rural parts of Scotland has grown compared to 1997, but growth has slowed down in the 2000s. Compared to 2007, the sector has actually declined, most noticeably in the Islands and Remote parts of Scotland.

25
Chart 8: Relative GVA performance of the three fastest and weakest growing sectors – medium term picture, 2007 to 2015 (2007=100)
Source: Inter-Departmental Business Register, as at March 2016 (Using Scottish Government RESAS Classification, 2018)

26
Employment and Unemployment in Rural
Scotland
Employment and unemployment are key drivers of public policy and of the Scottish Rural economy. Employment is measured through a range of household surveys including the Scottish Household Survey, and through the Labour Force Survey. There are structural issues which may affect employment and unemployment in rural Scotland, people may choose to move from rural to urban areas in search of employment reflecting the greater job opportunities. This combined with age structure issues can give rural and especially Remote Rural particular demographic challenges. Bearing this in mind however, on average, unemployment is lower in both Accessible Rural and Remote Rural Scotland, as shown in chart 9 below:
Chart 9: Unemployment and Employment Rates in Remote Rural, Accessible Rural and Urban Scotland compared, 2016
Source: Annual Population Survey in Scotland, Jan-Dec 2016; Using the Scottish Government Urban Rural Classification 2013-2014 The chart above shows four different ways of understanding employment and unemployment. The first set of columns shows people employed or looking for work. The second set shows those employed as a percentage of the total working age population. The third shows those in employment, education and training. The final set shows the unemployment rates. The trend is consistent for each set, showing that unemployment is higher in Urban Scotland than in either of the rural classifications, at around 6% for Urban Scotland and 4% for both remote and Accessible Rural Scotland. However looking across the piece

27
it is possible to discern that overall in employment terms Remote Rural Scotland is slightly better than Accessible Rural, and Accessible Rural is slightly better than urban Scotland. There may be issues around job quality or preferences but it is not possible to discern them in the data we have. This is shown in the economic activity rate, which is highest in Remote Rural Scotland, the overall employment rate, which again is highest in Remote Rural Scotland, and the employment, education or training class, which again is highest in Remote Rural Scotland. There are more recent figures if we use the RESAS defined Rural local authorities. This approach specifically identifies there are only two which have unemployment levels higher than the Scottish average of 4.8% (2016). These two areas are East Ayrshire and South Ayrshire, with East Ayrshire far above the national average. At the other end of the scale, both the Orkney Islands and Shetland Islands have very low rates and levels of unemployment, as does Aberdeenshire. It is not possible to say whether this represents a better performing labour market in Remote Rural areas, or whether there is simply the out-migration from those areas of those who would otherwise likely be unemployed. In practice, it could be an element of both, though it would take longitudinal research to establish the relative importance of each aspect. The table is below: Table 3: Unemployment rates and levels in Rural local authorities
Local authority Unemployment rate 2016
Unemployment level 2016
Aberdeenshire 3.8% 5,300 Angus 4.1% 2,500 Argyll and Bute 3.7% 1,600 Clackmannanshire 5.6% 1,300 Dumfries and Galloway
4.1% 3,000
East Ayrshire 6.5% 3,500 East Lothian 4.4% 2,200 Highland 3.7% 4,500 Moray 4.1% 2,000 Na h-Eileanan Siar 3.9% 500 Orkney Islands 2.6% 300 Perth and Kinross 3.4% 2,600 Scottish Borders 4.3% 2,400 Shetland Islands 2.8% 400 South Ayrshire 5.0% 2,600
Source: Local authority web tables from the Regional Employment Patterns in Scotland: Statistics from the Annual Population Survey publication using RESAS Classification 2018.

28
Employment by sector, excluding small businesses and self-
employment
Employment data shows a different picture to that from the economic data, reflecting the better definition found at postcode level. The Scottish Household Survey offers the opportunity to go down to a lower level than the economic survey data used above, and also to make use of the Scottish Government’s Urban – Rural classification, which is much more accurate to the rurality of the area, as it is based on postcode areas which are much smaller and less heterogeneous than local authorities. With this data we can look at the distinction between Accessible Rural Scotland (areas within a 30 minute drive-time of population centres; and Remote Rural Scotland, which are more inaccessible, see table 1). In this section we will look at employment data; and then a range of accessibility and household data to show the constraints on households living in Rural Scotland. However, it needs to be noted here that the data does not cover very small businesses without VAT or PAYE schemes (i.e. self-employed and those with low turnover and without employees) and some non-profit making organisations. Micro-businesses that are highly common in rural Scotland are partly not represented in the data. As can be seen in the chart below which identifies employment by location of the workplace there are strong distinctions between Remote Rural, Accessible Rural and urban Scotland.

29
Chart 10: Employment by industry sectors and in the public sector by geographic area, 20166, excluding self-employment and small businesses
Source: Inter-Departmental Business Register, as at March 2016 (Using Scottish Government Urban Rural Classification 2013-2014)
This figure shows the distribution of employment across sectors across the threefold SG Urban/Rural classification that is based on postcodes and thus more detailed. The top line of each set is the figure for Remote Rural Scotland, the middle line Accessible Rural Scotland and the third line is the rest of Scotland. In Remote Rural areas, ‘Agriculture, forestry and fishing’ is the largest source of private sector jobs (15%) followed by ‘Accommodation and food services’ (14%) and then ‘Other activities’ (13%). In Accessible Rural areas, ‘Other activities’ (16%), ‘Manufacturing’ (12%) ‘Agriculture, forestry and fishing’ (11%) and ‘Wholesale, retail and repair’ (11%) are the largest sources of private sector jobs. ‘Agriculture, forestry and fishing’ is a sector that shows the greatest difference across Scotland, accounting for 15% of workers in Remote Rural areas compared to 11% in Accessible Rural areas and 0.5% in the rest of Scotland. Conversely, other sectors such as ‘Wholesale, retail and repair’ and ‘Financial, insurance & real estate’ are a larger source of jobs in the rest of Scotland than in rural areas. Given the overall higher employment rates in Remote Rural Scotland, it may be that agriculture, forestry and fishing is helping to support the higher employment rate, but in low paying activities.
6 'Other activities' consists of: 'Professional, scientific and technical activities', 'Administrative
and support service activities' and 'Arts, entertainment and recreation; Other service activities'.
0.5%
3%
7%
5%
15%
6%
7%
5%
18%
10%
24%
11%
4%
12%
7%
11%
5%
8%
2%
16%
8%
15%
15%
3%
9%
8%
10%
5%
14%
2%
13%
6%
16%
0% 5% 10% 15% 20% 25%
Agriculture, forestry and fishing
Mining & quarrying; Utilities
Manufacturing
Construction
Wholesale, retail and repair
Transport, storage & communication
Accommodation and food services
Financial, insurance & real estate
Other activities
Education, health & social work
Public
Remote Rural Accessible Rural Rest of Scotland
1

30
One area that does stand out in the household level data is the relatively lower dependence of Accessible Rural and Remote Rural areas on public sector employment at only 15% and 16% of jobs in those areas as compared with 24% for the rest of Scotland. Given that the overall GVA contribution of the public sector is similar for both rural and urban Scotland this may reflect relatively higher non-employment related costs in rural area. The data discussed above is aggregated at data zone level and therefore allows us a very detailed distinction in terms of rurality. However, self-employment and very small businesses are not included in the dataset. The Annual Population Survey includes these businesses, but data is aggregated at the local authority level, which is why for the following section, the analysis follows the RESAS Classification.This also allows us to compare GVA and employment, as we need to take both into account if we want to understand what the rural economy looks like. When comparing GVA and employment, we need to be aware of the different definitions used in the datasets as different coding of industry sectors was applied. Thus, rural Scotland is defined as Mainly Rural and Islands and Remote following the RESAS Classification.
Employment by Sector, including small businesses and self-
employment
Figure 3 and table 4 help us to understand variations in employment rates between Mainly Rural, Islands and Remote and the Rest of Scotland. The top line of each set is the figure for Islands and Remote, the middle line Mainly Rural Scotland and the third line is the rest of Scotland. Because the data presented below is only available at the local authority level and codes sectors differently, we cannot fully compare it with the data discussed above and shown in chart 10. However, we can see that when self-employment and very small businesses are also included, the patterns change quite substantially. In every sector, we see some variation of employment numbers between rural areas (see table 4), but overall urban and rural economies look quite similar. ‘Public Administration, education and health’ (figure 3) – comparable to ‘Public’ and ‘Education, health and social work’ (chart 10) – remain the largest employer for all areas in Scotland, the importance of ‘Agriculture, Fishing and Forestry’ seems to decline when self-employment and non-VAT registered businesses are included. In Mainly Rural areas the sector only employs 4.4% of the workforce. It is relatively more important in the Islands and Remote areas (7.7%). This makes the sector the smallest one in terms of employment in Mainly Rural and fifth in Islands and Remote areas.

31
Figure 3: Rural and urban employment rates, arranged by relative size in Scottish economy – including self-employment and small businesses
Source: Regional Employment Patterns in Scotland: Statistics from the Annual Population Survey, 2017 (Using Scottish Government RESAS Classification 2018) We can see however that for the rural economy overall the sectors ‘Energy & Water’ and ‘Agriculture, Fishing & Forestry’ are more important in terms of employment numbers compared to the rest of Scotland. Even though the share of the workforce employed in Public Administration, education and health is smaller in Mainly Rural areas compared to the rest of Scotland, it still remains the largest employer overall. About 50% of the workforce is employed in ‘Public administration, health and education’ and ‘Distribution, hotels and restaurants’. As expected, ‘Banking and finance’ is relatively less important in rural areas. While ‘Manufacturing and Construction’ is noticeably more relevant to Mainly Rural areas and employs 9% of the workforce, it employs 6.5% of the workforce in the Islands and Remote parts of Scotland. ‘Construction’ employs between 7 to 8% of the workforce in urban and rural Scotland. ‘Transport and communication’ seems more significant for the Islands and Remote areas with 9% employed in this sector in contrast to only 6% in Mainly Rural areas. The sample size for the sectors ‘Energy and Water’ and ‘Other Services’ is too small for Islands and Remote areas, which is why it cannot be included.

32
Table 4 Rural and urban employment by Sector 2016, (aged 16+) by Industrial Group and Area
1. Figures may not round to 100% due to missing values 2. Level rounded to the nearest 100 3. Some values are suppressed using * where the data is limited by small sample sizes Source:ONS, Annual Population Survey (2016) (Using Scottish Government RESAS Classification 2018).
Area
Agriculture,
forestry and
fishing
Energy
and waterManufacturing Construction
Distribution,
hotels and
restaurants
Transport and
communication
Banking and
finance
Public
admin,
education
and health
Other
servicesTotal
Scotland 1.8% 3.4% 7.7% 7.1% 18.7% 7.7% 16.0% 30.9% 6.1% 2,581,000
Larger Cities * 2.9% 5.5% 5.9% 17.0% 9.6% 20.0% 31.6% * 718,100
Urban with
Substantial Rural 0.8% 2.2% 8.7% 7.4% 19.2% 7.8% 16.0% 31.9% 5.6% 1,061,400
Mainly Rural 4.4% 5.6% 8.7% 7.7% 19.9% 5.7% 12.7% 28.6% 6.0% 721,800
Islands and
Remote 7.7% * 6.5% 7.4% 16.3% 8.9% 11.0% 32.9% * 79,700

33
Patterns of Employment
Going beyond employment numbers, we can also see that the pattern of people’s daily employment in Remote Rural Scotland is not the same as in urban Scotland. Self-employment is more than twice as high – 22% of people are self-employed as compared with 10% for the rest of Scotland. People in Remote rural Scotland are also more likely to work a second job – 8% for Remote Rural vs. 3% for the rest of Scotland; and also more likely to work from home (24% for Remote Rural Scotland vs. 9% for the Rest of Scotland). All is shown in the table below:
Table 5: Patterns of work by geographic area, 2016, population aged 16+
Local authority Remote Rural Accessible Rural
Rest of Scotland
Percentage of employed males who are:
Self-employed 32% 22% 14% Working part time in main job 14% 12% 13%
With a second job 6% 4% 2%
Homeworkers1 32% 21% 11%
Percentage of employed females who are:
Self-employed 17% 15% 8% Working part time in main job 53% 44% 41%
With a second job 10% 5% 4%
Homeworkers1 21% 15% 8%
Percentage of all employed who are:
Self-employed 25% 18% 11% Working part time in main job 33% 28% 26%
With a second job 8% 4% 3%
Homeworkers1 27% 19% 10% Note: Includes all workers aged 16 and over 1 Homeworkers are people who work mainly in their own home, or in different places using home as a base, in their main job. Excludes people on government employment and training schemes Source: Annual Population Survey, Annual Population Survey, January to December 2016, (Using Scottish Government Urban Rural Classification 2013-2014)

34
The Structure of the Private Sector in Rural
Scotland
All data presented so far describes both the public and private sector in rural Scotland. This section aims to examine the structure of the private sector by looking at the number of enterprise units and the size of businesses, private sector employees and growth over time. Looking at the total number of Business Units across the rural local authorities (see chart 12 below), Aberdeenshire (12,415 units) and Highland (10,350 units) stand a long way ahead of the others, followed by Perth and Kinross (5,651 units) and Dumfries and Galloway (5,046 units). Aberdeenshire’s economy has had the fastest absolute expansion of business units over the period, growing by nearly 2000 units, (from 10,444 units in 2009 to 12,415 in 2014), where other areas have grown more modestly, and a few, notably Dumfries & Galloway, Scottish Borders and Argyll and Bute, have all had falling numbers of businesses. Unsurprisingly, those areas with the larger GVA are the same as those with the highest number of Business Units. It may be worth noting that South Ayrshire which has a falling number of businesses also has the highest unemployment rate in rural Scotland. In contrast, Aberdeenshire has one of the lowest unemployment rates, and also shows very significant absolute and relative growth.

35
Chart 11: Total Business Units in Rural local authorities in Scotland
Source: Inter-Departmental Business Register, as at March 2016 (Using RESAS Classification 2018) The largest number of private sector employees are in Aberdeenshire 88,000; Highland, 82,000; Perth and Kinross, 50,000; and Dumfries and Galloway 42,000. Aberdeenshire has experienced strong growth in employee numbers (an increase of 13,000), Perth and Kinross mild growth (fewer than 1,000), and Highland (less 2,000) and Dumfries and Galloway (less 1,000) have had falling employee numbers. For all of these areas however there is inter-year variance so the trends should not be seen as uni-directional over the period. The chart below shows private sector employee numbers for each of these areas.

36
Chart 12: Private Sector Employees in Rural local authorities in Scotland
Source: Inter-Departmental Business Register, as at March 2016 (Using RESAS Classification 2018) When we compare private sector employee numbers and business units, we can see a pattern evolving. With small employee numbers (fewer than 10,000) and around a 1,000 businesses are the Island authorities and Clackmannanshire. The next group includes a large share of local authorities and has around 30,000 private sector employees and between 3,000 and 4,000 businesses in their district. Thirdly is the pair of Perth and Kinross and Dumfries and Galloway; with around 5,000 businesses and 40- 50,000 employees. Finally are the two giants of Highland and Aberdeenshire with over 10,000 businesses and around 80-90,000 employees. They are significantly larger in GVA than any of the other rural authorities, and together the pair have output of £12.5 billion which means they represent around 36% of the total GVA of rural Scotland.

37
Private Sector Employment
The Businesses in Scotland Statistics provide an up-to-date picture of some parts of the private sector in Scotland. These show employee numbers, numbers of enterprises, and turnover by sector. Using these statistics we can see threefold urban-rural breakdowns, though they do exclude financial sector businesses, and by definition also the public sector, which provides around 21% of Scotland’s GVA.7 Analysing Business in Scotland data one key area that stands out is in employment growth in rural Scotland. Over the six years from 2010 it is possible to look at the relative performance in job growth by sector. The chart below shows different patterns of job growth in the private sector. Because data here is available at the data zone level, we can apply the SG Urban/ Rural classification and distinguish between Accessible Rural and Remote Rural Scotland. Accessible Rural Scotland has had two strong trends in employment. Firstly, a strong rise in professional, scientific and technical jobs. These are generally high skill and high productivity sectors, which is positive news. There has been a strong decline in financial services sector jobs over the same period which is unsurprising given the financial crisis. Only two other sectors have had declining jobs numbers: utilities, mining and quarrying; and construction, both clearly affected by world markets, and related issues. Two further sectors have seen no growth between 2010 and 2016. This is because there has either been no growth at all or growth and decline bring them to be the same size at the end as at the beginning in jobs terms, administration and support services; and agriculture, fisheries and forestry.
7 There are also further exclusions around certain types of non-VAT registered businesses,
and clearly GVA must not be conflated with turnover.

38
Chart 13: Strongest and weakest relative job growth in the Private Sector between 2010 and 2016 (2010=100)
Source: Inter-Departmental Business Register via Business in Scotland Statistics, as at March 2016 (RESAS Analysis 2018)

39
The picture for Remote Rural Scotland is somewhat different, though the number of jobs overall are of course smaller. Chart 13 shows that there is not the same spread in performance as there was in Accessible Rural Scotland. However, overall whilst only 3 sectors had shrunk in jobs terms in Accessible Rural Scotland, several sectors had fewer jobs in 2016 than 2010 in Remote Rural Scotland. The sectors with reducing employment numbers in Remote Rural Scotland were: ‘Agriculture, Fisheries and Forestry’; ‘Accommodation and Food Services’; ‘Financial Services’; ‘Real Estate’; (private sector) ‘Education, Human Health and Social work’; and ‘Arts and entertainment’. As in Accessible Rural Scotland the decline in employment in financial services had been the most severe. There was employment growth in ‘Professional, Scientific and technical activities’; ‘Construction’; and ‘Transportation’; and there may have been growth in ‘Mining and utilities’, but because there is little data available for this sector, it is hard to be sure.
Structure of the Private Sector in Rural Scotland
Enterprises in the private sector within Scotland have a similar structure across the urban/rural categories when broken down by employee size band. As shown in the table below the overwhelming number of enterprises in urban and rural Scotland have fewer than 50 employees, though larger businesses are slightly more common in Accessible Rural areas and in the rest of Scotland. Table 6: Percentages of Enterprise numbers by Urban/Rural Category and by employee size band, 2016
Employee Numbers
Remote Rural Enterprises %
Accessible Rural Enterprises %
Rest of Scotland Enterprises
0-49 97% 96% 95% 50-249 1% 2% 3% 250+ 1% 2% 2% Total 100% 100% 100%
Source: Inter-Departmental Business Register via Business in Scotland Statistics, as at March 2016 However, whilst the structure of the enterprises is largely similar, the structure of employment within those private sector enterprises is distinctly different. The overwhelming majority (68%) of employees in the private sector in Remote Rural areas work in small businesses with fewer than 50 employees. It is similar but less pronounced in Accessible Rural areas where 54% of employees work in small businesses. By contrast in the rest of Scotland only 34% of private sector employment is in small businesses whereas 54% of

40
employment is in businesses with 250 or more employees. This is shown in the chart below Chart 14: Percentages of Private Sector Employees within each Urban/Rural Category by employee size band, 2016
Source: Inter-Departmental Business Register via Business in Scotland Statistics, as at March 2016 (RESAS Analysis 2017)
Looking at the group of small businesses more thoroughly, the Scottish Government’s Topic Report (2016) found that 87% of Accessible Rural and 81% of Remote Rural SMEs were microbusinesses with 1-9 employees. 11% of SMEs in Accessible Rural areas were small businesses (10-49 employees) compared to 18% in Remote Rural Scotland.

41
UK Sectoral Productivity
While there is data at the local authority level available for the main industry sectors as described above, there are no local level figures available for sectoral productivity at a more detailed level. The figures below stem from the UK department BEIS and illustrate the sectoral variation in labour productivity at the UK level. Whilst there may be differences for Scotland there are not presently cross sector statistics at the Scotland level. Overall these BEIS analysis show that the highest productivity sectors are Oil and Gas, Real Estate, Pharmaceuticals and Utilities. The lowest are in administrative and support services; hotels and restaurants; health and social care; retail; and agriculture. Chart 15: UK Labour Productivity by sector (Gross Value Added per head, £000s), 2015
Source: BEIS analysis of Office for National Statistics data, 2015.8
8 The ONS statistics for agriculture are different to that in Agriculture in the UK but the overall
picture does not change greatly. Oil and Gas has been excluded because of its extremely high GVA per head.

42
Earnings and the Gender Pay Gap
Earnings also vary by people’s locality, and also by gender. People living in Accessible rural areas have the highest average incomes in Scotland, whereas people living in remote areas have the lowest average incomes. This is likely to be at least partly because of higher income commuters who work in larger urban areas, rather than through an inherently higher level of productivity found in Accessible Rural Scotland. The low incomes of people in Remote Rural Scotland can be compounded by additional costs including more expensive food, fuel and other goods, as shown in work on the Minimum Income Standard for Remote Rural Scotland,9 which suggests to support equivalent standards of
living that incomes need to be between a tenth and third higher in remote areas. Median hourly rates of pay are shown below: Chart 16: Residence based median hourly rates of pay10 by geographic area and gender, 2016
Source: Annual Survey of Hours and Earnings, 2016 (Using the Scottish Government Urban Rural Classification 2013-2014)
Chart 16 shows the median hourly wage rate for all male and female employees residing in each of the geographical areas. In all areas of Scotland the median
9 The Minimum Income Standard for Remote Rural Scotland report was produced for HIE in
2017 and is available here: http://www.hie.co.uk/regional-information/economic-reports-and-research/archive/a-minimum-income-standard-for-remote-rural-scotland.html 10
Employees on adult rates whose pay for the survey pay-period was not affected by absence.

43
wage for males is higher than that for females. The median wage of those who reside in Accessible Rural areas is highest for both males and females. The differences in median hourly rates of pay between the different areas are greater for males than females. The largest difference is between males who reside in Accessible Rural and Remote Rural areas (£1.81 higher per hour in Accessible Rural areas).
Table 7: Residence based median gross annual pay for full-time employees11 by geographic area
Source: Annual Survey of Hours and Earnings, 2016 (Using Scottish Government Urban Rural Classification 2013-2014) Table 7 shows that the median gross annual pay (i.e. before taxation and other deductions) for all full-time employees is highest for people living in Accessible Rural areas. This is followed by people living in the rest of Scotland and then finally those residing in Remote Rural areas. The disparity in median pay between rural areas and the rest of Scotland is greater for females than for males. Table 8: Gender Pay Gap by geographic area
Gross Gender Pay Gap by geographic area
Remote Rural
Accessible Rural
Rest of Scotland
Annual median wage difference
£5,076 £4,575 £4,966
Gender Pay Gap 17% 14% 17%
Source: Annual Survey of Hours and Earnings, 2016, (Using Scottish Government Urban Rural Classification 2013-2014) For median wages, overall the gender pay gap varies by geography, it is at 14% in Accessible Rural Scotland, and at 17% in both Remote Rural Scotland and the rest of Scotland. It is highest in absolute terms in Remote Rural Scotland, at £5,076, and lowest in Accessible Rural Scotland at £4,575, which also has the highest average incomes. Women working in Remote Rural Scotland have the lowest overall annual median income at £23,941. It is not clear what drives this as we do not know whether it is the type of jobs causing the pay gap or other factors. This may be worth further study. Here, a survey could examine the types and level of jobs women pursue. Additionally, research into gender attitudes and data on access to nurseries and informal care would be helpful to examine the gender pay gap.
11
Employees on adult rates who have been in the same job for more than a year
Remote
Rural
Accessible
Rural
Rest of
Scotland
Male £29,017 £32,098 £29,765
Female £23,941 £27,523 £24,799
All £27,074 £30,452 £27,715

44
Access and Convenience of Services As noted in the previous section, access is a main driver of rural disadvantage, both for individuals and businesses. We do not have current data around access for business to services, so as a proxy it can be useful to see the challenges reported by households in relation to service access, particularly as in Remote Rural areas a much higher proportion of people work from home, as shown in the section above on employment and work pattern. Chart 17: Percentage within 15 minute drive time of service by geographic area, 2016
Source: Scottish Index of Multiple Deprivation, 2016 (Using Scottish Government Urban Rural Classification 2013-2014) Chart 17 shows that only rural areas of Scotland are not within a 15 minute drive time to key services. For example 91% of people in Remote Rural areas and 99% of people in Accessible Rural areas live within a 15 minute drive time to a GP compared to 100% of the population in the rest of Scotland. It should be noted that that Scottish Index of Multiple Deprivation (SIMD) 2016 is calculated based upon the 2011 Data Zone boundaries. The greatest difference observed in drive time is to the nearest secondary school. In Remote Rural areas, 58% people live within a 15 minute drive time to a secondary school, compared to 92% of people in Accessible Rural areas and 100% of people in the rest of Scotland.
100%
100%
100%
100%
100%
100%
92%
90%
100%
100%
99%
99%
69%
58%
97%
99%
90%
91%
0% 10% 20% 30% 40% 50% 60% 70% 80% 90% 100%
Shopping Centre
Secondary School
Primary School
Post Office
Petrol Station
GP
Remote Rural Accessible Rural Rest of Scotland

45
Chart 18: Percentage within 15 minute drive time by public transport of service, by geographic area, 2016
Source: Scottish Index of Multiple Deprivation, 2016 (Using Scottish Government Urban Rural Classification 2013-2014) Chart 18 shows that the proportion of people within a 15 minute drive time to key services by public transport is much lower in both remote and Accessible Rural areas compared to the rest of Scotland. The figures are particularly low in rural areas with respect to drive time to the nearest shopping centre. Table 9: Households with home internet access by geographic area, 2015
Source: Scottish Household Survey, 2015 (Using Scottish Government Urban Rural Classification 2013-2014) From table 9 it can be seen that the households with the highest proportion of home internet access are in Accessible Rural areas (85%) followed by the rest of Scotland (80%). The lowest proportion of households with home internet access are in Remote Rural areas (79%).
81%
97%
93%
23%
73%
49%
28%
62%
41%
0% 20% 40% 60% 80% 100%
Shopping Centre
Post Office
GP
Remote Rural Accessible Rural Rest of Scotland
Remote
Rural
Accessible
Rural
Rest of
Scotland
Yes 79% 85% 80%
No 21% 15% 20%
Don't know - - 0%
All 100% 100% 100%

46
Table 10: Households with broadband (households with internet
connection only) by geographic area, 201312
Remote Rural
Accessible Rural
Rest of Scotland
DSL broadband (via your phone line) 90% 80% 59%
Broadband via cable, optical fibre, Ethernet, PLC etc. (e.g. Virgin)
3% 16% 31%
Broadband via satellite, public WiFi 5% 3% 7%
Mobile broadband via mobile phone network (at least 3G) via a mobile phone or smartphone
3% 11% 9%
Mobile broadband via mobile phone network (at least 3G) via a dongle or card
1% 0% 1%
Dial-up access over a normal telephone line or ISDN
- 0% 0%
Other 2% 2% 2%
Source: Scottish Household Survey, 2015 (Using Scottish Government Urban Rural Classification 2013-2014) Of those households with home internet access, almost all of them have a broadband connection. This is true for all areas of Scotland (see table 10). These figures show how households access internet services and do not reflect the availability of internet services across the whole of Scotland. In addition, the availability of superfast broadband is much lower in rural areas than in the rest of Scotland.13
12
Households were allowed to select multiple answers. As a result percentages can sum to more than 100%. 13
https://www.ofcom.org.uk/__data/assets/pdf_file/0035/95876/CN-Report-2016.pdf

47
Travel Patterns Chart 19 below shows that residents in rural Scotland are more likely than those in the rest of Scotland to spend over £100 per month on fuel for their cars. The proportion of residents of remote and Accessible Rural areas that report that they spend over £100 per month on fuel are 48% and 53% respectively, compared to 38% in the rest of Scotland. A higher level of expenditure on fuel for cars is likely to be, in part, due to longer driving distances to key services, as shown in Chart 18 and 17. Chart 19: Total expenditure on fuel for cars per month by geographic area,
2015
Source: Scottish Household Survey, 2015 (Using Scottish Government Urban Rural Classification 2013-2014)
Housing A household is defined as being in fuel poverty if it would be required to spend more than 10% of its income (including Housing Benefit or Income Support for Mortgage Interest)on fuel in order to maintain a satisfactory heating regime – in this case it does not refer to transportation, but only household consumption. ‘Extreme fuel poverty’ is defined as a household having to spend more than 20% of its income on household fuel.

48
Chart 20: Fuel poverty by geographic area, 2015
Source: Scottish House Condition Survey, 2015 (Using Scottish Government Urban Rural Classification 2013-2014)
Chart 20 shows that the proportion of households in Remote Rural Scotland which are classed as extreme fuel poor is more than double that of the proportion in the rest of Scotland (19% compared to 8%). Just over a half of households in Remote Rural Scotland are classed as ‘fuel poor’, while 27% of households in Accessible Rural Scotland are in fuel poverty. While in the rest of Scotland 30% of households are classed as ‘fuel poor’.
Overview The rural economy in Scotland has grown both in terms of employment numbers and GVA. Here, it is worth distinguishing between degrees of rurality. While for example ‘Agriculture, Fishing and Forestry’ is a relatively larger employer in Remote areas and the Islands – despite only accounting for 4% of the GVA – it is the smallest employer in Mainly Rural areas. However, there are likely to be land management benefits which support tourism and other sectors indirectly, which are not easy to establish here. Going beyond the comparison within rural Scotland, the Rural economy (or economies) shows a number of key similarities and differences with the Scottish economy as a whole. In general, people living in rural Scotland are slightly less likely to work in the public sector than urban Scots. For those working in the private sector they are more likely to work for small businesses, especially in the most remote areas. By GVA output sector by sector urban and rural Scotland have similar patterns, with the bulk of GVA being contributed by Wholesale, Retail and Transport; the Public Sector; Manufacturing; Business Services; and Real Estate. For two sectors, Finance; and Information and Communications there are significant Scotland level GVA contributions, but they are concentrated in urban areas.

49
On growth, there has not been a consistent difference between urban and rural Scotland. However, it is clear that financial services have been a poorly performing sector both in jobs and GVA terms across all urban/rural geographies. Accessible rural and Remote Rural Scotland have had different patterns of job growth overall. Growth has been more varied in Mainly Rural Scotland, with financial services declining rapidly, but professional, scientific and technical services rising rapidly. By contrast after considering data issues Remote Rural has been less variable with employment in particular very similar in 2016 to 2010. Unemployment and inactivity tend to be lower in rural Scotland, but much of this may be the effect of an outflow of working age people to urban Scotland in search of improved job opportunities. The demographic challenges have been covered in other work and are well known, but clearly Scotland’s ageing population issues are most acute in some of the most remote areas. Continuing access to new labour and migration can help to mitigate this. Wages and Earnings do show some differences between rural and urban Scotland, with the highest wages being in Accessible Rural Scotland, and lower wages in the remote and urban areas. The gender pay gap (when measured crudely by median incomes) also shows that Remote Rural women have the lowest median wage and the biggest gender pay gap in Scotland. This paper does not recommend policy prescriptions, but merely seeks sets out the current position of the rural economy.

50
Annex 1: Statistical Annex
Table 1.1: 2015 GVA by Sector for Rural local authorities £ Million
Source: ONS local authority level GVA Statistics April 2017 (Using Scottish Government RESAS Classification 2018)
Local Authority
Distribution,
Wholesale &
Retail
Public Admin Manufacturing Real EstateBusiness
ServicesConstruction
Mining,
Quarrying,
Utilities
Other
Agriculture
Fish &
Forestry
FinanceInfo and
CommsTOTAL
Aberdeenshire 1,498 873 1,270 912 1,058 589 458 207 228 58 101 7,252
Angus 328 426 385 267 132 143 31 52 164 28 13 1,969
Argyll and Bute 352 479 145 223 145 108 151 60 37 11 25 1,736
Clackmannanshire 143 220 162 73 42 50 27 57 12 6 18 810
Dumfries and
Galloway685 642 414 331 161 159 102 118 77 48 66 2,803
East Ayrshire 328 526 204 162 142 137 131 87 117 38 25 1,897
East Lothian 267 343 107 239 152 126 108 83 40 39 24 1,528
Highland 1,159 1,252 625 599 391 463 282 193 136 48 126 5,274
Moray 376 444 537 199 94 131 38 81 43 15 12 1,970
Na h-Eileanan Siar 92 154 32 53 23 38 7 14 15 5 27 460
Orkney Islands 113 111 25 45 28 50 16 11 34 5 7 445
Perth and Kinross 697 644 222 415 287 270 549 103 58 114 41 3,400
Scottish Borders 373 477 234 285 152 152 51 78 97 31 31 1,961
Shetland Islands 142 128 57 45 41 88 51 33 34 4 8 631
South Ayrshire 669 586 440 263 134 116 30 107 26 59 34 2,464

51
Table 1.2: GVA in Mainly Rural Scotland, 1997 to 2015 (Scottish Borders, Dumfries & Galloway, Highland, Perth &
Kinross, Angus, Moray, South Ayrshire, East Lothian, Clackmannanshire, Aberdeenshire, East Ayrshire) Rural Growth over time GVA £million
1997 1998 1999 2000 2001 2002 2003 2004 2005 2006 2007 2008 2009 2010 2011 2012 2013 2014 2015
Agriculture,
Forestry, Fishing 788 809 793 904 944 869 991 1,104 803 1,024 1,184 919 798 1,112 959 902 1,023 1,016 998
Mining, Utilities 1,202 1,170 907 1,025 973 1,105 1,063 1,132 1,181 1,299 1,351 1,385 1,750 1,410 1,466 1,763 1,808 1,881 1,807
Manufacturing 2,939 2,939 2,831 2,790 2,779 2,712 2,536 2,796 3,034 3,050 3,131 3,362 3,490 3,513 3,805 3,804 4,217 4,442 4,600
Construction 1,051 1,150 1,207 1,322 1,273 1,504 1,566 1,659 1,818 2,010 2,266 2,111 1,788 1,898 2,000 1,957 2,269 2,285 2,336
Distribution,
Wholesale and
Retail
3,140 3,234 3,315 3,272 3,716 3,737 3,917 4,197 4,388 4,582 4,845 5,182 5,144 5,104 5,177 5,172 5,776 6,448 6,523
Information and
communications 289 318 347 422 475 494 554 567 490 508 496 442 463 425 389 415 426 459 491
Financial
Services 374 389 362 335 366 353 407 540 589 611 704 676 735 609 555 591 540 489 484
Real Estate 2,284 2,302 2,282 2,166 2,068 2,035 1,979 2,103 2,343 2,718 3,014 3,329 2,893 2,876 3,132 3,304 3,279 3,412 3,745
Business
Services 975 1,051 1,101 1,169 1,219 1,274 1,398 1,487 1,594 1,823 1,874 1,950 1,899 1,971 2,333 2,382 2,546 2,676 2,745
Public Admin 2,878 3,029 3,288 3,522 3,813 4,053 4,257 4,660 5,078 5,397 5,508 5,580 5,755 5,825 6,042 5,741 5,888 6,229 6,433
Other 468 509 548 589 661 767 866 875 900 1,001 962 976 982 1,006 1,060 1,112 1,214 1,149 1,166
Total 16,388 16,900 16,981 17,516 18,287 18,903 19,534 21,120 22,218 24,023 25,335 25,912 25,697 25,749 26,918 27,143 28,986 30,486 31,328
Source: ONS local authority level GVA Statistics April 2017 (Using Scottish Government RESAS Classification 2018)
52
Table 1.3: GVA in Islands and Remote Rural Scotland, 1997 to 2015 (Orkney Islands, Shetland Islands, Na h-Eileanan
Siar, Argyll & Bute) Remote rural
Growth over time
GVA £million
1997 1998 1999 2000 2001 2002 2003 2004 2005 2006 2007 2008 2009 2010 2011 2012 2013 2014 2015
Agriculture,
Forestry, Fishing 120 134 140 138 144 140 143 160 132 137 134 123 114 132 111 119 114 122 120
Mining, Utilities 125 119 119 135 129 197 177 181 172 142 135 178 184 145 152 164 211 234 225
Manufacturing 171 172 120 109 119 107 125 136 143 139 139 172 179 185 222 224 252 249 259
Construction 123 145 173 186 139 158 187 212 241 254 253 238 216 232 236 227 268 291 284
Distribution,
Wholesale and
Retail 376 406 472 461 471 431 450 508 537 515 560 595 578 561 548 573 593 648 699
Information and
communications 31 35 40 41 42 39 57 62 63 64 54 56 50 47 49 53 57 65 67
Financial Services 35 36 37 35 34 29 27 39 44 43 55 50 56 42 36 33 30 22 25
Real Estate 251 248 246 235 228 220 213 224 257 275 305 332 302 292 322 355 339 350 366
Business
Services 111 117 129 136 141 159 168 170 172 202 204 213 218 211 234 243 231 250 237
Public Admin 451 502 520 518 518 564 629 680 762 792 769 813 892 931 916 853 838 835 872
Other 72 81 77 73 80 91 103 106 122 143 131 121 111 117 127 118 117 117 118
Total 1,866 1,995 2,073 2,067 2,045 2,135 2,279 2,478 2,645 2,706 2,739 2,891 2,900 2,895 2,953 2,962 3,050 3,183 3,272
Source: ONS local authority level GVA Statistics April 2017 (Using Scottish Government RESAS Classification 2018)

53
Table 1.4 Gross Value Added (Income Approach) by rural local authorities, 1997 to 2015, Local Authority 1997 1998 1999 2000 2001 2002 2003 2004 2005 2006 2007 2008 2009 2010 2011 2012 2013 2014 2015
Aberdeenshire 3,087 3,094 2,915 3,092 3,299 3,396 3,411 3,597 3,792 4,309 4,800 5,099 4,990 5,102 5,583 5,778 6,362 7,022 7,253
Angus 1,270 1,283 1,295 1,294 1,310 1,352 1,457 1,520 1,548 1,729 1,861 1,797 1,707 1,804 1,816 1,752 1,909 1,945 1,969
Argyll and Bute 976 1,048 1,094 1,149 1,127 1,130 1,219 1,273 1,373 1,472 1,468 1,610 1,589 1,574 1,579 1,562 1,609 1,694 1,736
Clackmannanshire 457 469 471 574 576 598 612 622 570 634 675 679 682 648 667 650 728 785 811
Dumfries and Galloway
1,549 1,575 1,679 1,615 1,819 1,804 1,776 1,959 2,037 2,199 2,290 2,296 2,344 2,376 2,419 2,370 2,527 2,728 2,802
East Ayrshire 1,202 1,244 1,219 1,289 1,355 1,345 1,396 1,488 1,614 1,696 1,684 1,662 1,669 1,722 1,721 1,687 1,671 1,818 1,897
East Lothian 926 943 936 958 968 1,043 1,102 1,187 1,213 1,388 1,387 1,396 1,295 1,297 1,340 1,367 1,438 1,463 1,528
Highland 2,484 2,681 2,774 2,901 3,021 3,153 3,418 3,780 4,072 4,148 4,324 4,464 4,347 4,295 4,518 4,560 4,804 5,105 5,273
Moray 988 1,063 1,076 1,105 1,169 1,263 1,344 1,438 1,634 1,640 1,746 1,834 1,893 1,843 1,966 1,960 2,040 1,929 1,970
Na h-Eileanan Siar 294 312 349 301 297 318 365 422 443 450 445 435 440 405 429 438 436 450 460
Orkney Islands 234 251 247 245 235 250 274 310 338 329 341 353 368 381 394 406 410 434 446
Perth and Kinross 1,942 1,999 1,915 1,950 1,952 2,075 2,110 2,328 2,414 2,652 2,813 2,784 2,980 2,811 2,973 3,135 3,340 3,333 3,400
Scottish Borders 1,084 1,100 1,202 1,186 1,247 1,271 1,302 1,444 1,467 1,614 1,705 1,743 1,668 1,709 1,758 1,733 1,888 1,930 1,961
Shetland Islands 366 383 383 371 381 440 423 470 492 455 481 495 504 535 554 559 594 606 630
South Ayrshire 1,405 1,447 1,500 1,551 1,571 1,605 1,610 1,761 1,860 2,010 2,053 2,158 2,125 2,143 2,161 2,148 2,282 2,433 2,464
Source: ONS local authority level GVA Statistics April 2017 (Using Scottish Government RESAS Classification 2018)

54
Chart 1.1: Rural and urban GVA illustrated, arranged by relative size of the economy in Mainly Rural areas
Source: ONS local authority level GVA Statistics, as at August 2017 (Using Scottish Government RESAS Classification 2018)

55
Table 1.5: Total Business Units in compared with Private Sector Employees in Rural local authorities in Scotland
Local authority Business Units Private Sector employees 2008 2015 2008 2015
Aberdeenshire 10,444 12,568 74,900 86,600 Angus 3,344 3,656 27,200 26,300 Argyll and Bute 3,782 3,673 25,200 27,000 Clackmannanshire 1,168 1,219 11,000 10,800 Dumfries and Galloway 5,259 5,040 43,100 43,200 East Ayrshire 2,755 2,903 53,700 51,700 East Lothian 2,581 2,910 27,300 26,500 Highland 9,907 10,523 20,200 21,100 Moray 2,895 3,078 83,800 82,000 Na h-Eileanan Siar 1,131 1,138 26,400 26,800 Orkney Islands 901 956 7,000 6,800 Perth and Kinross 5,509 5,731 5,900 6,600 Scottish Borders 4,397 4,299 49,100 49,600 Shetland Islands 1,097 1,243 31,700 29,700 South Ayrshire 3,484 3,499 7,900 10,400
Source: Inter-Departmental Business Register, as at March 2017 (Using RESAS Classification 2018)

56
Table 1.6: Unemployment rates and levels by local authority
Local authority 2015 Unemployment rate 2015 Unemployment level Aberdeen City 4.7% 6,200 Aberdeenshire 2.7% 3,900 Angus 4.7% 2,700 Argyll and Bute 4.5% 1,900 City of Edinburgh 5.4% 14,100 Clackmannanshire 5.7% 1,500 Dumfries and Galloway 4.4% 3,400 Dundee City 8.9% 6,200 East Ayrshire 7.7% 4,600 East Dunbartonshire 4.5% 2,400 East Lothian 5.0% 2,500 East Renfrewshire 4.4% 2,000 Falkirk 5.8% 4,700 Fife 6.6% 12,300 Glasgow City 8.7% 26,400 Highland 3.2% 4,100 Inverclyde 7.8% 2,900 Midlothian 4.8% 2,100 Moray 4.2% 1,900 Na h-Eileanan Siar 4.4% 600 North Ayrshire 9.3% 5,700 North Lanarkshire 6.9% 11,800 Orkney Islands 2.4% 300 Perth and Kinross 3.8% 2,900 Renfrewshire 6.1% 5,600 Scottish Borders 4.0% 2,300 Shetland Islands 2.2% 300 South Ayrshire 6.1% 3,400 South Lanarkshire 5.5% 9,300 Stirling 5.3% 2,300 West Dunbartonshire 7.6% 3,300 West Lothian 5.8% 5,300
Source: Annual Population Survey in Scotland, Jan-Dec 2015

57
Table 1.7: GVA share of ‘Accommodation and Food Services’ and ‘Sustainable Tourism’ of Mainly Rural and Islands and
Remote local authorities, 2015
Local authority Gross Value Added at Basic
Prices in Accommodation
and Food Services
Overall gross Value
Added at Basic Prices
Share of ‘Accommodation
and Food Services’ of LA
GVA
GVA in ‘Sustainable
Tourism’
Share of ‘Sustainable
Tourism’
Aberdeenshire 169.7 6474.9 2.6% 176.2 2.7%
Angus 44.2 1127.2 3.9% 43.9 3.9%
Argyll and Bute 77.6 1049.4 7.4% 88.3 8.4%
Clackmannanshire 12.7 576.7 2.2% 13.2 2.3% Dumfries and Galloway
114.9 1613.8 7.1% 119.9 7.4%
East Ayrshire 33.1 958.3 3.5% 32.0 3.3%
East Lothian 65.3 870.6 7.5% 67.6 7.8%
Highland 181.6 2978.8 6.1% 197.1 6.6%
Moray 32.6 1104 3.0% 34.1 3.1%
Na h-Eileanan Siar 25.5 234.2 10.9% 39.9 17.0%
Orkney Islands 7.0 233 3.0% 9.8 4.2%
Perth and Kinross 167.7 2453.2 6.8% 172.5 7.0%
Scottish Borders 49.9 1067.5 4.7% 54.6 5.1%
Shetland Islands 50.2 524 9.6% 12.9 2.5%
South Ayrshire 79.8 1509.7 5.3% 90.0 6.0%
Source: Scottish Annual Business Statistics 2017 (Using RESAS Classification 2018)

58
Table 1.8: GVA of ‘Accommodation and Food Services’ of Mainly Rural and Islands and Remote local authorities, 2008 to
2015 (in £m)
Local authority
2009 2010 2011 2012 2013 2014 2015
Aberdeenshire 63.4 159.5 117.4 183.9 189.7 152.6 169.7
Angus 50.2 41.9 35.8 42.6 32.1 34.4 44.2
Argyll and Bute 66.8 69.1 74.2 83.3 94.5 120.0 77.6
Clackmannanshire 7.3 12.4 8.6 13.1 17.0 17.0 12.7
Dumfries and Galloway 45.7 77.3 63.5 65.7 86.8 130.7 114.9
East Ayrshire 16.4 25.0 27.7 27.1 34.5 39.6 33.1
East Lothian 21.3 32.6 33.2 43.5 33.3 51.2 65.3
Highland 140.1 157.7 184.6 201.9 210.6 269.7 181.6
Moray 30.0 64.2 44.4 47.3 37.1 56.3 32.6
Na h-Eileanan Siar 9.2 9.1 12.9 16.2 18.3 39.6 25.5
Orkney Islands 7.9 * 12.5 19.6 26.9 11.8 7.0
Perth and Kinross 137.3 128.3 124.6 159.8 162.6 155.5 167.7
Scottish Borders 84.1 69.4 51.2 45.3 41.8 43.2 49.9
Shetland Islands 8.6 10.7 14.2 9.0 28.1 24.2 50.2
South Ayrshire 50.8 60.1 82.5 80.4 94.5 98.4 79.8
Source: Scottish Annual Business Statistics as at August 2017 (Using RESAS Classification 2018)

59
Table 1.9: GVA of ‘Sustainable Tourism’ of Mainly Rural and Islands and Remote local authorities, 2008 to 2015 (in £m)
Local authority
2009 2010 2011 2012 2013 2014 2015
Aberdeenshire 68.8 150.7 139.7 190.6 196.8 166.4 176.2 Angus 52.6 41.9 37.9 44.0 37.5 37.1 43.9 Argyll and Bute 76.7 76.8 81.0 90.7 105.8 127.8 88.3 Clackmannanshire 9.4 12.6 9.0 13.4 19.1 18.1 13.2 Dumfries and Galloway
51.2 79.6 67.3 68.2 91.0 133.7 119.9
East Ayrshire 22.3 28.0 30.7 29.9 39.4 45.3 32.0 East Lothian 27.0 34.3 33.5 45.4 40.0 58.8 67.6 Highland 151.4 163.0 200.2 216.4 225.6 285.2 197.1 Moray 32.9 60.9 54.0 45.1 38.1 56.9 34.1 Na h-Eileanan Siar 19.4 10.3 9.9 14.7 18.4 19.4 39.9 Orkney Islands 10.2 10.8 14.3 20.7 26.8 14.3 9.8 Perth and Kinross 140.1 133.2 130.5 162.2 169.9 162.5 172.5 Scottish Borders 80.7 64.8 56.0 50.8 47.4 46.5 54.6 Shetland Islands 6.9 12.9 17.7 11.2 30.4 21.5 12.9 South Ayrshire 56.8 61.2 83.0 83.3 98.6 109.4 90.0
Source: Scottish Annual Business Statistics, as at August 2017 (Using RESAS Classification 2018)

60
Annex 2: Urban and Rural Definitions There are a range of different ways that Scottish Government classifies Urban
and Rural differences. Primarily, they are based upon the threefold, sixfold or
eightfold classification; though for economic data the Randall definition is also
used. Threefold Urban Rural definition Classification Definition
1 Rest of Scotland
Settlements of 3,000 or more people
2 Accessible Rural Settlements of less than 3,000 people and within 30 minutes drive of a settlement of 10,000 or more.
3 Remote Rural
Settlements of less than 3,000 people and with a drive time of over 30 minutes to a settlement of 10,000 or more.
Sixfold Urban Rural definition Classification Definition
1 Large Urban Areas
Settlements of 125,000 or more people.
2 Other Urban Areas
Settlements of 10,000 to 124,999 people.
3 Accessible Small Towns
Settlements of 3,000 to 9,999 people and within 30 minutes drive of a settlement of 10,000 or more. 4 Remote Small
Towns Settlements of 3,000 to 9,999 people and with a drive time of over 30 minutes to a settlement of 10,000 or more.
5 Accessible Rural
Areas with a population of less than 3,000 people, and within a 30 minute drive time of a settlement of 10,000 or more.
6 Remote Rural Areas with a population of less than 3,000 people, and with a drive time of over 30 minutes to a settlement of 10,000 or more.
Eightfold Urban Rural Definition
Classification Definition
1 Large Urban Areas
Settlements of 125,000 or more people.
2 Other Urban Areas
Settlements of 10,000 to 124,999 people.
3 Accessible small Towns
Settlements of 3,000 and 9,999 people and within 30 minutes drive of a settlement of 10,000 or more. 4 Remote Small
Towns
Settlements of between 3,000 and 9,999 people and with a drive time of over 30 minutes to a settlement of 10,000 or more.
5 Very Remote Small Towns
Settlements of 3,000 and 9,999 people and with a drive time of over 60 minutes to a settlement of 10,000 or more.
6 Accessible Rural
Areas with a population of less than 3,000 people, and within a 30 minute drive time of a settlement of 10,000 or more.
7 Remote Rural Areas with a population of less than 3,000 people, and with a drive time of over 30 minutes but less than 60 minutes to a settlement of 10,000 or more. 8 Very Remote
Rural Areas with a population of less than 3,000 people, and with a drive time of over 60 minutes to a settlement of 10,000 or more.

61
Randall Definition rebased-2017
Originally produced in 1985 for the Scottish Economic bulletin (SEB) as a
means of profiling economic trends and indicating need for support in rural
Scotland. The system is based upon population density within a unitary
authority. Where a unitary authority has a population density of less than one
person per hectare it is considered Rural. On this basis there are 14 rural
unitary authorities. These are:
Aberdeenshire
Angus
Argyll and Bute
Dumfries and Galloway
East Ayrshire
Highland
Moray
Na h-Eileanan Siar
Orkney Islands
Perth and Kinross
Scottish Borders
Shetland Islands
South Ayrshire
Stirling
According to the Randall definition of rurality, 89% of Scotland's landmass and
29% of its population is classified as rural (defined in 1995, and rebased in
2017). Benefits: Unitary Authority data is readily available and it is therefore very easy to use
this system for classification. Limitations: Since the classification system is Unitary Authority based, some urban pockets
including Stirling and Inverness, are classified as rural.

62
Fourfold RESAS Classification
The fourfold RESAS Classification distinguishes local authorities according to their level of rurality. In order to define rurality from a conceptual and methodological point of view, a literature review on existing urban: rural classification at an aggregate data level was conducted.
If data is available at a data zone level, the Scottish Government most commonly applies its Scottish Executive Rural Urban Classification that is based both on population levels and distance from urban areas with more than 10,000 inhabitants.
However, because data is not always available at the data zone level, the Scottish Government uses the Randall definition that is based solely on population density aggregated at the local authority level. Thus, it tends to over-state the rural population (e.g. the populations of Stirling Perth and Inverness are considered ‘rural) and understate the rural area (e.g. East Lothian and South Lanarkshire are considered ‘urban’).
The OECD classifies regions as predominantly urban, intermediate or predominantly rural based on the percentage of population living in local rural units and divides Scotland into 23 regions of which nine are considered to be predominantly rural accounting for 75% of the landmass and 17% of the population (OECD, 2008).
Scholars such as Cloke (1977) however suggest that a definition of rurality cannot only be based on population density and distance to urban settlements, but should include factors such as demographics, occupational structure, household amenities and migration. Based on the literature and classifications defined thus far, but also on suggestions of various stakeholders, an extensive range of demographic, economic, social and geographic indicators was collected. Data included:
Persons; Km2; Persons/ Km2; % Population not in localities - classed as Rural;
Share of 15-45 year olds; Share of 15-64 year olds; Percentage population change mid-2006 to mid-2016; % pensionable age;
Local government employment by local authority(FTE); Net Revenue Expenditure per capita (£); Workforce from the LA;
Road Length; % of premises unable to receive 10Mbit/s
Local Share of Access to Services for most/least deprived areas

63
To identify which variables correlate and thus help to explain groupings of local authorities, a principal component analysis was conducted. The analysis generated the following four different components:
1. Population; population per km2; Share of 15-64 year olds; Local government employment by local authority(FTE); share of population in pensionable age; Share of population that not assigned to either a settlement or locality; share of premises unable to receive 10Mbit/s; population in settlements under 10,000; and access to Services 40% most deprived areas in LA.
2. Road length, km2; workforce stemming from the local authority
3. Share of population in pensionable age; hare of population that not assigned to either a settlement or locality; share of premises unable to receive 10Mbit/s; population in settlements under 10,000; and access to Services 40% most deprived areas; workforce stemming from the local authority; Net Revenue Expenditure per capita (£)
4. Share of 16-64 year olds; share of population in pensionable age; Percentage population change mid-2006 to mid-2016. Following the PCA, a cluster analysis was conducted using the components in order to identify which component would allow the most suitable grouping. Component 2 and 3 did not allow for much variation and suggested creating several groups, but one main and dominant group with almost all local authorities assigned to it. Component 4 allowed for a lot of different and fairly evenly distributed groups. However, as the indicators are only based on demographics and exclude all other features that are crucial for rural Scotland, this component was also put aside. Component 1 however suggested a fairly even distribution of groups and takes a wide range of indicators into account. Component 1 of the PCA suggests including both the share of the population in pensionable age and the share of the population in working age. These variables express two different features: A higher share of pensioners and thus an ageing population aims to capture the potential burden on services and the relative number of dependents. The share of the population in working age on the other hand captures not only the size of the workforce, but also indicates out-migration. Both variables are correlated, but not interchangeable. According to the PCA, a large working age population and a relatively small share of pensioners are features of more urban areas. Population in settlements under 10,000 and the share of the population not assigned to either a settlement or locality are also correlated and a high share of each is a feature of more rural areas. While the first variable directly expresses the share of the population in rural settlements and thus expresses rurality, the second variable describes remoteness as it describes the population living in areas so small, that they are not picked up by the data.

64
According to the PCA, a large population and high population density is an indicator for more urban areas. This is also highly correlated with access to services, employment opportunities, remoteness and other rural features. Broadband connectivity is a key variable to include when describing rural economies as the lack of high-speed broadband does not only affect homes, but also enterprises and their business. Access to high speed broadband is described as a key enabler. However, while in urban areas nearly all households can access at least 10 Mbit/s, this is not the case for more rural areas. Lastly, following the PCA local government employment is taken into account as well. High absolute numbers of FTE government employees indicate greater human resources and thus more capacity for policy-making and the development of new strategies. This variable needs to be taken into account if we want to compare the size of rural economies. Thus, component 1 was pursued further.
In a last step, the results from the PCA were used in order to create an index for the rural economy. All data was standardized and various weights were applied. However, because weighting did not change the results crucially, the decision was made not to apply any weights. Following the results for component 1, the additive index was calculated as follows:
Rurality= (Share of population in pensionable age) + (Share of population that not
assigned to either a settlement or locality) + (Share of premises unable to receive 10Mbit/s) + (Population in settlements under 10,000) + Access to
Services 40% most deprived areas in LA) - (Population) - (Population per km2) – (Share of 16-64 year olds) - (Local government employment)
Scores for the index range from -20.1 in Glasgow and thus least rural to 15.5 making N-ah Eileanan Siar most rural. In order to now group local authorities, an additional lens was applied in order to incorporate the existing and more detailed 8-fold Scottish Government classification. Firstly, the local authorities with the lowest scores are Glasgow, Edinburgh, Aberdeen and Dundee. These four LAs do not only have a distinctively higher score than the next highest LAs, but are also the only Scottish cities with more than 90% of the population living in large urban areas. Thus, these four LAs are classed as ‘Larger Cities’. The second group is classed as ‘Urban with Substantial Rural areas’ and includes all LAs with a population of more than 50% living in urban and other urban areas. Thus, while Stirling is considered ‘Urban with Substantial Rural areas’, East Ayrshire is not. The next cut-off point aims to distinguish between Mainly Rural and ‘Islands & remote’. Here, the Islands and Argyll & Bute stand out both due to their high RESAS Classification score and due their share of

65
population living in urban areas of less than 20%, and even 0% on the islands. Thus, while Scottish Borders is considered Mainly Rural, Argyll & Bute is classed as ‘Islands & remote’. South Ayrshire and Angus are exceptions to this rule as they both have more than 50% of their population living in large urban and other urban areas and thus should be classed Urban with Substantial Rural. However, because according to their RESAS score they clearly are more rural than Stirling and other more urban areas, they are classed as Mainly Rural. Accordingly, local authorities are classed as follows:
Local authority RESAS Classification Label
Na h-Eileanan Siar 15.5
Islands & Remote Orkney Islands 12.7
Shetland Islands 10.8
Argyll & Bute 9.1
Scottish Borders 6.9
Mainly Rural
Dumfries & Galloway 6.6
Highland 4.9
Perth & Kinross 4.5
Angus 3.2
Moray 3.1
South Ayrshire 2.4
East Lothian 1.8
Clackmannanshire 1.4
Aberdeenshire 1.3
East Ayrshire 1
Stirling 0.7
Urban with Substantial
Rural areas
East Dunbartonshire 0.4
North Ayrshire 0.2
Midlothian -0.6
West Dunbartonshire -1
Inverclyde -1.3
East Renfrewshire -1.6
Falkirk -2.1
Renfrewshire -3.5
West Lothian -3.9
South Lanarkshire -4.8
Fife -4.9
North Lanarkshire -6.8
Dundee City -10
Larger Cities Aberdeen City -10.1
City of Edinburgh -15.6
Glasgow City -20.1

66
Annex 3: Sources
Information relating to the ‘Annual Survey of Hours and Earnings’ (ASHE) is available from http://www.ons.gov.uk/ons/rel/ashe/annual-survey-of-hours-and-earnings/index.html. ASHE is a UK wide survey that was developed to replace the New Earnings Survey in 2004. Data are National Statistics.
The Inter-Departmental Business Register is maintained by the Office for National Statistics (ONS) and is a database of all registered enterprises operating in the UK, i.e. enterprises that are registered for VAT and/or PAYE. It covers 99% of economic activity in the UK. Those excluded are small sole traders or partnerships with no employees and an annual turnover of less than the VAT threshold (£82,000 as at 1st March 2016). Further tables from the Inter-Departmental Business Register can be found here:http://www.gov.scot/Topics/Statistics/Browse/Business/Corporate. Data are National Statistics.
There are occasional variations in base sizes for individual tables/figures sourced from the ‘Scottish Household Survey’. Further detail on the base numbers is available in ‘Scotland’s People: Results from 2015 Scottish Household Survey’,
published on 27th September 2016. The sample sizes are smallest for Remote Rural areas so there are larger confidence intervals associated with the statistics for this area than for the rest of Scotland figures. Further information on the Scottish Household Survey is available at: http://www.gov.scot/Topics/Statistics/16002. Data are National Statistics.
Details on the ‘Scottish House Condition Survey’ are available at the survey’s website here: http://www.gov.scot/Topics/Statistics/SHCS. Data are National Statistics.
The ‘Scottish Index of Multiple Deprivation’ (SIMD) provides a wealth of information to help improve the understanding about the outcomes and circumstances of people living in the most deprived areas in Scotland. Information on drive times to services and the number of people income and employment deprived from the SIMD is presented in this publication. Information on income deprived and employment deprived people is based on people in receipt of certain disability and unemployment benefits. More information can be found here: http://www.gov.scot/Topics/Statistics/SIMD. Data are National Statistics.
Scottish Household Survey, Scottish House Condition Survey and Annual Survey of Hours and Earnings figures are all based on surveys which sample a proportion of residents of Scotland. Figures quoted are best estimates of the true value, based on the survey results which have been weighted to represent the population. However,

67
small differences in estimates, between geographic areas and years, are not necessarily always statistically significant.
OECD, 2008. OECD Rural Policy Reviews. Scotland, UK. OECD Publications: Paris.
Cloke, P.J., 1977. An index of rurality for England and Wales. Regional Studies, 11(1), pp.31-46.

68
Annex 4: UK Standard Industrial
Classification of Economic Activities
ONS GVA sectors UK SIC 2007 Section UK SIC 2007 Division
Agriculture, Forestry and Fishing
A Agriculture, Forestry and Fishing
Crop and animal production, hunting and related service activities; Forestry and logging; Fishing and aquaculture
Mining, Quarrying, Utilities
B Mining and Quarrying
Mining of coal and lignite; Extraction of crude petroleum and natural gas; Mining of metal ores; Other mining and quarrying; Mining support service activities
D Electricity, Gas, Steam and Air Conditioning Supply
Electricity, gas, steam and air conditioning supply
E Water Supply; Sewerage, Waste Management and Remediation Activities
Water collection, treatment and supply; Sewerage; Waste collection, treatment and disposal activities; materials recovery; Remediation activities and other waste management services.
Manufacturing C Manufacturing
Manufacture of food products; Manufacture of beverages; Manufacture of tobacco products; Manufacture of textiles; Manufacture of wearing apparel; Manufacture of leather and related products; Manufacture of wood and of products of wood and cork, except furniture; manufacture of articles of straw and plaiting materials; Manufacture of paper and paper products; Printing and reproduction of recorded media; Manufacture of coke and refined petroleum products; Manufacture of chemicals and chemical products; Manufacture of basic pharmaceutical products and pharmaceutical preparations; Manufacture of rubber and plastic products; Manufacture of other non-metallic mineral products;

69
Manufacture of basic metals; Manufacture of fabricated metal products, except machinery and equipment; Manufacture of computer, electronic and optical products; Manufacture of electrical equipment; Manufacture of machinery and equipment n.e.c; Manufacture of motor vehicles, trailers and semi-trailers; Manufacture of other transport equipment; Manufacture of furniture; Other manufacturing; Repair and installation of machinery and equipment
Construction F Construction Construction of buildings; Civil engineering; Specialised construction activities
Distribution; transport; accommodation and food
G Wholesale and Retail Trade; Repair of Motor Vehicles and Motorcycles
Wholesale and retail trade and repair of motor vehicles and motorcycles; Wholesale trade, except of motor vehicles and motorcycles; Retail trade, except of motor vehicles and motorcycles
H Transportation and Storage
Land transport and transport via pipelines; Water transport; Air transport; Warehousing and support activities for transportation; Postal and courier activities
I Accommodation and Food Service Activities
Accommodation; Food and beverage service activities
Information and Communication
J Information and Communication
Publishing activities; Motion picture, video and television programme production, sound recording and music publishing activities; Programming and broadcasting activities; Telecommunications; Computer programming, consultancy and related activities; Information service activities
Finance K Financial and Insurance Activities
Financial service activities, except insurance and pension funding; Insurance, reinsurance and pension funding, except compulsory social security; Activities auxiliary to financial services and insurance activities

70
Real Estate l Real Estate Activities
Buying and selling of own real estate; Renting and operating of own or leased real estate; Real estate activities on a fee or contract basis
Business Services
M Professional, Scientific and Technical Activities
Legal and accounting activities; Activities of head offices; management consultancy activities; Architectural and engineering activities; technical testing and analysis; Scientific research and development; Advertising and market research; Other professional, scientific and technical activities; Veterinary activities
N Administrative and Support Service Activities
Rental and leasing activities; Employment activities; Travel agency, tour operator and other reservation service and related activities; Security and investigation activities; Services to buildings and landscape activities; Office administrative, office support and other business support activities
Public Administration, health and Education
O Public Administration and Defence; Compulsory Social Security
Public administration and defence; compulsory social security
P Education
Education (pre-primary; primary; secondary; Higher education; Other education; educational support activities)
Q Human Health and Social Work Activities
Human health activities; Residential care activities; Social work activities without accommodation
Other
R Arts, Entertainment and Recreation
Creative, arts and entertainment activities; Libraries, archives, museums and other cultural activities; Gambling and betting activities; Sports activities and amusement and recreation activities
S Other Service Activities
Activities of membership organisations; Repair of computers and personal and household

71
goods; Other personal service activities
T Activities of Households as Employers; Undifferentiated Goods-and Services-Producing Activities of Households for own use
Activities of households as employers of domestic personnel; Undifferentiated goods- and services-producing activities of private households for own use
Source: ONS Summary of Structure, 2017

72
How to access background or source data
The data collected for this social research publication:
☒ are available in more detail through statistics.gov.scot and data.gov.uk

Social Research seriesISSN 2045-6964ISBN 978-1-78851-579-5
Web and Print Publicationwww.gov.scot/socialresearch
PPDAS358026 (02/18)
researchsocial
© Crown copyright 2018You may re-use this information (excluding logos and images) free of charge in any format or medium, under the terms of the Open Government Licence. To view this licence, visit http://www.nationalarchives.gov.uk/doc/open-government-licence/ or e-mail: [email protected] we have identified any third party copyright information you will need to obtain permission from the copyright holders concerned.
The views expressed in this report are those of the researcher anddo not necessarily represent those of the Scottish Government orScottish Ministers.
This document is also available from our website at www.gov.scot.ISBN: 978-1-78851-579-5
The Scottish GovernmentSt Andrew’s HouseEdinburghEH1 3DG
Produced for the Scottish Government by APS Group ScotlandPPDAS358026 (02/18)Published by the Scottish Government, February 2018