Understanding the Roots of the US Subprime Crisis and its ...
34
The Romanian Economic Journal Year XII, no. 31 (1) 2009 115 Understanding the Roots of the US Subprime Crisis and its Subsequent Effects Cristiana Tudor In this paper we provide an overview of the roots, first manifestations and further developments of the US subprime crisis and explain the securitization process by emphasizing especially the mortgage securitization process. Some explanations for the ongoing financial crisis are also offered. We continue with a presentation of the US real estate sector and its main indicators. Finnally, we investigate the relationship between home mortgages growth and gross domestic product in the United States using quarterly observations for the two variables, covering the 2002-2008 time period. We find that curret GDP is explained both by its own lagged value and by previous quarter change in home mortgages. A unidirectional Granger causality from home mortgages to the gross domestic product is also attested. We can therefore report that a significant de- crease in borrowing leads to an equally significant decrease in house prices and causes a future economic slowdown, reflected by a decrease in the gross domestic product. Key words: subprime crisis, securitization, GDP – borrowing relationship, OLS, Granger causality JEL classification: C22, C32, G01, G24 Introduction This paper contains three distinct parts. Section 1 seeks to explain the roots of the current global financial crisis, in particular the subprime loans and the spreading of securitization which led to high leverage across the financial system, presents a timeline of the main worldwide financial failures brought by the credit crisis, offers some explanations
Transcript of Understanding the Roots of the US Subprime Crisis and its ...

The Romanian Economic Journal
Year XII, no. 31 (1) 2009
115
Understanding the Roots
of the US Subprime Crisis
and its Subsequent Effects
Cristiana Tudor In this paper we provide an overview of the roots, first manifestations and further developments of the US subprime crisis and explain the securitization process by emphasizing especially the mortgage securitization process. Some explanations for the ongoing financial crisis are also offered. We continue with a presentation of the US real estate sector and its main indicators. Finnally, we investigate the relationship between home mortgages growth and gross domestic product in the United States using quarterly observations for the two variables, covering the 2002-2008 time period. We find that curret GDP is explained both by its own lagged value and by previous quarter change in home mortgages. A unidirectional Granger causality from home mortgages to the gross domestic product is also attested. We can therefore report that a significant de-crease in borrowing leads to an equally significant decrease in house prices and causes a future economic slowdown, reflected by a decrease in the gross domestic product. Key words: subprime crisis, securitization, GDP – borrowing relationship, OLS, Granger causality JEL classification: C22, C32, G01, G24
Introduction
This paper contains three distinct parts. Section 1 seeks to explain the roots of the current global financial crisis, in particular the subprime loans and the spreading of securitization which led to high leverage across the financial system, presents a timeline of the main worldwide financial failures brought by the credit crisis, offers some explanations

The Romanian Economic Journal
Year XII, no. 31 (1) 2009
116
for the subprime crisis and finally takes an overview on the real estate sector in the United States and presents and interprets its indicators.
Section two uses different econometric methods (OLS models and a Granger causality test) in order to test the relationship between the borrowing sector and the economic growth and undetakes an empiri-cal investigation in the case of the United States.
In the end, a separate section of conclusions is provided.
1. The sub-prime crisis
1.1. Preceding factors of the global financial crisis: The Sub-prime loans
The ongoing financial crisis has its roots in the US house bubble that peaked in 2006, when many lenders offered mortgages with low rates to borrowers that were not qualified to repay them or requesting very light fulfillment criteria (so-called sub-prime loans). Beginning in early 2007 and accentuating in the second half of 2007, these sub-prime lenders started to collapse, after their borrowers failed to meet their payment obligation. This situation immediately developed into the so-called "Credit Crunch" (defined as "a severe shortage of money or credit"), caused by the lack of trust of major banks to continue to pro-vide funds amongst eachother. This lack of confidence in the financial soundness of partner banks was generated by their large exposure to securitized instruments based on mortgages. Evidently, once the credit crunch happened, companies found it harder, or even impossible to borrow any more money, which led them to job cuts, cease invest-ments and eventually defaulting on their debt.
Securitization involves pooling a large number of underlying assets that produce cash flows into a fund which is continuously fed by the respective cash flows. These asset pools are therefore comprised of receivables from any number of consumer asset types, including credit

The Romanian Economic Journal
Year XII, no. 31 (1) 2009
117
cards, auto loans, and home equity loans, as well as other noncon-sumer asset types such as equipment leases and loans, utilities, aircraft leases, and royalties1. Further, based on the fund formed in this way, different types of instruments (called asset-baked securities or ABS) are issued and sold to investors2. In the case when the underlying assets that formed the pool are home mortgages, the instruments developed as a result of securitization are called MBS (mortgage-backed securities).
Besides mortgages which carry the guarantee of some agencies such as Fanny Mae or Freddie Mac, there are mortgages that do not qualify for insurance of these agencies – these are the so-called “sub-prime loans".
When an increasing number of houses were bought only from a desire to make a seemingly safe investment, houses’ price has far exceeded the intrinsic value; in this situation, at least stagnation (if not a steep reverse in trend) was inevitable.
Therefore, real estate investments have eventually (and not surpris-ingly) become unprofitable, which resulted in more and more buyers defaulting - especially those who had already a risky financial situation and therefore received only a sub-prime credit. Consequently, the sub-prime lenders were the first to default when the house market deterio-rated, which lead to further reductions in prices and other borrowers defaulting, including those with insured loans.
Financial institutions that had a big exposure on these instruments with apparently quantifiable risk (MBS), such as the investment bank Lehman Brothers or the agencies Fanny Mae and Freddie Mac were the most affected, entailing a wave of mistrust between banks, which in turn brought more bankruptcies and further corrections in the fi-nancial sector. 1 Fixed Income Sectors: Asset-Backed Securities - A primer on asset-backed securities, Dwight
Asset Management Company (2005); 2 The financial institutions that originate the loans sell a pool of cash-flow-producing assets to a
specially created third party that is called a special-purpose vehicle (SPV); This SPV further
sells the pooled loans to a trust, which issues interest- bearing securities.

The Romanian Economic Journal
Year XII, no. 31 (1) 2009
118
Ashcraft and Schuermann (2008) investigate and present details of the securitization of a pool of about 4,000 subprime mortgage loans whose principal value came to almost $900 million and which were originated by New Century Financial in the second quarter of 2006, a small part of the $51.6 billion in loans that the company originated in 2006 before declaring bankruptcy in early 2007. One surprising feature of the analyzed subprime mortgage loans is that borrowers agreed to a significant increase in their monthly payments even if there had been no change in the LIBOR rates to which the "adjustable rate" mort-gages were keyed. This increase would result from the 2/28 or 3/27 "teaser rate" feature of the vast majority of these mortgage contracts, according to which the borrower would be virtually certain to need to make a huge increase in the monthly payments within two or three years1. Ashcraft and Schuermann calculate that the monthly payments that the recipient of the loan is supposed to pay were scheduled to in-crease by 26-45% (depending on other details) within 2-1/2 years of the loan being issued, even if LIBOR rates held steady at their values at the time the loan was originated, and by which time the total princi-pal owed would have increased substantially relative to the sum that had originally been borrowed.
A second remarkable feature of this pool is the high credit rating as-signed to all but the most junior tranches. Out of the $881 million in original mortgage loans, there were created $699 million (or 79% of the total) in "senior-tranche" mortgage-backed securities that received the highest possible credit rating (AAA from Standard & Poor's or Aaa from Moody's). Only $58 million (or 6-1/2% of the total) re-ceived a rating as low as BBB or Baa. There is no reason to believe this is unrepresentative of the nearly half trillion dollars in subprime mortgages that were securitized in the U.S. in 2006. Therefore, one can easily arrive at the conclusion that this situation where higher than deserved ratings have been given by rating agencies to different finan-
1 Econbrowser: Analysis of current economic conditions and policy, Mortgage securitization:
http://www.econbrowser.com/archives/2008/01/mortgage_securi.html

The Romanian Economic Journal
Year XII, no. 31 (1) 2009
119
cial instruments and even financial institutions was general, rather than particular.
We present below a timeline of the main sub-prime crisis manifesta-tions, in the form of failures of important financial institutions around the world.
� Subprime crisis timeline :
April, 2007 - New Century Financial, which specialises in sub-prime mortgages, files for Chapter 11 bankruptcy protection and cuts half of its workforce1.
August 1, 2007 – two Bear Stearns hedge funds file for bankruptcy after sustaining heavy mortgage-related losses.
August 6, 2007 - American Home Mortgage Investment Corporation (AHMI), the 10th-largest mortgage lender, files Chapter 11 bankruptcy;
August 9, 2007 - French investment bank BNP Paribas suspends three investment funds that invested in subprime mortgage debt; they offer as an explanation the "complete evaporation of liquidity" in the market, a formulation that is viewd as the clearest sign yet that banks are refusing to do business with each other.2
August 31, 2007 – Amerique, once the largest sub-prime lender in the US goes out of business and sells its loan services branch to Citigroup;
September 14, 2007 – UK bank Northern Rock has asked for and been granted emergency financial support from the Bank of England, in the latter's role as lender of last resort. This news led depositors to withdraw £1bn in what is the biggest run on a British bank for more than a century. 1 Economy in turmoil, MSNBC: http://www.msnbc.msn.com/id/26797480; 2 Timeline: Global credit crunch, BBC News:
http://news.bbc.co.uk/2/hi/business/7521250.stm;

The Romanian Economic Journal
Year XII, no. 31 (1) 2009
120
October 1, 2007 - Swiss bank UBS is the world's first top-flight bank to announce losses - $3.4bn - from sub-prime related investments.
January 11, 2008 – Bank of America announces plans to buy Coun-tryWide Financial, a large mortgage lender, for $ 4.1bn.
February 18, 2008 - UK government announces that struggling Northern Rock is to be nationalised for a temporary period.
March 17, 2008 - Wall Street's fifth-largest bank, Bear Stearns, is ac-quired by larger rival JP Morgan Chase for $240 millions (10 $ per share) in a deal backed by $30 billions of central bank loans1.
July 13, 2008 - US mortgage lender IndyMac collapses - the second-biggest bank in US history to fail. The failure came on a day when shares in the two biggest US home loan institutions - Freddie Mac and Fannie Mae - fell at one stage by almost 50%, an event that received the most attention from American authorities, as the US Treasury Sec-retary Henry Paulson stated at that moment: “Today our primary focus is supporting Fannie Mae and Freddie Mac in their current form as they carry out their important mission”.2
September 7, 2008 - Mortgage lenders Fannie Mae and Freddie Mac - which account for nearly half of the outstanding mortgages in the US - are rescued by the US government in one of the largest bailouts in US history. Treasury Secretary Henry Paulson says the two firms' debt levels posed a "systemic risk" to financial stability and that, without action, the situation would get worse.3
September 15, 2008 - After days of searching frantically for a buyer, Lehman Brothers files for Chapter 11 bankruptcy protection, becom-ing the first major bank to collapse since the start of the credit crisis.
1 Rescue for troubled Wall St bank, BBC News:
http://news.bbc.co.uk/2/hi/business/7299938.stm; 2 Key US mortgage lender collapses, BBC News:
http://news.bbc.co.uk/2/hi/business/7503109.stm; 3 US takes over key mortgage firms, BBC News:
http://news.bbc.co.uk/2/hi/business/7602992.stm;

The Romanian Economic Journal
Year XII, no. 31 (1) 2009
121
Meanwhile, Merrill Lynch, also stung by the credit crunch, agrees to be taken over by Bank of America for $50bn1.
September 25, 2008 - In the largest bank failure yet in the United States, Washington Mutual, the giant mortgage lender, which assets had been valued at $307bn, is closed down by regulators and sold to JPMorgan Chase.2
September 28, 2008 - The credit crunch hits Europe's banking sector as the European banking and insurance giant Fortis is partly national-ised to ensure its survival.3
September 30, 2008 - The Belgian-French bank Dexia becomes the latest European bank to be bailed out as the deepening credit crisis continues to shake the banking sector.4
October 7, 2008 - The Icelandic government takes control of Landsbanki, the country's second largest bank, which owns the UK internet bank Icesave.5
As a conclusion to the section dedicated to the roots and first manifestations of the current global financial crisis, we can state that the subprime crisis is, at its core, the result of a speculative bubble in the housing market that reached a peak in 2006 in the United States and has afterwards caused ruptures across many other countries in the form of financial failures and a global credit crunch6. 1 Lehman Bros files for bankruptcy, BBC News:
http://news.bbc.co.uk/2/hi/business/7616068.stm; 2 Regulator sells Washington Mutual, BBC News:
http://news.bbc.co.uk/2/hi/business/7637026.stm; 3 Deal agreed for Euro bank Fortis, BBC News:
http://news.bbc.co.uk/2/hi/business/7641132.stm; 4 Second Belgian bank gets bail-out, BBC News:
http://news.bbc.co.uk/2/hi/business/7643638.stm; 5 Icesave savers warned on accounts, BBC News:
http://news.bbc.co.uk/2/hi/business/7656387.stm; 6 Shiller, Robert J, The Subprime solution: : How Today's Global Financial Crisis Happened,
and What to Do about It, 2008

The Romanian Economic Journal
Year XII, no. 31 (1) 2009
122
1.2. Some explanatory factors
In retrospective, the above-presented starting point, developments and manifestations of the financial crisis seem easily foreseeable and therefore avoidable, which makes the inability of regulatory and finan-cial institutions to avoid the ongoing financial crisis hard to under-stand.
We propose some explanatory factors for the current situation:
1. The real estate myth. The price of real estate investments may decline; this is a simplistic truth, but for a good period before the crisis, real estate investment was associated with a high degree of safety. We are not refering to decreases of value that may arise as a result of deprecia-tion of assets, but simply to corrections caused by declining prices, coming after prolonged periods of boom, similar to situations where the price of stocks are adjusted violently when fundamentals quickly deteriorate. For a long time period the specific low liquidity of these investments has been confused with a measure of stability, and prices, fueled by speculative capital, have been mistakenly seen as a measure of the need for these investments. As long as everyone had the same view, real estate transactions continued in the same direction and trig-gered along price increases.
The error in this philosophy is now evident, but for a long period both individuals (trying to speculate on the ever increasing house prices) and also investment banks had faith in the perpetuating value of these investments. A book that illustrates this false conviction in the increasing value of real estate investments is Robert T. Kiyosaki’s "Rich dad, poor dad" a best seller in America. The main advantage of these assets consists in the fact that besides their investment or speculative function, they also satisfy a basic need, which introduces an important subjective element that is very difficult to quantify when conducting an evaluation.

The Romanian Economic Journal
Year XII, no. 31 (1) 2009
123
Green and Watcher (2007) show that home mortgages have become an increasingly large part of American household balance sheets. If in 1949 mortage debt was equal to 20% of total household income, the authors show that it has risen to 46 percent by 1979 and to a signifi-cant 73 pecent of household income in 2001. In the same way, the percentage of mortgage debt in total household assets has risen sig-nificantly over the last decades.
Cecchetti (2008) shows that the existence of a “bubble” in 2006 could have been detected by studying a simple indicator, the ratio of the to-tal value of residential real estate to a measure of the rental value at an annual rate, an equivalent to a price-earnings ratio for equity. He fur-ther shows that normally home prices are between 9 and 11 times the annual level of rent paid, but clearly went above this normal level prior to 2006 until reaching the extraordinary level of 14.5 at the end of 2006, thus clearly suggesting the existence of a “bubble” in residential housing. Home prices were at levels far higher than justified by fun-damental values (or replacement costs).1
Figure 1 provides an overview of house price evolution during 1938 -2007. It is clear that home prices starting a striking upward trend in 1997 which lasted til 2006. A report from 2007 prepared by the Joint Economic Committee shows that between 1997 and 2006, real home prices increased by nearly 85 percent. In addition, during the period 2001 through 2005, the annual rate of house price appreciation accel-erated. The S&P/Case-Shiller Home Price Index shows annual price appreciation rising from slightly over eight and one-half percent in 2001 to more than 15 percent in 2005.
Figure 1: U.S. Housing Market in Historical Perspective: U.S. Real Housing Price Index and Other Economic Indicators, 1938-2007
1 Cecchetti, Stephen G., Monetary Policy and the Financial Crisis of 2007-2008, NBER
Working Paper, March 2008;

The Romanian Economic Journal
Year XII, no. 31 (1) 2009
124
Source: JEC, 2007
2. Leverage. Having to choose between agresevely growing their com-pany by investing in risky assets (like the mortgage-baked securities we discussed earlier) or to practice a classic style of business that can only provide a modest (but more certain) gain, investment managers have generally chosen the aggressive style, trying in this way to avoid a pos-sible takeover, to achieve better results than other competitors with a similar investment style and to satisfy investors’ expectations. Conse-quently, what in other circumstances would have been a series of sepa-rate bankruptcies of those institutions that have bet wrong and bet a lot, has become now a mass bankruptcy caused by an out-of-control competition, whose only rescue lies in the government.
In an interview with The International Herald Tribune, Andrew Lo, a professor of finance at the Massachusetts Institute of Technology who just sold his hedge fund, AlphaSimplex admits that, in order to achieve the returns that investors expected, his fund had to increase leverage to about nine times from about two times. Evidently, this was not a

The Romanian Economic Journal
Year XII, no. 31 (1) 2009
125
unique case, many investment institutions were dangerously leveraged, which resulted in a lot of panic at the first sign of financial trouble. Lo’s words from the above mentioned interview describe very well that particul situation: "Now that we have so many boats in the harbor, you can't whiz by at 50 knots without rocking a few boats. In the middle of the ocean, your wake has no impact, but in a crowded harbor, a fast exit can cause quite a disruption."1
Figure 2 shows the fraction of U.S. mortgage debt held by different types of institutions in the United States (from Green and Watcher, 2007).
1 Jenny Anderson , 2 academic papers analyze the subprime crisis, International Herald Trib-
une, September 2007;
Figure 2: Holdings of Mortgage Debt Outstanding by Type of Institution
Source: Green and Wachter1 (2007)
1 Green, Richard, Watcher Susan, The Housing Finance Revolution, Federal Research Bank of Kansas, August 2007.

3. Rating institutions had a duty to anticipate the most pessimistic sce-narios, and to grant their ratings in accordance. The problem is that they did not accomplished the job they had been entrusted with, due either to their lack of staff or lack of experience, or to their desire to prolong the life of a system in the verge of collapse. Financial institu-tions were transformed into entities whose main asset is the trust that they inspire, and rating agencies gave a measure of this confidence.
Green and Watcher (2007) show that the Wall Street Journal reported on August 15, 2007 that rating agencies chose not to change the rat-ings of MBS that were more liberally underwritten, until they actually began to fail.
Federal Reserve Bank of New York’s economists Adam B. Ashcraft and Til Schuermann also state in a December 2007 research paper1 that their view is that the rating of securities secured by subprime mortgage loans by credit rating agencies has been flawed (see section 1.1 for the high credit rating assigned on a pool of subprime mortgage loans which were originated by New Century Financial).
A re-thinking of the functioning of these companies is probably the main challenge that the world economy will have to face when it will try to get out of this crisis.
Cechetti (2008) summarizes the factors that set the stage for the cur-rent financial crisis. He shows that by the beginning of 2007:
• Home prices were at unprecedented levels.
• Home owners had more leverage than ever before.
• Mortgage quality had declined substantially.
• Asset-backed securitizations had spread well beyond the GSEs2.
In addition, Green and Watcher (2008) state that a main theme across all these puzzles is the lack of transparency, which in turn led agents to make uninformed decisions.
1 Ashcraft, Adam B. and Til Schuermann, Understanding the securitization of subprime mort-
gage credit, Federal Reserve Bank of New York, December 2007. 2 Government-Sponsored Enterprises, or GSEs, primarily the Federal National Mortgage Asso-
ciation (Fannie Mae) and the Federal National Mortgage Corporation (Freddie Mac).

The Romanian Economic Journal
Year XII, no. 31 (1) 2009
128
1.3. An overview of the recent real estate sector evolution in the US
As we mentioned earlier, the real estate sector reached a peak in 2006 and the beginning of 2007, but the the trend reversed violently after that point, a development that was closely linked to the unfolding of the financial crisis. Appendix 1 shows statistics on the evolution of the borrowing by sector in the United States from 1975 till the third quar-ter in 2008. Home mortgage (column 4 in appendix 1) decreased from the highest value of 1199.5 bn dollars in the first quarter of 2007, to 1166.7 bn dollars the following semester, continuing with sharp de-creases till year end (904 bn $ in Q3 and 702 bn $ in Q4), encounter-ing a light recovery in the first semester of 2008 to currently reach a negative value (-258.9 in the third semester of 2008).
Figure 3 gives a clearer view of this evolution.
Figure 3: Evolution of borrowing in home mortgage sector
Borrowing (Home mortgage)
-400
-200
0
200
400
600
800
1000
1200
1400
1975
1980
1985
1990
1995
2000
2005
200
2Q3
200
3Q4
200
5Q1
200
6Q2
200
7Q3
200
6Q4
200
8Q1
Date
bn
$
Home mortgage
Source: author’s representation with data from Federal Reserve, Flow of Funds, December 2008

The Romanian Economic Journal
Year XII, no. 31 (1) 2009
129
Another indicator of the real estate sector, Existing-home sales (EHS), which is published by US NAR (The National Association of Realtors) and includes single-family, townhomes, condominiums and co-ops fell 8.6 percent to a seasonally adjusted annual rate¹ of 4.49 million units in November from a downwardly revised level of 4.91 million in October. Over the last year EHS decreased 10.6 percent, from 5.02 million-unit pace in November 2007.
The national median existing-home price for all housing types was $181,300 in November, down 13.2 percent from November 2007 when the me-dian was $208,800 (this was the biggest one year decrese in the last 40 years, since the index started). The current value is significantly smaller than the median price from 2007 (219 000 USD), 2006 (221 900 USD) or 2005 (219 600 USD). 1
A more relevant indicator for the real estate sector’s evolution is the Pending Home Sales Index, a forward-looking indicator. The last release of PHSI by the NAR was on January 9th, 2009 (based on contracts signed in November 2008) and showed a decrease of 4.0 percent to 82.3 from a downwardly revised reading of 85.7 in October 2008. The annual decrease of the index is 5.3%, compared to its value from No-vember 2007 when it was 86.9. The current index is the lowest since the series began in 2001, well under its value in 2007(96.3), 2006 (111.9) or 2005 (124.4) (See Table 1).
At the moment specialists expect home sales to continue the down-ward trend (or at least not to improve significantly) during the follow-ing months (January and February of 2009), as a result of low values of the pending home sales index and because winter months are usu-ally low selling months.
Table 1: Pending Home Sales Index 1 Existing-Home Sales Decline in Economic Uncertainty :
http://www.realtor.org/press_room/news_releases/2008/12/ehs_decline_in_economic_uncertai
nty WASHINGTON , December 23, 2008;

The Romanian Economic Journal
Year XII, no. 31 (1) 2009
130
Sourse: National Association of Realtors (http://www.realtor.org/research/research/phsdata)
In conclusion, house selling is currently at a very low level in the US and house prices are significantly lower than in the previous year. If this downward price trend continues, it is possible for potential buyers to start showing an interest in purchasing again these assets. In addi-tion, assuming loan granting criteria remain unchanged, the number of eligible buyers might increase because of the low house prices and also because of the successive interest cuts made by the Fed, which im-proved loan conditions. Nevertheless, the credit score of the borrow-

The Romanian Economic Journal
Year XII, no. 31 (1) 2009
131
ers is strongly linked to their revenues, which in turn are highly corre-lated with economic disfunctions caused by the ongoing crisis, thus uncertain.
These dramatical declines of housing prices have significant economic effects. A large price decrease reflects a decline in demand for new housing, which in turn will result in a decline of construction activity. This contraction is already under way, and has reduced residential in-vestment sufficiently so that GDP growth has declined markedly in the recent period in the United States.
In the next section we investigate the correlation and causal relation-ship between the decrease in home mortgages (which reflects the de-crease in demand and brings price declines) and the economic growth, reflected by the gross domestic product. We are interested in finding a statistically significant relationship (either causal or contemporaneous) between home mortgages and subsequent economic growth.
2. An empirical test on the causal relationship between home mortgages and GDP in the United States
2.1. Data and methodology
We employ quarterly observations for the rate of change in US home mortages and for the rate of change in the US gross domestic product (GDP). We use the home mortgage series (Mortg) from domestic non-financial debt (DNFD) statistics in the Flow of Funds release (Ferderal Reserve, December 2008). For the GDP series we use the series entitled Percent Change from Preceding Period in Real Gross Domestic Product, published by The US Bureau of Economic Analy-sis (BEA).
The analysis covers the period 2002-2008 and comprises a total of 24 quarterly observations (from Q4 of 2002 to Q3 of 2008).

The Romanian Economic Journal
Year XII, no. 31 (1) 2009
132
In the beginning we investigate the correlations between GDP and the rate of growth in home mortgages. Further, we need to investigate the stationarity of the time series before applying the linear Granger cau-sality test. For that account, we conduct the Augmented Dickey-Fuller test. Finally, we test for linear Granger causality between same-order integrated series.
2.2. Correlations between home mortgages growth and GDP growth
Following Greenlaw, Hatzius Kashyap and Shin (2008) we first relate the quarterly growth in GDP to its own lagged value and the lagged quarter change of home mortgages. Further, we investigate the con-temporaneous relationship between the two variables by introducing the unlagged growth in borrowing as an independent variable. Fin-nally, various univariate regressions are run, with same quarter growth in borrowing, previous quarter growth in borrowing and previous quarter GDP growth successively used as explanatory factors.
Greenlaw, Hatzius Kashyap and Shin (2008) relate the quarterly log difference of GDP (multiplied by 400 to convert to an annualized rate) to three of its own lags and the lagged four quarter (log) change of DNFD (times 100). They state that he lags of GDP provide the simplest set of controls for the inertia that characterizes the business cycle.
In our case, the shorter set of data doesn’t allow us to increase the number of explanatory variables (the loss in degrees of freedom would be too important).
We estimate the models with data starting in 2002 Q4 through 2008 Q3.
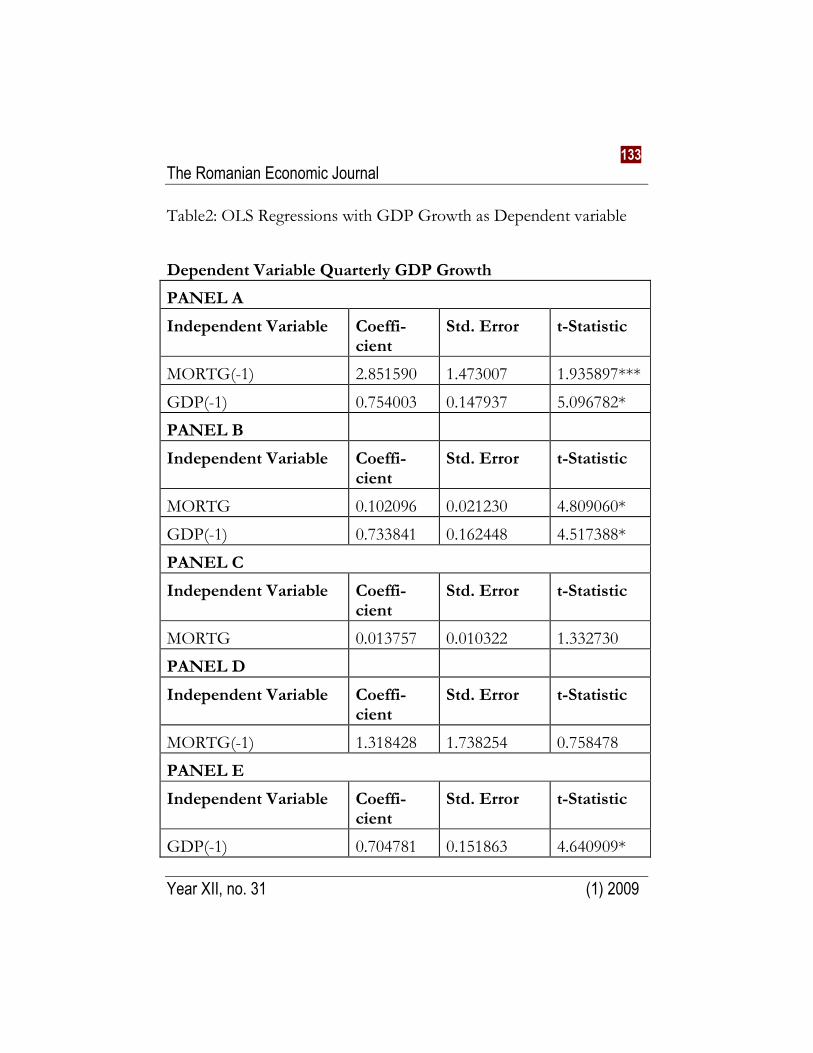
The coefficients and heteroskedasticity-corrected standard errors from these regressions are shown in Table 2.
The Romanian Economic Journal
Year XII, no. 31 (1) 2009
133
Table2: OLS Regressions with GDP Growth as Dependent variable
Dependent Variable Quarterly GDP Growth
PANEL A
Independent Variable Coeffi-cient
Std. Error t-Statistic
MORTG(-1) 2.851590 1.473007 1.935897***
GDP(-1) 0.754003 0.147937 5.096782*
PANEL B
Independent Variable Coeffi-cient
Std. Error t-Statistic
MORTG 0.102096 0.021230 4.809060*
GDP(-1) 0.733841 0.162448 4.517388*
PANEL C
Independent Variable Coeffi-cient
Std. Error t-Statistic
MORTG 0.013757 0.010322 1.332730
PANEL D
Independent Variable Coeffi-cient
Std. Error t-Statistic
MORTG(-1) 1.318428 1.738254 0.758478
PANEL E
Independent Variable Coeffi-cient
Std. Error t-Statistic
GDP(-1) 0.704781 0.151863 4.640909*

The Romanian Economic Journal
Year XII, no. 31 (1) 2009
134
*significant at 0.01
**significant at 0.05
***significant at 0.1
Panel A in Table 2 shows that last quarter’s growth in Home Mort-gages is positively and significantly correlated with current quarter real GDP growth (slope coefficient equals 2.85, significant at 0.1). Thus, our regression results indicate that credit shocks will be reflected in subsequent economic growth. Last’s quarter GDP is also a risk factor for current economic growth, the positive relationship (0.75) being statistically significant at a 0.01 level.
Figure 4 gives a graphical view of the same relationships over the ana-lyzed perioad of 24 quarters (on Ox). The red line represents the de-pendent variable (GDP), while the blue line represents the home mortgages growth in the previous quarter (Mortg (-1)). The positive relationship between the two indicators is evident in the chart below.
Figure 4: Correlation between GDP and lagged HM (2002: Q4 – 2008: Q3)
-2
0
2
4
6
8
2 4 6 8 10 12 14 16 18 20 22 24
MORTGLAG GDP

The Romanian Economic Journal
Year XII, no. 31 (1) 2009
135
Further, when we consider the contemporaneous borrowing rate and stil keep the lagged GDP as independent variables (Panel B), we notice that thepositive relationship between the rate of borrowing and eco-nomic growth is less powerful, but remains positive, while its statistical significance increases. The slope coefficient of the autoregressive term is almost unchanged in value and significance.
The univariate regressions (Panels C, D and E) bring the following re-sults: 1) the correlation between borrowing rate and same quarter eco-nomic growth is insignificant; 2) previous growth in the rate of bor-rowing is positively related to subsequent growth in GDP, but this positive relationship does not have statistical significance; 3) previous quarter economic growth influences the current economic growth and this positive impact keeps its significance and power through different regression models.
In conclusion, the previous growth in the rate of borrowing has the strongest impact on the current GDP growth when the autoregressive term of GDP growth is also introduced as an independent variable in a regression equation.
2.3 Granger causality Test
Next, a Granger causality test is used to ascertain with more precision the causal relationship between lending policy and rate of economic growth.
Granger causality tests are widely used in applied economics as a way of establishing if a variable has been a leading indicator of another over the past. It is very important that a Granger causality test can only pe conducted on stationary time series. We must therefore inves-tigate the existence of a unit root in the time series before we can study the causal relationship between GDP and home motgages.

The Romanian Economic Journal
Year XII, no. 31 (1) 2009
136
The ADF test (augmented Dickey-Fuller ) estimates the following re-gression equation:
tptpttt yyyty εδδγβα +∆++∆+++=∆ −−− ....111 ,
where α is a constant, β represents the time trend and p is the lag or-der of the autoregressive process. The ADF test is carried out by test-ing the null hypothesis of a unit root in the stochastic process generat-ing yt (H0: γ = 0) against the alternative hypothesis Ha: γ ≠0, that is the time series does not have a unit root and is stationary.
We chose to use the Schwartz Information Criterion (SIC) for estab-lishing the lag length.
Results of ADF test without a constant or trend coefficient (reported in Table 3) indicate that the time series of home mortgage growth is stationary at level, or integrated of order 0 ~ I (0), with a statisticall significant ADF statistic of -6.70.
Test results for the time series of GDP could not reject the null hy-pothesis. (The ADF statistic had a insignificant value of -0.95), there-fore we repeated the metodology after first differencing the series. The series of first differences in quarterly GDP growth does not have a unit root, thus is stationary (ADF test statistic of -5.70, significant at 0.01). We can now apply the linear Granger causality test on the two stationary time series.
Table 3: Results of the ADF unit root tests Lag lenght ADF test
Home Mortgages series (HM) 1 -6.704854*
GDP growth series (GDP) 2 -0.958486
GDP growth first differenced series 1 -5.703402*
* Significant at 1%

The Romanian Economic Journal
Year XII, no. 31 (1) 2009
137
** Significant at 5%
*** Significant at 10%
We test for Granger causality by estimating the following VAR mod-els:
tit
p
i
iit
p
i
it HMGDPGDP ,1
1
,1
1
,11 εβαµ +++= −
=
−
=
∑∑
and
tit
p
i
iit
p
i
it GDPHMHM ,2
1
,2
1
,22 εβαµ +++= −=
−=
∑∑,
where GDP represents the quarterly GDP growth and HM is the quarterly growth of home mortgages. We test the null hypothesis that all beta coefficients are zero, which means that GDP (HM) does not Granger cause HM (GDP).
Testing causality, in the Granger sense, involves using F-tests to test whether lagged information on a variable Y provides any statistically significant information about a variable X in the presence of lagged X. If not, then "Y does not Granger-cause X." In other words, a variable Y is said not to Granger-cause a variable X if the distribution of X, conditional on past values of X alone, equals the distribution of X, conditional on past realizations of both X and Y. If this equality does not hold, Y is said to Granger-cause X. If Y can predict future X, over and above what lags of X itself can, then Y Granger causes X.
In order to take into account potential heteroskedasticity of the VAR residuals, the test is based on heteroskedasticity-robust variance–covariance matrices.

The Romanian Economic Journal
Year XII, no. 31 (1) 2009
138
Tabel 4 : Granger causality tests
Null Hypothesis: F-Statistic Prob-
ability
MORTG does not Granger Cause GDP
3.10773 0.09400
GDP does not Granger Cause MORTG
0.06581 0.80029
Results reported in Table 4 confirm the existence of causal relation-ship from home mortgages growth to gross domestic product, while the null hypothesis of lack of causality cannot be rejected for the GDP-home mortgages relationship.
In conclusion, we found unidirectional causality from home mortgages growth to economic growth, represented by the quarterly change in GDP. In other words, the significant decrease in borrowing, which led to an equally significant decrease in house prices (as we saw earlier) is also responsible for a future economic recession, reflected by a de-crease in the gross domestic product.
3. Conclusions
The US housing market presented all the classic signs of a “boom” or was overheated by 2006, with dramatical increases in prices over the previous years, lower acceptable credit scores for buyers, a decrease of the price per unit of risk ratio especially in the case of mortgage loans and a record level for the ratio of the total value of residential real estate to a measure of the rental value at an annual rate, an equivalent to the PER for equity. Simple statistical investigations would have shown
The Romanian Economic Journal
Year XII, no. 31 (1) 2009
139
that house prices have far exceeded their fundamental value. In addi-tion, both home owners and financial institutions had more leverage than ever before as asset-backed securitizations spread significantly and rating agencies failed to detect the imminent danger of the high leverage present in the system.
The expansion of the so-called subprime loans kept pushing the prices higher, til the point were there was no more room to go up. This situa-tion prevented the timely detection of the troubles to come, because the ever increasing house prices covered the quality deterioration of the borrowers. When eventually the upward price trend came to an end, only then the poor quality of the borrowers became evident, but is was already too late, as the credit crisis immediately unfolded. Its first manifestation happened in April, 2007 when New Century Finan-cial, specialized in sub-prime mortgages, filed for bankruptcy protec-tion.
The overview on the US real estate sector revealed that both house selling and house prices are currently at very low levels and the market is not showing signs of improvement, as the latest release of the pend-ing home sales index, a forward looking indicator, shows that the downward trend will continue at least for the following months.
The investigation of the relationship between the rate of growth of home mortgages and economic growth (reflected by the change in GDP) reveals that current GDP is determined by previous shocks in home mortgages, but also by its own past evolution. The OLS regres-sion model with GDP as the dependent variable and lagged values of both GDP and Home Mortgages as independent variables and also the Granger causality test between the two indicators both reach the same conclusion: past credit shocks (proxied by previous change in home motgages) will be reflected in subsequent economic growth (proxied by the percentage change in GDP).

The Romanian Economic Journal
Year XII, no. 31 (1) 2009
140
References
Anderson, Jenny, 2 academic papers analyze the subprime crisis, Interna-tional Herald Tribune, September 2007;
Ashcraft, Adam B. and Til Schuermann, Understanding the securitization of subprime mortgage credit, Federal Reserve Bank of New York, December 2007;
Cecchetti, Stephen G., Monetary Policy and the Financial Crisis of 2007-2008, NBER Working Paper, March 2008;
Chari, VV, L Christiano, PJ Kehoe, Facts and Myths about the Financial Crisis of 2008 - Federal Reserve Bank of Minneapolis Working Paper, 2008
Chen N.-K., Bank Net Worth, Asset Prices and Economic Activity. Journal of Monetary Economics, 2001;
Goodhart, Charles, Boris Hofmann, House prices, money, credit, and the macroeconomy, Oxford Review of Economic Policy, 2008;
Green, Richard, Watcher Susan, The Housing Finance Revolution, Federal Research Bank of Kansas, August 2007.
Greenlaw, David, Jan Hatzius, Anil Kashyap and Hyun Song Shin, Leveraged Losses: Lessons from the Mortgage Market Meltdown, Proceedings of the U.S. Monetary Policy Forum, 2008
Hofmann B. Bank Lending and Property Prices: Some International Evi-denceHong Kong Institute for Monetary Research Working Paper No. 22/2, 2003;
Ivashina, Victoria, Scharfstein, David, Bank Lending During the Financial Crisis of 2008, Working Paper, Harvard Business School, 2008
Kiyosaki, Robert T., "Rich dad, poor dad", 2’nd Edition, Curtea Veche, Bucharest 2008;

The Romanian Economic Journal
Year XII, no. 31 (1) 2009
141
Rosen, Richard J, The role of securitization in mortgage lending, Chicago Fed Letter, November 2007;
Shiller, Robert J, The Subprime solution: How Today's Global Financial Crisis Happened, and What to Do about It, 2008
Joint Economic Committee, The Subprime Lending Crisis: The Economic Impact on Wealth, Property Values and Tax Revenues, and How We Got Here, 2007;
Existing-Home Sales Decline in Economic Uncertainty, National Association of Realtors, http://www.realtor.org/press_room/news_releases/2008/12/ehs_decline_in_economic_uncertainty, Washington, December 2008;
Fixed Income Sectors: Asset-Backed Securities - A primer on asset-backed securi-ties, Dwight Asset Management Company (2005);
"BNP Paribas suspends funds because of subprime problems", International Herald Tribune (August 09, 2007).
Economy in turmoil, MSNBC: http://www.msnbc.msn.com/id/26797480;
Timeline: Global credit crunch, BBC News: http://news.bbc.co.uk/2/hi/business/7521250.stm
Rescue for troubled Wall St bank, BBC News http://news.bbc.co.uk/2/hi/business/7299938.stm;
Key US mortgage lender collapses, BBC News: http://news.bbc.co.uk/2/hi/business/7503109.stm;
US takes over key mortgage firms, BBC News: http://news.bbc.co.uk/2/hi/business/7602992.stm;
Lehman Bros files for bankruptcy, BBC News: http://news.bbc.co.uk/2/hi/business/7616068.stm;
Regulator sells Washington Mutual, BBC News: http://news.bbc.co.uk/2/hi/business/7637026.stm;

The Romanian Economic Journal
Year XII, no. 31 (1) 2009
142
Deal agreed for Euro bank Fortis, BBC News: http://news.bbc.co.uk/2/hi/business/7641132.stm;
Second Belgian bank gets bail-out, BBC News: http://news.bbc.co.uk/2/hi/business/7643638.stm;
Icesave savers warned on accounts, BBC News: http://news.bbc.co.uk/2/hi/business/7656387.stm;
Bureau of Economic Analysis, National Economic Accounts, US De-partment of Commerce: http://www.bea.gov/national/index.htm#gdp
Cristiana TUDOR (28.12.1980), Assistant Professor, PhD., Depar-tament of International Business and Economics, Bucharest Academy of Economic Studies, Romania. Knowledge area: Portfolio Theory and Capital Market Theory, Asset Pricing Models, Applied economet-rics, Corporate finance, Risk management models.
Publications (selection)
Calendar anomalies on Bucharest Stock Exchange: testing for Month-of-the-Year effect (in English), in “Risk in the contemporary economy”, Interna-tional Conference, Universit Dunarea de Jos Galati, ISBN 978-973-7845-58-0, Ed. Europlus Galati, November 2007;
An empirical study on risk-return tradeoff using GARCH-class models: evidence from Bucharest Stock Exchange (in English), International Conference ICBE Constanta, November 2008, Ed. Muntenia, ISBN 978-973-692-233-6;
Investigating the size effect and the power of the book-to-market ratio in predicting the cross-section of expected stock returns on Bucharest Stock Exchange (in Eng-lish), in “Business and information technologies. New approaches”, International Conference organized by The European research center

The Romanian Economic Journal
Year XII, no. 31 (1) 2009
143
of managerial studies in business administration from Craiova, Octo-ber 2008, ISBN 978-973-671-162-6;
The impact of trading volume on stock returns and volatility on the Romanian capital market (in English), International Conference ICBE Constanta, November 2008, Ed. Muntenia.

Appendix 1: Borrowing by Sector
Households Business
State
and
local
govern
ments
Fed
eral
Gov
ern
men
t
Do-
mes-
tic
finan
cial
sec-
tors
Fo
re
ig
n
Home Con-
sumer
Date To-
tal
To-
tal
mort-
gage
credit To-
tal
Corpo
rate
1975 192
.9
56.9 39.7 7.8 39.2 18 11.1 85.6 2.1 14
.1
1976 244
.7
83.1 57.6 22 73.9 43.4 18.5 69.2 23.5 20
.5
1977 321
.1
127.
9
85.9 35.5 117.
1
73.2 19.9 56.3 53.6 13
.5
1978 390
.5
160 105.7 46.4 138.
5
78.7 39.4 52.5 74.7 24
1979 391
.6
169.
8
116.5 43.3 159.
4
83.1 26.6 35.8 91.1 15
1980 342
.9
108.
3
90.2 3.4 135 70.2 22.2 77.4 73.2 24
.2
1981 409
.7
106.
4
67 19.8 190.
1
123.4 27.6 85.5 105.1 23
.5
1982 439
.7
83.9 47.4 18.8 152.
8
93.4 41.7 161.
3
93 16
1983 572
.9
175.
6
105.1 48.2 164.
8
90.1 47.3 185.
2
104.4 17
.3
1984 791
.7
219 127.3 81.7 323 204.9 52.5 197.
2
157.8 8.
4
1985 958
.9
313.
8
181.5 84 255.
9
182.9 163.6 225.
7
204 1.
2

Jurnalul Economic
Anul XII, nr. 31 (1) 2009
145
1986 846
.4
261.
1
198.8 55.8 295.
1
223.9 74.2 216 328.8 9.
7
1987 718
.6
263.
8
221.5 32.3 220.
5
162.7 90.4 143.
9
290.6 6.
3
1988 784
.4
271.
5
215.7 46.6 307.
4
222.4 50.4 155.
1
250.2 7.
4
1989 684
.2
282.
9
224.9 47 207.
6
160 47.4 146.
4
225 10
.2
1990 656
.4
231.
8
199.2 15.1 130.
7
136.4 47.1 246.
9
211.2 23
.9
1991 469
.5
184.
1
173.5 -8.8 -84.1 -52.9 91.2 278.
2
156 15
.1
1992 512
.3
198.
8
171.1 9.2 -7 24.3 16.5 304 238.9 24
.1
1993 561
.6
237.
7
156.5 61.4 9.8 30.7 57.9 256.
1
291.5 69
.8
1994 578
.3
322.
7
167.4 135 145.
3
130.2 -45.5 155.
9
462 -
11
.2
1995 678
.8
309.
8
154 147 285.
3
237.7 -60.8 144.
4
439.5 78
.3
1996 733
.8
336.
4
205.5 105.7 273 199.9 -20.5 144.
9
514 88
1997 813
.6
300.
9
216.1 70.3 438.
8
333.9 50.8 23.1 574.1 69
.9
1998 100
6.8
426 301.6 97.1 566.
6
383.1 66.8 -
52.6
1026.
8
37
.2
1999 104
3.1
495 380 112.4 582 383.6 37.3 -
71.2
1027.
4
19
2000 864
.8
583.
5
385.7 176.5 560.
3
361.9 16.9 -
295.
9
793.8 63
2001 115 672. 506.9 150.7 380. 212.7 105.5 -5.6 872.3 -

Jurnalul Economic
Anul XII, nr. 31 (1) 2009
146
2.7 2 6 11
.2
2002 141
2.3
830.
8
706.4 107.9 179.
8
22.9 144.1 257.
6
878.8 93
.4
2003 167
7.4
984.
1
859.7 104.4 177.
2
87.3 120.1 396 1065.
8
42
.4
2004 199
0.5
1058
.1
934.8 115 455.
2
204 115.4 361.
9
975.4 15
4.
7
2005 232
2.7
1167
.3
1036.
8
94.5 676.
8
332.4 171.7 306.
9
1115.
4
11
2.
6
2006 242
2.1
1198
.7
993.3 104.4 888.
9
469.4 151.1 183.
4
1297.
6
33
1.
3
2007 252
3.4
876.
3
674.5 133.6 1224
.2
789.4 185.9 237.
1
1762.
9
12
4.
3
2002
Q1
124
1.8
788.
4
643.9 115 285 129.4 86.8 81.6 846.6 13
0.
6
2002
Q2
150
8.1
785.
7
648.4 139.2 166.
9
9.4 150.8 404.
8
865.8 59
.3
2002
Q3
127
4.3
774.
7
735.6 87.6 65.8 -91 155.6 278.
2
770.3 26
.4
2002
Q4
162
5
974.
5
797.8 89.9 201.
7
43.7 183.2 265.
6
1032.
7
15
7.
3
2003
Q1
132
0.2
898.
4
755.2 111.9 207.
4
116.5 108.4 106 1157.
9
31
.3
2003
Q2
227
0.9
1109 967.7 116.7 261.
2
182.7 169.6 731.
2
841.4 16
8.
4
2003
Q3
161
7.6
1021
.9
916.8 105.5 124.
1
23.9 98.1 373.
5
1012.
3
-
12

Jurnalul Economic
Anul XII, nr. 31 (1) 2009
147
6.
3
2003
Q4
150
1
907.
1
798.9 83.6 116.
1
25.9 104.3 373.
5
1251.
6
96
2004
Q1
186
5.6
954.
3
807.1 134.7 414.
3
156.7 155 342 841.3 14
7.
1
2004
Q2
199
4.9
1114 1010.
2
72 321.
1
73.3 67 492.
8
1033.
7
11
.1
2004
Q3
182
8.7
940.
4
883.3 119 453.
2
203.8 136.4 298.
8
906.4 12
9.
2
2004
Q4
227
3
1223
.6
1038.
6
134.5 632.
1
382.1 103.3 314.
1
1120.
2
33
1.
6
2005
Q1
210
0.4
961.
7
845.4 111.4 539.
6
224 197 402.
2
951.4 66
2005
Q2
218
2.2
1197
.6
1052.
5
106 659.
1
308.8 129.9 195.
6
1174.
8
11
3.
8
2005
Q3
241
3.2
1261
.6
1137 98.2 665.
3
317.8 215.9 270.
5
737.2 14
3.
3
2005
Q4
259
4.9
1248
.2
1112.
5
62.2 843.
3
479.1 144.1 359.
2
1598.
1
12
7.
3
2006
Q1
260
6
1337 1199.
5
65.3 861.
8
444.8 96.5 310.
7
1372.
6
20
7.
7
2006
Q2
254
7.8
1397
.5
1166.
7
125.6 893.
4
466.6 132.7 124.
2
1583.
6
19
4.
4
2006
Q3
210
3.6
1111 904.5 110.4 686.
6
272.8 155.4 150.
6
995.2 59
6.
7

Jurnalul Economic
Anul XII, nr. 31 (1) 2009
148
2006
Q4
243
1.1
949.
4
702.6 116.4 1113
.9
693.6 219.8 148 1239.
1
32
6.
6
2007
Q1
240
9
939.
7
807.3 119.7 982.
1
659.1 219.5 267.
8
1483.
8
18
4.
4
2007
Q2
241
1.1
949.
2
768.7 132.1 1241
.2
850.5 206.2 14.5 1474.
6
29
2.
9
2007
Q3
278
0.1
813.
1
501.4 178.4 1416
.7
872.4 152.5 397.
8
2510.
6
3.
3
2007
Q4
249
3.3
803.
1
620.6 104.3 1256
.7
775.6 165.3 268.
2
1582.
4
16
.4
2008
Q1
168
7.1
436.
1
275 120.3 763.
7
405.4 74.6 412.
7
869.1 28
0.
6
2008
Q2
100
9.9
77.1 -10.5 99.7 603.
7
387.1 18.8 310.
4
936.2 72
.5
2008
Q3
234
8.1
-
117.
4
-258.9 30.5 321.
7
260.6 65.3 207
8.5
1189.
7
-
54
7.
3
*Billions of dollars; quarterly figures are seasonally adjusted annual rates
Source: Federal Reserve, statistical release December 2008