Understanding the Rise in Corporate Cash: Precautionary ... · to understand the factors that cause...
51
April 2018 Understanding the Rise in Corporate Cash: Precautionary Savings or Foreign Taxes Michael W. Faulkender University of Maryland Kristine W. Hankins University of Kentucky Mitchell A. Petersen Northwestern University National Bureau of Economic Research Abstract What has driven the dramatic rise in U.S. corporate cash? Using non-public data, we show that the run-up is not uniform across firms and is greatest in the foreign subsidiaries of multinational firms. Standard precautionary motives explain only domestic cash holdings, not the burgeoning foreign cash balances. Falling foreign tax rates, coupled with relaxed restrictions on income shifting, are the root of the changing foreign cash patterns. IP intensive firms have the greatest ability to shift income to low tax jurisdictions, and their foreign subsidiaries are where we observe the largest accumulations of cash. The statistical analysis of firm-level data on U.S. multinational companies was conducted at the Bureau of Economic Analysis, U.S. Department of Commerce, under arrangements that maintain legal confidentiality requirements. The views expressed in the paper are those of the authors and do not reflect official positions of the U.S. Department of Commerce. We appreciate the suggestions and advice of Chris Anderson, Alice Bonaimé, Sergey Chernenko, Laurent Fresard, Craig Furfine, Gustavo Grullon, Kathleen Kahle, Stephen Karolyi, Chris Parsons, Rene Stulz, Rohan Williamson, and William Zeile as well as seminar and conference participants at American Finance Association, Dartmouth University, Federal Reserve Board of Governors, Florida State University, Georgetown University Georgia Institute of Technology, Louisiana State University, Midwest Finance Association, Northeastern University, Northwestern University, Ohio State, Rice University, the Securities and Exchange Commission, the Shanghai Advanced Institute of Finance, the Swiss Finance Institute, and the Universities of Alberta, Cincinnati, Illinois-Chicago, Illinois- UC, Iowa, Kansas, Miami, Oklahoma, Pennsylvania, Pittsburgh, Oregon, San Diego, Southern California and South Carolina. The research assistances of Austin Magee, Sang Kim and Mark Scovic is greatly appreciated. Kristine Hankins also thanks the John H. Schnatter Institute for the Study of Free Enterprise for financial support.
Transcript of Understanding the Rise in Corporate Cash: Precautionary ... · to understand the factors that cause...

April 2018
Understanding the Rise in Corporate Cash: Precautionary Savings or Foreign Taxes
Michael W. Faulkender University of Maryland
Kristine W. Hankins
University of Kentucky
Mitchell A. Petersen Northwestern University
National Bureau of Economic Research
Abstract
What has driven the dramatic rise in U.S. corporate cash? Using non-public data, we show that the run-up is not uniform across firms and is greatest in the foreign subsidiaries of multinational firms. Standard precautionary motives explain only domestic cash holdings, not the burgeoning foreign cash balances. Falling foreign tax rates, coupled with relaxed restrictions on income shifting, are the root of the changing foreign cash patterns. IP intensive firms have the greatest ability to shift income to low tax jurisdictions, and their foreign subsidiaries are where we observe the largest accumulations of cash. The statistical analysis of firm-level data on U.S. multinational companies was conducted at the Bureau of Economic Analysis, U.S. Department of Commerce, under arrangements that maintain legal confidentiality requirements. The views expressed in the paper are those of the authors and do not reflect official positions of the U.S. Department of Commerce. We appreciate the suggestions and advice of Chris Anderson, Alice Bonaimé, Sergey Chernenko, Laurent Fresard, Craig Furfine, Gustavo Grullon, Kathleen Kahle, Stephen Karolyi, Chris Parsons, Rene Stulz, Rohan Williamson, and William Zeile as well as seminar and conference participants at American Finance Association, Dartmouth University, Federal Reserve Board of Governors, Florida State University, Georgetown University Georgia Institute of Technology, Louisiana State University, Midwest Finance Association, Northeastern University, Northwestern University, Ohio State, Rice University, the Securities and Exchange Commission, the Shanghai Advanced Institute of Finance, the Swiss Finance Institute, and the Universities of Alberta, Cincinnati, Illinois-Chicago, Illinois-UC, Iowa, Kansas, Miami, Oklahoma, Pennsylvania, Pittsburgh, Oregon, San Diego, Southern California and South Carolina. The research assistances of Austin Magee, Sang Kim and Mark Scovic is greatly appreciated. Kristine Hankins also thanks the John H. Schnatter Institute for the Study of Free Enterprise for financial support.

1
According to recent Flow of Funds estimates, U.S. non-financial corporations are sitting
on an aggregate cash and marketable securities position of approximately $3 trillion (see Figure
1). This staggering amount has led policy makers and commentators to express concern as to why
firms are building such large stockpiles. To explain the dramatic rise in cash, it is first necessary
to understand the factors that cause firms to hold cash.
In a world of capital market frictions and uncertain investment opportunities, holding cash
enables firms to invest in value creating projects without delay. This precautionary savings story
has been the focus of the academic literature. Earlier work focused on measuring firms’ access to
the capital markets (Opler et al., 1999), while more recent work has focused on the role of
increasing investment uncertainty (Martin and Santomero, 1997; Boyle and Guthrie, 2003; Bates,
Kahle, and Stulz, 2009; and Harford, Klasa, and Maxwell, 2014).
Contrary to the focus of the literature, not all cash is held for precautionary savings. Thus,
changes in uncertainty and financing frictions may not explain the huge run-up in corporate cash.
Foley et al. (2007) and Graham and Leary (2017) explore foreign taxes as an alternative
explanation for why firms hold cash. The United States will tax the income of foreign subsidiaries,
but only when the income is repatriated. Thus, when the foreign tax rate is less than the U.S. rate,
there is an incentive to delay repatriation (Graham, Hanlon, and Shevlin, 2010). The objective is
to minimize the present value of taxes; but the result can be a buildup of cash in foreign subsidiaries
– often called “trapped cash.” Foley et al. (2007) show in a cross-sectional time-series regression
that lower foreign tax rates are associated with higher total and higher foreign cash.
Our research bridges these two distinct explanations. To explore the immense growth in
corporate cash, we identify where the cash is located and consider how that might relate to different
motivations for holding cash. Location matters. Foreign and domestic cash are perfect substitutes

2
when the tax rates are equal and there is no incentive to delay repatriation. However, as foreign
tax rates fall below U.S. rates, there is an incentive not only to delay the repatriation of foreign
income, but also to shift income into lower tax jurisdictions.
The empirical challenge is that observing domestic and foreign cash historically has not
been possible using publicly available data sources. While some firms recently have voluntarily
disclosed their foreign cash position (Harford et al 2015), this selectively released data is limited
in both scope and length. The Bureau of Economic Analysis (BEA) conducts a mandatory survey
of U.S. multinational companies that generates the data that is needed to address this shortcoming.
From this survey, we are able to measure the amount of cash and marketable securities that firms
are holding in each foreign subsidiary. Combining this with the disclosure of their total cash and
marketable securities position (from Compustat), we are able to calculate how much cash is held
domestically.
We unpack the distinct channels that could be driving the rise in cash: growing
international business activity, changing precautionary cash needs, declining foreign corporate tax
rates, and lastly, active tax minimization behavior by U.S. corporations. The run-up in corporate
cash has roots in each of these channels, but we find the last two to be the dominant reasons. We
first ask whether the factors that explain the level of total cash (precautionary savings or foreign
taxes) apply equally to domestic and foreign cash. Here we find that the factors that drive the two
decisions are quite distinct. Domestic cash is explained mainly by precautionary savings variables,
while foreign cash is explained mainly by foreign tax explanations. Firms with a lower effective
tax rate (an average of the marginal U.S. and foreign tax rates which firms face given the location
of their foreign operations) hold more foreign cash. We find very little evidence of precautionary
motives explaining foreign cash holdings. The rise in total cash is due almost exclusively to a rise

3
in foreign cash, and a large fraction of the rise in foreign cash is attributable to tax motivations.1
Our estimates suggest that 79% of the increase in foreign cash (4.1% of the overall 5.2% increase
in the foreign cash to assets ratio) is explained by the reductions in tax rates that firms face on their
foreign income over our sample period.
Having documented that the motivations for holding foreign and domestic cash are
different, and that the run up in cash is driven by the run up in foreign cash, we next focus on the
mechanisms by which this happens. Higher foreign cash can arise due to a growth of international
sales, a passive response to falling foreign tax rates, an active shifting of income to minimize taxes,
or some combination of the three. Since firms can lower the present value of taxes by earning
income in low tax foreign subsidiaries (at the cost of building cash up in these subsidiaries), why
don’t all firms do this? There is evidence that intellectual property royalties and transfer payments
facilitate the offshoring of income to low tax jurisdictions (Grubert, and Mutti, 1991; Levin and
McCain, 2013; Kanter, 2014). Firms with intellectual property, whether it consists of patents,
trademarks or licensing deals, may be better able to adjust the ownership and within-firm pricing
of the IP to transfer revenues from more highly taxed regions to affiliates in low tax havens. Our
exploration of the role of asset type (e.g. intangible assets) in facilitating these transactions reveals
that intercompany sales (related sales) and the associated income shifting is a factor only in firms
that invest in R&D.2 We document that 92% of the growth in foreign cash is concentrated in firms
1 Foley et al. (2007) are among the first to document that low foreign tax rates predict higher foreign cash levels. This result is from a panel data set regression. While they document the importance of foreign tax rates, they do not examine whether this is due to cross-section or time-series variation. Although Foley et al. (2007) and our paper both use BEA data, the empirical findings are quite different, most likely due to different sample periods and therefore tax regimes. Below we highlight the differences in the results and explain the source of the differences. 2 The R&D variable has different interpretations in the literature. The finding that R&D predicts greater total cash has been interpreted as proxying for investment opportunities and capital market frictions in the precautionary savings literature (He and Wintoki, 2016). The tax literature points to R&D and the associated intangible assets it creates as facilitating transfer pricing. Our results highlight the different role R&D plays in explaining domestic and foreign cash.
4
with both significant related sales and intangible assets. R&D investments facilitate related sales
to subsidiaries in countries with already low or declining foreign tax rates. The combination of all
three of these elements (intangible assets, transfer pricing, and low tax rates) is what explains most
of the rise of foreign cash.
The rest of this paper is organized as follows. Section 1 describes our data and empirical
strategy. Section 2 presents our results, while the channel of affiliated sales and transfer pricing is
explored in Section 3. The final section concludes.
I. Empirical Strategy and Data
A. Empirical Design
Our objective is to better understand the recent growth of firms’ cash balances. In
particular, we investigate the relative importance of tax motivations against alternative
explanations. To distinguish between these motivations for holding cash, we separately estimate a
model to explain a firm’s total, domestic, and foreign cash holdings. These results allow us to test
whether the motivations that drive firms to stockpile cash are the same for both domestic and
foreign cash.
To document the tax motivations for holding cash, we must measure the firm’s incentive
and the firm’s ability to earn income in low tax jurisdictions. Following Faulkender and Smith
(2016), we calculate the marginal tax rate a firm faces (the effective tax rate). The measure is a
weighted average of the marginal statutory tax rate based on the firm’s earnings before interest
and taxes (EBIT) in each country. The weights are the percentage of EBIT generated in each
affiliate in the corresponding fiscal year in the specified tax jurisdiction of that affiliate (e.g.,

5
subsidiary).3 Thus, if 50% of EBIT in 2006 was generated in the United States, 30% in the Irish
foreign affiliate, and the remaining 20% in the German affiliate, the estimated 2006 tax rate for
this firm is:
Firm,2006 US,2006 Ireland,2006 Germany,2006τ =50% τ +30% τ +20% τ (1)
The tax rates are the rate a firm pays on its last dollar of income in each country. For the
U.S., the marginal tax rate is 35% above $18.3M of income. The foreign tax rate schedules come
from the KPMG Corporate and Indirect Tax Survey (1998 to 2005) and Comtax (2006 to 2008).
This blended tax rate represents our estimate of the tax rate confronting firms prior to deducting
interest expense or incorporating interest income. As this weighted average rate declines, we would
expect the firm to hold more foreign cash because the realized deferral benefits are greater. Stated
differently, firms that generate the greatest amount of earnings in low tax jurisdictions are the ones
that would benefit most from deferring repatriation of those earnings and thus stockpiling the
earnings in cash and marketable securities. Finding a negative relationship between a firm’s
effective tax rate (ETR) and its cash holdings would provide evidence consistent with this
hypothesis.
We then estimate the total cash holdings of firms (as a percentage of their book assets) as
a function of the effective tax rate and standard determinants of cash.4 We control for firm size
(the natural log of sales); for whether the firm has a bond rating; and for its asset tangibility (the
ratio of PP&E to book assets), profitability (return on assets), R&D to sales, advertising to sales,
3 If EBIT is negative in a subsidiary, the weight is set to zero for that subsidiary. We combine all subsidiaries a firm has in a country into a single subsidiary for our analysis. 4 A related literature examines how the cash and marketable securities are invested. Duchin et al. (2017) find that some of the savings is held in risky and illiquid securities that may be a less valuable form of precautionary savings. When we measure cash, we include both cash and marketable securities.

6
market to book ratio, book leverage, and capital expenditure to assets.5 This data is from
Compustat. All measures are winsorized at the 1st and 99th percentiles.
While the tax rate measures a firm’s incentive regarding where to earn income, we also
need to determine which kinds of firms are best able to manage their operations in a way that
mitigates taxes and thus results in trapped foreign cash. Anecdotally, there is evidence that the
effect is particularly pronounced in firms with high levels of intellectual property. Since such firms
can move earnings from high tax to low tax jurisdictions using advantageous intracompany transfer
pricing (or profit shifting), we would expect significant sales from one subsidiary to another,
relative to external sales, to be indicative of this type of international tax planning. We construct a
measure (related sales) that is the percentage of the firm’s total revenue is derived from sales of its
foreign subsidiaries, either to the parent or to its other foreign subsidiaries. We hypothesize that
the tax effect should be greatest among those firms that are particularly adept at using related sales
to move income across various tax jurisdictions.6
B. Foreign Subsidiary Data
The challenge to our empirical approach is the lack of publicly available data regarding the
international operations of firms. The information disclosed in firms’ 10-Ks is entirely too coarse
to understand where firms are operating, the tax jurisdiction to which they are subject, and the
amount of cash and marketable securities they hold in these various locations. Fortunately, the
Bureau of Economic Analysis (BEA) conducts an annual survey of U.S. multinationals that
contains numerous balance sheet and income statement items for each foreign affiliate of a U.S.-
5 Precautionary savings traditionally has been interpreted as firms not distributing profits to investors (savings) to fund future potential investment. Young and high growth firms with access to the capital markets may also proactively raise capital to fund future investments and thus generate cash stockpiles (see Denis and McKeon, 2017). 6 The recent Tax Cuts and Jobs Act introduced a new Base Erosion and Anti-Abuse Tax, which is aimed at limiting MNC income shifting and is applied based on related sales.

7
based multinational firm, including the amount of cash held in each foreign subsidiary. The U.S.
multinationals are required by law to complete the survey.
The data comes from two BEA surveys: the benchmark surveys (BE-10) and annual
surveys (BE-11).7 Since we are interested in the cash allocations of firms as well as variation in
the foreign tax rates multinational firms confront, our firm-year observations are limited to the
years during which the necessary data was gathered. This annual data is available from 1998 to
2008. After 2008, foreign cash balances are no longer collected. Using this data, we are able to
measure the amount of cash and estimate the marketable securities held in their foreign
subsidiaries. The annual survey (BE-11) reports the amount of cash in each foreign subsidiary as
well as inventory and “other current assets.” To estimate the marketable securities that are
contained in other assets, we subtract an estimate of the subsidiary’s accounts receivable from
other assets, assuming the accounts receivable to sales ratio is the same across the firm. Our
estimate of the cash and marketable securities is thus:8
firmSubsidiary
firm
Accounts ReceivableCash+ Other current assets- SalesSales
(2)
This approach assumes the rest of “other current assets,” beyond accounts receivable, consists of
marketable securities.9 In the benchmark survey, cash and the various components of marketable
securities are separately reported.10 The difference between the total cash position of the firm and
7 The benchmark (BE-10) survey, conducted every five years (e.g. 1999 and 2004), has more comprehensive coverage of the accounting data for the smaller foreign subsidiaries than the annual (BE-11) survey, which is conducted in interim years. The BEA estimates these accounting items for the intervening four years between the comprehensive surveys. Our results are robust to restricting our sample to only the years in which the more comprehensive survey is conducted. 8 If this value is less than the reported cash value, we use the reported cash value. 9 When we replicated our results using only cash, opposed to our estimate of cash and marketable securities from equation (2), they remained essentially unchanged. 10 In the benchmark survey, our estimate of cash and marketable securities is cash plus other current receivables plus other current assets (which includes certificates of deposit) plus other equity investments (which includes the non-current portion of marketable securities, cash on deposit, CDs, and additional equity investments). In a small number of cases, our estimate of foreign cash is greater than total cash. In these cases, we define total cash as equal to foreign cash, and domestic cash as zero. Dropping these observations does not alter our main results.

8
the sum of the cash in its foreign affiliates is our estimate of the firm’s domestic cash position each
year.
C. Summary Statistics:
1. Location of Cash Holdings
With our data, we can document where the rise in cash is occurring. We examine geography
first. Although both domestic and foreign cash have risen, the rise in foreign cash has been much
greater. In Figure 2, we plot the cash held by purely domestic firms (non-MNCs), the domestic
cash held by U.S. MNCs, and the foreign cash held by U.S. MNCs. Consistent with Figure 1,
domestic cash held by both MNCs and non-MNCs displays growth faster than the economy, but
not by a huge margin. Cash held by non-MNCs has risen by 80% over our sample period, and
domestic cash held by MNCs has grown by 90%. GDP has grown by 30% over the same period.
The rise in foreign cash has been much more dramatic. It grew by 440%. Fifty-seven percent of
the rise in total cash and 85% of the rise in the cash held by MNCs is due to the rise in foreign
cash.
Not only has foreign cash grown, but the countries in which foreign cash is held have
changed as well. Using the BEA data, we can identify the specific countries where the foreign cash
is held. In Table 1, we rank countries by their cash holdings. We report the percentage of total
foreign cash held and the percent of total foreign sales originating in each country, for the top
fifteen countries. The percent of cash and sales in the remaining countries is also reported. The
data for 1998 (the first year of our sample) is reported in the left hand columns and for 2008 (the
last year of our sample) in the right hand columns.
Firms do earn income and thus hold cash in a country for strictly economic reasons (e.g.,
the country is where the business and investments are located) rather than solely for active tax

9
minimization. Among the countries with high cash balances in 1998, we see several large
economies (e.g., the United Kingdom, Germany, France, Canada, and Japan). The fraction of
foreign cash and the fraction of foreign sales are relatively similar across countries in 1998. For
example, subsidiaries located in the United Kingdom held 14.6% of total foreign cash (the highest
fraction) and generated 14.8% of all foreign sales in 1998. Subsidiaries in the top six countries,
sorted by foreign cash, held 52% of the foreign cash and generated 42% of the foreign sales (see
Table 1).
Firms may also hold cash in foreign countries because their tax rates are low and thus
repatriation is costly. Although we don’t see strong evidence of this at the beginning of our sample,
this effect is apparent by the end of our sample. By 2008, only one large economy, the United
Kingdom, remains in the top six. The other five countries (Ireland, Bermuda, the Netherlands,
Belgium, and Luxembourg) are smaller economies with top corporate tax rates well below the U.S.
tax rate.11 It is also apparent that the correlation between sales and cash had weakened by 2008.
Although these countries are the location of most of the foreign cash (subsidiaries in the top six
countries now hold 55% of the cash), they generate only 25% of the foreign sales (see Table 1).
Some of the countries are particularly noteworthy. Irish subsidiaries hold 13.1% of the cash, but
generate only 4.0% of the sales in 2008; subsidiaries in Luxembourg hold 5.5% of the cash, but
generate only 0.5% of foreign sales in 2008.
Part of the shift between 1998 and 2008 was caused by firms increasing their stockpile of
cash in countries that had low tax rates even in 1998 (i.e. the percentage of cash held in Bermuda
doubles over our sample period). Foreign tax rates also fell relative to U.S. rates. The average top
11 The corporate tax rates we use in our analysis are marginal statutory corporate tax rates that subsidiaries would face on their next dollar of income. If firms have negotiated (face) lower tax rates due to tax holidays, then we will underestimate the incentive to move income to such low tax jurisdictions. We return to this issue in Section III-C.

10
corporate tax rate across the fifteen countries with the most cash in 1998 (see Table 1) dropped
from 38.7% to 29.0% between 1998 and 2008 (see Figure 3). The drop in tax rates among the six
countries with the most cash drops is even greater (38.3% to 15.7%) due to the shift of cash to low
tax jurisdictions (see Table 1). During this period, the U.S. corporate tax rate did not change. The
decline in foreign tax rates is significant. For example, between 1998 and 2008, the effective tax
rate dropped from 32% to 12.5% in Ireland, from 35% to 24.3% in the Netherlands, and even
Germany’s tax rate dropped from 56.6% to 30.9% (see Table 1).12 Below we show that the growing
difference between U.S. tax rates and foreign tax rates is an important factor in the growth of
corporate cash.
2. Firm Characteristics: MNC and non-MNC
Since most of the increase in cash is among MNCs, it is first necessary to understand how
MNCs differ from other firms. These differences may help us understand the motivations behind
firms’ cash holdings and the reasons that contributed to the rise in cash balances.13 Total cash to
assets is approximately the same in the full sample and the MNC subsample (22.5% versus 21.1%,
see Table 2). The MNCs have significantly higher foreign cash (8.9% versus 1.5% in the full
sample) and less domestic cash, with MNCs holding 42% of their cash abroad.14 Since MNCs are
larger, the fraction of cash held abroad is even larger when we look at total cash (weighting each
dollar equally opposed to each firm). In this case, 64% of the MNC’s cash is held abroad. This
12 The tax rates are taken from the OECD web site (stats.oecd.org) and we use the top corporate tax rate. 13 Pinkowitz, Stulz, and Williamson (2016) compare the cash holdings of U.S. and foreign MNCs to determine if firm characteristics or country characteristics explain differences in cash holdings across countries. They also present evidence that non-R&D firms and R&D firms are not comparable in terms of how much cash they hold. They show that U.S. MNCs and foreign MNCs hold similar amounts of cash once the high R&D U.S. MNCs are excluded. 14 The magnitudes of cash holdings in our sample and in Foley et al. (2007) are quite different. In our sample, the total cash to net asset ratio is higher by a factor of almost four (22.5% in Table 2 versus 5.7% in their Table 1) and the average foreign cash to net asset ratio of MNCs is larger by a factor of nine (8.9% in our Table 2 versus 0.7% mean, 1.0% median in their sample). The dependent variable in their paper is the natural log of cash to assets (or foreign cash to assets). Thus, to make the numbers comparable we took the exponent of their mean or median (e.g. exp(-2.8687=5.7%).

11
ratio rises from 54% to 74% over our sample period. Foreign cash holdings are concentrated in a
subset of MNCs, an issue we will explore below.
Multinational and domestic firms differ by more than size. Compared to domestic firms,
firms with foreign operations are more profitable, more likely to pay dividends, and more likely to
have access to the bond market (e.g., a bond rating), while also having less volatile cash flows.
These firm characteristics are normally associated with greater capital market access, not less.
MNCs invest less in capital expenditures and R&D. The average MNC does not appear to be a
capital-constrained firm, yet these firms are responsible for a majority of the rise in cash.
Foreign cash is not uniformly distributed across industries in our sample. Our sample
includes firms from 62 2-digit SIC industries. Within this sample, 86% of cash is held by firms in
only nine industries; 70% is held by firms in only five industries (see Supplementary Table 1).
These industries also have high foreign income, but cash is more asymmetrically distributed than
income. The top nine industries sorted by foreign cash generate 32% of their income abroad,
compared to 13% for the rest of the sample. In Table 2, we found that MNCs actually have lower
R&D and lower market to book ratios, whereas the firms with large foreign cash holdings are often
described as investing in mainly intangible assets. We see evidence of intangible assets when we
look at the industries that have the most foreign cash (see Supplementary Table 1). The industry
names are not obvious at first since the 2-digit industries are quite broad. However, subsectors of
each of the top industries are ones commonly associated with intangible assets. The top industries
include: Chemical and Allied products (pharmaceuticals), Industrial Machinery and Equipment
(computer hardware), Business services (computer software), and Food & Kindred products
(beverages). In Section III, we will discuss how intangible assets contribute to the rise in corporate
cash.

12
II. Determinants of Cash Levels: By Location
A. Precautionary Motives
To understand the motivations for holding cash, we first regress total cash and marketable
securities on firm characteristics that, in the prior literature, have been shown to explain the cash
position of firms. As we investigate the determinants of firms’ cash holdings, we will examine
variation across firms with and without foreign operations. Among the firms with foreign
operations, we can examine the determinants of their domestic and foreign cash holdings. This
allows us to compare our results to prior work and highlight where the results are similar and where
they differ. Consistent with prior work such as Bates, Kahle, and Stulz (2009), we find evidence
of a precautionary motive for stockpiling cash when looking at the total cash held by a firm. Firms
which should have greater access to the capital markets (are larger, have a bond rating, have greater
asset tangibility [higher PPE/book assets and lower market to book ratio]) as well as those that
invest less and/or return more capital to investors (lower R&D, lower capital expenditure, and pay
higher dividends) hold less cash. Traditionally, these results have been interpreted as consistent
with the precautionary savings motivation because these firms are less likely to be capital rationed
and thus benefit less from stockpiling cash. The results are broadly consistent whether we examine
all firms (see Table 3, column I) or only multinational firms (firms with foreign profits: see Table
3, column II).15
15 The standard errors are clustered by firm. We also estimate White standard errors, standard errors clustered by year, and standard errors clustered by firm and year (Petersen, 2009). Consistent with a firm effect, the T-statistics fall (the standard errors rise) when we cluster by firm relative to White standard errors. For example, the T-statistic on R&D falls from 73.6 to 43.6 and the T-statistic on the effective tax rate falls from 18.5 to 9.9 (column I). Clustering by year produces T-statistics that are slightly larger than when we cluster by firm and smaller than when we use White standard errors (e.g. the T-statistic on the effective tax rate is 11.7 when standard errors are clustered by year). Clustering by both firm and year produces T-statistics that are slightly smaller than clustering by only firm. The largest change occurs for the effective tax rate, where the T-statistic falls from 9.9 to 8.3. This pattern of results is consistent across the following tables.

13
Having established that the results are consistent with the prior literature that examined
total cash holdings (e.g. Compustat data), we can now explore whether the determinants of cash
holdings are the same for domestic and foreign cash. In the remaining columns of Table 3, we run
the regressions for domestic and foreign cash separately. The first thing to note is that many of the
variables that are related to precautionary motives are relevant only for explaining domestic cash.
The precautionary savings motivations are a significant determinant of the observed variation in
the domestic cash of firms whether we look at all firms (Table 3, column III) or only multinational
firms (column IV). Firms that are larger, have greater asset tangibility (PPE/book assets), pay
dividends, conduct less R&D, have lower market to book ratios, have lower capital expenditure,
and have higher leverage ratios all hold less domestic cash.16 The economic effects are large as
well. For example, increasing R&D by one standard deviation (0.597 from Table 2, full sample)
leads to an 8.1 percentage point increase in cash to assets (0.136 * 0.597 = 0.081) for all firms
(Table 3, column III). This ratio is large compared to the average domestic cash to asset ratio of
21% (Table 2). These results are consistent with the types of firms most likely to be constrained
holding more domestic cash in order to mitigate potential underinvestment that may result from
such rationing.
The precautionary savings variables, which are key to explaining the level of domestic
cash, have little predictive power in explaining foreign cash positions (see Table 3, column V).
The coefficients either shrink, lose statistical significance, or flip signs (e.g. firm size). Firms with
more tangible assets (PPE/Assets) hold statistically significantly less foreign cash, although the
coefficient is 62% smaller. Growth proxies (the R&D-to-sales ratio and the market to book ratio)
have small estimated coefficients that are no longer statistically significant (even though the
16 If we do not include the firm’s leverage, the results are even stronger (e.g., the coefficients are larger in magnitude).

14
standard errors are the same or smaller). In addition, the coefficients on variables explaining capital
rationing—such as whether the firm pays dividends and the level of leverage—have shrunk in
magnitude and are no longer statistically significant. In sum, the precautionary motives are an
important determinant of a firm’s domestic cash holdings (whether a firm is MNC or not), but not
of its foreign cash.17 This is not to say that foreign cash cannot provide precautionary savings.
Multinationals, such as Apple, have borrowed with the market knowing they hold foreign cash
(Lattman and Eavis, 2013 and Worstall 2015). However, foreign cash is not viewed as a source of
cheaply accessible savings due to the tax cost of repatriation, and precautionary cash needs do not
explain the observed growth in corporate foreign cash.18
As a caveat, these variables are measured at the firm level. In many cases, this is because
they measure the firm’s access to the capital market (e.g. firm size, asset tangibility, and the
existence of a bond rating). However, the investment intensity of the subsidiary may differ from
that of the entire firm. To test if the firm-level variables are such noisy measures that they drive
the precautionary savings variable to zero, we rerun the regression only using observations where
the foreign income is above the median (see Table 3, column VI). For these observations, the firm-
17 In addition to the variables used by the prior literature and which we include in Table 3, there are other ways to measure precautionary savings motives (e.g., credit rationing or investment risk). In Supplementary Table 3, we have included three additional measures. We included the fraction of the prior three years during which the firm's internal cash flow (EBITDA – taxes – capital expenditure) was insufficient to finance their investment (Faulkender and Petersen, 2007); the standard deviation of cash flow for the firm for the preceding five years; and product market fluidity, a forward looking measure of produce market risk (Hoberg, Phillips, and Prabhala, 2014). In each case, firms that are more constrained by the capital markets or face greater investment uncertainty, hold more domestic cash. The first two variables imply an increase in foreign cash as well, although the magnitude is much smaller and only statistically significant in the case of the first variable. Greater product market fluidity actually leads to a statistically significant decline in foreign cash, but the magnitude is tiny. These additional controls, however, do not change the coefficient on the effective tax rate that we discuss in the next section. No matter how we control for precautionary motives, lower foreign tax rates lead to significantly larger foreign cash balances (compare Table 3, column V to Supplementary Table 3). 18 Firms with more foreign cash do not increase their domestic liabilities to access this cash (De Simone and Lester, 2017), but they do tend to make greater foreign acquisitions which are value destroying (Hanlon, Lester, and Verdi, 2015). They also increased their foreign cash more rapidly when a repatriation holiday became more likely (De Simone, Piotroski, and Tomy, 2017). These facts are all consistent with foreign cash being a poor source of precautionary savings; that is what we show.

15
level variables are more closely associated with the subsidiary-level variables. The explanatory
power of the precautionary saving variables does not improve, and in two cases, it shrinks.19
B. Foreign Tax Effects
Firms with lower effective tax rates hold more cash in total, but this effect is due entirely
to the foreign cash of MNCs. While we see lower effective tax rates raise foreign cash levels, there
is no reduction in domestic cash of MNCs as the effective tax rate falls (see Table 3, column IV).
The coefficient estimate in column V implies that lowering the effective tax rate from 35% to 30%
(approximately the standard deviation from Table 2) will increase the cash to assets ratio by 3.8
percentage points. This is an increase of 42% relative to the mean (3.8/8.9). Foley et al. (2007)
also find a statistically significant relationship between the cost of repatriating and the level of
foreign cash (see their Table 5, column 1). A one standard deviation rise in the cost of repatriation
(lower foreign tax rates) increases the foreign cash to asset ratio by 12% (see Foley et al. (2007),
page 595). The magnitude of the effect we document is 3.5x larger, and it increases even further
when we look at the actual change in the foreign cash to assets ratios. In their results, this ratio
rises by 0.1% (i.e. 10 basis points from 0.71% to 0.81%); our regressions imply an increase of
4.1%, or 41x larger (See Appendix I for a comparison of the tax variables used in our paper and
Foley and the calculation of the magnitude of the effects).
Why would the sensitivity of foreign cash to foreign tax rates be so much higher in our
sample? We think the answer is the different sample periods. Foley et al. (2007) use the BEA
benchmark surveys from 1982, 1989, 1994, and 1999 to measure foreign cash. We create an annual
19 The capital expenditure variable is no longer statistically significant and the coefficient PPE/assets shrinks by an additional 63%. We do observe PPE/assets, sales, and R&D at the subsidiary level. We return to this issue in Section IV, but the conclusion that precautionary savings does not drive foreign cash is unchanged.

16
panel using both the BEA’s benchmark survey and the annual surveys, spanning 1998 to 2008.20
The two sample periods have little overlap. At the beginning of our sample and during the Foley
sample, the average foreign tax rate and the U.S. corporate tax rate are very similar (see Figure 3
and Figure 4-C in Graham and Leary (2017)). However, during the course of our sample period,
average foreign tax rates fall significantly. When average foreign tax rates are equal to U.S. tax
rates, the tax benefits for shifting income to foreign subsidiaries are minimal, and thus less cash is
trapped abroad. Over time, as foreign tax rates have come down, the incentive to move income
abroad has increased. Figure 2 shows that during this period when U.S. and foreign corporate tax
rates diverged, foreign cash grew much faster.
Moreover, the enactment of the “check-the-box” regulation facilitated the ability of firms
to shift income overseas. This occurred in 1997, near the end of the Foley sample and just before
the beginning of ours. The U.S. Treasury enacted “check-the-box” (CTB) regulations to simplify
tax policy by allowing firms to self-identify subsidiaries for tax purposes (Albertus, 2016). What
followed was the proliferation of hybrid entities where a subsidiary could be considered a
“disregarded entity” by U.S. tax laws but be treated as a corporation in the foreign jurisdiction.
Normally, financial payments between a parent firm and its foreign subsidiary would have tax
implications, as the U.S. tax code does not defer taxation of “passive income” or “Subpart F
20 In the annual surveys, we must estimate marketable securities by subtracting an estimate of accounts receivable from other current assets (see equation 2). Total foreign cash is higher in the benchmark years (1990 and 2004) relative to surrounding years (see Figure 2). One interpretation is that we are under-estimating the level of foreign cash because we are subtracting off too high a number for accounts receivable. The benchmark survey also includes long-term marketable securities that may also account for the higher values in these years. The time dummies in the regression will absorb this effect if it effects all firms the same. To verify that our estimation approach does not change our results, we re-estimated the regressions in Table 3 using only the benchmark years of 1999 and 2004 (see Supplementary Table 2). Although the sample size shrinks and we thus lose some statistical significance, the basic results change very little. The coefficient on the effective tax rate shrinks from -0.752 to -0.663 and the t-statistic is still greater than 7.2 (column V). The coefficients on the precautionary savings variables are similar in most cases. An exception is the coefficient on capital expenditure that is no longer statistically significant in the MNC regressions (column V).

17
income.” Check-the-box regulations allowed firms to treat such payments as internal transfers and
not subject to U.S. taxation, encouraging the creation of these overseas hybrid entities. CTB was
enacted in January of 1997 but was quickly considered for repeal. In April 1998, the repeal idea
was dropped by the Senate Finance Committee and the regulation was perceived as enduring
(Drawbaugh and Sullivan, 2013). Blouin and Krull (2014) document a growth of subsidiaries in
tax haven countries and a growth of intercompany transfers following passage of CTB
regulations.21 Together, the incentive and ability to transfer price has made the role of foreign taxes
significantly more important over time.
C. Explaining the Rise in Corporate Cash: Precautionary Savings and Tax
Effects
Our regression results are based on a panel data set, and so the coefficients are estimated
from both cross-sectional and time-series variation. Firms with poorer access to capital markets
may hold more cash (cross-sectional variation) or, as firm’s access to the capital markets improves
(e.g. they get larger or investment risks declines), they may hold less cash (time-series variation).
We can use our coefficient estimates and the change in the independent variables to document how
much of the change in the cash to assets ratio over our sample is due to changes in the precautionary
and tax motivations. The average domestic cash to assets ratio rises by 0.7 percentage points over
our sample period (Table 3, column III). The change in the precautionary savings variables
(everything except the tax rates) implies a decline of 1.5 percentage points. The declining tax rate
has no effect on domestic cash. The time dummies, which pick up intertemporal changes in
21 In their Figure 1, Blouin and Krull (2014) show that the average number of subsidiaries in tax haven rose from 2 in 1983 to 3 in 1998. It then rises to five by 2008. Klassen and Laplante (2012) find that firms more actively shift income out of the U.S. as the regulatory costs fall and firms learn.

18
domestic cash that is uncorrelated with the independent variables, imply an increase of 2.3%. Thus,
the precautionary savings variables do not explain the rise in domestic cash.
The foreign cash to assets ratio of MNCs rises from 6.8 to 12.0 percentage points, an
increase of 5.2 percentage point (Table 3, column V). This increase is explained almost entirely
by the drop in the effective tax rate. The decline in the effective tax rate implies an increase in the
foreign cash to asset ratio of 4.1 percentage points. The time dummies imply an increase of only
0.4 percentage points.
III. Income Shifting and Intangible Assets: The Mechanism behind Cash Accumulation?
A. Transfer Pricing as the Mechanism
The academic literature has focused on precautionary savings and tax motives to explain
variation in the amount of cash held by firms. We show both that the rise in cash is concentrated
in cash held abroad and, although the precautionary savings variables are useful in explaining
cross-sectional variation in domestic cash holdings, they do not explain the rise in foreign cash
(Table 3, column V). The rise in (foreign) cash is driven by the reduction in the effective tax rates
(weighted average of foreign and U.S. tax rates). Holding cash abroad may reduce financial
flexibility (domestic cash generally is a better store of precautionary savings), but it can have
significant tax benefits. If firms are able to lower their corporate income tax by earning income in
a low tax foreign subsidiary, do all firms do this, and if not, why? To answer this question
empirically, we examine which firms choose to build up foreign cash stockpiles and demonstrate
how such firms actively minimize taxes.
Transfer pricing – how within-firm sales are priced – may be an important element in the
movement of earnings to low tax jurisdiction subsidiaries (Grubert and Mutti, 1991). A firm cannot

19
simply drop cash into low tax jurisdictions, but it may relocate cash flow generating assets into
lower taxed subsidiaries. Starbucks, for example, was investigated by European Commission
regulators for whether “Dutch authorities allowed Starbucks to use unfair methods to shrink its
taxable income, including paying a royalty to a partnership in Britain, Alki, for a recipe for coffee-
roasting” (Kanter, 2014). Underpinning transfer pricing is the nature of the intellectual property of
the firm. Not only is it easier to transfer intellectual property to low tax jurisdictions than to transfer
physical capital, it is also easier to avoid charges of tax avoidance when income arises from more
difficult to value assets such as patents and technology (Grubert, 2003; Levin and McCain, 2013,
De Simone, Huang, and Krull, 2017, Guvenen et al., 2018). Thus, firms with more unique assets
have greater ability to lower their effective tax rates by transferring income to low tax jurisdictions.
Although this is a plausible channel that could explain the rise in foreign cash, what is missing is
empirical evidence making the connection.22
B. Empirical Role of Related Sales
To empirically document the role of transfer pricing in the rise of foreign cash, we first
calculate the portion of a firm’s sales that it deems “related” or “affiliated” (related sales). In the
BEA data, firms report the subsidiary’s revenue arising from sales to the other subsidiaries of the
firm or to its parent. We sum the related sales across all foreign subsidiaries of the firms and
express this amount as a percentage of the firm’s total revenue. We hypothesize that, if transfer
pricing is a mechanism that facilitates the movement of earnings to low tax jurisdictions, then the
firms that have high levels of related sales and low effective tax rates are the ones that will end up
with the most cash abroad. The analysis is presented in Table 4.
22 Foley et al. (2007) suggest the transfer pricing channel could be important in explaining the rise in cash, but their paper notes a lack of empirical documentation citing only anecdotal evidence. “Anecdotal evidence suggests that technology-intensive firms can shift income to low tax jurisdictions more easily than other types of firms…”
20
As with the lower effective tax rate, higher related sales do not increase domestic cash (see
Table 4, column I). Both the effective tax rate and related sales are important determinants of
foreign cash holdings of MNCs. The coefficient on the effective tax rate is negative, the coefficient
on related party sales is positive, and both are statistically different from zero (Table 4, column II,
p-value <0.001). The coefficient on the cross product (tax rate multiplied by related sales) is
negative but not statistically different from zero. While low tax rates themselves are important in
explaining large foreign cash positions, this effect is enhanced by low tax-rate firms’ abilities to
move income around within the firm. A firm’s tax rate is low only in some (or all) of its foreign
subsidiaries. Thus, firms that have greater ability to move income to low tax jurisdictions (through
related party sales) have the greatest opportunity to lower their taxes and are the ones with the
greatest foreign cash balances. Over our sample period, related sales have grown significantly,
consistent with their role in the rise of foreign cash. The average of the ratio of related sales
originating from all the subsidiaries in a given country divided by the GDP of the country is
graphed in Figure 4-Panel A. Related sales start to grow faster than the country’s economy
beginning in 1999 (the second year or our sample). This corresponds to timing of check-the-box
regulation, which facilitated income shifting. If we divide the sample into countries that are
classified as tax havens and those that are not, the growth in related sales (relative to the economy)
is concentrated in the tax haven countries (see Figure 4-Panel B).
C. Empirical Role of Intangible Assets
These results still do not explain why not all firms are engaging in such related party sales
to lower their corporate income tax liability. There must be some restriction on firms’ ability to
place subsidiaries in low tax jurisdictions and/or use related party sales to lower taxes. As noted
above, intangible assets are easier to reallocate to low tax jurisdiction countries than are economic
21
values arising from physical capital (e.g., manufacturing, mining, timber, etc., see De Simone,
Mills, and Stomberg (2017). To further explore this channel, we divide the sample into those firms
engaged in significant intellectual property development, as measured by disclosing material
amounts of R&D spending (non-zero and non-missing) and those firms without material R&D
spending (see Table 4, columns III and IV).
Related party sales do not affect foreign cash holdings of firms without significant R&D
expenditure. Among firms with no R&D expenditure, lower tax rates do lead to higher foreign
cash balances, but related sales have no effect (the coefficient is positive but small and statistically
indistinguishable from zero). The effect of related sales on foreign cash holdings appears only
among firms with R&D expenditures (column IV). When related sales are zero, the effect of taxes
on foreign cash holdings is very similar for firms with and without R&D (compare the coefficient
on the effective tax rate in columns III and IV). Not only do increases in related sales increase
foreign cash holdings directly for firms with R&D expenditure, but they also increase the effect of
lower foreign taxes on foreign cash holdings (the coefficient on the cross product is negative,
economically large, and statistically significant).23 For example, lowering the effective tax rate
from 35% to 30% and increasing related sales by 22.5% (the interquartile range) increases the cash
to net book assets by 7.4 percentage points.24 This is large relative to the mean and standard
deviation of foreign cash from Table 2 (8.9% and 14.7%).25
23 When we estimate these regressions using only the two benchmark years, the results for the set of firms with R&D are similar (see Supplementary Table 4, column IV). The coefficient on the effective tax rate shrinks but is still statistically significant. Both the related sales and cross product coefficients increase and are statistically significant. 24 For the MNCs with zero R&D (column III), lowering the tax rate from 35% to 30% raises the foreign cash to net book asset ratio by only 2.0 percentage points. 25 R&D expenditures have no direct effect on foreign cash. The coefficient on R&D is zero. In our results, R&D expenditure has a binary effect. It measures a firm’s ability to use transfer pricing. This is very different from the findings of Foley et al. (2007). They find a positive and statistically significant effect of R&D on foreign cash that is almost as big as the coefficient in the domestic cash regression (see their Table 5 and 6). This is what we would expect when foreign tax rates do not differ significantly from U.S. rates. In this case, foreign cash and domestic cash are equally valuable stores of precautionary savings. When foreign tax rates fall significantly below U.S. rates, however,

22
Using the coefficient estimates, we can measure how much of the rise in the foreign cash
to asset ratio over our sample period is due to precautionary savings versus tax effects. For firms
with positive R&D (Table 4 – column IV), the foreign cash asset ratio rises by 6.9 percentage
points or 87% (from 7.9 to 14.8%). A majority of the rise is due to changes in the tax variables.
The effective tax rates falls from 35 to 29% and related sales rises from 12 to 20%, and this leads
to a 4.6 percentage point increase in foreign cash to assets. Changes in precautionary savings lead
to a 0.6 percentage point increase. The remaining rise is absorbed by the time dummies.
As we saw in Figure 2, the rise in foreign cash of MNCs has been much greater than the
rise of domestic cash (in either domestic firms or MNCs). Our empirical results document the role
of intellectual property and transfer pricing in moving earnings from high tax jurisdictions to low
tax jurisdictions, resulting in significant amounts of trapped cash. To see their role, we graph total
foreign cash held by MNCs that report positive R&D and positive related sales versus all other
MNCs in Figure 5.26 It is clear that the dramatic growth in foreign cash has been concentrated in
the firms who can and do use transfer pricing to move income to low tax jurisdictions. This is true
if we examine total foreign cash (Figure 5 – Panel A) or the foreign cash to asset ratio (see Figure
5 – Panel B). Over our sample period, there has been very little increase in the foreign cash held
by firms that do not have positive R&D and nontrivial related sales. In fact, 92% of the increase
in foreign cash that we observed in Figure 2 occurs in firms that have both positive R&D and
positive related sales. As the rise in cash is concentrated in foreign cash and the rise in foreign cash
is concentrated in a subset of firms, we need to focus on these firms.27
the value of foreign cash as a source of precautionary savings declines. This is why we find a zero coefficient on R&D expenditure and instead R&D denotes the ability to use transfer pricing during our sample period. 26 We also graph total cash for MNCS with positive versus zero R&D in Supplementary Figure 1 and for MNCs with positive versus zero related sales in Supplementary Figure 2. 27 We can also split the sample based on measures of precautionary savings to see if the rise in foreign cash is more pronounced in firms with stronger precautionary demand for cash. When we split the sample based on firms’ market fluidity (see Supplementary Table 3), we see no difference in the rise in foreign cash. MNCs with above median value
23
While the statutory corporate tax rate measures the marginal tax rate specified in the tax
code, it may not fully capture the marginal tax rates that firms actually face on their foreign income.
For example, the country of Luxembourg was known to write firm-specific special agreements
that dramatically reduced the tax rate – often to near zero (Bowers, 2014; Karnitschnig and Van
Dallen, 2014). To determine how important this is to our results, we replaced our effective tax rate
variable with a dummy variable that is equal to one for firm-years in which the firm has at least
one subsidiary in a tax haven country (see Dyreng and Lindsey, 2009).28 The tax haven variable
has the potential advantage of picking up variation in the marginal tax rate not captured by the
statutory rate, while the effective tax rate variable has the potential to capture tax rate changes
across firms and over time.
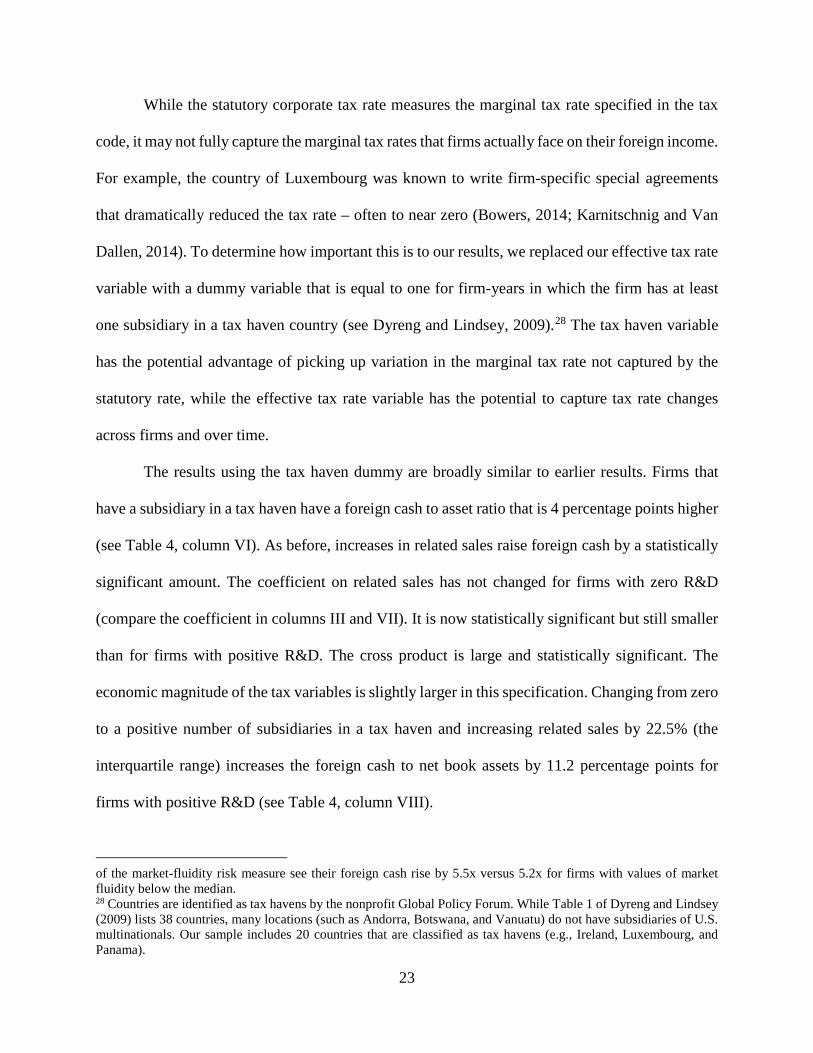
The results using the tax haven dummy are broadly similar to earlier results. Firms that
have a subsidiary in a tax haven have a foreign cash to asset ratio that is 4 percentage points higher
(see Table 4, column VI). As before, increases in related sales raise foreign cash by a statistically
significant amount. The coefficient on related sales has not changed for firms with zero R&D
(compare the coefficient in columns III and VII). It is now statistically significant but still smaller
than for firms with positive R&D. The cross product is large and statistically significant. The
economic magnitude of the tax variables is slightly larger in this specification. Changing from zero
to a positive number of subsidiaries in a tax haven and increasing related sales by 22.5% (the
interquartile range) increases the foreign cash to net book assets by 11.2 percentage points for
firms with positive R&D (see Table 4, column VIII).
of the market-fluidity risk measure see their foreign cash rise by 5.5x versus 5.2x for firms with values of market fluidity below the median. 28 Countries are identified as tax havens by the nonprofit Global Policy Forum. While Table 1 of Dyreng and Lindsey (2009) lists 38 countries, many locations (such as Andorra, Botswana, and Vanuatu) do not have subsidiaries of U.S. multinationals. Our sample includes 20 countries that are classified as tax havens (e.g., Ireland, Luxembourg, and Panama).

24
Foley et al. (2007) also examine the joint effect of R&D and foreign taxes on firms’ foreign
cash holdings, but their results are very different. They regress the log of the foreign cash to assets
ratio on the foreign tax rate (country tax) and the foreign tax rate interacted with the R&D to assets
ratio (see their Table 8, column 3). The coefficient on the country tax rate is negative. The lower
the foreign tax rate, the more foreign cash in the subsidiary. This makes sense, but this coefficient
measures the effect of the foreign tax rate for firms whose R&D expenditures are zero. The
interaction coefficient is positive and large. Thus for firms that invest in R&D, the coefficient on
the foreign tax rate turns positive.29 That implies that for high R&D firms, where transfer pricing
opportunities should be the largest, foreign cash actually declines as tax rates decline. This does
not make sense. These results may arise due to the small difference in foreign and U.S. tax rates
during their sample period and not controlling for related sales.
D. Changes in Cash
The regressions run thus far have been in levels. The regressions are specified this way, in
part, since the precautionary savings explanation is a story about levels. Firms with more limited
access to the capital markets, and which face greater investment risk, maintain a higher average
level of cash. The tax explanation is a story about both levels and changes. First, as tax rates have
fallen in many foreign countries relative to the United States (see Figure 3), the incentive to earn
income in foreign subsidiaries has risen as well; as a result, cash builds up in the firm’s foreign
subsidiaries (Dobridge and Landefeld, 2017). This is a story about the level of foreign cash.
However, even if the difference between U.S. and foreign tax rates does not change, the level of
foreign cash may still rise. When the foreign tax rate is less than the U.S. tax rate, firms have an
29 The coefficient on foreign taxes is positive in column 3 for firms with an R&D/Asset ratio above 0.0243 (19.3482*0.0243 - 0.4709= 0). The mean R&D/Asset ratio is 0.0262, the median is zero, and the standard deviation is 0.0538.

25
incentive to earn income in low tax foreign jurisdictions each and every year and thus add to their
stockpile of foreign cash, even if tax rates do not change.
As a test of this alternative specification, we reran the regression from column IV using the
change in foreign cash divided by assets as the dependent variable (see Table 4, column IX).
Although the coefficients appear to be smaller, the implications are the same. MNCs that face
lower foreign tax rates and have higher related sales accumulate foreign cash at a faster rate, and
the two coefficients are statistically significant (the cross product is not). Lowering the effective
tax rate from 35% to 30% and increasing related sales by 22.5% (the interquartile range) increases
the dependent variable by 0.8 percentage points. This is smaller than the 7.4 percentage point
increase we found in column IV, but the magnitudes are not directly comparable. This change is
the increase in foreign cash that would occur each year over our 11-year sample period in response
to the lower tax rate and the higher related sales.30
E. Sources: The Role of Income Shifting
The rise in foreign cash that we document arises from three broad factors: the growth of
international business activity, the decline in foreign tax rates, and the ability of firms to shift their
income into low tax jurisdictions. As firms grow larger, they hold more cash. This fact can explain
a portion of the rise in foreign cash we see in Figure 2 and Figure 5-A. However, even after
standardizing by size (divide foreign cash by assets), we still see a rise in cash (Figure 5-B). In the
regressions, we directly control for the growth of firms two ways. First, we scale cash by assets,
so the rise in foreign cash we document is above and beyond the growth in assets. Secondly, we
include the natural log of sales as an explanatory variable. The coefficient on sales is of mixed sign
30 We also ran the change in domestic cash regressions. The coefficient on the precautionary savings variables are smaller in magnitude and less statistically significant. This is consistent with the precautionary story explaining levels, not changes.

26
and explains very little of the change in foreign cash over time even when the coefficient is
positive. We return to the question of how much of the rise in foreign cash is due to the faster
growth of foreign operations in Section IV.
As foreign tax rates have fallen over our sample period, the cost of repatriation has risen.
As the regressions show, this has led to a rise in foreign cash. This is a passive response; cash will
rise even if income is not shifted. However, as the foreign tax rate falls below the U.S. rate, the
incentive to shift income into low tax jurisdictions increases. The fact that most of the increase in
foreign cash is in firms with positive R&D and related sales is evidence of income shifting, but we
can look at this question more directly. The effective tax rate has fallen over our sample period in
part because of the decline in foreign tax rates. It has also declined because firms are earning an
increasing portion of their income outside the United States. The mean fraction of income earned
abroad has risen 38% to 53% over our sample period (see Figure 6).
To understand the importance of each of these sources of variation, we bifurcate the
effective tax rate variable into its two components: the foreign tax rates and the fraction of the
firm’s income (EBIT) that is earned in foreign jurisdictions. Decreasing the foreign tax rate (the
average tax rate the firm faces on income across its foreign subsidiaries) increases the amount of
foreign cash which MNCs hold, but has no statistically significant effect on domestic cash (see
Table 5). We also see that income is sticky; cash tends to be held where it is earned. The more
income that is earned in the United States, the more domestic cash the firm has (Table 5, column
I). The more income earned in foreign subsidiaries, the more foreign cash the firm holds (column
II). Foreign income is significantly stickier than domestic income; the coefficient on U.S. income
is almost three times larger in the foreign cash regressions (0.042 versus -0.129). This difference

27
is evidence of the asymmetry introduced by the tax code. The increase in foreign cash appears to
be due to both the reduction in foreign tax rates and the movement of income abroad.
Declines in the effective tax rate, combined with the growth of related sales, explain most
of the increase in foreign cash (see Table 4). We know that the effective tax rate falls over time
due to a decline in the foreign tax rates and a shifting of income across foreign jurisdictions. We
can show the role of related sales by graphing the average effective tax rate over our sample for
firms with positive related sales versus other MNCs (see Figure 7). There are several things to
note. The average effective tax rate in the two samples is the same (and equal to 35%) in 1998.
Prior to divergence in foreign tax rates and the effect of CTB, the two groups look the same. Over
the next decade, as foreign tax rates have fallen, the effective tax rates of both sets of firms have
fallen. However, the effective tax rates have fallen faster for the firms with positive related sales:
a drop of 6.9 percentage points for firms with related sales (solid line) versus 3.2 for firms with no
related sales (dotted line). To document how much of the fall in the effective tax rates is from
lower foreign tax rates versus profits moving to low tax jurisdictions, we calculated a static version
of our effective tax rate variable. Instead of the weights (the fraction of income earned in each
subsidiary and the U.S., see equation 1) changing each year, we fixed the weights at the 1998
values (or the first year the firm enters the sample). Thus changes in the static effective tax rate
measure only changes in foreign tax rates in countries where the subsidiaries were initially located.
For firms with no related sales the static and (dynamic) effective tax rate are the same (compare
the dashed line to the triangles in Figure 7). These firms do not shift income toward low tax
jurisdictions. For firms with positive related sales (compare the solid line to the squares in Figure
7), we see evidence of significant movement of income to low tax jurisdictions. The effective tax
rate falls by almost twice as much when income shifting is included (a decline of 6.9 percentage
28
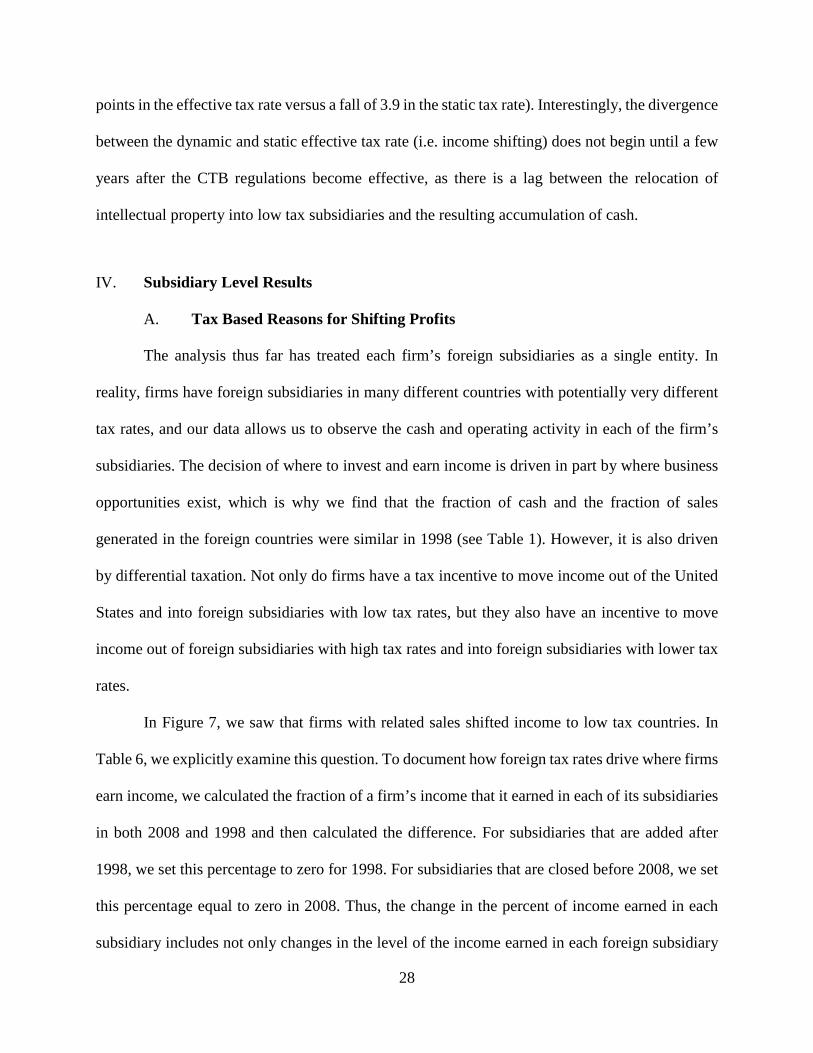
points in the effective tax rate versus a fall of 3.9 in the static tax rate). Interestingly, the divergence
between the dynamic and static effective tax rate (i.e. income shifting) does not begin until a few
years after the CTB regulations become effective, as there is a lag between the relocation of
intellectual property into low tax subsidiaries and the resulting accumulation of cash.
IV. Subsidiary Level Results
A. Tax Based Reasons for Shifting Profits
The analysis thus far has treated each firm’s foreign subsidiaries as a single entity. In
reality, firms have foreign subsidiaries in many different countries with potentially very different
tax rates, and our data allows us to observe the cash and operating activity in each of the firm’s
subsidiaries. The decision of where to invest and earn income is driven in part by where business
opportunities exist, which is why we find that the fraction of cash and the fraction of sales
generated in the foreign countries were similar in 1998 (see Table 1). However, it is also driven
by differential taxation. Not only do firms have a tax incentive to move income out of the United
States and into foreign subsidiaries with low tax rates, but they also have an incentive to move
income out of foreign subsidiaries with high tax rates and into foreign subsidiaries with lower tax
rates.
In Figure 7, we saw that firms with related sales shifted income to low tax countries. In
Table 6, we explicitly examine this question. To document how foreign tax rates drive where firms
earn income, we calculated the fraction of a firm’s income that it earned in each of its subsidiaries
in both 2008 and 1998 and then calculated the difference. For subsidiaries that are added after
1998, we set this percentage to zero for 1998. For subsidiaries that are closed before 2008, we set
this percentage equal to zero in 2008. Thus, the change in the percent of income earned in each
subsidiary includes not only changes in the level of the income earned in each foreign subsidiary

29
but also the decision to open and close subsidiaries. We then regress the change in the foreign
income percentage on the change in the foreign tax rate the firm faced in each country. Declines
in the foreign tax rate have no effect on the fraction of income a firm earns in a subsidiary/country
(see Table 6, column I).
There is a potential problem with this specification. Some countries already had tax rates
in 1998 that were lower than the U.S. rate. With the relaxation of regulations governing the shifting
of profits (see prior discussion of “check-the-box” regulations), firms may have shifted income to
a country that had a low tax rate relative to the U.S. rate even if the country did not lower their tax
rate further. We saw in Figure 7 that income shifting appears to begin a few years after finalization
of the CTB rules. To account for the initial (1998) difference in tax rates, we include the minimum
of the foreign tax rate in 1998 minus 35% and 0. This measures how much lower the foreign tax
rate is at the beginning of our sample. Firms increase the fraction of income earned in a country
between 1998 and 2008 when the foreign tax rate was initially further below the U.S. rate (see
Table 6, column II). With this additional control, we also find a statistically significant, but smaller,
coefficient on the change in the tax rate. We also find that the related sales originating in a
subsidiary increase as the tax rate in the country declines, controlling for total sales from the
subsidiary (see Supplementary Table 7). Thus, over our sample period, we find that firms shift
income toward countries that initially had lower tax rates, and the effect is stronger if the foreign
country lowered its tax rates.
B. Subsidiary Level Cash Regressions
Given our data on the cash levels in each of the firm’s foreign subsidiaries, we are able to
run the regressions from Table 4 using subsidiary-level instead of firm-level observations.31 The
31 The dataset has limited information about the financials of each subsidiary. We included the PPE to asset ratio and the R&D to sales ratio measured at the subsidiary level in Table 7. These are measures of precautionary savings used

30
number of observation rises by a factor of almost 10, from 7,934 in Table 4 (column IV) to 78,165
in Table 7 since firms have multiple subsidiaries. Table 7 contains observations only on firms with
positive R&D. The dependent variable is the subsidiaries’ cash divided by the firm’s net book
value of assets.32 The results are similar to what we found at the firm level, with a few exceptions.
The lower the tax rate in a country, the more cash a firm holds in that subsidiary. The higher the
fraction of subsidiary sales to other subsidiaries or to the parent (related sales), the more cash is
held in the subsidiary. The cross product is negative and statistically significant. We find the same
results whether we include no dummy variables (Table 7, column I), firm dummies (Table 7,
column II), or firm-year dummies (Table 7, column III).33 When we include a separate dummy
variable for each firm-year combination, the tax coefficient is estimated from variation in the tax
rate across different subsidiaries for a given firm and year.34
The rise in cash held in foreign subsidiaries could be a simple consequence of an increasing
amount of business activity taking place in foreign subsidiaries. The regressions in columns V–
VIII help distinguish this effect versus the tax effects. We include the fraction of a firm’s sales that
originate in the subsidiary, as well as the interaction with the foreign tax rate. First notice that
in the literature and in the prior regressions (see Table 4). The coefficient on PPE is positive, not negative as implied by the precautionary savings explanation and found in Table 3. The coefficient on R&D is positive and statistically significant, but the magnitude is a fraction of what we found for domestic cash in Table 4 (i.e. 0.007 in Table 7, column III versus 0.230 in Table 4, column I). The coefficient on R&D is negative and not statistically significant in the foreign cash regression (Table 4, column II). 32 We are interested in the firm’s decision of how much cash a firm has and where to hold it. Thus, we continue to use the firm’s asset value in the denominator instead of the subsidiaries asset value. We do this so that the coefficients are comparable across tables. In addition, as some of the subsidiaries have low asset values and sales (see Table 2); large values for the dependent variable could be driven by low tangible assets rather than large cash holdings. 33 When we include country dummies, the coefficient on the foreign tax rate becomes zero, but the coefficient on the interaction between the foreign tax rates and related sales is large and statistically significant. This means the reduction in foreign tax rates only effected firms with positive related sales. 34 When we run these regressions for firms with zero R&D, the magnitude of the coefficient on the foreign tax rate is similar: -0.023 for firms with positive R&D (see Table 7, column III) versus -0.030 for firms with zero R&D (see Supplementary Table 5, column III). The coefficient on relate sales is smaller and only marginally statistically significant. The coefficient on the cross produce is much smaller and never statistically significant. As we found in Table 4, lower foreign tax rates increase the cash held in the foreign subsidiaries, and this effect is larger for firms with related sales, but only if they have positive R&D.

31
increasing a subsidiary’s sales over time or relative to a firm’s other subsidiaries raises the amount
of cash held in the subsidiary, but the magnitude is tiny compared to the effect of related sales.
The coefficient on related sales is 31x larger (0.472 versus 0.015, see Table 7, column VII). The
interaction of foreign sales and the foreign tax rate is tiny and statistically insignificant. More
importantly, the coefficients on the related sales and the foreign tax rate variables does not change
significantly when we control for subsidiary sales. It isn’t the magnitude of business activity (sales)
but to whom the sales are made (related parties) and low tax rates that explain the rise in foreign
cash.35
The magnitude of the tax effect appears to be smaller than we find in Table 4. This is
because the dependent variable is foreign cash in one subsidiary, not all of the subsidiaries (scaled
by firm assets). The tax effects are large relative to the cash held in a single subsidiary. Based on
the coefficients in Table 7 (column VII) lowering the foreign tax rate by one standard deviation
(0.092) and increasing related sales by one standard deviation (0.037) increases the subsidiary cash
to net book assets by 1.1 percentage points. This is large relative to both the mean (1.2%) and the
standard deviation (4.1%) of the dependent variable.
35 We replaced the effective tax rate by a dummy variable for whether the firm is a tax haven in Supplementary Table 6 and the results are similar. Firms accumulate more cash in subsidiaries that reside in tax havens and this effect is accentuated the more related sales that originate from that subsidiary. Controlling for total subsidiary sale does not change this intuition.

32
V. Conclusions
What explains the dramatic rise in corporate cash? We confirm that precautionary motives
are an important factor in a firm’s decision to hold cash. However, precautionary motives only
explain the cross-sectional variation in domestic cash. They are not important in explaining the
level of foreign cash or the rise in total cash.
To explain the rise in total cash, we focus on the rise in foreign cash. A majority of the rise
in total cash and 85% of the rise in the cash held by MNCs is due to a rise in MNCs’ foreign cash
(see Figure 2). We find that precautionary motivations explain none of the rise in foreign cash,
which is not surprising since foreign cash is a poor source of precautionary savings when
repatriation is costly. The rise in foreign cash is instead driven by tax factors. As the incentive and
ability of firms to earn income in, or shift income to, low tax foreign jurisdictions increased, the
rise in foreign cash followed. Starting at the beginning of our sample (1998), average foreign tax
rates began to fall below U.S. tax rates. At about the same time, check-the-box (CTB) regulations
came into effect and allowed firms greater latitude in shifting income into foreign countries. We
document that the rise in related sales does not begin until after CTB regulations become effective.
We find that a combination of lower foreign tax rates and increasing levels of inter-company sales
(related sales) explains most of the rise in foreign cash. Not all firms, however, are able to shift
income abroad. We find lower foreign tax rates lead to higher foreign cash for all firms, but the
effect of related sales is only important for firms with intangible assets, which we measure as
positive R&D expenditures. Ninety-two percent of the rise in foreign cash occurs in firms with
positive R&D expenditures and positive related sales. The rise in (foreign) cash is concentrated
in a small number of low tax countries and a well-defined set of firms.

33
Our results indicate that at least two important considerations are at work in explaining
level of corporate liquidity: precautionary savings and taxes. The increase, however, arises
primarily from tax motivations. Caution is therefore required when interpreting the policy
implications of recent high levels of observed cash positions.

34
References
Albertus, J. F, 2016, “Does Foreign Tax Arbitrage Promote Innovation? Evidence from Subsidiary-Level Data” working paper. Bates, T. W., K. M. Kahle, and R. M. Stulz, 2009, “Why Do U.S. Firms Hold So Much More Cash than They Used To?” Journal of Finance 64, 1985–2021. Blouin, Jennifer and Linda Krull, 2014, “Does Organizational Form Affect Firms’ Foreign Operations? The Role of “Check-the-Box” on Multinational Tax Planning?” University of Pennsylvania Working Paper. Bowers, Simon, 2014, Luxembourg tax files: how tiny state rubber-stamped tax avoidance on an industrial scale, The Guardian, November 5, 2014. Boyle, G. W. and G. A. Guthrie, 2003, “Investment, Uncertainty, and Liquidity,” Journal of Finance 58, 2143–2166. Denis, David and Stephen McKeon, 2017, “Persistent Operating Losses and Corporate Financial Policies” University of Pittsburgh working paper. De Simone, Lisa, Huang and Linda Krull, 2017, “R&D and the rising foreign profitability of U.S. multinational corporations” working paper. De Simone, Lisa, and Rebecca Lester, 2017, “The Effect of Foreign Cash Holdings on Internal Capital Markets and Firm Financing” working paper. De Simone, Lisa, Lillian Mills, and Bridget Stomberg, 2017, “Using IRS Audit Data to Identify Income Shifting to Foreign Affiliates” working paper. De Simone, Lisa, Joseph Piotroski, and Rimmy Tomy, 2017, “Repatriation Taxes and Foreign Cash Holdings: The Impact of Anticipated Tax Reform” working paper. Dobridge, C., and P. Landefeld, 2017, “Is the Cash Locked Out? Evidence from U.S. Multinational Tax Filings” working paper, Federal Reserve Board of Governors, Washington, D.C.). Drawbaugh, K., and A. Sullivan, 2013, “Insight: How Treasury’s Tax Loophole Mistake Saves Companies Billions Each Year,” Reuters.com, May 30, 2013. Duchin, R., T. Gilbert, J. Harford, and C. M. Hrdlicka, 2017, “Precautionary Savings with Risky Assets: When Cash Is Not Cash,” Journal of Finance 72, 793–852. Dyreng, Scott D. and Bradley P. Lindsey, 2009, “Using Financial Accounting Data to Examine the Effect of Foreign Operations Located in Tax Havens and Other Countries on U. S. Multinational Firms' Tax Rates,” Journal of Accounting Research 47, 1283-1316.

35
Faulkender, M. W., and J. M. Smith, 2016, “Taxes and Leverage at Multinational Corporations,” Journal of Financial Economics 122, 1–20. Faulkender, M. W., and M. A. Petersen, 2012, “Investment and Capital Constraints: Repatriations under the American Jobs Creation Act,” Review of Financial Studies 25, 3351–3388. Foley, C. F., J. C. Hartzell, S. Titman, G. Twite, 2007, “Why Do Firms Hold So Much Cash? A Tax-based Explanation,” Journal of Financial Economics 86, 579–607. Graham, John and Mark Leary, 2017, “The Evolution of Corporate Cash” working paper. Graham, John, Michelle Hanlon, and Terry Shevlin, 2010, Barriers to Mobility: The Lockout Effect of U.S. Taxation of Worldwide Corporate Profits, National Tax Journal 63 1111-1144. Grubert, H., and J. Mutti, 1991, “Taxes, Tariffs and Transfer Pricing in Multinational Corporate Decision Making,” Review of Economics and Statistics 73, 285–293. Grubert, H., 2003, “Intangible Income, Intercompany Transactions, Income Shifting, and the Choice of Location,” National Tax Journal 56, 221–242. Guveneny, Fatih, Raymond J. Mataloni Jr., Dylan G. Rassierx, and Kim J. Ruhl, 2018, “Offshore Profit Shifting and Domestic Productivity Measurement” working paper. Hanlon, Michelle, Rebecca Lester, and Rodrigo Verdi, 2015, “The effect of repatriation tax costs on U.S. multinational investment,” Journal of Financial Economics 116, 179–196. Harford, J., S. Klasa, and W. F. Maxwell, 2014, “Refinancing Risk and Cash Holdings,” Journal of Finance 69, 975–1012. Harford, J., C. Wang, and K. Zhang, 2017, “Foreign Cash: Taxes, Internal Capital Markets and Agency Problems,” Review of Financial Studies 20, 1490–1538. He, Zhaozhao and M. Babajide Wintoki, 2016 “The cost of innovation: R&D and high cash holdings in U.S. firms,” Journal of Applied Corporate Finance 41, 280-303. Hoberg, G., G. Phillips, and N. Prabhala, 2014, “Product Market Threats, Payouts, and Financial Flexibility,” Journal of Finance 69, 293–324. Levin, C, and J. McCain, 2013, “Offshore Profit Shifting and the U.S. Tax Code - Part 2 (Apple Inc.),” (memo, Senate Permanent Committee on Investigations, Washington D.C.). Kanter, J. 2014, “E.U. Accuses Starbucks and Netherlands of Making Unfair Tax Deal,” The New York Times, November 14. Karnitschnig, Matthew, and Robin Van Dallen, 2014, “Business-Friendly Bureaucrat Helped Build Tax Haven in Luxembourg,” The Wall Street Journal, October 21, 2014.

36
Klassen, Kenneth and Stacie Laplante, 2012, “Are U.S. Multinational Corporations Becoming More Aggressive Income Shifters?” Journal of Accounting Research 50: 1245-1285. Lattman, Peter and Peter Eavis, 2013, “To satisfy its investors, cash-rich Apple borrows money,” New York Times, April 30. Martin, J. S. and A. M. Santomero, 1997, “Investment Opportunities and Corporate Demand for Lines of Credit,” Journal of Banking & Finance 21, 1331–1350. Opler, T., L. Pinkowitz, R. Stulz, and R. Williamson, 1999, “The Determinants and Implications of Corporate Cash Holdings,” Journal of Financial Economics 52, 3–46. Pinkowitz, L., R. Stulz, and R. Williamson, 2016, “Do U.S. Firms Hold More Cash than Foreign Firms Do?” Review of Financial Studies 29, 309–348. Petersen, M. 2009, “Estimating Standard Errors in Finance Panel Data Sets: Comparing Approaches,” Review of Financial Studies 22, 435–480. Worstall, Tim, 2015, “Why Apple Is Borrowing $6.5 Billion And What Obama's Trying To Do About It,” Forbes, February 3.

37
Table 1: Distribution of Cash and Sales across Subsidiary Countries
1998 2008 Country Foreign
Cash % Foreign Sales %
Corporate Tax Rate
Country Foreign Cash %
Foreign Sales %
Corporate Tax Rate
United Kingdom 14.6% 14.8% 27.3% Ireland 13.1% 4.0% 12.5% Netherlands 10.4% 5.8% 35.0% United Kingdom 11.1% 12.7% 26.1% Ireland 9.0% 2.0% 32.0% Bermuda 9.9% 1.1% 0.0% Germany 6.9% 10.6% 56.6% Netherlands 9.9% 4.7% 24.3% Belgium 5.8% 2.5% 37.2% Belgium 5.6% 2.4% 31.1% France 5.4% 6.0% 41.7% Luxembourg 5.5% 0.4% 0.0% Switzerland 5.1% 2.9% 27.8% Canada 5.0% 10.0% 30.9% Canada 4.3% 11.1% 44.6% Germany 4.6% 7.0% 30.9% Bermuda 4.2% 0.6% 0.0% Switzerland 4.1% 4.5% 7.8% Italy 3.5% 3.1% 33.0% France 2.9% 3.9% 34.4% Singapore 2.9% 3.2% 26.0% Australia 2.5% 2.9% 30.0% Japan 2.6% 7.8% 51.6% Japan 2.2% 5.4% 43.0% Australia 2.1% 2.8% 36.0% Singapore 1.9% 4.9% 18.0% Brazil 2.0% 3.6% 25.0% Italy 1.7% 2.6% 27.5% Spain 1.9% 2.1% 35.0% China 1.6% 3.5% 25.0% Other Countries 19.3% 21.0% Other Countries 18.3% 30.2% Top 6 Countries 52.0% 42.0% 38.3% Top 6 Countries 55.0% 25% 15.7%
Notes:
This table contains the fraction of total foreign cash held by subsidiaries in each country and the fraction of total foreign sales originating from subsidiaries in each country. The numbers are reported for 1998 (the beginning of our sample) and 2008 (the end of our sample). The top 15 countries (sorted by cash) are reported in each year along with the fraction of cash and sales in the subsidiaries from the remaining countries. The table also reports the statistics for the top six countries in each year. For example, foreign subsidiaries of US firms located in the United Kingdom held 14.6% of the cash in 1998 and generated 14.8% of foreign sales in 1998. The table also reports the top corporate statutory tax rate for each country in 1998 and 2008 as per Faulkender and Smith (2016).
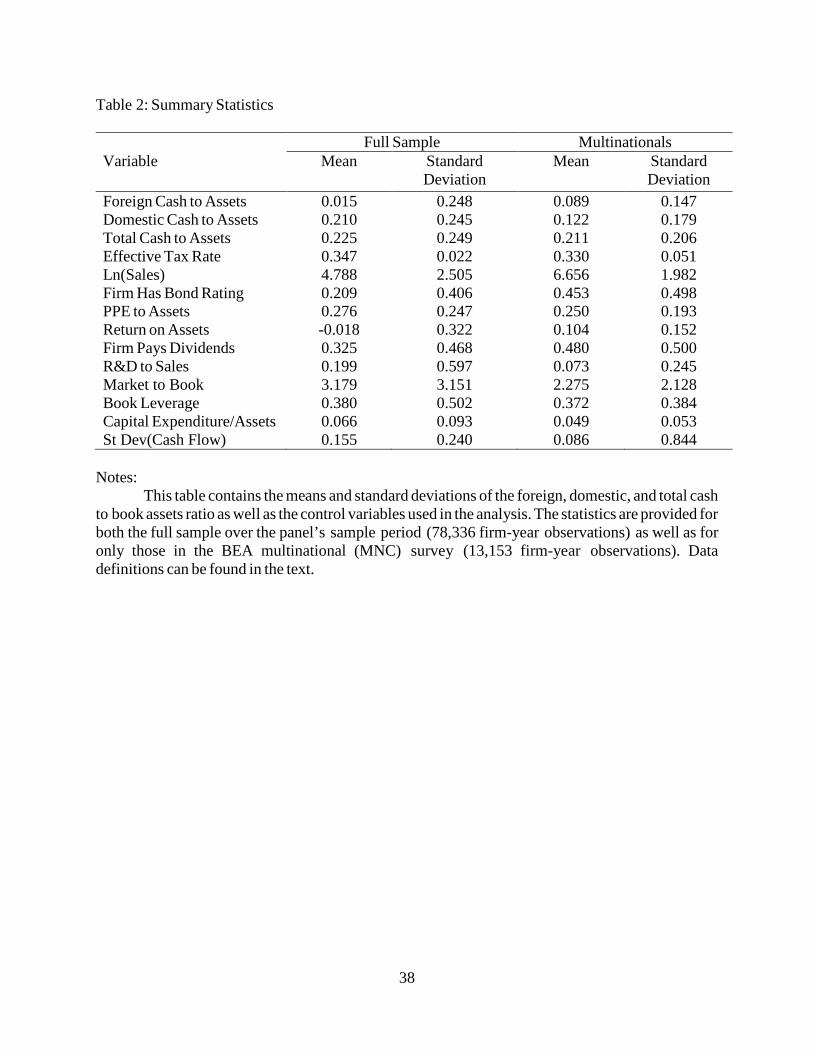
38
Table 2: Summary Statistics Full Sample Multinationals Variable Mean Standard
Deviation Mean Standard
Deviation Foreign Cash to Assets 0.015 0.248 0.089 0.147 Domestic Cash to Assets 0.210 0.245 0.122 0.179 Total Cash to Assets 0.225 0.249 0.211 0.206 Effective Tax Rate 0.347 0.022 0.330 0.051 Ln(Sales) 4.788 2.505 6.656 1.982 Firm Has Bond Rating 0.209 0.406 0.453 0.498 PPE to Assets 0.276 0.247 0.250 0.193 Return on Assets -0.018 0.322 0.104 0.152 Firm Pays Dividends 0.325 0.468 0.480 0.500 R&D to Sales 0.199 0.597 0.073 0.245 Market to Book 3.179 3.151 2.275 2.128 Book Leverage 0.380 0.502 0.372 0.384 Capital Expenditure/Assets 0.066 0.093 0.049 0.053 St Dev(Cash Flow) 0.155 0.240 0.086 0.844
Notes:
This table contains the means and standard deviations of the foreign, domestic, and total cash
to book assets ratio as well as the control variables used in the analysis. The statistics are provided for
both the full sample over the panel’s sample period (78,336 firm-year observations) as well as for
only those in the BEA multinational (MNC) survey (13,153 firm-year observations). Data
definitions can be found in the text.

39
Table 3: Baseline Cash Regressions
I II III IV V VI Total Cash Domestic Cash Foreign Cash
All Firms MNC All Firms MNC MNC
High Foreign Income MNC
Effective Tax Rate -0.7171 -0.6901 0.078* 0.062 -0.7521 -1.0991
(0.072) (0.074) (0.047) (0.048) (0.076) (0.200) Ln(Firm Sales) -0.0161 -0.0071 -0.0171 -0.0121 0.0055 -0.002
(0.001) (0.003) (0.001) (0.002) (0.002) (0.002) Has Bond Rating 0.0101 0.003 0.007* -0.006 0.008 -0.002
(0.004) (0.008) (0.004) (0.007) (0.006) (0.004) PPE to Book Assets -0.3191 -0.2691 -0.3121 -0.1951 -0.0741 -0.0275
(0.006) (0.017) (0.006) (0.014) (0.015) (0.013) Return on Assets 0.0271 -0.0775 0.0311 -0.000 -0.0775 -0.1265
(0.006) (0.031) (0.005) (0.024) (0.034) (0.053) Firm Pays Dividends -0.0131 -0.0271 -0.0141 -0.0351 0.008 0.004 (0.003) (0.007) (0.003) (0.006) (0.005) (0.003) R&D to Sales 0.1361 0.2281 0.1361 0.2261 0.002 -0.017 (0.003) (0.020) (0.003) (0.021) (0.013) (0.017) Market to Book 0.0041 0.0101 0.0041 0.0091 0.000 0.002* (0.000) (0.002) (0.000) (0.001) (0.001) (0.001) Book Leverage -0.0971 -0.1041 -0.0961 -0.1021 -0.002 0.000 (0.003) (0.009) (0.003) (0.008) (0.006) (0.006) Capital Exp/Sales 0.0821 0.3011 0.0741 0.1961 0.1055 0.017 (0.011) (0.052) (0.011) (0.042) (0.049) (0.033) Domestic Firm -0.0171 0.0581 (1 if yes) (0.004) (0.004) Observations 78,102 12,841 78,102 12,841 12,841 6,558 R2 0.392 0.309 0.412 0.334 0.092 0.069
Notes:
The table contains regressions of the ratio of the firm’s cash to book assets on a set of firm
characteristics. Cash is defined as total cash (columns I and II), domestic cash (columns III and IV), and foreign cash (columns V and VI) divided by net assets. The entire sample is included in the
regression in columns I and III. Only multinational firms (MNC) are included in the sample in
columns II, IV, V, and VI. The sample in Column VI includes only MNCs whose foreign source income percentage is above the median. Each regression contains year dummies. Standard errors are clustered by firm. Statistical significance at the 1, or 5 or 10% levels is reported as superscripts
1, 5, and * respectively.

40
Table 4: Related Sales Cash Regressions
I II III IV V VI VII VIII IX
Domestic
Cash Foreign
Cash Foreign
Cash Foreign
Cash Domestic
Cash Foreign
Cash Foreign
Cash Foreign
Cash Foreign
Cash (Δ)
MNC MNC MNC R&D=0
MNC R&D>0 MNC MNC MNC
R&D=0 MNC
R&D>0 MNC
R&D>0 Related Sales -0.0885 0.3741 0.103 0.4181 -0.0511 0.1631 0.1041 0.1821 0.0775 (0.036) (0.094) (0.159) (0.097) (0.019) (0.033) (0.025) (0.044) (0.037) Effective Tax Rate -0.042 -0.3461 -0.3931 -0.3141 -0.0595 (0.058) (0.060) (0.086) (0.078) (0.029) Related Sales
x Tax Rate 0.039 -0.359 0.249 -0.500* -0.176
(0.115) (0.286) (0.471) (0.296) (0.113) Tax Haven -0.002 0.0401 0.0381 0.0401 (1 if yes) (0.006) (0.005) (0.007) (0.007) Related Sales -0.030 0.1531 0.117* 0.1375 x Tax Haven (0.022) (0.043) (0.068) (0.053) Ln(Firm Sales) -0.0101 0.000 -0.0071 0.004 -0.0091 -0.0045 -0.0091 -0.001 0.0025 (0.002) (0.002) (0.002) (0.003) (0.002) (0.002) (0.002) (0.003) (0.001) Has Bond Rating -0.005 0.006 0.001 0.011 -0.006 0.005 0.002 0.008 0.001 (0.007) (0.005) (0.006) (0.008) (0.007) (0.006) (0.006) (0.009) (0.003) PPE to Book Assets -0.1981 -0.0621 -0.0561 -0.0575 -0.1991 -0.0541 -0.0481 -0.0625 0.002 (0.014) (0.013) (0.013) (0.028) (0.014) (0.013) (0.013) (0.027) (0.009) Return on Assets 0.002 -0.0855 -0.020 -0.1241 0.003 -0.0825 -0.019 -0.1171 -0.070* (0.024) (0.034) (0.031) (0.044) (0.024) (0.033) (0.030) (0.044) (0.014) Firm Pays Dividends -0.0351 0.0105 -0.003 0.0175 -0.0361 0.006 -0.005 0.012* 0.000 (0.006) (0.005) (0.006) (0.007) (0.006) (0.005) (0.006) (0.007) (0.002) R&D to Sales 0.2301 -0.013 -0.019 0.2371 -0.023* -0.028* -0.0095 (0.021) (0.012) (0.014) (0.022) (0.012) (0.015) (0.005) Market to Book 0.0091 0.000 0.000 0.000 0.0091 0.000 0.000 0.000 0.001 (0.001) (0.001) (0.001) (0.001) (0.001) (0.001) (0.001) (0.001) (0.001) Book Leverage -0.1011 -0.004 -0.006 -0.004 -0.1021 -0.004 -0.008 -0.003 0.002 (0.008) (0.006) (0.007) (0.008) (0.008) (0.006) (0.007) (0.008) (0.004) Capital Exp/Sales 0.1951 0.1105 0.1085 0.066 0.1941 0.1125 0.1035 0.080 0.032 (0.042) (0.046) (0.046) (0.089) (0.042) (0.045) (0.046) (0.090) (0.033) Observations 12,841 12,841 4,907 7,934 12,773 12,773 4,879 7,894 7,107 R2 0.341 0.224 0.125 0.257 0.344 0.24 0.138 0.267 0.058
Notes:
The table contains regressions of the ratio of the firm’s cash to book assets on a set of firm
characteristics for multinational firms. Cash is defined as domestic cash (columns I and V), foreign
cash (columns II-IV and VI-VIII) or change in foreign cash (IX). Related sales is defined as the
percent of the firm’s total sales that are sales made by its subsidiaries to other subsidiaries or to the
parent. The sample includes only multinational firms (MNC). Columns III and VII contains only
firm-years with zero reported R&D while column IV and VIII only contains firm-years with strictly
positive reported R&D. In columns V-VIII, the effective tax rate is replaced by a tax haven dummy, which is equal to one if the firm has a subsidiary in a tax haven as defined by the Global Policy Forum (see Dyreng and Lindsey, 2009). Each regression contains year dummies. Standard errors
are clustered by firm. Statistical significance at the 1, or 5 or 10% levels is reported as superscripts
1, 5, and * respectively.

41
Table 5: Tax Variable Decomposition
I II
Domestic
Cash Foreign
Cash US Income (%) 0.0421 -0.1291
(0.006) (0.008) Foreign Tax Rate -0.050 -0.1441
(0.026) (0.024) Ln(Firm Sales) -0.0111 0.0081
(0.002) (0.002) Has Bond Rating -0.005 0.007 (0.007) (0.006) PPE to Book Assets -0.1931 -0.0851
(0.015) (0.014) Return on Assets -0.018 -0.024 (0.028) (0.040) Firm Pays Dividends -0.0351 0.0115 (0.006) (0.005) R&D to Sales 0.2571 0.018 (0.029) (0.016) Market to Book 0.0091 0.001 (0.001) (0.001) Book Leverage -0.1061 -0.004 (0.009) (0.006) Capital Exp/Sales 0.1991 0.052 (0.046) (0.037) Observations 12,368 12,368 R2 0.344 0.158
Notes:
The table contains regressions of the ratio of the firm’s domestic or foreign cash to book assets
on a set of firm characteristics. Only multinational firms (MNC) are included in the sample. US
Income is the percentage of the firm’s earnings that were generated in the United States. Foreign Tax
Rate is the subsidiary earnings weighted tax rate for the foreign subsidiaries in which the company
operates. Each regression contains year dummies. Standard errors are clustered by firm. Statistical
significance at the 1, 5, or 10% levels is reported as superscripts 1, 5, and *, respectively.

42
Table 6: Changing Distribution of Foreign Income across Subsidiaries
I II Δ Foreign Tax Rate 0.002 -0.0125 (1998-2008) (0.005) (0.005) Tax Rate Differential (1998) -0.0261 Foreign - US (0.005) Observations 13,692 13,692 R2 0.000 0.003
Notes: The table contains regressions of the change in the percent of income earned in a subsidiary (country) on changes in the foreign tax rates from 1998 to 2008. Thus, the regression contains variation across firms and subsidiaries (countries) but not time. If a subsidiary is added after 1998, the fraction of income in that subsidiary is set to zero in 1998. If a subsidiary is closed, the fraction of income in that subsidiary is set to zero in 2008. In column II, we also included the minimum of the foreign tax rate in 1998 minus 35% and 0. Standard errors are clustered by firm. Statistical
significance at the 1, 5, or 10% levels is reported as superscripts 1, 5, and *, respectively.
i,s,2008 i,s,1998 0 1 i,s,2008 i,s,1998
2 i,s,1998
Foriegn Income% Foriegn Income% =β +β Foriegn τ -Foriegn τ
+β Min Foriegn τ -0.35,0
(3)

43
Table 7: Subsidiary Level Cash Regressions – Firms with Positive R&D
I II III IV V VI VII VIII Related Sales 0.5101 0.4711 0.4751 0.4771 0.5081 0.4661 0.4721 0.4711
(0.093) (0.087) (0.096) (0.091) (0.094) (0.088) (0.097) (0.093) Foreign Tax Rate -0.0301 -0.0251 -0.0231 0.002 -0.0281 -0.0155 -0.0145 0.007 (0.004) (0.004) (0.005) (0.005) (0.007) (0.006) (0.006) (0.008) Related Sales -1.0081 -0.8351 -0.8195 -0.9531 -1.0101 -0.8211 -0.8075 -0.9581 x Tax Rate (0.311) (0.290) (0.319) (0.305) (0.314) (0.292) (0.321) (0.309) Subsidiary Sales 0.005 0.0095 0.0151 0.0115 (0.005) (0.004) (0.004) (0.005) Subsidiary Sales -0.004 -0.017 -0.016 -0.008 x Tax Rate (0.014) (0.012) (0.013) (0.015) PPE 0.2791 0.2211 0.2271 0.2711 0.2791 0.2201 0.2271 0.2711 of subsidiary (0.028) (0.023) (0.026) (0.027) (0.028) (0.023) (0.026) (0.027) R&D 0.0041 0.0071 0.0071 0.0031 0.0041 0.0071 0.0071 0.0031 of subsidiary (0.001) (0.001) (0.001) (0.001) (0.001) (0.001) (0.001) (0.001) Ln(GDP) 0.0021 0.0011 0.0011 0.0071 0.0021 0.0011 0.0011 0.0061 of country (0.000) (0.000) (0.000) (0.001) (0.000) (0.000) (0.000) (0.001) Firm Dummies No Yes No No No Yes No No Firm-Year Dummies No No Yes No No No Yes No Country Dummies No No No Yes No No No Yes Observations 78,165 78,165 78,165 78,164 78,165 78,165 78,165 78,164 R2 0.175 0.32 0.406 0.207 0.176 0.320 0.406 0.209
Notes: The table contains regressions of the ratio of a subsidiary’s cash to book assets of the firm on a set of subsidiary characteristics. Each observation represents a MNC’s subsidiary in a given year. Thus, a firm that has three subsidiaries will have three observations per year. The regressions include only observations for MNCs that report strictly positive R&D. The foreign tax rate (the marginal tax rate the subsidiary faces in each country), related sales (the percent of the subsidiaries sales which are made to the parent or other subsidiaries of the parent), and the cross product are included in each regression. In columns V-VIII, we include the subsidiary sales (as a percent of total sales) as well as the cross produce of subsidiary sales and the foreign tax rate. The subsidiary’s property, plant, and equipment (PPE) to book value of assets, the R&D/Sales ratio, and the natural log of GDP at the country level are included as additional explanatory variables. Standard errors
are clustered by firm. Statistical significance at the 1, 5, or 10% levels is reported as superscripts 1, 5, and *, respectively.

44
Figure 1: Aggregate Corporate Cash – Flow of Funds
Notes:
The data is from the Federal Reserve Flow of Funds, Table L. 102 Nonfinancial Business
(December 15, 2015). We summed rows 2 through 11. This includes checking and savings accounts
of non-financial businesses as well as investment in debt securities (e.g. commercial paper, government bonds, and loans). The data is from 1998 to 2014.
80
90
100
110
120
130
140
150
160
0
500
1,000
1,500
2,000
2,500
3,000
3,500
Cash Cash/GDP (1994=100)

45
Figure 2: Domestic and Foreign Cash
Notes: The figure graphs the domestic cash of non-MNC and both the foreign and domestic cash
for MNC in $B. Total cash is from Compustat, and foreign cash is from the BEA (see paper for details). Domestic cash for MNC is the difference between total cash and foreign cash. Domestic cash levels of domestic firms increase by a factor of 1.8x while domestic cash levels of MNCs increase by a factor of 1.9x over the sample period. GDP increases by a factor of 1.3x. The level of foreign cash (held by MNCs) increases by a factor of 5.4x.
0
500
1000
1500
2000
2500
1998 1999 2000 2001 2002 2003 2004 2005 2006 2007 2008
Domestic (non-MNC) Domestic (MNC) Foreign (MNC)

46
Figure 3: Corporate Tax Rates: US and Foreign Rates
Notes:
The figure graphs the top US corporate tax rate and the average corporate tax rate across the
following foreign countries: Australia, Belgium, Canada, Ireland, Italy, France, Germany, Japan, Luxembourg, the Netherlands, Switzerland, and the United Kingdom. These are the countries in the
top 15 of cash holdings (see Table 2) where the tax rate data was available from the OECD website.36
36 The top corporate tax rates are taken from the OECD web site (stats.oecd.org). The data is not reported for Japan before 1990 or for Luxembourg before 2000. These countries are excluded from the average in these years.
25
30
35
40
45
50
55
1981 1983 1985 1987 1989 1991 1993 1995 1997 1999 2001 2003 2005 2007 2009 2011 2013 2015
US Corporate Tax Rate Foreign Corporate Tax Rate
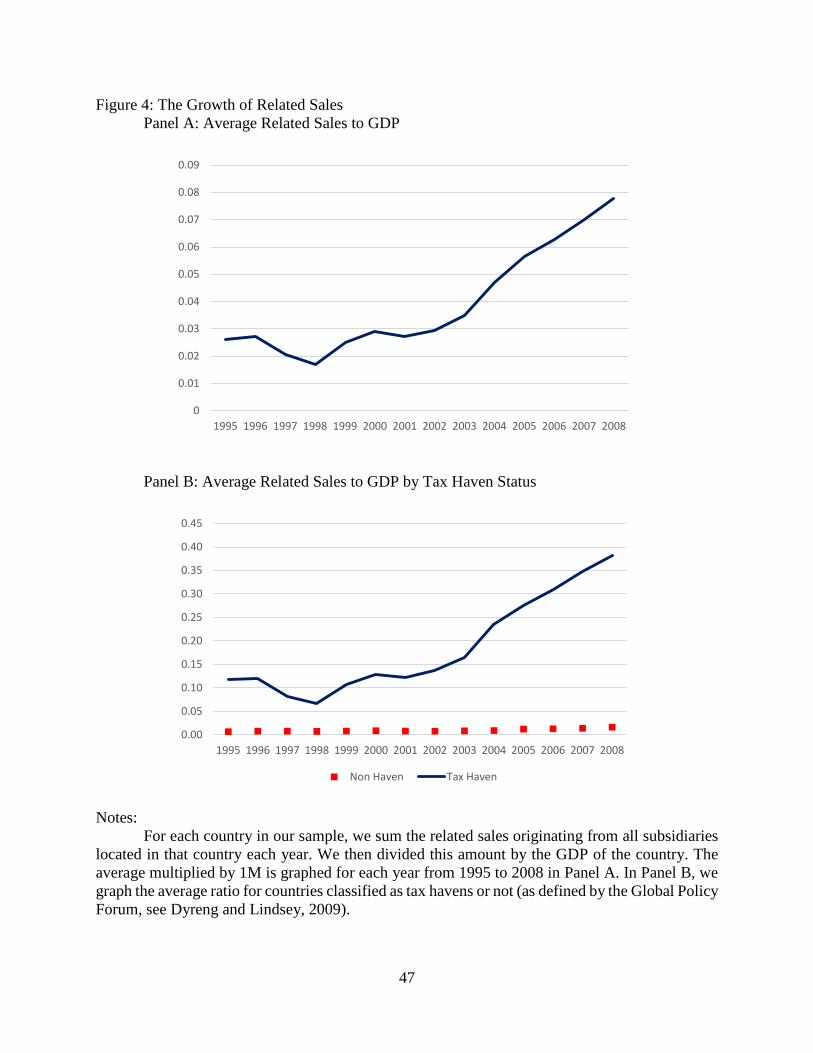
47
Figure 4: The Growth of Related Sales Panel A: Average Related Sales to GDP
Panel B: Average Related Sales to GDP by Tax Haven Status
Notes: For each country in our sample, we sum the related sales originating from all subsidiaries located in that country each year. We then divided this amount by the GDP of the country. The average multiplied by 1M is graphed for each year from 1995 to 2008 in Panel A. In Panel B, we graph the average ratio for countries classified as tax havens or not (as defined by the Global Policy Forum, see Dyreng and Lindsey, 2009).
0
0.01
0.02
0.03
0.04
0.05
0.06
0.07
0.08
0.09
1995 1996 1997 1998 1999 2000 2001 2002 2003 2004 2005 2006 2007 2008
0.00
0.05
0.10
0.15
0.20
0.25
0.30
0.35
0.40
0.45
1995 1996 1997 1998 1999 2000 2001 2002 2003 2004 2005 2006 2007 2008
Non Haven Tax Haven

48
Figure 5: Foreign Cash of MNC by R&D and Related Sales Panel A: Total Cash
Panel B: Mean Foreign Cash/Assets
Notes: In Figure 5 we graph total foreign cash (Panel A) and the mean foreign cash to asset ratio (Panel B) for two samples: MNCs that report both positive (and non-missing) R&D and positive related sales versus all other MNCs (either or both R&D and related sales are zero, or in the case of R&D missing). Related sales are subsidiary’s revenue arising from sales to the other subsidiaries of the firm or to its parent. Total foreign cash is reported in $B in Panel A.
0
200
400
600
800
1,000
1,200
1,400
1,600
1998 1999 2000 2001 2002 2003 2004 2005 2006 2007 2008
R&D>0 & Related Sales>0 Other MNCs
0.02
0.04
0.06
0.08
0.10
0.12
0.14
0.16
0.18
0.20
1998 1999 2000 2001 2002 2003 2004 2005 2006 2007 2008
R&D>0 & Related Sales>0 Other MNCs

49
Figure 6: Average Percent of Income Earned by MNC in Their Foreign Subsidiaries
Notes:
The figure graphs the mean percent of MNCs’ income that is earned in their foreign subsidiaries (see Table 5).
0%
10%
20%
30%
40%
50%
60%
1998 1999 2000 2001 2002 2003 2004 2005 2006 2007 2008

50
Figure 7: Effective Tax Rates by Related Sales
Notes:
We graph the effective tax rate for two samples: MNCs that report both positive (and non-missing) R&D and positive related sales and all other MNCs (either or both R&D and related sales are zero, or in the case of R&D missing). Related sales are subsidiary’s revenue arising from sales to the other subsidiaries of the firm or to its parent. In Panel A, we graph the effective tax rate as defined in equation (1) and used in the regression. It falls over our sample period because foreign countries lowered their statutory tax rates and because firms earned more of their profits in low tax foreign jurisdictions. To break out these two effects, we graph the static effective tax rate in Panel B. This is the effective tax rate (equation 1) but using the income weights for the first year a firm enters the sample (e.g. 1998). Thus, the fall in the effective tax rate in Panel B is due only to reduction in foreign statutory tax rates.
0.270
0.280
0.290
0.300
0.310
0.320
0.330
0.340
0.350
0.360
1998 1999 2000 2001 2002 2003 2004 2005 2006 2007 2008
Related Sales>0 (ETR) Related Sales=0 (ETR)
Related Sales>0 (Static ETR) Related Sales=0 (Static ETR)