UNDERSTANDING THE RESPONSIBLE MARKETING...
16
* UGC-Senior Research Fellow, DMS, National Institute of Technology, Durgapur, Email: [email protected] ** Assistant Professor, DMS, National Institute of Technology, Durgapur,Email: [email protected] UNDERSTANDING THE RESPONSIBLE MARKETING VIS-A-VIS AD LED MARKETING: AN EMPIRICAL ANALYSIS Sujata Banerjee* and Kaushik Mandal** Abstract: Purpose: The present study attempts to understand the notion of responsible marketing towards the society in comparison to the existing traditional promotional tools used by the corporations in reaping business performance. Methodology/Approach: Cross sectional data of the variables related to ‘business performance’, ‘marketing expenditure’ and ‘societal expenditure’ of eight companies for the years 2003 to 2010 have been collected from ‘Capitaline database’. Then with the help of regression analysis the impact of ‘marketing expenditure’ and ‘societal expenditure’ on ‘business performance’ is measured. Thereafter, average of absolute values of ‘Advertisement expenditure’ and average of absolute values of ‘Social Responsibility Spending’ of all such 8 companies are calculated to make it comparable. Also, the ‘relative share of advertisement expenditure’ and the ‘relative share of social responsibility spending’ in total expenditure are studied for each year under consideration. Findings: The study portrays a considerable impact of societal spending towards business performance which bolsters its importance in the mind of marketers. Research Implications: The study serves a better understanding to the academicians and marketers regarding ‘promotion based on social cause’ compared to traditional based promotional tools. Keywords: Social responsibility spending, business performance, traditional promotional tools, advertisement, consumer behaviour BACKGROUND STUDY In the perspective of the today’s market, consumers are bombarded with the various promotional tools used by the companies. And with the development of information technologies, they are splintering off with so many digital tools like iPods, internet, digital video recorder, etc. for watching TV shows, movies and all(Kotlar & Armstrong,2008). Besides this , there are electronic device based options I J A B E R, Vol. 14, No. 12, (2016): 8581-8596
Transcript of UNDERSTANDING THE RESPONSIBLE MARKETING...
* UGC-Senior Research Fellow, DMS, National Institute of Technology, Durgapur, Email:[email protected]
** Assistant Professor, DMS, National Institute of Technology, Durgapur,Email: [email protected]
UNDERSTANDING THE RESPONSIBLEMARKETING VIS-A-VIS AD LED MARKETING:
AN EMPIRICAL ANALYSIS
Sujata Banerjee* and Kaushik Mandal**
Abstract: Purpose: The present study attempts to understand the notion of responsiblemarketing towards the society in comparison to the existing traditional promotionaltools used by the corporations in reaping business performance.
Methodology/Approach: Cross sectional data of the variables related to ‘business performance’,‘marketing expenditure’ and ‘societal expenditure’ of eight companies for the years 2003 to2010 have been collected from ‘Capitaline database’. Then with the help of regression analysisthe impact of ‘marketing expenditure’ and ‘societal expenditure’ on ‘business performance’ ismeasured. Thereafter, average of absolute values of ‘Advertisement expenditure’ and averageof absolute values of ‘Social Responsibility Spending’ of all such 8 companies are calculated tomake it comparable. Also, the ‘relative share of advertisement expenditure’ and the ‘relativeshare of social responsibility spending’ in total expenditure are studied for each year underconsideration.
Findings: The study portrays a considerable impact of societal spending towards businessperformance which bolsters its importance in the mind of marketers.
Research Implications: The study serves a better understanding to the academicians andmarketers regarding ‘promotion based on social cause’ compared to traditional based promotionaltools.
Keywords: Social responsibility spending, business performance, traditionalpromotional tools, advertisement, consumer behaviour
BACKGROUND STUDY
In the perspective of the today’s market, consumers are bombarded with the variouspromotional tools used by the companies. And with the development ofinformation technologies, they are splintering off with so many digital tools likeiPods, internet, digital video recorder, etc. for watching TV shows, movies andall(Kotlar & Armstrong,2008). Besides this , there are electronic device based options
I J A B E R, Vol. 14, No. 12, (2016): 8581-8596
8582 � Sujata Banerjee and Kaushik Mandal
also to evade advertisements during TV shows (Hawkins et al., 2007). Accordingto Dix & Phau (2010), presently this technological development leads to higheradvertisement avoidance. Many researchers suggested that too manyadvertisements in a media vehicle may lead to advertisement clutter (Ha, 1996;James & Kover, 1992; Speck & Elliot, 1997) and may influence the customer’s belieftowards it (Elliot & speck, 1998). Also, Krugman (1983) believed that when theconsumer’s goal is interrupted by any advertisements, then it may find to besusceptible on the part of consumers and may result in advertisement avoidance.Calfee & Ringold (1994) in their study observed that there are widespreadconsumers who believe in ad skeptism. They often feel that advertising isuntruthful, which indulge them to buy things which they actually not want to gofor. In particular, it is suggested by Obermiller & Spangenberg (1998) that manycustomers categorically consider advertisement as untrustworthy, but do rely onit, but there are other group of customers who completely reject it. Thus, it becomesa matter of concern for the advertiser as a traditional marketing tool is no longerguarantee customer trustworthy (Walker & Bellamy, 1993). It can also be said thatbelievability on advertisement decreases because of providing over estimatedinformation from the company to the customers. Hence, advertisements fail tocatch attention and develop trust among the customers. As a result, people believeless on advertising and this enhances a problem concerning brand building.Consequently, all these discussions suggest marketer to comprehend the growingdisbelief of consumers towards the traditional marketing tools such asadvertisement. Although one may question about the future of these traditionalmarketing tools which are still very much in use. In this backdrop, it is the need ofthe hour to look into alternative route of brand building and building trust is thepre-requisite for brand building(Mandal & Banerjee,2015).
It is observed that with the propagation of consumer choices, companies areindeed more focussed on understanding the perception of the consumers towardsthe brand (Ferreira, Avila & Faria, 2010). In this common market place, consumersand their preferences are more prone to the brand which can distinguish itselffrom others. In this perspective, considerable researches have been observed whereit is shown that how responsible practices of any corporation affect the consumerbehavior in the form of product evaluation (Brown & Dacin, 1997), purchasedecision (Brown & Dacin, 1997; Sen & Bhattacharya, 2001). Biehal and Sheinin(2007) also observed that responsible activities of any corporation directly andindirectly influence the consumers buying decision. This notoriously bolsters anample issue of discussion now-a-days regarding social responsiveness of anycompany towards its stakeholders. Perhaps, the concept of social responsibility ismore prevalent in recent times than before. Chung et al. (2015) observed thecontinuum of social performance that remains in the range of avoidance of adverseeffects to creation of favourable impact.According to Barone, Miyazaki and Taylor
Understanding the Responsible Marketing Vis-a-Vis AD led Marketing � 8583
(2000), consumers would like to prefer a brand that is involved in humane impetusto support a social cause in comparison to the other brands who do not actually infavour of it. Consumers evaluate a brand positively when it is associated with aresponsible activities performed towards the society (Lafferty & Goldsmith, 2005).For instance, it is found that consumers prefer to adhere themselves to a brandwhen it associates itself with a social cause. Nan and Heo (2007) observed thatconsumers elicit a positive attitude towards a brand which shows a responsiblebehaviour towards the society. Moreover, Chung et al. (2015) in their studydiscussed the role of CSR practices of any corporations to achieve corporate imagewhich in turn helps it to obtain customer satisfaction and that lead to develop andmaintain customer loyalty. Further, it is also observed that responsible practicesby any corporation helps to build trust amongst the consumers(Pivato , Misaniand Tencati ,2008). Hence,it has been observed that company doing societalspending enhances corporate image that enhances trust amongst the consumers.All these researches has shown that how the notion of CSR emerges as an importantmatter of discussion in the prevailing market scenario where traditional marketingtools falls short to convince the consumer decision making. This note is latelypicked up but finally taken into consideration by the corporate managers in theirboard room.
Researches have been observed where the comparison between the impact ofsocietal promotion and traditional promotion towards the sales performance iscarried out using time series data for different companies (Mandal &Banerjee,2015).None of the researches are found where year wise is made regardingthis. Thus, in this present study to understand the transition in the use of onlytraditional based marketing to promotion with a social cause for gaining businessperformance, we have focussed on year wise model to see the changes over theyears. Thus, we have utilised cross sectional observations for the same.
RESEARCH OBJECTIVES
i) a) To develop a relationship model between ‘business performancevariable’ either ‘sales’ or ‘profitability’ with the marketing expenditurevariable namely ‘advertisement expenditure’ and‘ societal expenditurevariable namely ‘social responsibility spending’ based on the crosssectional data for a year of the study period. This has been done withan objective to compare the contributions of traditional based marketingexpenditure on business performance with the societal basedexpenditure on business performance in each year and to analyse therelative changes over the period.
b) In our study we have not only developed the models to comparebetween business performance variable with any of the expenditurevariables but also focussed in knowing the change in both the
8584 � Sujata Banerjee and Kaushik Mandal
expenditures over the years and thus carried out comparison betweenthem over the years.
ii) a) We also attempted to compare the absolute expenditures made in‘advertisement expenditure’ and ‘social responsibility spending’ overthe years with the help of graphical presentation.
b) To make it more comparable, the ‘relative share of AD expenditure’and the ‘relative share of social responsibility spending’ in total of ADexpenditure and SRS made by all these companies have also beenobserved in all these years under period of study.
DATA COLLECTION
As the objective of our study is to build a year wise business performance modeland to make a comparison based on it, we have searched for the year wise crosssectional data of the variables related to ‘business performance’, ‘marketingexpenditure’ and ‘societal expenditure’ for available(data availability of all thesesmentioned variables) consumer firms from the Capitaline and Prowess databases.In this context, it is also to mention that the secondary data related to businessperformance (namely ‘sales’ and ‘profitability’’), expenses made towards promotionin marketing related activities (namely ‘Advertisement expenditure’) and societalexpenditure (namely ‘social responsibility spending’ which consists of the expensesfor making donations towards the society and giving compensation to theemployees) are available for eight companies only for the years 2003 to 2010. Thuseight companies whose data available are employed for our study are Dabur Ltd.,Jyothy Laboratories Ltd., Marico Ltd., Nirma Ltd., Voltas Ltd., Pidilite Ltd., GailLtd., Whirlpool Ltd., IOCL Ltd.
RESEARCH METHODOLOGY
1-a) To compare the impact of the expenses made by the company in the form of‘AD expenditure’ and ‘social responsibility spending’ on the business performancesay ‘sales’ and ‘Profitability’ year wise , regression analysis has been carried outwhere all such 8 companies together(Dabur Ltd., Jyothy Laboratories Ltd., MaricoLtd., Nirma Ltd., Voltas Ltd., Pidilite Ltd., Gail Ltd., Whirlpool Ltd., IOCL Ltd.)are taken together as an observation for the year say 2003. In this regard, to maintaina parity in the analysis, same 8 company’s data are taken into account for the years2004 to 2010.
Then for each particular year, two relationship models (as shown below) havebeen developed to know the variation in business performances as a result of thesaid expenditures :
Y = α+ β AD+ B SRS1 1 2
Understanding the Responsible Marketing Vis-a-Vis AD led Marketing � 8585
Y = α+ β AD+ B SRS2 1 2
Where,Y1 = SalesY2 = Reported Net Profit, AD = Advertisement ExpenditureSRS = Social Responsibility Spending�1 = change in sales due to change in Advertisement Expenditure,�1 = change in sales due to change in Social Responsibility Spending,,
b) By observing the values of regression co-efficients of both the spending, it ispossible to know the impact of each variables on business performance. Then, forthe purpose of making comparison in their influence on the dependent variable,the values of regression co-efficient of these expenditures are plotted on the linediagram over the years.
2- a) To compare the rate of change in ‘average AD expenditure’ with the rateof change in ‘average SRS’, average of absolute values of ‘AD expenditure’ andaverage of absolute values of ‘SRS’ of all such 8 companies are calculated for eachparticular year.
Average AD expenditure = 1 ,ni AD
n��
where, n = 1, 2 ... 8
Average SRS = 1ni SRS
n��
where, n = 1, 2, .., 8
b) To make it more comparable, the ‘relative share of AD expenditure’ and the‘relative share of social responsibility spending’ in total expenditure( which is thesum of ‘AD expenditure’ and ‘social responsibility spending’ ) are calculated foreach year of the study period.
AD expenditurerelative share of AD expenditure =
AD expenditure + social responsibility spending
social responsibility spendingrelative share of social responsibility spending =
AD expenditure + social responsibility spending
RESULT & DISCUSSION
Here in this section we will try to make the analysis by comparing the impact of‘AD expenditure’ and ‘Social responsibility spending’ on the ‘Sales’ as well as‘Profitability Status’ separately in each particular year.
8586 � Sujata Banerjee and Kaushik Mandal
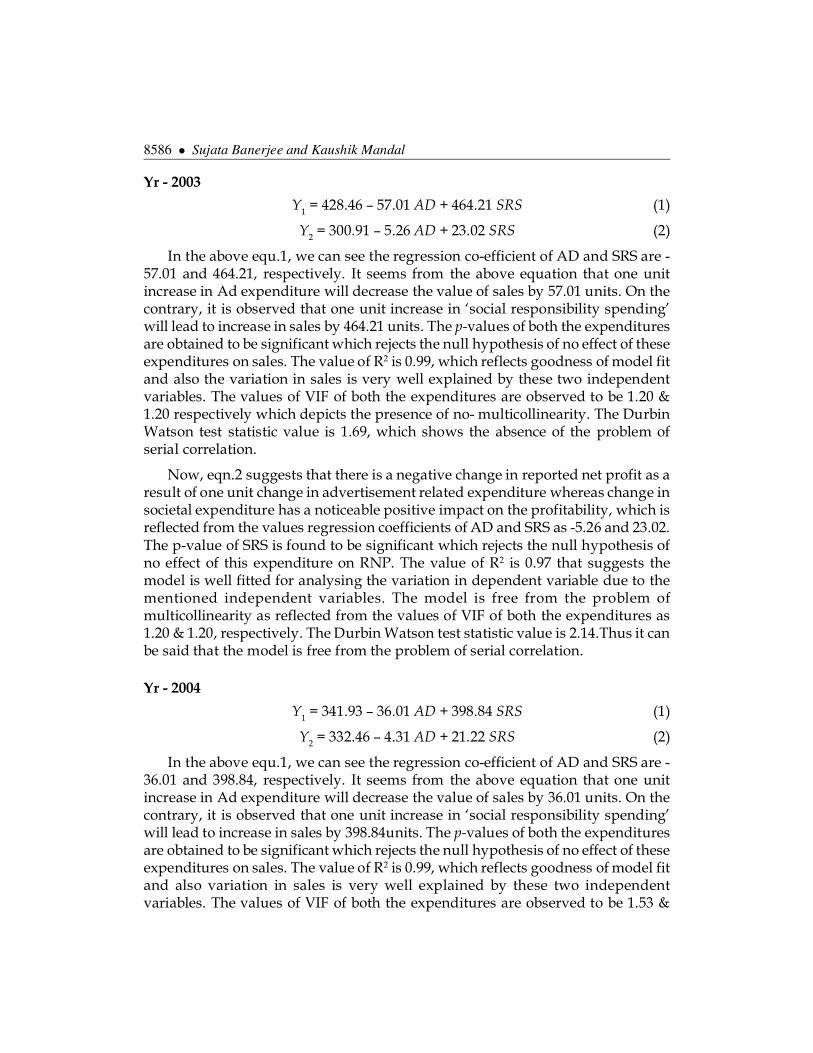
Yr - 2003
Y1 = 428.46 – 57.01 AD + 464.21 SRS (1)
Y2 = 300.91 – 5.26 AD + 23.02 SRS (2)
In the above equ.1, we can see the regression co-efficient of AD and SRS are -57.01 and 464.21, respectively. It seems from the above equation that one unitincrease in Ad expenditure will decrease the value of sales by 57.01 units. On thecontrary, it is observed that one unit increase in ‘social responsibility spending’will lead to increase in sales by 464.21 units. The p-values of both the expendituresare obtained to be significant which rejects the null hypothesis of no effect of theseexpenditures on sales. The value of R2 is 0.99, which reflects goodness of model fitand also the variation in sales is very well explained by these two independentvariables. The values of VIF of both the expenditures are observed to be 1.20 &1.20 respectively which depicts the presence of no- multicollinearity. The DurbinWatson test statistic value is 1.69, which shows the absence of the problem ofserial correlation.
Now, eqn.2 suggests that there is a negative change in reported net profit as aresult of one unit change in advertisement related expenditure whereas change insocietal expenditure has a noticeable positive impact on the profitability, which isreflected from the values regression coefficients of AD and SRS as -5.26 and 23.02.The p-value of SRS is found to be significant which rejects the null hypothesis ofno effect of this expenditure on RNP. The value of R2 is 0.97 that suggests themodel is well fitted for analysing the variation in dependent variable due to thementioned independent variables. The model is free from the problem ofmulticollinearity as reflected from the values of VIF of both the expenditures as1.20 & 1.20, respectively. The Durbin Watson test statistic value is 2.14.Thus it canbe said that the model is free from the problem of serial correlation.
Yr - 2004
Y1 = 341.93 – 36.01 AD + 398.84 SRS (1)
Y2 = 332.46 – 4.31 AD + 21.22 SRS (2)
In the above equ.1, we can see the regression co-efficient of AD and SRS are -36.01 and 398.84, respectively. It seems from the above equation that one unitincrease in Ad expenditure will decrease the value of sales by 36.01 units. On thecontrary, it is observed that one unit increase in ‘social responsibility spending’will lead to increase in sales by 398.84units. The p-values of both the expendituresare obtained to be significant which rejects the null hypothesis of no effect of theseexpenditures on sales. The value of R2 is 0.99, which reflects goodness of model fitand also variation in sales is very well explained by these two independentvariables. The values of VIF of both the expenditures are observed to be 1.53 &
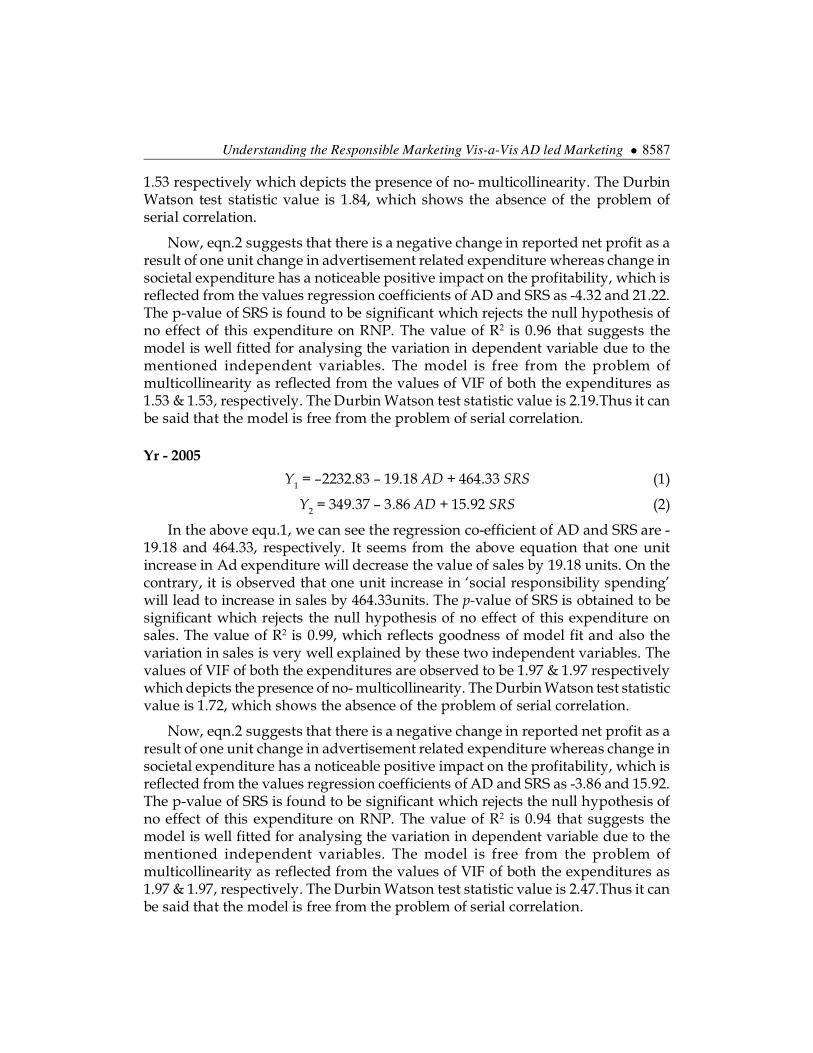
Understanding the Responsible Marketing Vis-a-Vis AD led Marketing � 8587
1.53 respectively which depicts the presence of no- multicollinearity. The DurbinWatson test statistic value is 1.84, which shows the absence of the problem ofserial correlation.
Now, eqn.2 suggests that there is a negative change in reported net profit as aresult of one unit change in advertisement related expenditure whereas change insocietal expenditure has a noticeable positive impact on the profitability, which isreflected from the values regression coefficients of AD and SRS as -4.32 and 21.22.The p-value of SRS is found to be significant which rejects the null hypothesis ofno effect of this expenditure on RNP. The value of R2 is 0.96 that suggests themodel is well fitted for analysing the variation in dependent variable due to thementioned independent variables. The model is free from the problem ofmulticollinearity as reflected from the values of VIF of both the expenditures as1.53 & 1.53, respectively. The Durbin Watson test statistic value is 2.19.Thus it canbe said that the model is free from the problem of serial correlation.
Yr - 2005
Y1 = –2232.83 – 19.18 AD + 464.33 SRS (1)
Y2 = 349.37 – 3.86 AD + 15.92 SRS (2)
In the above equ.1, we can see the regression co-efficient of AD and SRS are -19.18 and 464.33, respectively. It seems from the above equation that one unitincrease in Ad expenditure will decrease the value of sales by 19.18 units. On thecontrary, it is observed that one unit increase in ‘social responsibility spending’will lead to increase in sales by 464.33units. The p-value of SRS is obtained to besignificant which rejects the null hypothesis of no effect of this expenditure onsales. The value of R2 is 0.99, which reflects goodness of model fit and also thevariation in sales is very well explained by these two independent variables. Thevalues of VIF of both the expenditures are observed to be 1.97 & 1.97 respectivelywhich depicts the presence of no- multicollinearity. The Durbin Watson test statisticvalue is 1.72, which shows the absence of the problem of serial correlation.
Now, eqn.2 suggests that there is a negative change in reported net profit as aresult of one unit change in advertisement related expenditure whereas change insocietal expenditure has a noticeable positive impact on the profitability, which isreflected from the values regression coefficients of AD and SRS as -3.86 and 15.92.The p-value of SRS is found to be significant which rejects the null hypothesis ofno effect of this expenditure on RNP. The value of R2 is 0.94 that suggests themodel is well fitted for analysing the variation in dependent variable due to thementioned independent variables. The model is free from the problem ofmulticollinearity as reflected from the values of VIF of both the expenditures as1.97 & 1.97, respectively. The Durbin Watson test statistic value is 2.47.Thus it canbe said that the model is free from the problem of serial correlation.
8588 � Sujata Banerjee and Kaushik Mandal
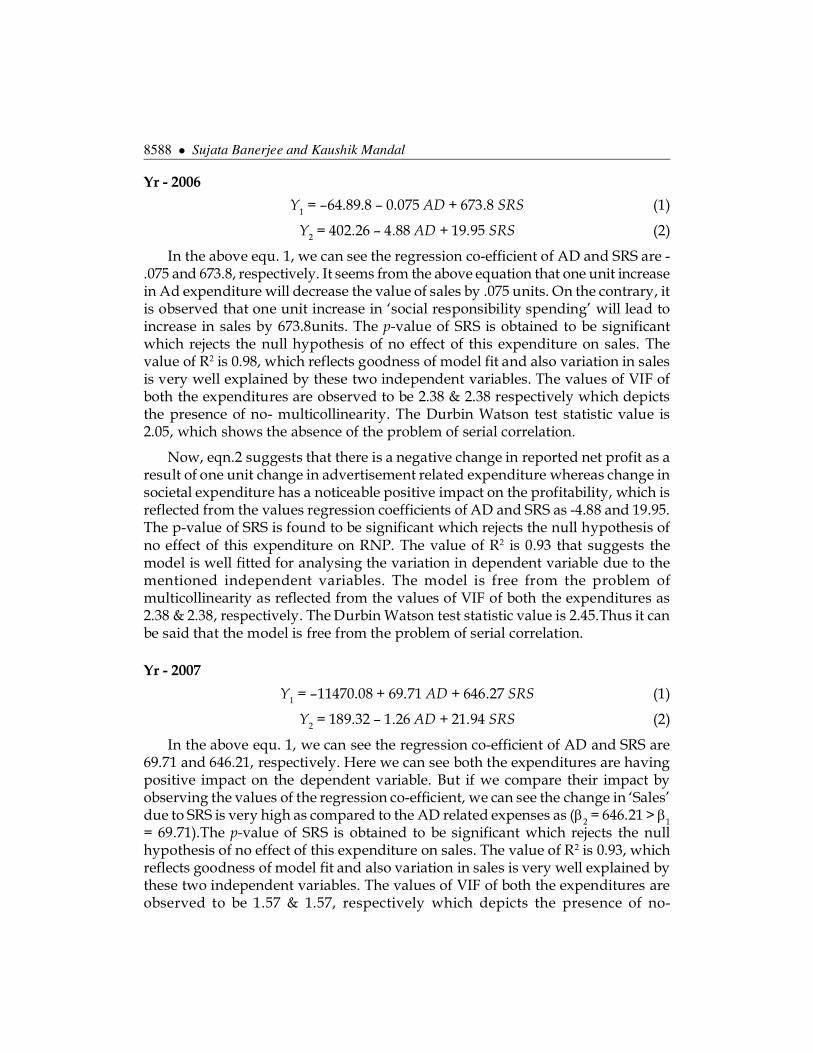
Yr - 2006
Y1 = –64.89.8 – 0.075 AD + 673.8 SRS (1)
Y2 = 402.26 – 4.88 AD + 19.95 SRS (2)
In the above equ. 1, we can see the regression co-efficient of AD and SRS are -.075 and 673.8, respectively. It seems from the above equation that one unit increasein Ad expenditure will decrease the value of sales by .075 units. On the contrary, itis observed that one unit increase in ‘social responsibility spending’ will lead toincrease in sales by 673.8units. The p-value of SRS is obtained to be significantwhich rejects the null hypothesis of no effect of this expenditure on sales. Thevalue of R2 is 0.98, which reflects goodness of model fit and also variation in salesis very well explained by these two independent variables. The values of VIF ofboth the expenditures are observed to be 2.38 & 2.38 respectively which depictsthe presence of no- multicollinearity. The Durbin Watson test statistic value is2.05, which shows the absence of the problem of serial correlation.
Now, eqn.2 suggests that there is a negative change in reported net profit as aresult of one unit change in advertisement related expenditure whereas change insocietal expenditure has a noticeable positive impact on the profitability, which isreflected from the values regression coefficients of AD and SRS as -4.88 and 19.95.The p-value of SRS is found to be significant which rejects the null hypothesis ofno effect of this expenditure on RNP. The value of R2 is 0.93 that suggests themodel is well fitted for analysing the variation in dependent variable due to thementioned independent variables. The model is free from the problem ofmulticollinearity as reflected from the values of VIF of both the expenditures as2.38 & 2.38, respectively. The Durbin Watson test statistic value is 2.45.Thus it canbe said that the model is free from the problem of serial correlation.
Yr - 2007
Y1 = –11470.08 + 69.71 AD + 646.27 SRS (1)
Y2 = 189.32 – 1.26 AD + 21.94 SRS (2)
In the above equ. 1, we can see the regression co-efficient of AD and SRS are69.71 and 646.21, respectively. Here we can see both the expenditures are havingpositive impact on the dependent variable. But if we compare their impact byobserving the values of the regression co-efficient, we can see the change in ‘Sales’due to SRS is very high as compared to the AD related expenses as (�2 = 646.21 > �1= 69.71).The p-value of SRS is obtained to be significant which rejects the nullhypothesis of no effect of this expenditure on sales. The value of R2 is 0.93, whichreflects goodness of model fit and also variation in sales is very well explained bythese two independent variables. The values of VIF of both the expenditures areobserved to be 1.57 & 1.57, respectively which depicts the presence of no-
Understanding the Responsible Marketing Vis-a-Vis AD led Marketing � 8589
multicollinearity. The Durbin Watson test statistic value is 2.45, which shows theabsence of the problem of serial correlation.
Now, eqn.2 suggests that there is a negative change in reported net profit as aresult of one unit change in advertisement related expenditure whereas change insocietal expenditure has a noticeable positive impact on the profitability, which isreflected from the values regression coefficients of AD and SRS as -1.26 and 21.94.The p-value of SRS is found to be significant which rejects the null hypothesis ofno effect of this expenditure on RNP. The value of R2 is 0.98 that suggests themodel is well fitted for analysing the variation in dependent variable due to thementioned independent variables. The model is free from the problem ofmulticollinearity as reflected from the values of VIF of both the expenditures as1.57 & 1.57, respectively. The Durbin Watson test statistic value is 2.43.Thus it canbe said that the model is free from the problem of serial correlation.
Yr - 2008
Y1 = –10245.34 + 56.75 AD + 559.07 SRS (1)
Y2 = 389.54 – 1.99 AD + 15.82 SRS (2)
In the above equ.1, we can see the regression co-efficient of AD and SRS are56.75 and 559.07, respectively. Here ,we can see both the expenditures are havingpositive impact on the dependent variable. But if we compare their impact byobserving the values of the regression co-efficient, we can see the change in ‘Sales’due to SRS is very high as compared to the AD related expenses as (�2 = 559.07 > �1= 56.75). The p-value of SRS is obtained to be significant which rejects the nullhypothesis of no effect of this expenditure on sales. The value of R2 is 0.98, whichreflects goodness of model fit and also the variation in sales is very well explainedby these two independent variables. The values of VIF of both the expendituresare observed to be 1.61 & 1.61, respectively which depicts the presence of no-multicollinearity. The Durbin Watson test statistic value is 2.29, which shows theabsence of the problem of serial correlation.
Now, eqn.2 suggests that there is a negative change in reported net profit as aresult of one unit change in advertisement related expenditure whereas change insocietal expenditure has a noticeable positive impact on the profitability, which isreflected from the values regression coefficients of AD and SRS as -1.99 and 15.82.The p-value of SRS is found to be significant which rejects the null hypothesis ofno effect of this expenditure on RNP. The value of R2 is 0.97 that suggests themodel is well fitted for analysing the variation in dependent variable due to thementioned independent variables. The model is free from the problem ofmulticollinearity as reflected from the values of VIF of both the expenditures as1.61 & 1.61, respectively. The Durbin Watson test statistic value is 2.51.Thus it canbe said that the model is free from the problem of serial correlation.
8590 � Sujata Banerjee and Kaushik Mandal
Yr - 2009
Y1 = –5170.99 + 22.69 AD + 480.56 SRS (1)
Y2 = 642.37 – 2.54 AD + 4.82 SRS (2)
In the above equ.1, we can see the regression co-efficient of AD and SRS are22.69 and 480.56, respectively. Here, we can see both the expenditures are havingpositive impact on the dependent variable. But if we compare their impact byobserving the values of the regression co-efficient, we can see the change in ‘Sales’due to SRS is very high as compared to the AD related expenses as (�2 = 480.56 > �1= 22.69). The p-value of SRS is obtained to be significant .The value of R2 is 0.99,which reflects goodness of model fit and also variation in sales is very wellexplained by these two independent variables. The values of VIF of both theexpenditures are observed to be 1.48 & 1.48, respectively which depicts the presenceof no- multicollinearity. The Durbin Watson test statistic value is 2.24, which showsthe absence of the problem of serial correlation.
Now, eqn.2 suggests that there is a negative change in reported net profit as aresult of one unit change in advertisement related expenditure whereas change insocietal expenditure has a noticeable positive impact on the profitability, which isreflected from the values regression coefficients of AD and SRS as -2.54 and 4.82.The p-value of SRS is found to be significant which rejects the null hypothesis ofno effect of this expenditure on RNP. The value of R2 is 0.62 that suggests themodel is well fitted for analysing the variation in dependent variable due to thementioned independent variables. The model is free from the problem ofmulticollinearity as reflected from the values of VIF of both the expenditures as1.48 & 1.48, respectively. The Durbin Watson test statistic value is 2.37.Thus it canbe said that the model is also free from the problem of serial correlation.
Yr – 2010
Y1 = 3092.31 – 10.60 AD + 205.87 SRS (1)
Y2 = 756.95 – 1.95 AD + 7.24 SRS (2)
In the above equ.1, we can see the regression co-efficient of AD and SRS are -10.60 and 205.87, respectively. It seems from the above equation that one unitincrease in Ad expenditure will decrease the value of sales by 10.60 units. On thecontrary, it is observed that one unit increase in ‘social responsibility spending’will lead to increase in sales by 205.87units. The p-value of SRS is obtained to besignificant. The value of R2 is 0.99, which reflects goodness of model fit and alsovariation in sales is very well explained by these two independent variables. Thevalues of VIF of both the expenditures are observed to be 1.47 & 1.47 respectivelywhich depicts the presence of no- multicollinearity. The Durbin Watson test statisticvalue is 2.42, which shows the absence of the problem of serial correlation.
Understanding the Responsible Marketing Vis-a-Vis AD led Marketing � 8591
Now, eqn.2 suggests that there is a negative change in reported net profit as aresult of one unit change in advertisement related expenditure whereas change insocietal expenditure has a noticeable positive impact on the profitability, which isreflected from the values regression coefficients of AD and SRS as -1.95 and 7.24.The p-value of SRS is found to be significant which rejects the null hypothesis ofno effect of this expenditure on RNP. The value of R2 is 0.94 that suggests themodel is well fitted for analysing the variation in dependent variable due to thementioned independent variables. The model is free from the problem ofmulticollinearity as reflected from the values of VIF of both the expenditures as1.47 & 1.47, respectively. The Durbin Watson test statistic value is 2.22.Thus it canbe said that the model is free from the problem of serial correlation.
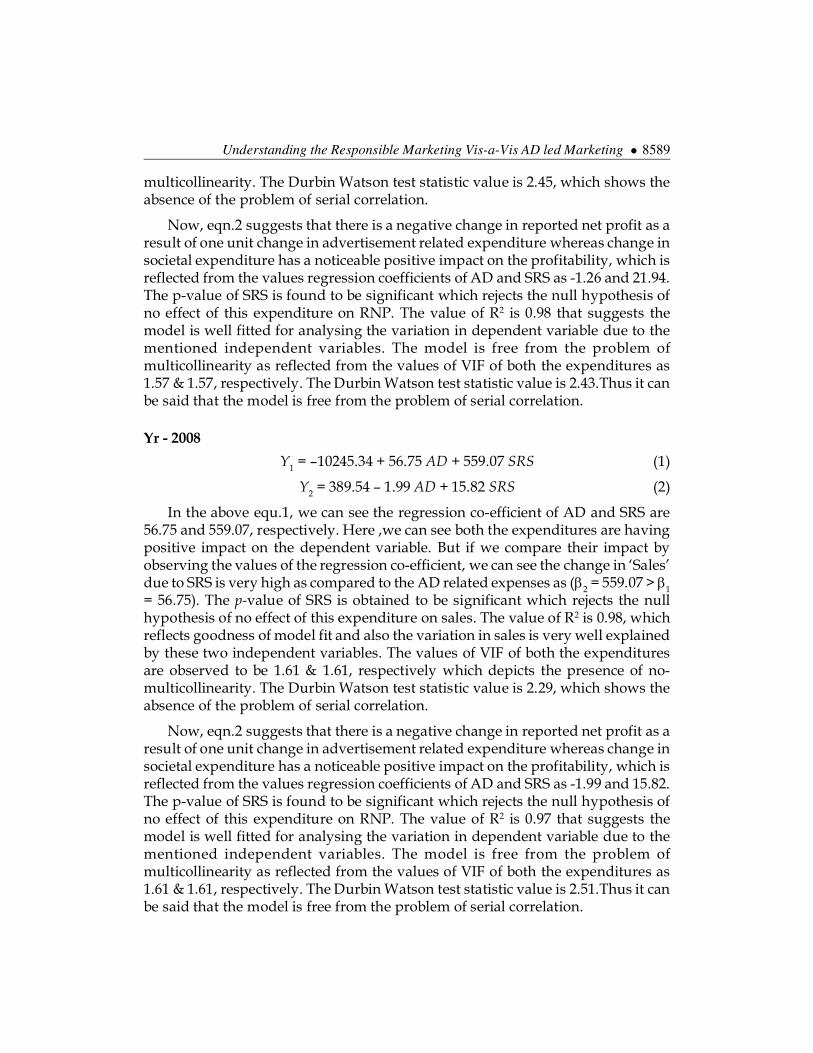
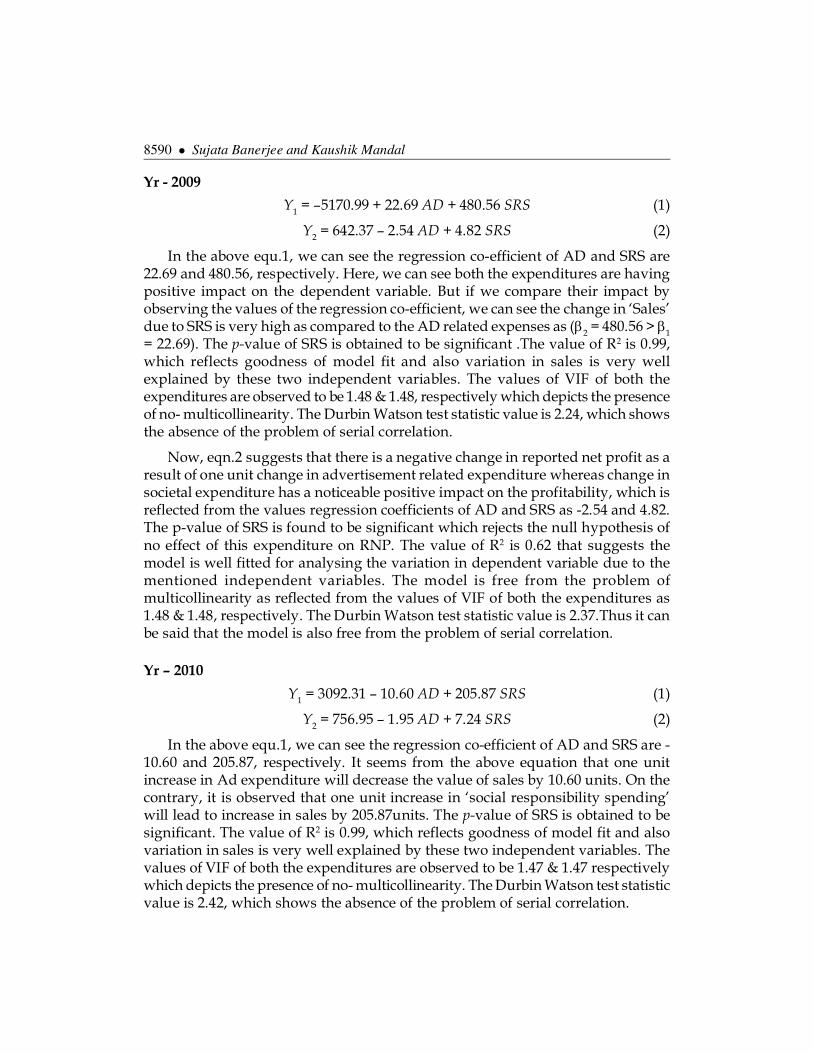
Moreover from the line diagram(fig.1), we can see that �(SRS) is much higherthan that of �(AD) in almost all the years under study when the dependent variableis ‘sales’ and same is the case when ‘reported net profit’ is considered as dependentvariable(shown in fig.2) . Thus, it seems that expenses made towards the societalissues are able to earn higher effect over the years than that of the expenses madetowards traditional marketing tool like advertisement.
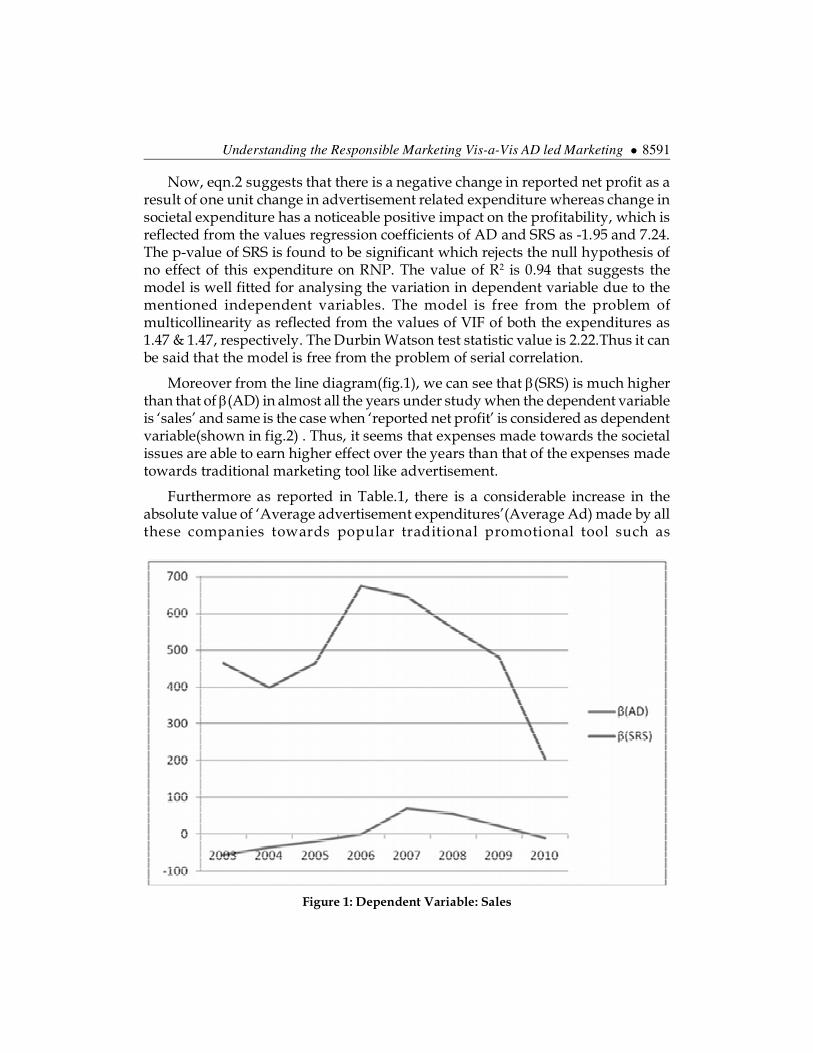
Furthermore as reported in Table.1, there is a considerable increase in theabsolute value of ‘Average advertisement expenditures’(Average Ad) made by allthese companies towards popular traditional promotional tool such as
Figure 1: Dependent Variable: Sales
8592 � Sujata Banerjee and Kaushik Mandal
Advertisement. Apparently, an increasing trend is also observed in case of spendingmade towards societal activities (average SRS). But, when comparing between themit is observed that average AD is found to be greater than average SRS for most ofthese years. In addition to this, ‘rate of change in average advertisementexpenditure’ as well as ‘rate of change in ‘average social responsibility spending’for all the companies in each particular year under consideration are taken intoaccount for further reference( shown in Fig.2). The mentioned figure shows thatthe ‘rate of change in Average advertisement expenditure’ is greater than ‘rate ofchange in ‘average social responsibility spending’ for the years 2003 to 2007 after
Figure 2: Dependent Variable: Reported net profit
Table 1
YR Av. AD Rate of Change Av. SRS Rate of Changein Av. AD in Av. SRS
2003 55.68 - 44.25 -2004 65.22 17.13 52.75 19.22005 73.83 13.2 54.89 4.052006 81.42 10.28 49.64 -9.562007 99.54 22.25 58.17 17.182008 112.71 13.23 73.98 27.172009 110.29 -0.021 101.27 36.882010 148.35 34.5 194 91.56
Understanding the Responsible Marketing Vis-a-Vis AD led Marketing � 8593
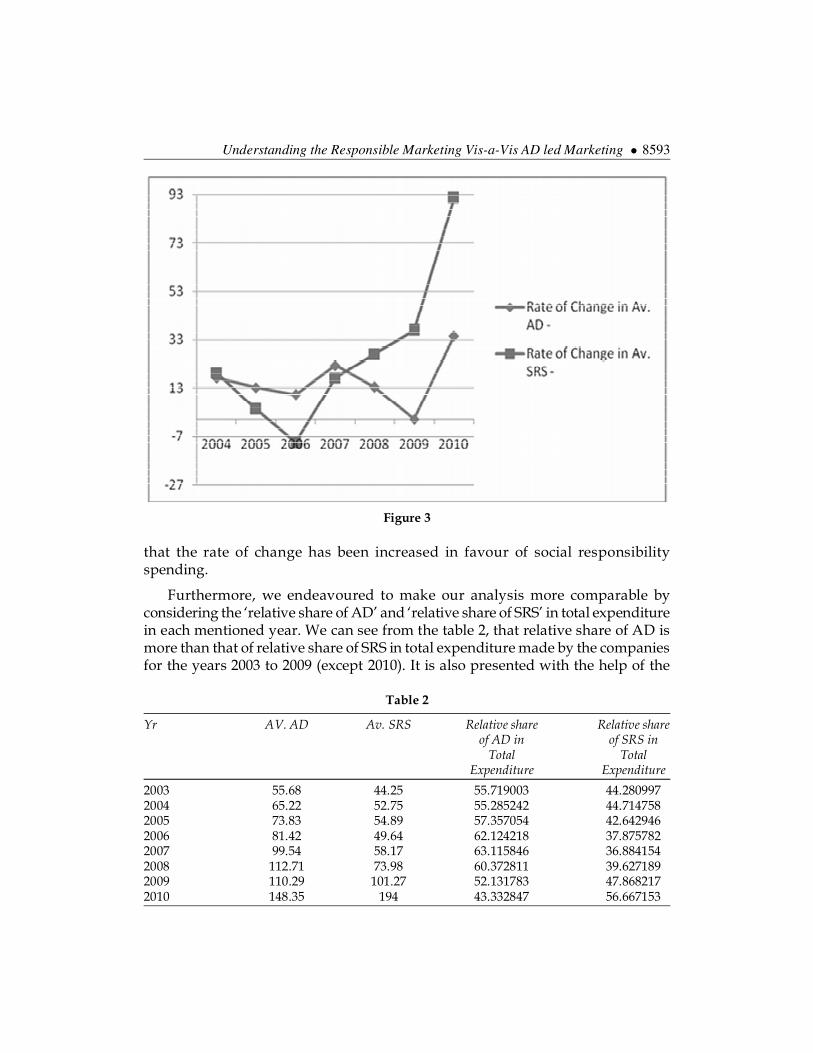
that the rate of change has been increased in favour of social responsibilityspending.
Furthermore, we endeavoured to make our analysis more comparable byconsidering the ‘relative share of AD’ and ‘relative share of SRS’ in total expenditurein each mentioned year. We can see from the table 2, that relative share of AD ismore than that of relative share of SRS in total expenditure made by the companiesfor the years 2003 to 2009 (except 2010). It is also presented with the help of the
Figure 3
Table 2
Yr AV. AD Av. SRS Relative share Relative shareof AD in of SRS in
Total TotalExpenditure Expenditure
2003 55.68 44.25 55.719003 44.2809972004 65.22 52.75 55.285242 44.7147582005 73.83 54.89 57.357054 42.6429462006 81.42 49.64 62.124218 37.8757822007 99.54 58.17 63.115846 36.8841542008 112.71 73.98 60.372811 39.6271892009 110.29 101.27 52.131783 47.8682172010 148.35 194 43.332847 56.667153
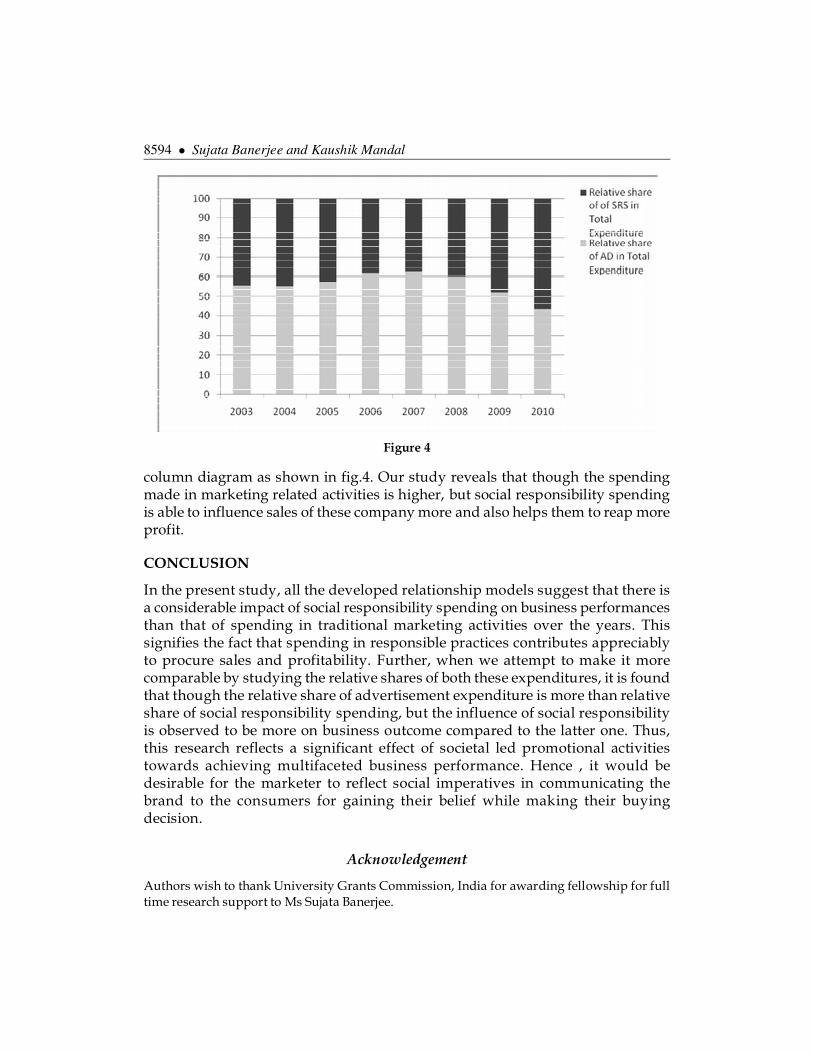
8594 � Sujata Banerjee and Kaushik Mandal
column diagram as shown in fig.4. Our study reveals that though the spendingmade in marketing related activities is higher, but social responsibility spendingis able to influence sales of these company more and also helps them to reap moreprofit.
CONCLUSION
In the present study, all the developed relationship models suggest that there isa considerable impact of social responsibility spending on business performancesthan that of spending in traditional marketing activities over the years. Thissignifies the fact that spending in responsible practices contributes appreciablyto procure sales and profitability. Further, when we attempt to make it morecomparable by studying the relative shares of both these expenditures, it is foundthat though the relative share of advertisement expenditure is more than relativeshare of social responsibility spending, but the influence of social responsibilityis observed to be more on business outcome compared to the latter one. Thus,this research reflects a significant effect of societal led promotional activitiestowards achieving multifaceted business performance. Hence , it would bedesirable for the marketer to reflect social imperatives in communicating thebrand to the consumers for gaining their belief while making their buyingdecision.
Acknowledgement
Authors wish to thank University Grants Commission, India for awarding fellowship for fulltime research support to Ms Sujata Banerjee.
Figure 4
Understanding the Responsible Marketing Vis-a-Vis AD led Marketing � 8595
ReferencesBarone, Michael J., Miyazaki, Anthony D. & Taylor, Kimberly A. (2000). The Influence of Cause-
Related Marketingon Consumer Choice: Does One Good Turn DeserveAnother? Journal ofthe Academy of Marketing Science, 28(2), 248–262.
Biehal, G. J. & Sheinin, D. A. (2007).The influence of corporate messages on the product portfolio,”Journal of Marketing, vol. 71, no. 2, pp. 12-25.
Brown, Tom J., & Dacin , P. A. (1997). The Company and the Product: Corporate Associationsand Consumer Product Responses. Journal of Marketing, 61 (1): 68-84.
Calfee, J. E , & Ringold, D. J. (1994). The seventy percent majonty Enduring consumer beliefsabout advertising Journal of Public Policy and Marketing, 13, 228-238.
Chung, Ki-Han., Yu, Ji-Eun., Choi, Myeong-Guk., & Jae-Ik Shin(2015). The Effects of CSR onCustomer Satisfaction and Loyalty in China: The Moderating Role of Corporate Image.Journal of Economics, Business and Management, Vol. 3, No. 5.
Dix, Steve & Phau, Ian (2010). Television Advertising Avoidance: Advancing ResearchMethodology. Journal of Promotion Management , publication details, including instructionsfor authors andsubscription information:http://www.tandfonline.com/loi/wjpm20 CurtinUniversity of Technology , Perth, Australia.
Du,S., Bhattacharya, C. B. & Sen, S. (2010).Maximizing business returns to corporate socialresponsibility (CSR): The role of CSRcommunication. International Journal of ManagementReviews, vol. 12, no. 1, pp. 8-19.
Elliott, Michael T., and Paul S. Speck (1998). Consumer Perceptions of Advertising Clutter and ItsImpact Across Various Media.Journal of Advertising Research, 38 (January/ February), 29–41.
Ferreira, D. Abrantes., Avila, Marcos Gonc., & Faria, M. D.(2010). Corporate social responsibilityand consumers’ perception of price. Social Responsibility Journal. Vol. 6 No. 2 2010, pp.208-221, Q Emerald Group Publishing Limited, ISSN 1747-1117.
Ha, Louisa (1996). Observations: Advertising Clutter in Consumer Magazines: Dimensions andEffects. Journal of Advertising Research, 36 (July/August), 76–84.
Hawkins, D., Best, Roger., Coney,K.A. & Mookerjee, A.(2007). Consumer Behaviour: Buildingmarketing Strategy. The Mcgraw Hill companies, 9th edition, special Indian edition.
James, William L., and Arthur J. Kover (1992). Observations:Do Overall Attitudes TowardAdvertising Affect Involvementwith Specific Advertisements? Journal of Advertising Research,32 (September/October), 78–83.
Kotlar, P. & Armstrong,G.(2008). Principles of Marketing. Pearson Prentice Hall, PearsonInternatioal Edition,12th edition.
Krugman, Herbert E. (1983). Television Program Interest and Commercial Interruption: AreCommercials on Interesting Programs Less Effective? Journal of Advertising Research,23,(February/March), 21–23.
Speck, Paul S. & Elliott , Michael T. (1997). Predictors of Advertising Avoidance in Print andBroadcast Media. Journalof Advertising, 26 (Fall), 61–76.
Lafferty, Barbara A., & Goldsmith, Ronald E. (2005).Cause–Brand Alliances: Does the CauseHelp the Brand or Does the Brand Help the Cause? Journal of Business Research, 58 (4), 423–429.
8596 � Sujata Banerjee and Kaushik Mandal
Mandal, K. ,& Banerjee, S.(2015). Is ‘Societal Expenditure’ an Alternative Route to BusinessSuccess? An Empirical Study. Journal of Advanced Management Science , 3( 1).
Nan, Xiaoli.& Heo, Kwangjun.(2007). Consumer Responses to Corporate Social Responsibility(CSR) Initiatives. Journal of Advertising, vol. 36, no. 2 (Summer 2007), pp. 63–74.
Obermiller, C & Spangenberg, E.R.(1998). Development of a Scale to Measure ConsumerSkepticismToward Advertising. Journal of Consumer Psychology, 7(2), 159-186.
Pivato,S., Misani, N.,& Tencati,A.(2008). The impact of corporate social responsibility onconsumer trust: the case of organic food. Business Ethics: A European Review, Volume 17Number 1 .
Sen, S., & Bhattacharya, C. B. (2001). Does Doing Good Always Lead to Doing Better?ConsumerReactions to Corporate Social Responsibility. Journal of Marketing Research (JMR), 38 (2):225-243.
Walker, J. R. & Bellamy Jr., R. V. (eds.) (1993a). The Remote Control in the New Age of Television(first ed.). Westport, CT: Praeger.