Understanding the Relationship Between Nutritional Status ...
65
Trinity University Digital Commons @ Trinity Sociology and Anthropology Honors eses Sociology and Anthropology Department 4-21-2010 Understanding the Relationship Between Nutritional Status, Obesity, and Academic Achievement Hannah Schmunk Trinity University, [email protected] Follow this and additional works at: hp://digitalcommons.trinity.edu/socanthro_honors Part of the Anthropology Commons is esis open access is brought to you for free and open access by the Sociology and Anthropology Department at Digital Commons @ Trinity. It has been accepted for inclusion in Sociology and Anthropology Honors eses by an authorized administrator of Digital Commons @ Trinity. For more information, please contact [email protected]. Recommended Citation Schmunk, Hannah, "Understanding the Relationship Between Nutritional Status, Obesity, and Academic Achievement" (2010). Sociology and Anthropology Honors eses. 1. hp://digitalcommons.trinity.edu/socanthro_honors/1
Transcript of Understanding the Relationship Between Nutritional Status ...

Trinity UniversityDigital Commons @ Trinity
Sociology and Anthropology Honors Theses Sociology and Anthropology Department
4-21-2010
Understanding the Relationship BetweenNutritional Status, Obesity, and AcademicAchievementHannah SchmunkTrinity University, [email protected]
Follow this and additional works at: http://digitalcommons.trinity.edu/socanthro_honors
Part of the Anthropology Commons
This Thesis open access is brought to you for free and open access by the Sociology and Anthropology Department at Digital Commons @ Trinity. Ithas been accepted for inclusion in Sociology and Anthropology Honors Theses by an authorized administrator of Digital Commons @ Trinity. Formore information, please contact [email protected].
Recommended CitationSchmunk, Hannah, "Understanding the Relationship Between Nutritional Status, Obesity, and Academic Achievement" (2010).Sociology and Anthropology Honors Theses. 1.http://digitalcommons.trinity.edu/socanthro_honors/1

Understanding the Relationship
Between Nutritional Status,
Obesity, and Academic Achievement By Hannah Schmunk
A DEPARTMENT HONORS THESIS SUBMITTED TO THE
DEPARTMENT OF _Sociology and Anthropology_ AT TRINITY UNIVERSITY
IN PARTIAL FULFILLMENT OF THE REQUIREMENTS FOR GRADUATION WITH
DEPARTMENTAL HONORS
DATE April 21, 2010 ______
____________________________ ________________________________
THESIS ADVISOR DEPARTMENT CHAIR
_________________________________________________
ASSOCIATE VICE PRESIDENT FOR ACADEMIC AFFAIRS,
CURRICULUM AND STUDENT ISSUES
Student Copyright Declaration: the author has selected the following copyright provision: This thesis is licensed under the Creative Commons Attribution-NonCommercial-NoDerivs License, which allows
some noncommercial copying and distribution of the thesis, given proper attribution. To view a copy of this license,
visit http://creativecommons.org/licenses/ or send a letter to Creative Commons, 559 Nathan Abbott Way, Stanford,
California 94305, USA.

1
Understanding the Relationship
Between Nutritional Status,
Obesity, and Academic Achievement
Hannah Schmunk Sociology Honors Thesis
2009-2010

2
TABLE OF CONTENTS
Introduction……………………………………………………………………………………….3
Methods…………………………………………………………………………………………..10
The Quantitative Measures………………………………………………………………10
The Qualitative Measures………………………………………………………………..13
Data Analysis…………………………………………………………………………………….14
Discussion………………………………………………………………………………………..36
Conclusion……………………………………………………………………………………….42
Appendix………………………………………………………………………………………....45
References………………………………………………………………………………………..62
3
INTRODUCTION
In addition to the worst economic crisis in several generations, two other societal
―epidemics‖ have recently received broad public attention: the failure of the American
educational system, with one out of six students dropping out of school before graduation (The
White House 2010), and the expanding obesity rate. This research paper explores connections
between the two.
The United States is facing a serious public health problem. A mere two percent of
children meet the daily recommendations in the Dietary Guidelines for Americans for consuming
foods from all five categories in the Food Pyramid. Children are not eating healthy, well-
balanced diets and, as a result, there is a rising incidence of malnutrition (Schafft 2009).
According to the United States Department of Agriculture, childhood obesity has reached
―epidemic proportions‖ with 4.7 million individuals, ages 6 to 17, currently considered
overweight or obese. Research indicates that children who are overweight or obese have a
greater likelihood of suffering from high blood pressure, high cholesterol, diabetes, heart disease,
stroke, cancer, and various other illnesses (USDA 2010). In addition, a recent study in the New
England Journal of Medicine claims that the average life expectancy of today’s children may
decrease by two to five years due to obesity-related health problems. This would represent the
first reversal in the steady rise in life expectancy of Americans over the past two hundred years
and would result in the first downwardly mobile generation (Ludwig 2007).
The rise in overweight and obesity rates in the United States is socially and
environmentally related and research has demonstrated that these rates are higher in low-income
communities (Hofferth 2005). Poverty on the global level is usually associated with underweight
as a result of poor diet and lack of sufficient food. Thus, researchers’ recent discovery may

4
come as a surprise: low income and obesity coexist in the United States. Paradoxically, poverty
and limited food access is associated with increased rates of obesity (Hofferth 2005).
Diet is a major determinant of body mass index and overweight/obesity status. Obesity is
measured using body mass index (BMI) which is calculated as weight in kilograms divided by
the square of height in meters. While various definitions of ―overweight‖ and ―obesity‖ exist, the
American Obesity Association defines overweight for adolescents, ages 13-17, as body mass
index greater than 25 or body mass index greater than the 85th
percentile of the population.
Obesity is defined as body mass index greater than 30 or body mass index over the 95th
percentile (Taras & Potts-Datema 2005).
Malnutrition affects every organ system in the body and causes impairment of physical
growth, immune response, and cognitive functioning. Weakened immune systems make children
more susceptible to severe and chronic infections which further exacerbate nutritional problems.
Thus, malnourishment detracts from school attendance. Additionally, malnourished children
suffer from slow rates of brain development, low brain weight, a thin cerebral cortex, decreased
numbers of neurons, deficient myelinization, changes in dendritic spines, etc. (Shashidhar 2009).
Malnutrition has significant and enduring effects on the neurological development and
behavioral capacity of children. Children who do not eat a balanced diet, even for a short time,
can develop problems with their physical, emotional, and cognitive development. Research
indicates that even mild malnutrition experienced by children during critical periods of growth
can impair their behavior and school performance (The Hunger Site 1999).
Accordingly, malnourished children may never reach their full intellectual or educational
potential (Greene 1977). One century ago, muckraker Robert Hunter expressed his concern for
malnourished children in school. His argument is still valid today:

5
" . . . but the poverty of any family is likely to be most serious at the very time
when the children most need nurture, when they are most dependent, and when
they are obtaining the only education which they are ever to receive … Learning
is difficult because hungry stomachs and languid bodies and thin blood are not
able to feed the brain. The lack of learning among so many poor children is
certainly due, to an important extent, to this cause … It is utter folly, from the
point of view of learning, to have a compulsory school law which compels
children, in that weak physical and mental state which results from poverty, to
drag themselves to school and to sit at their desks, day in and day out, for several
years, learning little or nothing. If it is a matter of principle in democratic
America that every child shall be given a certain amount of instruction, let us
render it possible for them to receive it, as monarchial countries have done, by
making full and adequate provision for the physical needs of the children who
come from the homes of poverty‖ (1904).
Nutritional status, which encompasses malnutrition, has a profound influence on
educational progress. Previous literature suggests that ―nutrition is an endogenous factor that
affects learning ability and skills before and after the child is in school‖ (Pollit 1984: 7).
Children who consume insufficient, excessive, or imbalanced quantities of nutrients are more
likely to struggle in an academic setting. They are at an educational disadvantage which
compounds through the years of childhood and adolescence and can conceivably cause children
to have lower levels of aspiration, accomplishment, and even intelligence.
Research consistently demonstrates that overweight and obese children are more likely to
have low self-esteem and have higher rates of anxiety disorders, depression, and distress. These
mental health conditions are thought to be the ―mediating factors for an overweight or obese
child to score poorly in school‖ (Taras & Potts-Datema 2005: 292).
According to early sociologist Charles Horton Cooley, obesity is not only a health
condition but also a social status. In his book Human Nature and the Social Order (1902),
Cooley claims that individuals’ self-concepts are dependent on how others view them and how
their characteristics agree with collective norms. This theory is similar to the ―looking glass
self.‖ Cooley explains that ―the lack of fit between an individual’s characteristics and larger

6
normative structures typically hampers adjustment and functioning‖ (Crosnoe & Muller 2004:
394). Obesity is currently a socially stigmatized trait that generates negative feedback during
adolescence. This negative feedback can be internalized, leaving an individual feeling sad or
depressed. In today’s society obese individuals are often considered less desirable than their
non-obese counterparts and, consequently, they are more apt to develop a low self-esteem and
become socially isolated. The stigmatized nature of obesity has the potential to hinder successful
functioning and previous research indicates that the stigma of obesity is greatest among
adolescents (Ross 1994).
Robert Crosnoe states, ―Responses to the stigma of obesity set the stage for truncated
trajectories of educational attainment in the long run‖ (Crosnoe 2007: 243). Several studies
show that obese students tend to achieve lower grades than their non-obese peers. Crosnoe
acknowledges that, while no consistent evidence links obesity with intelligence, its flagrant
devaluation in American society may be a reason for the relationship between obesity and poor
academic performance. Lower academic achievement can inhibit success later in life, thus
disrupting long-term status attainment. Social status influences health, as it affects lifestyle,
access to health care, physical environment, and diet. Consequently, obesity can ―produce
economic inequality and exacerbate health inequality between obese and non-obese individuals‖
(Crosnoe 2007: 242).
While reasons for the obesity epidemic are wide-ranging, the fatty lunches, sugary soft
drinks, and fast-food items that are commonplace in schools are partly to blame. The National
School Lunch Program is a federally-assisted meal program established under the National
School Lunch Act of 1946. The program operates in over 101,000 public and non‐profit private
schools and residential child care institutions. In 2008, it provided reduced cost or free lunches

7
to more than 30.5 million children every school day (USDA 2009). The United States
Department of Agriculture claims that the National School Lunch Program provides nutritionally
balanced lunches, stating:
―School lunches must meet the applicable recommendations of the 1995 Dietary
Guidelines for Americans, which recommend that no more than 30 percent of an
individual's calories come from fat, and less than 10 percent from saturated fat.
Regulations also establish a standard for school lunches to provide one third of the
Recommended Dietary Allowances of protein, Vitamin A, Vitamin C, iron, calcium, and
calories. School lunches must meet Federal nutrition requirements, but decisions about
what specific foods to serve and how they are prepared are made by local school food
authorities‖ (USDA 2009).
Unfortunately many studies have established that the school lunch program meals often
fail to meet nutrition requirements and have an especially high fat content. Research has
demonstrated that ―students who eat school lunches are more likely to be overweight than their
classmates who brown bag their lunch‖ (Schanzenbach 2005: 1). According to one study,
children who eat school lunch consume 40 to 120 more calories each day at lunch compared to
children who bring their own lunch. Over time these additional calories increase the incidence of
overweight and obesity. (Schanzenbach 2005). Thus, many believe that the National School
Lunch Program has contributed to the childhood obesity epidemic.
Lunches in some schools have higher levels of sugar, fat, and salt than others, and this
irregularity is not arbitrary. On a macro level, democratic political theory prescribes equal
opportunity for all citizens. Furthermore, public education in the United States has long
promised equal education for all children, regardless of ethnicity, race, or income. It is apparent,
however, that opportunities for learning are unequal in the United States. Simply stated, the
quality of education available to some children is better than what is available to others, and the
same goes for the quality of school lunch. This inequality is not random. Children from lower-
and working-class families attend inferior schools compared to those of the middle and upper
8
classes. Money and resources are differentially allocated to schools serving different social
classes. The discrepancy in resources among schools places poor students at a major
disadvantage. Not only do their schools have fewer funds for materials, programs, and
equipment, but they have less money to spend on healthy food options.
Children of affluent families are able to spend more money at lunch time, allowing their
schools to make a profit and offer more expensive, healthy foods. In contrast, children from
poor families qualify for free or reduced lunches, meaning their schools do not make a profit on
meals served. Instead, they are reimbursed for the meals by the government. While wealthy
schools are increasingly able to offer organic foods costing 30 percent more than conventionally
produced food, many low-income schools can barely afford to provide a meal that meets federal
nutritional guidelines (Organic Authority 2010). The inequality in meals served between
wealthy and poor school districts sends a very negative message: poor students are not worth a
healthy meal. While the school system is willing to sustain their lives, they are not willing to
provide a nutritious meal that will provide the energy necessary for optimal learning and
productive behavior. This is a variation of structural violence that exemplifies Karl Marx’s
conflict theory. The school is a culprit in maintaining an established pattern of stratification in a
new economic era of cognitive labor. This educational disadvantage is compounded through the
years of childhood and can cause children to have lower levels of aspiration, accomplishment,
and even intelligence.
In order to make ends meet, cash-strapped schools make controversial deals with fast-
food vendors. These arrangements further contribute to the nutritional disadvantage of poorer
children. The percentage of school funding that comes from the federal government hovers
around 10 percent, leaving 90 percent of a huge budget to local and state sources. For the most

9
part, this funding comes from property taxes, leaving schools in low-income neighborhoods to
search for alternative sources of funding. Commercial contracts have become a common way for
gaining funds and acquiring suitable technology and equipment (PBS 2002).
Commercialism in schools has increased nearly four times in the past decade. Critics and
some parents are concerned about what this teaches ―the so-called fast-food generation‖ (PBS
2002: 1). Other parents, teachers, and administrators support such sponsorship as it provides a
good source of money for impoverished schools. Schools are forced to make tough decisions.
For some schools, the decision comes down to selling soda and candy bars or doing without
software, offering yet another example of Marx’s conflict theory. Contracts and vending-
machine deals provide a large source of income for schools while also contributing to the high
rates of overweight and obesity among children and adolescents. The Center for Disease Control
conducted a School Health Policies and Programs Study (SHPPS) in 2000 where they surveyed
state education agencies, school districts, and food service representatives. Results indicated that
half of all school districts have soft drink contracts and one third of schools allow advertising for
food and drinks in their buildings. Furthermore, approximately 56 percent of elementary schools
and 93 percent of high schools allow students to purchase soft drinks in vending machines,
cafeterias, or school stores (Taras 2005). While 50 percent of high schools in the United States
offer chocolate candy for sale, only a mere 18 percent of high schools offer fruits and vegetables
for sale (PBS 2002). The food and drinks served in vending machines and a la carte lines
undermine efforts to improve the health of the school environment. Childhood nutrition could be
greatly improved by eliminating sugary drinks and fatty snacks from school vending machines or
by getting rid of vending machines all together.

10
Few research studies have examined the relationship between nutritional status, obesity,
and school performance. Currently, there is a lack of understanding about the causal connections
between obesity and poor academic performance. The first step in understanding this causal
connection is to establish a basic correlation that takes into account differences in student
economic disadvantages. This is the intent of the present study.
It is hypothesized that the social class, nutritional status, school meal programs, and
physical fitness of children have a major influence on their academic performance. The study’s
independent variables are: percent of students considered economically disadvantaged
(equivalent to the percent of students who qualify for free or reduced school lunch), estimated
percent of students considered overweight or obese, quality of meals served in the school lunch
program, and Healthy Fitness Zone (HFZ) achievement. The study’s dependent variable is
academic performance which is measured by attendance rate, TAKS scores, TSI scores, and
percent at-risk.
METHODS
To explore the connections between social class, nutritional status, school meal programs,
physical fitness of children, and academic achievement, multiple methodologies—both
quantitative and qualitative—are triangulated.
The Quantitative Measures
Data for this research was drawn from the Texas Education Agency (TEA), which
provided data from each Bexar County school district for the 2007-2008 school year. The school
district-level information provided by the TEA includes the total number of students, racial
composition, attendance rate, percent of students considered to be ―economically

11
disadvantaged,‖ percent of students considered to be ―at-risk,‖ food service expenditures, Texas
Assessment of Knowledge and Skills (TAKS) scores, TAKS exit-level pass rates, Texas Success
Initiative (TSI) Higher Education Readiness Component scores, and physical fitness data. The
agency employs thirteen criteria to identify students as ―at-risk,‖ outlined in the Texas Education
Code as the following:
1. Students who fail to advance to the next grade level for one or more years.
2. Students in grades 7-12 who receive a grade of less than 70 (out of a 100) in two or more
curriculum subjects in the current or preceding year.
3. Students who did not meet satisfactory performance levels on state administered tests
(TAKS).
4. Students in PK, K, or grades 1-3 who did not perform at a satisfactory level on the
readiness test.
5. Students who are pregnant or who are parents.
6. Students placed in alternative education programs during the current or preceding year.
7. Students who were expelled in the current or preceding year.
8. Students on parole, probation, deferred prosecution or conditional release.
9. Students who had previously dropped out.
10. Students with Limited English Proficiency.
11. Students in or who have been referred to the Department of Protective or Regulatory
Services.
12. Students who are homeless.
13. Students who were in or are currently in residential treatment facilities.
*Note there is no criteria regarding family income or socioeconomic status.
The Texas Education Agency defines students as ―economically disadvantaged‖ if they
receive free or reduced-price school lunches, or if they qualify for other public assistance.
Students are eligible for free lunches if their family income is less than 130 percent of the federal
poverty level. Students are eligible for reduced-price lunches if their family income falls
between 130 percent and 185 percent of the federal poverty level. The federal poverty level is
published each year by the United States Department of Health and Human Services (HHS). For
a family of four in 2009-2010 the poverty level is $22,050. Thus, a child from a family of four
qualifies for reduced-price lunch if his/her family income falls between $28,665 and $40,793 and
a child qualifies for free lunch if his/her family income is less than $28,665.

12
Scores from the Texas Assessment of Knowledge and Skills (TAKS) and the Texas
Success Initiative (TSI) were used to evaluate the academic performance of students in each
Bexar County school district. The TAKS is a standardized test administered to public school
students in grades 3 through 11. The TAKS measures the extent to which a student has learned,
understood, and is able to apply the concepts and skills expected at each grade level. Students
are assessed in reading, writing, math, science, and social studies. The TSI is a program that
evaluates a student’s ability to be successful in college. It includes a testing component designed
to measure the reading, mathematics, and writing skills of each student. Students who fail a
section of the assessment are required to work with an advisor to develop a plan for academic
success and must retest all failed sections. Students are required to meet TSI requirements
before graduation.
Physical fitness data was collected from the Physical Fitness Assessment Initiative
(PFAI) mandated by the Texas Education Agency. The PFAI program is designed to collect
physical fitness data from all Texas students enrolled in grades 3 through 12 and, while many
variables are involved in this assessment, this study utilizes the variable ―percent not achieving
HFZ on any assessment‖ to measure physical fitness. The Healthy Fitness Zone (HFZ) is a
standard established by The Cooper Institute of Dallas, Texas, which represents a minimum level
of fitness sufficient to protect against the various diseases that result from sedentary living.
Thus, this study defines students who cannot achieve the HFZ standard as physically unfit.
In its original form, the PFAI data was aggregated by campus, grade, and gender for the
2007-2008 school year. In order to obtain statistics on the district level, male and female data for
each grade level was combined and then converted from grade level to school level. Lastly, all
school campuses were averaged, thus creating a dataset that evaluates the physical fitness on the

13
district level. In the original dataset, aggregates with less than five total students were masked
(to protect the privacy of individual students) and were documented as ―< 5.‖ For the purpose of
this study, aggregates with less than five total students were converted to 2.5, the midpoint.
In any secondary research analysis, the researcher lacks control over how information is
collected and presented. Thus, reliability and validity of the current study is dependent on the
original studies performed by the Texas Education Agency. Any errors that may have occurred
in collecting and reporting information have the potential to reduce the measurement validity of
this study. Fortunately, no clear errors have been identified in these datasets.
The Qualitative Measures
Three face-to-face interviews were conducted with the district level Director of Food
Services in order to acquire information on obesity rates within the school districts and to
understand the effect school lunch programs possibly have on the academic achievement of San
Antonio school children. Interviews were conducted at Randolph Field, Boerne, and Harlandale
Independent School Districts, involving a total of approximately four hours of interview time.
Boerne and Harlandale Independent School Districts were selected on the basis of their
exceptionally low and high percentages of economically disadvantaged students. Randolph Field
Independent School District was selected for an interview due to its status as a military
installation, meaning it serves the dependents of active duty members of the military.
Furthermore, a large portion of the district’s student population lives on the Randolph Field Air
Force Base.
Admittedly, interviews can be low in reliability, and their validity is dependent on the
knowledge, objectivity, and candor of the respondent. According to the Halo Effect, respondents
may give inaccurate responses in an attempt to impress or please the researcher. It is possible
14
that the respondents exaggerated the quality and success of their programs, however there is no
way to know the extent to which the participants responded in ways they presumed would please
the interviewer. Nevertheless, no methodological problems have been identified.
In addition, on-site observations were made of the surrounding areas of three high
schools within the school districts selected for interviews. The proximity of fast-food
restaurants, especially, was documented.
DATA ANALYSIS
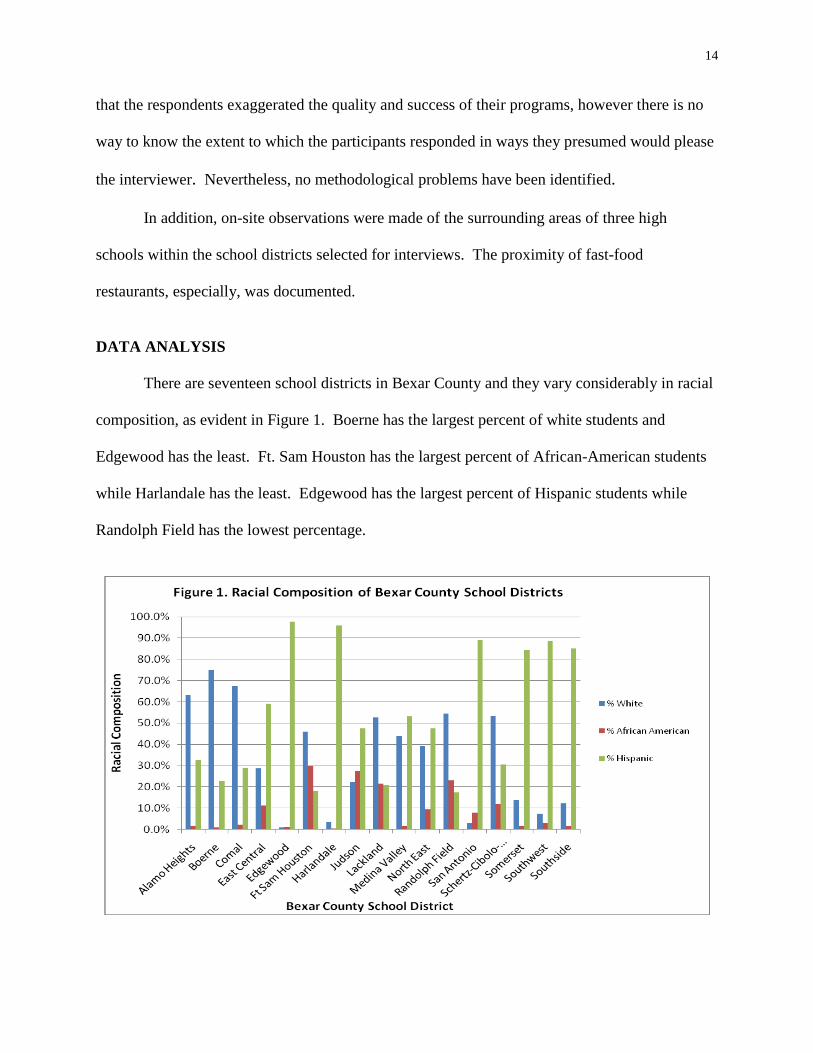
There are seventeen school districts in Bexar County and they vary considerably in racial
composition, as evident in Figure 1. Boerne has the largest percent of white students and
Edgewood has the least. Ft. Sam Houston has the largest percent of African-American students
while Harlandale has the least. Edgewood has the largest percent of Hispanic students while
Randolph Field has the lowest percentage.
15
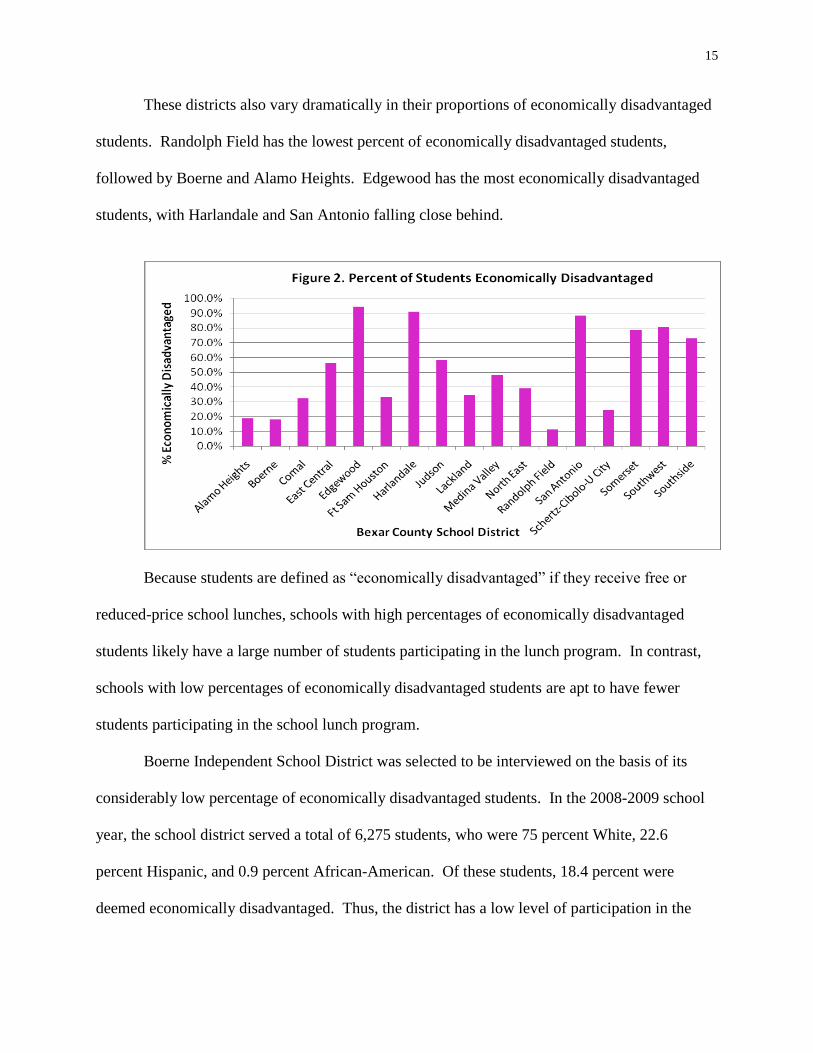
These districts also vary dramatically in their proportions of economically disadvantaged
students. Randolph Field has the lowest percent of economically disadvantaged students,
followed by Boerne and Alamo Heights. Edgewood has the most economically disadvantaged
students, with Harlandale and San Antonio falling close behind.
Because students are defined as ―economically disadvantaged‖ if they receive free or
reduced-price school lunches, schools with high percentages of economically disadvantaged
students likely have a large number of students participating in the lunch program. In contrast,
schools with low percentages of economically disadvantaged students are apt to have fewer
students participating in the school lunch program.
Boerne Independent School District was selected to be interviewed on the basis of its
considerably low percentage of economically disadvantaged students. In the 2008-2009 school
year, the school district served a total of 6,275 students, who were 75 percent White, 22.6
percent Hispanic, and 0.9 percent African-American. Of these students, 18.4 percent were
deemed economically disadvantaged. Thus, the district has a low level of participation in the

16
school lunch program. The district’s expenditures on food services totaled $2,285,243, which is
$367 per student. This is equivalent to 4.1 percent of the district’s total annual expenditures.
In contrast, Harlandale Independent School District was chosen to be interviewed due to
its especially large percentage of economically disadvantaged students. The racial make-up of
the students in the district for the 2008-2009 school year was 96.1 percent Hispanic, 3.1 percent
White, and 0.6 percent African-American. Of these students, 90.7 percent were deemed
economically disadvantaged, meaning the district has an exceptionally high level of participation
in its school lunch program. The district’s expenditures on food services totaled $9,521,790
which comes out to $675 per student, or 84 percent more than Boerne. Thus, a greater
proportion of students eat the food provided by the school district – food that is of questionable
nutritional value. Food service expenditures represent 7.8 percent of the district’s total annual
spending. This percentage is notably higher than Boerne’s and, as will be seen, correlates
negatively with academic performance.
As stated earlier, Randolph Field Independent School District was selected to be
interviewed because of its status as a military base. This means that all students are the children
of Randolph Air Force Base military personnel. Most students live on the base, making it a
living and educational environment different from most school districts. Nonetheless, like
Boerne, it has an especially low percentage of economically disadvantaged students. Only 11
percent of its 1,203 students are economically disadvantaged. Of the total student population,
54.2 percent are White, 22.8 percent are African-American, and 17.8 percent are Hispanic. Its
2008-2009 food service expenditures totaled $420,244, which is equivalent to $363 per student,
representing 2.5 percent of the district’s total outflow.

17
Table 1 compares the academic performance levels of Boerne and Randolph Field, both
of which have especially low rates of school lunch participation, and Harlandale, a school district
with proportionally high rates of participation. Boerne and Randolph Field performed better than
Harlandale on every academic success measure. Both school districts received considerably
higher scores on all tests, have higher attendance rates, and have lower percentages of students
deemed at-risk compared to Harlandale.
Table1. Comparison of Academic Achievement
Academic Success Measure Boerne Harlandale Randolph Field
TAKS Reading 97% 87% 98%
TAKS Math 93% 70% 93%
TAKS Writing 94% 92% 97%
TAKS Science 93% 66% 92%
TAKS Soc. Studies 99% 92% 97%
TAKS All 89% 61% 90%
TAKS Pass Rate 97% 83% 99%
TSI English 74% 52% 83%
TSI Math 84% 41% 68%
Attendance 96% 95% 97%
At-Risk 23% 64% 22.20%
Table 2 shows the correlation between the percentage of students considered
economically disadvantaged (representing the percentage of students eating the school’s lunch)
and each academic performance measure. All relationships are statistically significant at the
p < 0.01 level.

18
Table 2. The Statistical Relationship between
Economic Disadvantage
and Academic Performance
Dependent Variable r value
TAKS Reading -0.907**
TAKS Math -0.925**
TAKS Writing -0.673**
TAKS Science -0.932**
TAKS Soc. Studies -0.824**
TAKS All -0.929**
TAKS Pass -0.903**
TSI English -0.818**
TSI Math -0.898**
Attendance -0.889**
At-Risk 0.939**
* = p < 0.05
** = p < 0.01
Figure 3 shows bivariate analyses of the relationships between the percent of students
who are economically disadvantaged and several academic performance variables. The
following patterns can be observed: As the percentage of economically disadvantaged students
increases, the percent of at-risk students also increases. As the percent of economically
disadvantaged students increases, the attendance rate decreases. As the percent of economically
disadvantaged students increases, the overall TAKS scores decrease. Finally, as the percent of
economically disadvantaged students increases, the percent of students achieving passing TAKS
scores decreases.
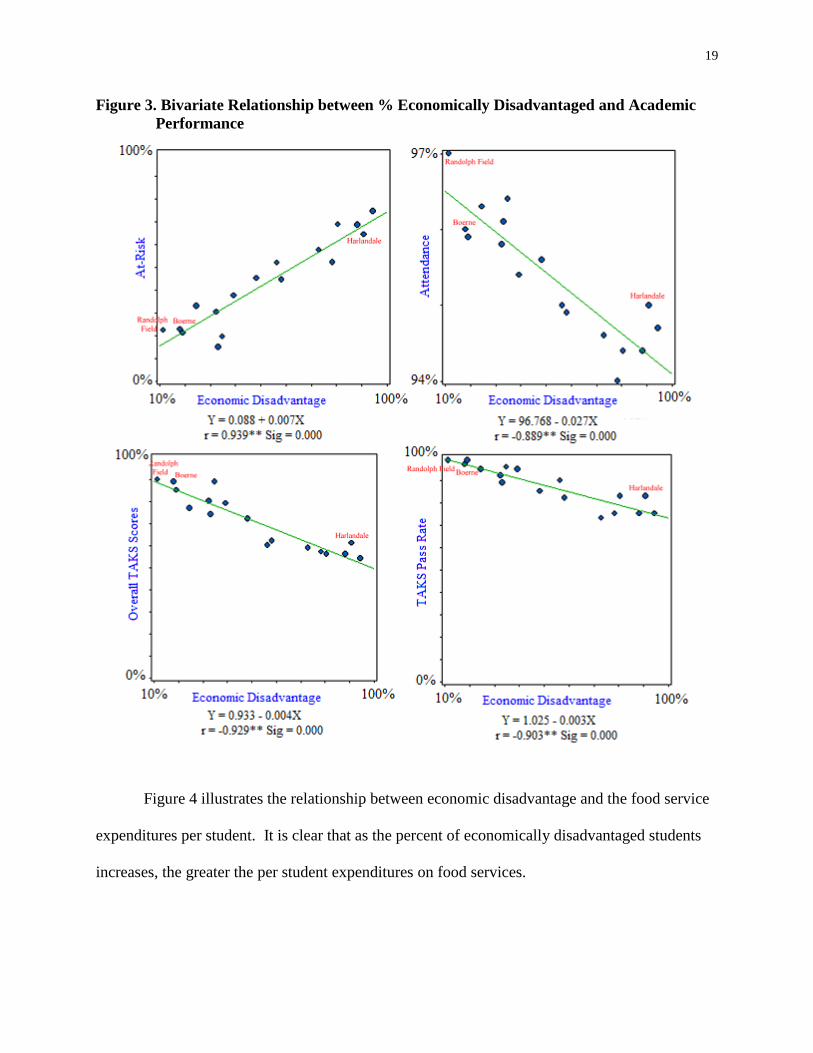
19
Figure 3. Bivariate Relationship between % Economically Disadvantaged and Academic
Performance
Figure 4 illustrates the relationship between economic disadvantage and the food service
expenditures per student. It is clear that as the percent of economically disadvantaged students
increases, the greater the per student expenditures on food services.

20
Figure 4. Bivariate Relationship between % Economically
Disadvantaged and Food Service Expenditures per Student.
Figure 5 demonstrates the percent of students not achieving the Healthy Fitness Zone
(HFZ) standard—in other words, students who are considered physically unfit—for each Bexar
County school district. Among the three school districts of this research’s focus, Harlandale has
the highest percent of students unable to achieve the HFZ standard. The figure indicates that
0.20% of Harlandale ISD students did not meet requirements while only 0.09% of Boerne
students and 0.16% of Randolph Field students did not meet requirements.

21
The following graphs demonstrate the affect of food service expenditures on several
academic performance measures. Figure 6 illustrates the relationship between annual food
service expenditures per student and percent of students not achieving the Healthy Fitness Zone
standard. As annual food expenditures per student increases, the percent of students unable to
achieve the HFZ standard also increases. The regression line equation is: Y = -.129 + .001X.
The correlation coefficient is .534, indicating a moderately strong positive relationship between
the variables. The multiple coefficient of determination (R2) is .285. Thus, 28.5 percent of the
variation in the percent of students unable to achieve the HFZ standard is explained by annual
food service expenditures per student. This relationship is statistically significant at the p < 0.05
level. The outliers are color-coded in red: San Antonio, Somerset, and Edgewood Independent
School Districts. The three school districts of particular interest are labeled in blue.

22
Figure 7 demonstrates the relationship between annual food service expenditures per
student and attendance rates within the school districts. As food service expenditures increase,
attendance rates decrease. The equation of the regression line is: Y = .976 – (5.071E-5
)X.
According to bivariate regression analysis, the correlation coefficient is .684, indicating a strong
positive relationship between the variables. In addition, 47 percent of the variance in attendance
rate is accounted for by annual food service expenditures per student. This is statistically
significant at the p < 0.01 level.

23
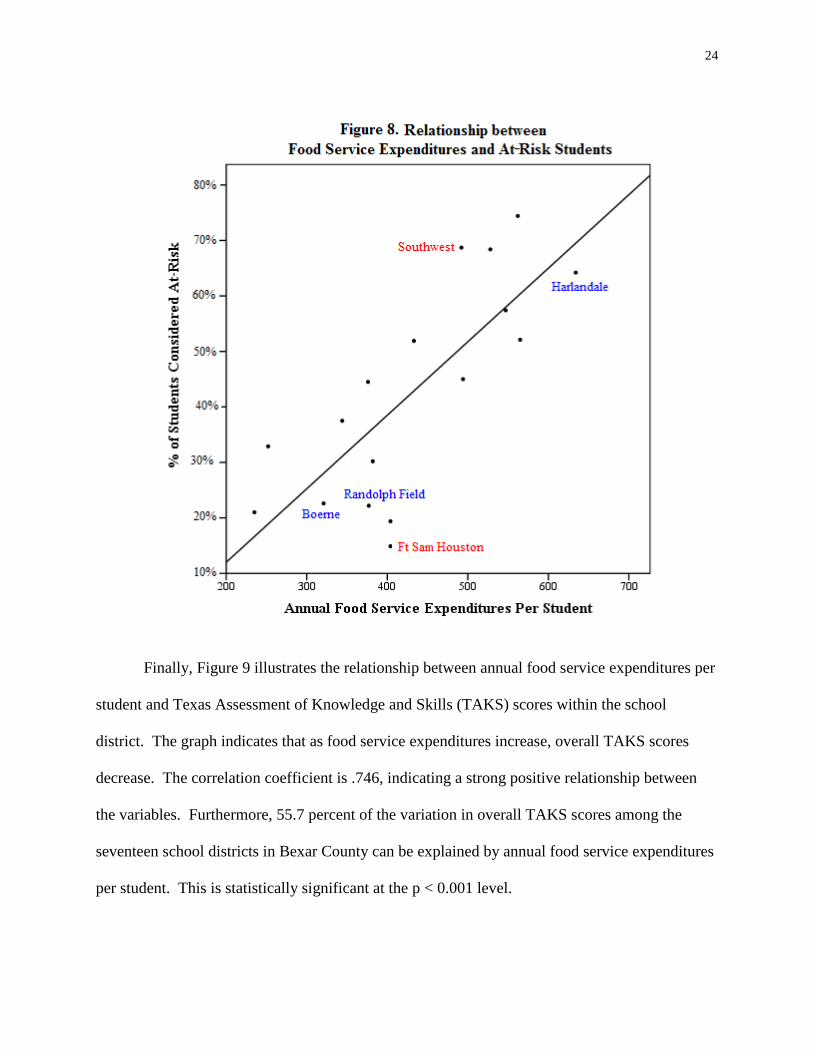
Figure 8 depicts the relationship between annual food service expenditures per student
and the percent of students considered at-risk: As food service expenditures per student
increases, the percent of students considered at-risk also increases. The equation for the
regression line is Y = -.145 + .001X. The correlation coefficient is .772, revealing a very strong
positive relationship between the variables. Furthermore, 59.6 percent of the variation in percent
of students considered at-risk can be explained by annual food service expenditures per student.
This is statistically significant at the p < .001 level.
24
Finally, Figure 9 illustrates the relationship between annual food service expenditures per
student and Texas Assessment of Knowledge and Skills (TAKS) scores within the school
district. The graph indicates that as food service expenditures increase, overall TAKS scores
decrease. The correlation coefficient is .746, indicating a strong positive relationship between
the variables. Furthermore, 55.7 percent of the variation in overall TAKS scores among the
seventeen school districts in Bexar County can be explained by annual food service expenditures
per student. This is statistically significant at the p < 0.001 level.

25
Figure 6 illustrated a positive relationship between annual food service expenditures per
student and percent of students not achieving the Healthy Fitness Zone standard. As food service
expenditures increased, the percent of students unable to achieve the HFZ standard also
increased. Figure 10 demonstrates the relationship between HFZ achievement and TAKS pass
rates among the school districts: As the percent of a school district’s students unable to achieve
the HFZ standard increases, the district’s TAKS pass rate decreases. The equation for the
regression line is: Y = .931 - .307X. The correlation coefficient is .533, revealing a moderately
strong, positive relationship between the variables. In addition, 28.5% of the variation in TAKS
pass rates among the school districts can be explained by HFZ achievement. This data is
statistically significant at the p < 0.05 level.

26
Table 3 shows the relationship between the independent variables (percent of students
unable to achieve the Healthy Fitness Zone standard, percent of students who are economically
disadvantaged, annual food services expenditures per student) and Texas Assessment of
Knowledge and Skills (TAKS) pass rates. The multiple R-squared value indicates that the
independent variables explain 83.4 percent of the variation in TAKS pass rates. This coefficient
of determination is statistically significant at the p < 0.01 level. According to the multiple
regression, the percent of students considered economically disadvantaged has the largest affect
on TAKS pass rate.

27
Table 3. Multiple Regression for TAKS Pass Rate
Independent Variables Beta
% Unable to Achieve HFZ Standard -0.137*
% Economically Disadvantaged -0.777**
Food Services Expenditures Per Student -0.071*
Multiple R-Squared 0.834**
* = p < 0.05
** = p < 0.01
Nationally, between 16 and 33 percent of American children and adolescents are
estimated to be obese (American Academy 2008) and recent surveys have ranked San Antonio as
the third most obese city in America (Ruiz 2007). In spite of widely available information on the
obesity problem, local school administrators seemed to have little accurate information available
and minimized the problem. When asked, ―Approximately what percent of students in your
school district are obese?‖ the Child Nutrition Director at Randolph Field ISD estimated
―Somewhere around ten percent,‖ as did the director from Boerne ISD. Both could offer only
vague estimates about obesity levels in the populations they serve, indicating they have given
little attention to the issue. In contrast, the Food Service Director at Harlandale ISD responded,
―Our students recently completed the Fitnessgram but we have found that this data can be
manipulated and is inaccurate. Our data indicated that almost 98% of our students completed
their fitness goals, which is ridiculous. We know our kids…We have a high percentage of
obesity in our district. Our obesity rates are very high. These kids are not at a normal level. The
Fitnessgram was supposed to be something that could provide us with good information but it
didn’t. The data is worthless.‖
Interviewees were asked for their professional opinions on how the nutritional content of
their school meals impacts students’ academic performance. The Food Service Director from
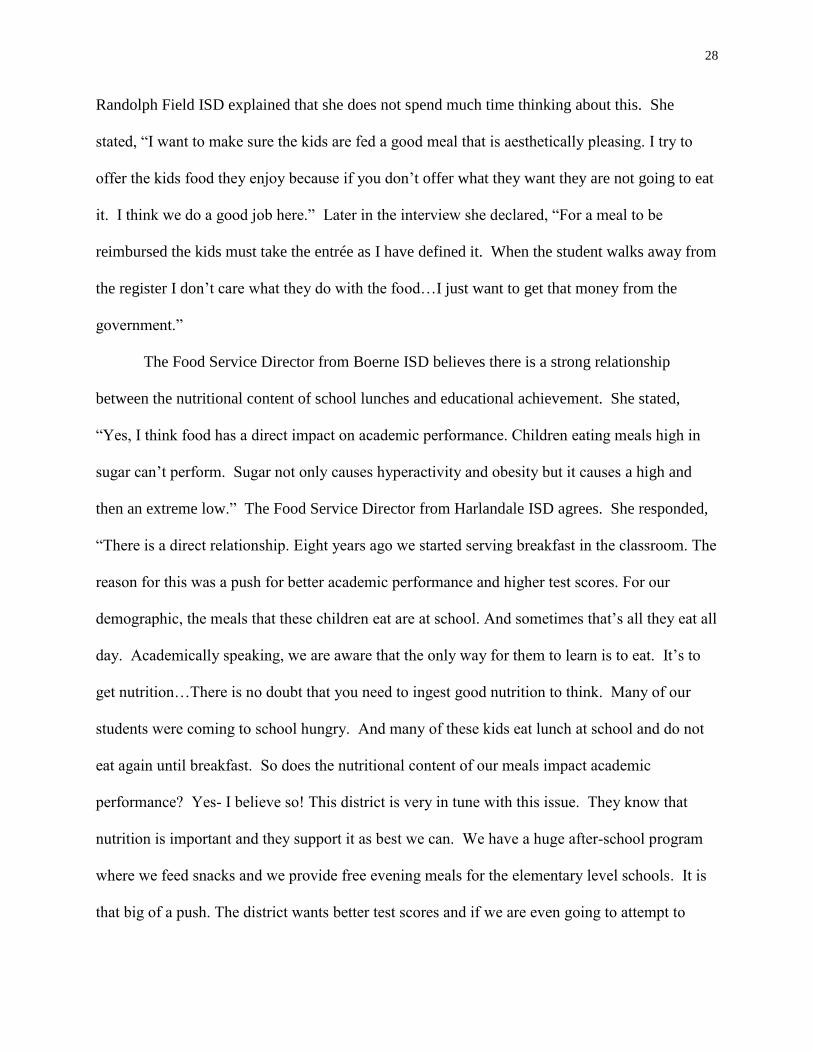
28
Randolph Field ISD explained that she does not spend much time thinking about this. She
stated, ―I want to make sure the kids are fed a good meal that is aesthetically pleasing. I try to
offer the kids food they enjoy because if you don’t offer what they want they are not going to eat
it. I think we do a good job here.‖ Later in the interview she declared, ―For a meal to be
reimbursed the kids must take the entrée as I have defined it. When the student walks away from
the register I don’t care what they do with the food…I just want to get that money from the
government.‖
The Food Service Director from Boerne ISD believes there is a strong relationship
between the nutritional content of school lunches and educational achievement. She stated,
―Yes, I think food has a direct impact on academic performance. Children eating meals high in
sugar can’t perform. Sugar not only causes hyperactivity and obesity but it causes a high and
then an extreme low.‖ The Food Service Director from Harlandale ISD agrees. She responded,
“There is a direct relationship. Eight years ago we started serving breakfast in the classroom. The
reason for this was a push for better academic performance and higher test scores. For our
demographic, the meals that these children eat are at school. And sometimes that’s all they eat all
day. Academically speaking, we are aware that the only way for them to learn is to eat. It’s to
get nutrition…There is no doubt that you need to ingest good nutrition to think. Many of our
students were coming to school hungry. And many of these kids eat lunch at school and do not
eat again until breakfast. So does the nutritional content of our meals impact academic
performance? Yes- I believe so! This district is very in tune with this issue. They know that
nutrition is important and they support it as best we can. We have a huge after-school program
where we feed snacks and we provide free evening meals for the elementary level schools. It is
that big of a push. The district wants better test scores and if we are even going to attempt to

29
obtain higher scores these kids need to eat nutritionally. You give them candy and they get a high
and then a low...Trying to get a kid to do something when their stomach is growling is
impossible. My children can’t do anything hungry and I can’t function when I am hungry. So
how can you expect a child to? It’s important to give them everything we can- and we give it
nutritionally…We give them what they need to be able to think and do their work.”
Interviewees were asked to describe a typical meal served in their district. Randolph
Field ISD offers an entrée, a fruit, two vegetables, milk, and a dessert each day. Salad with
ranch dressing is offered every day while fresh fruit is only offered once a week. Popular entrees
include chicken nuggets, pizza, cheeseburgers, twice-baked chicken, and chicken cordon blue.
Desserts are typically cookies, sherbet/ice cream, or fruit. In addition to their meal options, the
school district has a snack bar that sells items like pretzels, egg rolls, ice-cream, chips, and
granola bars. Randolph Field also serves breakfast. The Food Service Director described the
breakfast options, stating, ―I typically do something sweet like cinnamon rolls on Mondays. On
Tuesdays I serve biscuits and sausage or chicken patties. On Wednesdays I serve breakfast pizza
with cheese and sausage. They love it - they’ll buy two and three slices extra. On Thursdays I
serve breakfast tacos and on Fridays I serve French toast and sausage. In addition, I always offer
cereal, toast, and Nutrigrain bars.‖
On the day of the interview, Boerne ISD was serving a lunch of chicken nuggets, mashed
potatoes with gravy, green beans, a wheat roll, fresh fruit, and milk or juice. The district offers
two choices of fresh fruit and fresh vegetables every day. The vegetables are typically frozen
and then steamed, as this is healthier than canned vegetables. According to the Food Service
Director, everything is low-fat, low-sodium, and whole-grain. She stated, ―I use turkey hot dogs
and whole grain buns. I use ground sirloin when I serve beef because it’s much lower in

30
fat…Our spaghetti has a low-fat meat sauce and low-fat ground beef. Our cheeseburgers have
no Trans fats and we use wheat buns.‖ The district uses the slogan ―GO, SLOW, WHOA‖ from
the Coordinated Approach to Children’s Health Program (CATCH). GO foods are lowest in fat
and can be eaten ―almost anytime.‖ SLOW foods are higher in fat and should only be eaten a
few times each week. WHOA foods are highest in fat and should only be eaten on occasion.
The director emphasized, ―I try not to serve any WHOA foods!‖
Harlandale serves breakfast and lunch free of charge to all students. Ninety percent of
the student population is economically disadvantaged and, therefore, qualifies for free or reduced
meals. The small portion of students that do not qualify are still fed for free, as the school
district finds it easier not to screen out the ten percent that does not qualify. This results in lost
revenue. Despite these circumstances, the district strives to provide nutritious meals. The Food
Service Director explained, ―We use all low-fat cheese and we do not use any oil. We don’t fry
anything. Our enchiladas are healthy. We make them here – we steam the tortillas, use no oil,
we use low-fat cheese. Parents will ask how serving pizza can be healthy. Well, we use low-fat
pepperoni, low-fat cheese, and a whole-grain crust. And we only serve the children one slice.
We serve an item called Turkey a la King that is vegetables and turkey served in a gravy sauce
over rice. We use turkey chili in our Corn Chip Pie and our hot dogs and corn dogs are made
from turkey …We serve the best foods we possibly can with the money that we have.‖ The
district offers fresh fruits and fresh vegetables every day and the director explained that their
students eat a lot of them. She stated, ―I want them to eat fruits and vegetables at school because
they aren’t getting any at home. We usually provide four different types of fruits and vegetables
every day – some are cooked and some are fresh.‖ In addition, the district offers a baked potato
plate, a chef’s salad plate, and several sandwich options each day.

31
Breakfast is served in the classroom at Harlandale schools to ensure that each child has
the opportunity to eat breakfast. They serve items like whole-grain biscuits, turkey sausage, or a
morning roll. She described the morning roll stating, ―Our morning roll is similar to a sweet roll
because you want it to be visibly appealing to the kids but it is all whole-grain…I could buy a
honey bun and serve it for breakfast but I’m not going to do that. The honey bun would be
cheaper than what I am paying for the morning roll and it would probably even comply with
nutrition policy – believe it or not – but I’m still not going to do that.‖ Teaching these children
better choices is extremely important to the director, especially because she serves students from
impoverished families. She declared, ―It’s hard because they are eating fast food and crud at
home.‖
Interviewees were asked how strictly they follow federal nutritional guidelines. The
Child Nutrition Director of Randolph Field ISD claimed that she tries to be as compliant as
possible. The school district uses an online nutrient calculator to ensure that all items served
meet federal guidelines. In order to demonstrate this process, she entered the nutrition facts of a
bag of popcorn into the calculator. Unfortunately, results indicated that the bag of popcorn was
too high in fat. She seemed startled and embarrassed, stating ―Wait, the fat content is too
high…I thought it was okay but I’m really out of compliance.‖ I asked her if she will stop
serving it immediately and she said she will continue to serve it this year but stop next year.
Coincidentally, the school district will be audited next year.
When asked how strictly the Boerne ISD follows federal guidelines the Food Service
Director answered, ―We follow them to the max.‖ She ensures that all items meet federal
guidelines before serving them to students. She claimed that Texas guidelines are stricter than
any other state, proudly noting ―There are some recipes put out by the USDA that do not comply

32
with nutritional standards in Texas.‖ The Food Service Director at Harlandale ISD held a similar
outlook. She stated, ―Auditors come every five years but I choose to be as strict as I can for the
entire time. That’s just me personally, not everyone does that…We don’t put anything on our
menu that does not comply with federal guidelines. Unfortunately, loopholes are everywhere and
you can choose to do more or you can choose to do the bare minimum…For example, you can
sell Hershey bars with peanuts. It is okay since it has peanuts. So you can sell Snickers – but do
I choose to do that? No. But some do because they can and they want to make money off of it.
I am a dietician so I have a nutrition background and I personally cannot sell a Snickers bar. I’m
trying to provide the best environment here because when they go home they are free to go to
McDonalds.‖
Interviewees were asked if funding has decreased in recent years as a result of the
economic downturn. Funding has remained stable for the food service department at Randolph
Field, mainly due to its status as a military school. All parents have secure jobs so the number of
students qualifying for free and reduced meals has not changed. Boerne has not experienced a
decline in funding either. The director explained, ―I don’t have many reimbursed meals here so I
get most of my money from paid meals. And our sales haven’t gone down, actually they have
gone up. Our meals cost $3.00 in primary schools and $2.25 in secondary schools. We have
some of the highest prices in the state of Texas. So the economic downturn hasn’t really affected
us.‖
On the other hand, Harlandale ISD, a school district catering to economically
disadvantaged students, has experienced difficulties as a result of the economic downturn. The
Food Service Director explained, ―The funding has not decreased. Each year we receive a three
percent increase on reimbursement for each meal. It’s been that way for many years. The

33
problem is that the price of food has increased ten to fifteen percent. So our funding has not
matched the increase in prices. It has been tough, but if you utilize your commodity dollars the
way you are supposed to and you take the time to research you can find products. For example,
we have a huge milk budget and we were serving milk in the plastic bottles which is more
expensive. We had to switch back to the paper cartons and we saved $400,000. You can make
changes that enable you to still provide healthy foods. Our food may not be organic but it’s
healthy. And, of course, our clientele isn’t asking for organic food. Maybe they are serving
organic products in the Alamo Heights ISD, but they charge out the wazoo.‖
Fast-food industries, whose outlets encroach on school properties, challenge the good
intentions of many school district nutritionists. To investigate whether such encroachments are
more common in poor than wealthy school districts, on-site observations were made of the areas
surrounding high schools in the Randolph Field, Harlandale, and Boerne Independent School
Districts.
The first school visited was Randolph High School, the sole high school in the Randolph
Field ISD. The school is located on the Air Force Base which is entirely enclosed by fences. Pat
Booker Boulevard is a 2.5 mile street connection between I-35 and the Air Force Base.
Unhealthy food options and fast-food restaurants line both sides of the street: Krystal Burgers,
Popeye’s Chicken and Biscuits, Mr. Gatti’s Pizza, Sonic, Golden Corral, Taco Cabana, Pizza
Hut, McDonald’s, Arby’s, Church’s Chicken, Chester’s Hamburgers, and Wendy’s. At the
entrance to the Air Force Base there is a four-way traffic intersection, offering the eating options
of a Subway, Bill Miller BBQ, Jack in the Box, Taco Bell, and KFC Chicken. Figure 11
illustrates this 2.5 mile stretch of high-fat eating establishments.
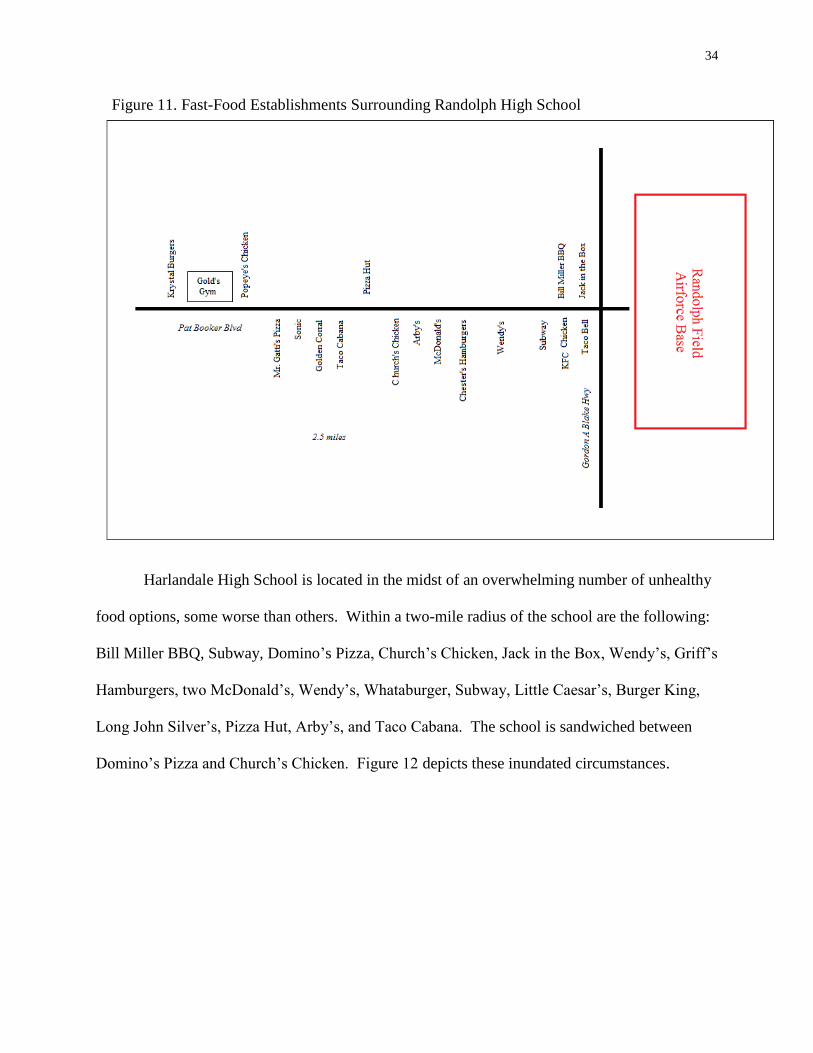
34
Figure 11. Fast-Food Establishments Surrounding Randolph High School
Harlandale High School is located in the midst of an overwhelming number of unhealthy
food options, some worse than others. Within a two-mile radius of the school are the following:
Bill Miller BBQ, Subway, Domino’s Pizza, Church’s Chicken, Jack in the Box, Wendy’s, Griff’s
Hamburgers, two McDonald’s, Wendy’s, Whataburger, Subway, Little Caesar’s, Burger King,
Long John Silver’s, Pizza Hut, Arby’s, and Taco Cabana. The school is sandwiched between
Domino’s Pizza and Church’s Chicken. Figure 12 depicts these inundated circumstances.
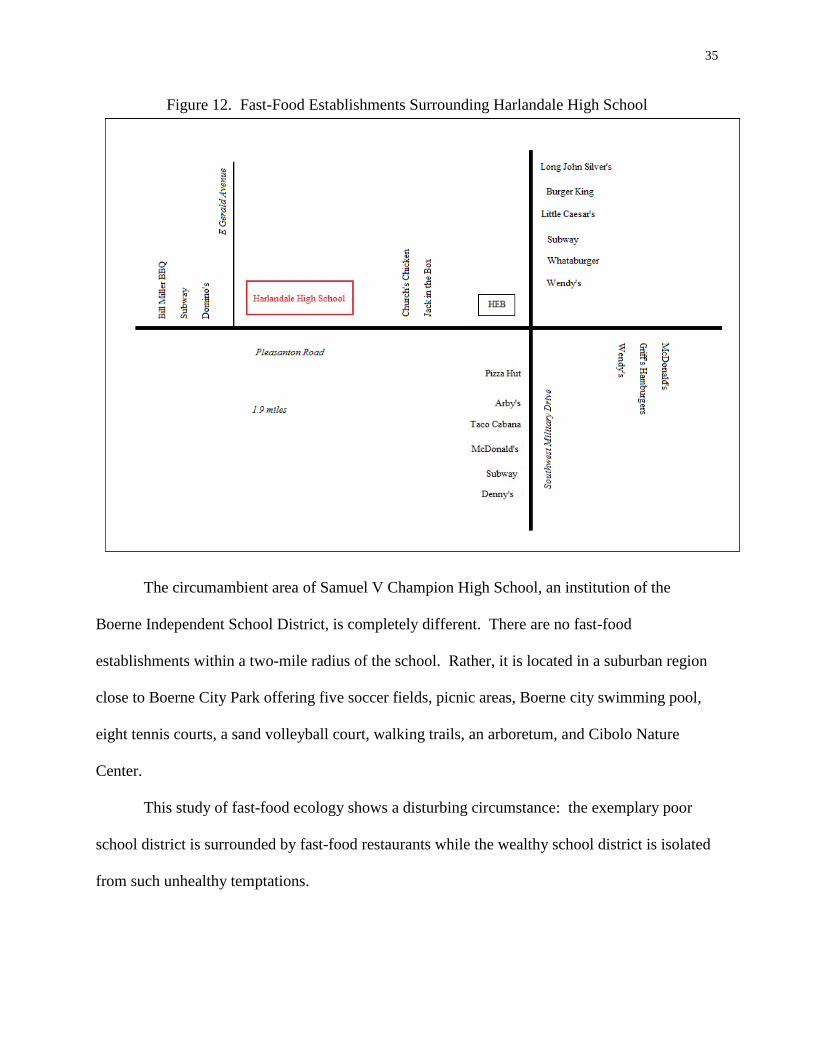
35
Figure 12. Fast-Food Establishments Surrounding Harlandale High School
The circumambient area of Samuel V Champion High School, an institution of the
Boerne Independent School District, is completely different. There are no fast-food
establishments within a two-mile radius of the school. Rather, it is located in a suburban region
close to Boerne City Park offering five soccer fields, picnic areas, Boerne city swimming pool,
eight tennis courts, a sand volleyball court, walking trails, an arboretum, and Cibolo Nature
Center.
This study of fast-food ecology shows a disturbing circumstance: the exemplary poor
school district is surrounded by fast-food restaurants while the wealthy school district is isolated
from such unhealthy temptations.

36
DISCUSSION
The present study contributes to the growing evidence of significant connections between
school meal programs, nutritional status, and students’ academic achievement. It is widely
acknowledged that a relationship exists between social class and academic performance.
Looking further, this study reveals underlying aspects of social class experience that have an
effect on academic success. These include school meal programs, physical fitness, and fast-food
ecology.
Food service expenditures are found to correlate with academic performance, even when
controlling for economic disadvantage and physical fitness. As annual food expenditures per
student increases, attendance rates decrease, the percent of students considered at-risk increases,
and overall TAKS scores decrease. Analysis also revealed a statistically significant relationship
between physical fitness and academic performance. Specifically, as the percent of a school
district’s students unable to achieve the HFZ standard increases, the district’s TAKS pass rate
decreases. So, in general, schools serving lunch to a large percentage of students have more
physically unfit students and are more likely to perform worse on academic measures compared
to schools serving lunch to a small percentage of students. These results suggest that the lunches
served in many schools fail to provide students with the nutrition necessary for optimal learning
and productive behavior. In some cases, the fatty and sugary foods served at lunch may even
directly obstruct academic success.
Figure 13 diagrams the theory behind this research study, with the red arrows showing
the actual relationships studied. The figure illustrates the variables that have an influence on the
academic achievement of children in various school districts. The proportion of economically
disadvantaged classmates, the quality of food served in a school’s lunch program, the school’s

37
fast-food ecology, and the nutritional status of students (which includes obesity status and
physical fitness) all have an impact on a school district’s educational success.
Figure 13. Variables that have an Influence on Academic Achievement
Interviews and quantitative data analysis provided extensive information about the three
school districts of interest. Harlandale has high involvement in its school lunch program and has
a higher percentage of students unable to achieve the Healthy Fitness Zone standard than most
school districts. The Food Service Coordinator acknowledged that the district has very high
rates of obesity. In comparison, Randolph Field and Boerne have low participation in their
school lunch programs and almost all of their students surpassed the Healthy Fitness Zone
standard. Administrators spoke of very low obesity rates within the districts.
Taking all of this information into account, it is important to recognize that Boerne and
Randolph Field performed better than Harlandale on every academic success measure. Both
school districts received considerably higher scores on all tests, have higher attendance rates, and

38
have lower percentages of students deemed at-risk compared to Harlandale. Thus, the current
study reveals an association between school lunch programs, obesity, and academic performance.
Harlandale, with exceptionally high rates of obesity, has lower academic success than Boerne
and Randolph Field. Why is this so? Are obese students less successful academically because
they lack the courage and initiative to participate in classroom activities? Do medical problems
associated with overweight or obesity make learning and concentration difficult? Or is a low
sense of self-worth due to bullying and teasing responsible for lower levels of aspiration and,
therefore, less effort at school? Further research is necessary in order to answer these questions.
This study examined aggregated data demonstrating statistically significant connections
between school district-level measures of nutrition, physical fitness, and academic success. To
truly establish the bearing of nutrition on academic performance, one must analyze individual-
level data, which would pose a host of ethical and privacy issues. And, in order to accurately
establish whether school food programs have a direct effect on educational achievement, the
researcher must control for home environments (i.e., availability of books, parental guidance),
lifestyle, intellectual motivation, quality of instruction, career role models, and the like.
For this study, taking an aggregated data approach invited ecological investigations of the
concentrations of fast-food restaurants within easy walking distance of schools, particularly low-
income schools. The ever-present temptation of such food undoubtedly contributes to the
nation’s obesity epidemic. These circumstances raise the question of whether fast-food
establishments intentionally locate their restaurants close to schools, making them easily
accessible to young people. Previous research indicates that on an average day approximately
one-third of school-aged children eat fast food. Furthermore, children consume more calories,
fats, and sugars, and fewer fruits and vegetables on days when they eat fast-food (MSNBC
39
2005). Harlandale High School, accommodating a disproportionately high percentage of
economically-disadvantaged students, is surrounded by fast-food restaurants. Within a two-and-
a-half mile radius of the educational institution there are over eighteen fast-food options,
bombarding these students with low-quality food choices. Additionally, the high school sits
directly between two fast-food restaurants. The road that leads to the Air Force Base, where
Randolph Field High School is located, is lined by fast-food restaurants on both sides.
Fortunately, the high school is confined within the gated base and, therefore, is somewhat
distanced from these unhealthy temptations. In stark contrast to Harlandale and Randolph Field,
there are no fast-food restaurants within a two mile radius of Samuel V Champion High School
which serves the middle and upper-class students of Boerne ISD.
The geographic location of fast-food establishments begs the question of whether fast-
food companies target specific socioeconomic classes. Are students from lower-class families
more likely than their middle- and upper-class counterparts to indulge in fast-food when school
is over? Poor people must find ways to eat cheaply and fast-food is inexpensive. Fast-food
companies take advantage of poor people’s financial situations with come-ons like the
McDonald’s Dollar Menu. The environmental susceptibility of low-income students to fast-food
establishments is a clear form of structural violence. Students are bombarded by unhealthy food
options at a very young age while their upper-class counterparts are more easily able to steer
clear of such choices. In order to combat increasing obesity rates among children, it is essential
that schools implement zoning requirements that limit the proximity of fast food restaurants to
schools.
Interviews with food service directors and observations made in school cafeterias
unveiled major differences between the three districts in the types of food served. Randolph
40
Field, with the lowest percent of economically disadvantaged students, offers high-fat entrees,
sugary desserts, and a snack bar chock-full of unhealthy, but profitable, a la carte items. The
Food Service Director admitted that their prices are among the highest in the state of Texas. In
spite of its high priced meals, the district offers fresh fruit only once a week. Randolph Field has
the monetary means to serve fresh and healthy items on a daily basis yet the district does not
make efforts to do so. In contrast, Boerne takes advantage of its affluent status and serves an
abundance of healthy items. The district offers two choices of fresh fruit and fresh vegetables
every day. Additionally, everything served is low-fat, low-sodium, and whole-grain.
Despite Harlandale’s low-income status, the district strives to provide nutritious meals.
According to its director, the district serves the best food possible with the modest funds
available. For example, when pizza is served the district uses low-fat pepperoni, low-fat cheese,
and a whole-grain crust. Additionally, the district manages to offer fresh fruits and fresh
vegetables every day. Harlandale’s food service director stated, ―Our food may not be organic
but it’s healthy. And, of course, our clientele isn’t asking for organic food. Maybe they are
serving organic products in the Alamo Heights ISD, but they charge out the wazoo.‖
Interviewees were asked to express their opinions on the relationship between the
nutritional value of school lunches and academic performance. The Food Service Directors from
Boerne and Harlandale ISD both believe there is a strong correlation. On the contrary, the
director from Randolph Field ISD made it clear that she does not spend much time thinking
about this relationship, as her priority is to ―get that money from the government.‖ This
difference in opinion is disconcerting. It is apparent that some school districts lack an authority
figure who acknowledges the importance of a nutritious lunch and whose objective is to serve

41
healthy meals that promote educational success. If the primary goal of a district’s lunch program
is to make a profit, the food served will likely not be of optimum quality.
Important conclusions may be drawn from these observations. Stated simply, some
school districts serve healthy meals and others do not. In general, school districts that cater to
the needs of middle- and upper-class children serve higher quality lunches than districts attended
by children from lower-class families. Boerne ISD has the funds to provide a plethora of healthy
options that are of the utmost quality and they use this money appropriately. However, results
reveal that not all affluent school districts endeavor to provide healthy lunches. Randolph Field
provides a conspicuous example. It is apparent that the Food Service Director of Randolph Field
does not consistently follow federal nutritional guidelines, as the meal served on the day of the
interview did not meet federal criteria. School districts like Randolph Field seem to take
advantage of the five-year grace period between audits.
It is also important to note that not all underprivileged school districts serve unhealthy
lunches. It is evident that Harlandale aspires to provide nutritious meals. While it is nearly
impossible that their meals are of the same quality as meals served in their wealthy counterparts,
the conscientious efforts of the school district are nonetheless admirable. Still, this inequality is
socially unacceptable. Despite Harlandale’s efforts to make the most of their substandard
resource base, the district finds it necessary to engage in commercial contracts with vendors for
additional sources of income. Items sold in vending machines are just another reason for the
expanding size of school children’s waistlines. And undermining its own efforts, Harlandale
ISD finds its schools engulfed in a sea of fast-food restaurants.
Students that attend schools in districts like Harlandale ISD enter school at a
disadvantage, as they come from impoverished families. This disadvantage is exacerbated by the

42
inferior characteristics of the schools they attend – in this case, the food served at lunch, the
commercialism prevalent within their schools, and the fast-food ecology overwhelming their
schools. How can a student eating a high-fat lunch in the cafeteria, drinking a sugary soda from
the vending machine at school, and stopping at a fast-food restaurant for an after-school snack
perform academically to their best of their ability? The student did not choose to be in this
unhealthy environment; rather it is the result of the social class and culture he or she was born
into. Furthermore, the student lacks the agency to control his or her school’s food environment.
This embodiment of conflict theory is socially unacceptable.
More research is necessary to tease out the role that socioeconomic status plays in the
relationship between nutritional status and academic achievement. Although the Texas
Education Agency defines students as ―economically disadvantaged‖ if they receive free or
reduced-price school lunches, it is undeniable that other factors associated with being
economically-disadvantaged effect academic achievement—for example, cramped living
conditions, unsafe neighborhoods, and lack of parental guidance. Thus, a more comprehensive
study is necessary to isolate the impact of the nutritional quality of school lunches on academic
performance.
CONCLUSION
After performing secondary research, conducting interviews, and seeing firsthand the
lunches served in the local school cafeterias, I have devised a list of fairly simple ways to
improve the quality of school lunches in Bexar County. These changes have the potential to
improve the nutritional status of school children and, therefore, to improve their academic
performance. First and foremost, fresh fruits and vegetables should be offered on a daily basis.
A new study by the University of Michigan Cardiovascular Center indicates that only 16.3

43
percent of school-lunch eaters regularly eat fresh fruits or vegetables, compared with 91.2
percent of students who bring their own lunch (Gustafson 2010). It is important that students be
offered fruits and vegetables at school so that they develop a taste for these healthy choices.
Despite the district’s economic situation, Harlandale ISD offers fresh fruits and vegetables every
day. Boerne also offers fresh fruits and vegetables every day. Randolph Field does not.
Foods like hamburgers, cheeseburgers, pizza, tater tots, and French fries, which are
commonly associated with school lunches, should be offered sparingly. Hamburgers and
cheeseburgers are offered every day in Randolph Field schools, and French fries are offered
three times a week in high schools, the maximum number of servings permitted by federal
nutrition requirements. In contrast, hamburgers or cheeseburgers are only offered twice per
month in Boerne schools, and the district has replaced tater tots and French fries with a baked
potato option. This is a step in the right direction.
Sugary desserts should be replaced by healthier options, like fruit cups and low-fat
yogurt. Additionally, it is not necessary to serve a dessert every day. In fact, it would be better
to reserve sweet desserts for holidays and other special school days. This would reduce sugar
intake and promote moderation. Boerne ISD has made efforts to serve fewer desserts. They
typically serve a small dessert once a week, rotating between fruit salad, a reduced-fat, whole-
grain cookie, pudding, or a reduced-fat ice cream cup. Most school districts offer a high-sugar
dessert option every day.
Providing low-fat alternatives for condiments is another simple modification. Randolph
Field offers a tossed salad on the lunch line every day; however only ranch dressing is available
and this is high in fat and calories. When asked why ranch was the only dressing offered, the

44
Food Service Director plainly stated, ―It’s easier.‖ This increases the calorie and fat content of
the salads, and likely dissuades students who do not like ranch dressing from eating salad.
Lastly, school lunch program administrators should reduce the number of choices
children have at lunch time. Many schools offer burgers, French fries, unhealthy snacks, and
sugary treats alongside the daily lunch selections. Children are given the option of purchasing a
candy bar and soda from the vending machine, or they can buy a 390 calorie soft pretzel a la
carte and enjoy the six grams of fat that go along with it. Randolph Field schools have a snack
bar that offers foods like pretzels, ice cream, chips, and candy. In general, when children are
allowed to choose the components of their so-called lunch, they do not eat a balanced meal.
Overall, children who learn to eat healthy foods and develop a taste for nutritious foods in their
early years will make better food choices as adults.
45
APPENDIX
Interview #1
Randolph Field ISD
Child Nutrition Director
I started at Judson ISD.
I go to the elementary campus at least once a week. We only have the two campuses. There are
only 3 schools but two campuses.
How does nutrition affect academic performance?
If you have breakfast it results in fewer tardies and absences and students concentrate better.
Eating a healthy lunch allows students to concentrate better in their classes.
Less than 20% of our school district qualifies for free/reduced school lunch.
Do you know what % of students eat the school lunch versus bringing their own?
We can check that when we get back to my office.
Does the elementary, middle, and high school have the same meal plans or are their two
different ones?
They all follow nutrient standard. There is nutrient standard and traditional and we do nutrient
standard meal pattern.
What is the difference?
Um, with nutrient standard you get reimbursed by the government for meals served during
breakfast and lunch (and they even do reimbursable snack program but we do not do this). And
you must have certain components on your tray. The computer keeps a tally of the students
coming through and so the cashier is ultimately responsible. When that student walks away with
that tray, that tray is considered reimbursable. The government will reimburse us. But it has to
have certain components on the tray. So with nutrient standard you must have the entrée,
however I define the entrée. If the student doesn’t take an entrée I can’t count that tray. So if I
define it as chicken with the roll, they have to take both for it to be reimbursable. They have to
also have two more items from the line. It could be a veggie and milk- so that’s two more
components making it a reimbursable tray. If they just have the entrée and the milk they are
missing a component.
So the government is reimbursing you for having them have a complete meal with each
nutritional item?
Yes. We get reviewed every five years. With nutrient standard you can really do anything you
want- you can have a dessert, we do brownies or cookies or fruit. Most people do traditional
where you don’t have to take the entrée, you just have to have a minimum of 3 components on a
tray…so it could be a combination of anything. And you have to have so many servings of grain,
etc. You can’t just have cookies as your dessert, it has to be something like fruit.
And then the Texas Nutrition Policy I think is trying to fight the obesity problem. So we can only
have so many fats per week…um, so much fat per serving…um, certain serving sizes can’t be

46
beyond, like less than an ounce for the chips. An item can only have so much sugar, like the
Gatorade can only be a certain size and can only have so much sugar per serving.
And how strictly is this enforced?
You have to…well I guess you don’t have to do anything but you get audited every five years.
We get audited next year. We try to be as compliant as we can and I always feel like when the
auditors come out they can tell if you are trying to not comply with what you are supposed to do.
So you are supposed to comply with everything that they want you to do.
[We enter the elementary cafeteria]
What do we have today?
Mini corn dogs today and ham and cheese sandwiches. The main item or an alternate.
[Back in the car]
I always offer two veggies whether its corn and green beans or corn and salad. But I always have
two veggie options. I usually have fruit for dessert. Sometimes we do cookies as their dessert and
we will do ice cream sometimes. But for the most part they get fruit as their dessert. They get
fresh fruit once a week. And same thing at the secondary campus. You get fresh fruit once a
week. Most of the time if there is fruit for dessert I give like sherbet or ice cream. We do offer
salad every day on the line at the secondary campus. Every day they can get fresh salad and we
have two veggie options.
With a la carte items…how do those work? Can a person just buy an a la carte item or add
it to their meal?
If they have money in their account they can buy it. You cannot charge a la carte items.
We have a snack bar at the secondary campus so we sell chips and ice cream and I have a special
every day like today is popcorn chicken which is just the popcorn chicken by itself. Now in the
line they can get if they want just a salad they can do that. And then we’ll just charge them a la
carte for it.
And so what are the main responsibilities of your job?
I am responsible for the whole department and for my employees. Making sure that we are in
compliance with regulations- federal and state. I do the yearly budget. I do the commodities- we
get commodities from the government. We have to start working now for next year. The
government gives us so much money, called pal dollars, so it’s like a bank account. Every month
I do a claim and the computer keeps a tally of the trays that were reimbursable. And I turn this in
to the government at the beginning of each month. And they keep a record of it and I think it
goes back three years and they decide how much pal dollars you can put toward your
commodities, like meat, fruits, vegetables and things. They base your number of meals and they
say you’ve got this many of students eating so we’ll give you 10,000 dollars worth of money. So
the commodities have a value to it. So then I can take that money and use it however I think I
need to use it.
We have a program called Nutrikids- or Lunchbyte system. You must stay within the
recommended daily allowance- like how much fat, saturated fat, so much vitamin A and B and
calcium. You have to stay within those standards. So this program we use it to create the menu.
47
And the program will calculate for me the number of calories possible for that meal because it
does a weighted value. Everything that I have offered for that day. It’s just a lot of information.
And is following the Nutrikids system required or is that something you decided to do?
Um, I inherited this program when I came here from Judson and it has worked really well.
But is that a federal requirement?
There is a federal requirement that you have to meet certain standards as far as nutrients and we
are nutrient standards so we are supposed to keep a data of the calories and the fats and all that
stuff. And this program helps me to do that.
It’s hard…
[We look at the Nutrikids system with today’s meal…the fat content was too high]
So then what would you do?
I would need to adjust it. It could be the cheese…
And so this meal is above the total fat grams?
Yes, It’s probably too…um…
And so for today did you just overlook that?
Yeah.
So I’m okay on my calories and I’m okay with the iron. It tells you…like total fat too high.
Calories are low, iron is low…that’s hard.
Do you normally plan the meal and then put it in? Or do you sometimes look after?
It’s probably this grilled ham and cheese.
It’s very challenging. Let’s look at a whole week’s worth…
With the federal guidelines that you must follow is there a program that they recommend
you using? Or is that just on your own? (27 min)
We use the Nutrikids system for this.
And will you have to show that to anyone?
Yes, when they come in to audit next year they will do a school m__ initiative to make sure you
are following the guidelines. They give you a little bit of leeway.
So what if they came in today and saw that the fat content was over?
They would ask me to correct it. And maybe ask how I would fix it. Because we have a big
influence on these kids at school and they want us to offer the healthy things and have the
healthy choices.
What kinds of things do you serve for breakfast?
Let’s see… I typically do something sweet like cinnamon rolls on Mondays. On Tuesdays I serve
biscuits and sausage or chicken patties. On Wednesdays I serve breakfast pizza with cheese and
sausage. They love it - they’ll buy two and three slices extra. On Thursdays I serve breakfast

48
tacos and on Fridays I serve French toast and sausage. In addition, I always offer cereal, toast,
and Nutrigrain bars.
That sounds like a variety.
I think so. I think the challenge is finding different menu items and things to offer that the kids
will take.
Right, you have to balance nutrition and what they like.
Yes, it can be a challenge.
Do you know how many people eat breakfast here? On the average we had 73 students eat breakfast at the elementary campus and 344 average
eating lunch.
Here we had 26 students eating breakfast and __ ate lunch on the secondary campus 6th
through
12th
grade.
21 days of October…and we served...[I have numbers written down]
How does your meal plan differ from other school districts?
Traditional meal pattern versus nutrient standard…different guidelines and ways of being
reimbursed. I think most districts go with traditional because that’s what they are used to. It’s
always hard to change.
Is it hard to control each school’s actions?
Sometimes. You know I can ask them to do something and they she might do what she wants to
do anyway. She is usually really good at telling me.
You have to set standards and expect that they will do it when you’re not there. They are gonna
do what they want when you’re not there. I mean I hate to say it.
We have to keep a record of how much we prepare and how much we serve so for instance if we
did 100 servings of mini corn dogs…
Might you notice that no kids were eating a particular dish?
Oh yes.
What are favorite things?
Chicken nuggets, pizza, hamburger and cheese burgers, chicken patties, twice baked chicken,
chicken cordon blue, egg rolls from the snack bar, chef salads that we make every day
What is your take on how nutritional content affects academic achievement and general
wellbeing? Does your job lead to you to think a lot about this?
No, not really. I want to make sure the kids are fed a good meal that is aesthetically pleasing. I
try to offer the kids food they enjoy because if you don’t offer what they want they are not going
to eat it. I think we do a good job here
49
Approximately what percent of students in your school district are obese?
Somewhere around 10%.
What are the demographics of kids here?
Their parents have to be active duty to come to school here. If you live on base you can
automatically get enrolled into the school. If you live off base then you have to apply to come to
school here.
Do a lot of kids live on base?
From my understanding, there is a greater population of students who live off campus. I think
many live in the general area but they can live anywhere, in other districts.
Have you noticed any changes being made in response to the childhood obesity epidemic?
Yes. The Texas Nutrition Policy started in the 04-05 school year. It is really strict on French fries
and those types of food. We used to fry here, but they implemented a Texas public school
Nutrition policy in the 04-05 school year and gave us until this year to make the change to ban
fried foods so we have to bake everything. At middle school you can only offer a French fry type
of thing three times a week. At the elementary school you can only offer it once a week. It’s
already fried at the manufacturer but frozen and then we bake it in the oven. You can do it every
day at the high school. But because it’s a middle school/high school campus I just do it three
times a week. So on Mondays and Fridays they get chips and Tuesdays through Thursday you
have an option to get fries. And you can only get one order of fries at a time. So for instance if a
student comes through and wants two they have to get one and come back through the line to get
another. And you can’t buy it for a friend, the friend has to come through the line. There are size
limits for Gatorade, chips, and ice cream. You can only have so many grams of sugar per serving
and fat per serving.
[looking at a nutrient calculator]
Here is a nutrient calculator. [she gets a bag of popcorn] This should be good, it better be. If you
want to see if a product follows the guidelines, you can plug it into the calculator. Wait, the fat
content is too high…I thought it was okay but I’m really out of compliance.
How often do you check this?
I got this from the lady from Texico and I thought it would be okay. But I’m really out of
compliance.
So what will you do, will you stop serving it?
Next year I will.
But can it be sold in vending machines?
Between certain time periods. They can have it between breakfast and lunch but not during
serving time. They can have it after lunch. But not during serving times and that kind of thing.
Have you experienced any funding cuts due to the economy lately?
Everything has been stable for me, I’m very fortunate to have good support from the
administration.
50
Healthier choices are more expensive.
You have to stay within compliance and you get audited every five years. If you aren’t staying in
compliance in previous years I think it’s pretty obvious.
When they come are they just looking at the current year?
Yes that week and that year. But if they are suspicious they can look at records from previous
years. I think you have to keep your records for five years. You would have to produce them.
Also, are more students qualifying for free and reduced due to the economy?
Not on this campus or this school. Everyone at this school has a job.
What are your opinions on advertising in schools? Is there a lot within this school?
Not on this campus I don’t think. I don’t know if it is right or not…I mean you are trying to
encourage them to eat healthy and be healthy so it’s probably not a good idea.
[looking at some records]
You have to keep a record of what you serve. So for instance on Monday we had chicken
nuggets with a roll as the entrée. For a meal to be reimbursed the kids must take the entrée as I
have defined it. When the student walks away from the register I don’t care what they do with
the food – I mean I shouldn’t say that – but I just want to get that money from the government.
Here are the chicken nuggets and she’ll record how much was prepared and served. We have to
keep records of temperatures.
[looking at kids coming through the line]
What’s being served today?
Corn and green beans, tator tots, chicken cordon blue or the hamburger/cheeseburger meal, fresh
salad, pasta, We’ve got the fruit and veggies.
Is it always ranch dressing?
I just do ranch… it’s easier. I used to offer Italian but they never used it.
An entrée plus two components is a reimbursable meal.
I’ll take you to the snack bar now.
Ice cream, sandwich, chips (several baked and reduced fat options), salads, pretzels every day,
popcorn chicken is today, water, Gatorade, Nutrigrains, I also serve Nutrigrains for breakfast
now a la carte.

51
Interview #2
Boerne ISD
Food Service Director
What are your responsibilities as the Food Service Director?
I oversee 52 employees and we have 10 campuses so each campus has a self serve kitchen
meaning we prepare the meals in the kitchen. I have to make sure all the employees are at work
every day and I oversee purchasing all the groceries and repairs on the equipment, purchasing the
equipment. Making sure we have schedules in place so all the teachers know our time frame.
Actually our schedules are done by the principal so we follow their schedule at lunch. I order
commodities each year.
Do all the schools have the same menu?
Yes, they all have the same menu. It is easier; we work on a 4 week cycle menu. That way we
have the same thing repeating each month and that makes it easier. I’m already planning the
menus for next year and I just placed my order for the commodities for next year. We have to
plan that in advance. So I’m getting ready for next year already.
Do you visit each school regularly?
I don’t get out as much as I would like but I am required to visit them every year for an on sight
review. It’s in depth to make sure that the meals going through are reimbursed meals.
This district is only 20% free and reduced. That is low. Most of our sales are done with a la carte
sales. Our a la carte sales involve the same foods on the menu but they can pick and choose
items. It’s all low fat, low sodium, whole grain. I use turkey hot dogs and whole grain buns. I use
ground sirloin when I serve beef because it’s much lower in fat. I have a very active parent
group on a nutrition committee and we review it all the time. They are always watching out for
me which is good. We try to do things so we can prepare menus from scratch as opposed to….
A lot of bigger schools get a lot of commodity dollars to spend and the way they use their money
is by processing something like ground beef into steak fingers or chicken fingers in order to get
more yield on their product. So they base their menu on those things and that’s what kids like to
eat. And that processing, yes it is processed food, but it’s done at a lower sodium lower fat, more
soy because it is processed for the school lunch program.
This process is done differently than something you would buy at HEB for your use. In other
words you could get a chicken fried steak and you just heat them and eat them but what you
would get at HEB is completely different from what is served in the school lunch program.
So you think they are making an effort? They are eliminating the Trans fats. They have done that. We do a lot of low fat low sodium
whole grains now. Almost everything I do has something to do with that.
What is a typical meal like?
Here is a menu. Like today to make it easier on my staff and I’ve had to reduce my staffing…so I
just have one choice today and it is chicken nuggets, mashed potatoes with gravy, green beans,
wheat roll, fruit, milk/juice.

52
We offer two choices of fresh fruit every day and two vegetables, most of the time they are
steamed. We get a lot of frozen vegetables- I try to get that as much as possible rather than
canned.
Now those chicken nuggets were a product of processing from out commodities. So we turned
out chickens into chicken nuggets and chicken patties. Now they were processed at a lower fat
because they use soy. Everything is a better product.
Tomorrow we have two choices. Tuesday, Wednesday, and Thursday I offer two entrée choices.
Our spaghetti we use a low fat meat sauce and low fat ground beef. Our cheeseburgers are very
low fat, no Trans fats. We use wheat buns. The parents on the committee that I am with…we
have a SHAC- School Health Advisory Council. It was something that was mandatory that we
had to create and mandatory for all school districts. So I’m just a small part of that…it includes
sex education, health, PE, tobacco, alcohol, and nutrition. And so we have a subcommittee for
nutrition and we meet quarterly. The group is mostly parents appointed by the school board,
some administrators, some teachers, and some students. It’s really interesting to hear the
students’ point of view- It’s good because you want to hear their feedback. It has been a good
thing because they suggested, well I use wheat and whole grains so why don’t you put it on your
menu. I said well I use turkey hot dogs so they said why don’t you put that on the menu.
In our commodity program we are given a choice to participate in the Fresh Fruits and
Vegetables Program. It’s a program set up by department of defense and they provide fresh fruits
and vegetables and you are given so many dollars to spend on that. That comes through our
regular produce company that we do business with every week. They also have a program which
enables us to have fresh vegetables come in from the farm. I mean it’s local, they come in dirty.
I’ve been participating in that for about 5 years. Although I’m given very little dollars to spend it
helps. It helps a lot to offer more to the students.
I see these slogans…
These slogans are part of the CATCH Program- Coordinated Approach to Children’s Health.
That’s the acronym. They have cute posters and a lot of our schools have the posters in them and
give lessons on the GO, SLOW, and WHOA. I try not to serve any WHOA foods!
What percent of the students in the district eat the school lunch?
20% of the district population qualify for free and reduced. And I would say about 30% of the
student population eats the school lunch. It’s a low participation. We have over 6200 students in
the district and we serve about 2000 meals each day. But, of course, it also depends on what
we’re having!
How strictly do you follow federal guidelines?
We follow them to the max. When you go to squaremeals.org…Texas Department of Agriculture
governs our program. They have online a nutrient calculator. If you select Texas there is virtually
nothing you can serve these kids.
So you think Texas is stricter than other states?
OH YES! And it’s the serving size, the fat, the sugar. I mean very very strict.

53
Before you put a meal out do you check it on the calculator?
Oh yes! In fact, there are some recipes put out by the USDA that do not meet nutritional
standards in Texas. Cause it has too much sugar or fat. Very interesting!
They do a review every five years- a compliance monitor comes and reviews. They make sure
you’re serving your reimbursable meal…mine is traditional. And then we are offer versus serve
so the students have the right to choose 3 of the 5 meal components that we offer. And if they
take 3 it’s a reimbursable meal. If they take 2 we have to count that as a la carte. They can take
all five if they want, it doesn’t matter, just as long as they take 3.
So someone could take milk, a wheat roll, and an apple and that is reimbursable?
Yes because it incorporates 3 components.
Do you think the nutritional content of school lunches impacts academic performance?
OH YES, I think food has a direct impact on academic performance. Children eating meals high
in sugar can’t perform. Sugar not only causes hyperactivity and obesity but it causes a high and
then an extreme low- and that happens to someone who is healthy…And we have so many
children who are diabetic or the opposite. It would definitely have an impact and we strive to
give them protein every day. That’s something parents didn’t understand- I’m required to give
them 2 oz. of protein everyday whether it’s in the form of cheese, beans, or meat. They didn’t
realize that I’m required to do that. We have guidelines to follow from the USDA. There is a
chart with the traditional meal pattern for what you offer.
Yeah, I think it definitely has a direct impact on their performance.
Approximately what percent of students in your school district is obese?
They did the Fitnessgram last year and the nurse would have actual data. I believe around 10%.
Have changes been made in recent years that you are aware of in an effort to reduce the
child obesity epidemic?
Our Texas Public School Nutrition Policy was the biggest effort of all to make us start taking
action in just 3 months time, that’s all the warning we had. Each year we’ve had to get
stricter…it was a four year plan begun in August 2004. Susan Combs was the commissioner of
agriculture at the time and when she put out that nutrition policy each year we had to do
something stricter. Elementary schools were the strictest; I mean they couldn’t have access to
anything. They were used to pizza parties and cupcakes for birthdays but that would compromise
their lunch so we had to put a stop to that. So it has been a big transition and it has been hard for
administrators to understand where we’re coming from. But we have to know where they’re at
too. But all in all we’ve worked out a good plan and I think we’re all on the same page now. Or
using M&Ms for math class and then eating them…you can’t do that anymore.
Has your funding been reduced due to the economic downturn?
No, funding comes from the fact that the meals are prepared and we get reimbursed for meals.
And each year that reimbursement rate goes up a certain percent. And if you get more meals
served, the more money you get. But I don’t have many reimbursed meals here so I get most of
my money from paid meals. And our sales haven’t gone down, actually they have gone up. Our
54
meals cost $3.00 in primary schools and $2.25 in secondary schools. We have some of the
highest prices in the state of Texas. So the economic downturn hasn’t really affected us.
Are vending machines in your district?
Yes our district has some vending machines but of course if they are in the cafeteria in the
serving area then I am in charge of those because I get the funding from them…well, a certain
percentage.
Across the district, everything in the machines are in compliance. So if there are candy-bars in
the machines I have to ask the vendors to take them out. I have to monitor it.
What about advertising in your schools?
Those are called exclusive contracts and we can’t do that anymore. You can only do a bidding
process with the company- it can’t be exclusive anymore. In fact the vending machines can’t
even have the coca cola emblem on them…it has a water ad instead.
Interview #3
Harlandale ISD
Food Service Director
We are Provision 2 so we have a completely different view on how to create our menus.
Edgewood is a Provision 2 and Southside but everyone else is going to be non-provision 2. And
that is predominately because we have lower economic populations. Our revenues are totally
different than what’d you see in a Non-provision 2 school.
What are the main differences?
Most of our funding comes strictly from participation because we feed students for free. There is
not a lot of money exchange and we don’t have a lot of a la carte sales. Everything is driven by
how many kids we feed. We have 98% participation- we serve breakfast in the classroom from
Pre-K through 12th
grade. So everyone eats breakfast for free, we are at 98% there and for lunch
we are at 90% participation. We are completely driven from that. If we don’t get a high
participation then we don’t get enough funding to be solvent. Whereas you look at Non-
provision 2, their kids are paying for their meals or they are buying a la carte items. We have
88% that qualify for free and reduced meals. We have to meet price points because we are giving
it for free. For the 12% of the kids that would typically be paying us for the meals, we are losing
revenue. We feed meals free for everyone. So we have to consider the 12% of that loss and make
up for it in other ways. There’s a lot that we have to consider. Everybody has to consider their
price points but because we have to compensate for that loss, we have to look at things a little
differently.
What is a typical meal like for you?
Would you like to see a menu? It varies, we have a 4 week cycle and it varies from elementary,
middle, and high.
So you have a different menu for elementary, middle, and high school?

55
They are similar in some ways because we try to keep our orders as simple as possible to make it
easier on our venders but what we feed at a high school level is different from elementary
because they just don’t always like the same foods. This is our high school menu so you’ll see a
variety of things. We use turkey chili in our “corn chip pie. We have a premade turkey chili
instead of using hamburger. Our hot dogs/corn dogs are made from turkey.
We use all low fat cheese and we do not use any oil. We don’t fry anything. Our enchiladas are
healthy. We make them here – we steam the tortillas, use no oil, we use low fat cheese. Parents
will ask how serving pizza can be healthy. Well, we use low fat pepperoni, low fat cheese, and a
whole grain crust. And we only serve the children one slice. We have made efforts to make
these foods healthier. Because they are still kids and I’m a registered dietician myself and I still
believe that they should have some things in moderation. That is the key- to teach them to make
the better choices. If you restrict foods they will just want it more. So it’s a process of them
being kids and adults- are you going to tell me that adults don’t eat pizza. But we can make it as
healthy as possible without them even knowing what we are doing. We do turkey a la king-
that’s a scratch item with vegetables, turkey, and a gravy sauce over rice. Chicken parmesan with
pasta. There are various items- lasagna, oven fried chicken baked in our ovens, fish sticks,
spaghetti. It varies. Every year is pretty much the same although we try to switch it up somewhat.
But we are limited in school nutrition and we have to stay on budget. I would love to buy all
sorts of things, but our district is going to fund that. So we find the best we possibly can with the
money that we have. And some days our oven fried chicken is one of our highest priced items
because it is a whole meat chicken- it’s chicken breast- so we spend a lot there but then we go
cheaper on things like fish sticks. You come to an average per week versus looking at just one
item. You know you can’t get cheap with everything, it just depends. We do a lot of commodity
processing which enables us to use…we get dollars called Pal Dollars based on how many kids
we feed (our participation) which is high for us. We get 800,000 dollars toward commodity
processing. What happens is if we were going to make hamburger patties we say we want so
many pounds based on our velocities from last year- we want this many patties made- and the
pay dollars provides a discount off the case. So instead of it being $20 a case we get it for $14.
So it helps us bring out price point for that particular item down, which is very helpful. People
use their commodity dollars differently depending on their menu. We are trying to get our price
point as low as we can for our high velocity foods. So, you know, it just depends on how you use
your commodity dollars. Like Randolph probably has 50,000 dollars. We are 22 schools and
14,000 kids and Randolph Field is small. We do breakfasts in the classroom and we’ve made a
lot of effort- our biscuits are whole grain biscuits, our turkey sausage…our morning roll is
similar to a sweet roll because you want it to be visibly appealing to the kids but it is all whole
grain…I could buy a honey bun and serve it for breakfast but I’m not going to do that. The
honey bun would be cheaper than what I am paying for the morning roll and it would probably
even comply with nutrition policy – believe it or not – but I’m still not going to do that. We
want to give them foods that they like because ultimately you want them to eat it. We tried to do
something called Bagelors which is a bagel with cream cheese inside and they are flavored
strawberry and blueberry..it’s a fantastic product…but our kids saw that dough of a bagel and it
was the end of that. They were like “no thank you”…they just wouldn’t eat it.
And you have to think about what they are eating at home.
Exactly, it’s hard because they are eating fast food and crud at home. And that’s what they want
to eat…so we have to make a mixture…we give them healthier versions of some of those things.

56
We make better versions but it is still something they like. You have to manipulate it as much as
possible.
I think that makes your job so important- you are really providing an example of healthy
foods for them that they don’t get at home.
Right, and every day we also provide a baked potato plate, a chef’s salad plate, and several
sandwich options. So they also have those options. We also tried a yogurt parfait but it is just not
what our clientele are looking for. If they’re not going to eat it then we don’t need to provide it.
We hoped they would like the Bagelors and we left it in for a couple months and they just didn’t
like it. But what I tell parents, I have a 6 yr old, a 3 yr old, and a 6 month and I wouldn’t put
anything on the menu that I wouldn’t feed them. And that’s the honest truth. That’s how I decide
what I will feed these kids. Now would I let my kids…like we do sell some items like baked hot
Cheetos and parents would say you sell those…and yes, if I was going to give my kids chips
which I don’t typically do I would give them a baked Cheeto. Now I wouldn’t give them money
every day to buy them but that’s me as a parent. We are giving them the best options but
ultimately the parent has to be responsible and I can’t make that choice for them. We have to
stay solvent and make enough money that we can run this program. I mean we make 600,000 a
year which is nothing compared to Non-provision schools. The kids here just don’t buy. But my
milk budget is 1.2 million because they drink that much milk. And its free to them but they have
learned this community to drink milk and that is important. So it’s a win/lose situation. You just
have to do the best at what you provide. We can’t do everything perfect- we can’t provide
organic foods to everybody, but we do pretty healthy foods. And yes we make it look like
generic foods on the menu because this is what the kids are seeing. But we do work very hard to
make sure that what we provide is a healthy food for them. And we follow nutrition policy but a
lot of time we try to do even better. It’s just better for the kids.
We offer fresh fruit and fresh vegetables every day. We do offer versus serve. We don’t just give
them a straight tray because that generates so much waste. They have to choose three but we let
them choose what they want. They could choose 3 vegetables if they want it. Our kids actually
do eat a lot of fruits and vegetables and that’s what I want. I want them to choose it at school
because they are not getting that at home. So they get it here which is great. We provide usually
4 different types of fruits and vegetables everyday- some are cooked and some are fresh.
Sometimes we serve more depending on the menu. And they can take three of them if they want.
And if a kid comes up and wants another, we’ll give it to them. By all means eat more fruits and
vegetables, that doesn’t bother me! We really try to push as much as we can with the fruits and
vegetables.
How often do you visit each school?
It’s very hard to get out there especially for my position because I also do HR things to, like
handling employees. Underneath me I have a supervisor who handles most of our commodity
processing and our inventory system. She does a lot of handling recipes, making sure they are up
to date. And then underneath me I have two managers of operations who are previous managers
in my kitchens usually at the high school levels and all my schools are split between them. They
are the ones if I am having an issue I send them out. They are out there on a daily basis visiting
my schools. I keep myself on a schedule. They never know when I’m coming. We have manager

57
meetings once a month, sometimes more often. I try to visit the schools as much as I can but a lot
of my time is dealing with employees and administrative stuff like dealing with the budget.
We do a lot of testing in the schools- usually about this time of the year we still start testing for
next year to see how new items are perceived. We do a first run through in a few classrooms and
if it is successful we will test it on a larger scale. For example breakfast is on a two week
schedule and kids get tired of certain foods. Some items, like a pig in a blanket, is loved and if
we attempted to take it away we’d be in a lot of trouble. They just never get tired of it- so there
are certain things we wouldn’t dare take away but there are also things they get tired of.
How strictly do you follow federal guidelines?
Well we have to. Well, we are supposed to. Auditors come every five years but I choose to be as
strict as I can for the entire time. That’s just me personally, not everyone does that …and of
course we’re not perfect…even when the auditors come through, we didn’t have any findings but
there will still be times when a manager forgets to put something on the production record. But
we have a system where we pull production records annually in January and my supervisor and I
review every production record for a particular month and then we start the training process each
year to get them back on track. But as far as making sure we are providing the right foods- we
don’t put anything on our menu that doesn’t comply with federal guidelines. We just don’t and a
lot of that is because we are dieticians. It really is. Because we are concerned- we are truthfully
concerned- that is our field. So we tailor what we are doing to make sure it complies.
With the USDA and TDA there is a lot of gray area.
But you do have 5 years in between CRE’s and nobody comes in between. So you really could
do anything you wanted. You know when they are coming. But it’s harder to do backpedaling to
fix the managers and train them to do things correctly right before they come. So we comply the
whole time. That’s part of my job is to follow federal guidelines. If we got reported my job could
be gone.
Do you think nutritional content of school meals impacts academic performance?
Ultimately what we have found here…There is a direct relationship. Eight years ago we started
serving breakfast in the classroom. The reason for this was a push for better academic
performance and higher test scores. For our demographic, the meals that these children eat are at
school. And sometimes that’s all they eat all day. Academically speaking, we are aware that the
only way for them to learn is to eat. It’s to get nutrition. And there is research everywhere that
says it. There is no doubt that you need to ingest good nutrition to think. Many of our students
were coming to school hungry. And many of these kids eat lunch at school and do not eat again
until breakfast. So does the nutritional content of our meals impact academic performance?
Yes- I believe so! This district is very in tune with this issue. They know that nutrition is
important and they support it as best we can. We have a huge after school program where we
feed snacks and we provide free evening meals for the elementary level schools- It is that big of
a push. The district wants better test scores and if we are even going to attempt to obtain higher
scores these kids need to eat nutritionally. You give them candy and they get a high and then a
low...Trying to get a kid to do something when their stomach is growling is impossible. My
children can’t do anything hungry and I can’t function when I am hungry. So how can you

58
expect a child to? It’s important to give them everything we can- and we give it
nutritionally…We give them what they need to be able to think and do their work.
Approximately what percent of students in your district are obese?
Our students recently completed the Fitnessgram but we have found that this data can be
manipulated and is innaccurate. Our data indicated that almost 98% of our students completed
their fitness goals which is ridiculous. We know our kids…We have a high percentage of
obesity in our district. Our obesity rates are very high. These kids are not at a normal level. The
Fitnessgram was supposed to be something that could provide us with good information but it
didn’t. The data is worthless.
With all the talk of the obesity epidemic lately, do you think beneficial changes have been
made in schools?
Many changes were implemented in 2004. Changes have been made but I went to a school in the
Houston area to look at equipment and they still had fryers in their schools- and last year fryers
were supposed to be eliminated. I found out that they were exempted from USDA because they
claimed that they have too many kids in their district and in order to produce enough volume
they need to use frying because it is faster. Ovens take up more space and they claimed they
don’t have enough space in the kitchen to provide for the kids. Unfortunately, loopholes are
everywhere and you can choose to do more or you can choose to do the bare minimum…For
example, you can sell Hershey bars with peanuts. It is okay since it has peanuts. So you can sell
a snickers – but do I choose to do that? No, but some do because they can and they want to
make money off of it. I am a dietician so I have a nutrition background and I personally cannot
sell a snickers bar. I would never give my children that. And I will not do that to other kids
knowingly. Because you know they are going to buy it if I sell it- It’s human nature. I’m trying
to provide the best environment here because when they go home they are free to go to
McDonalds. And unfortunately that is the part that makes the kids obese. From four o’clock on
they are free to go to McDonalds…and that’s why they are obese.
What is the school districts view on vending machines?
We do have them but they are regulated. At elementary and middle school level they can only be
100% juice or water. The reason why is because when they have school functions there is
something to buy. The kids don’t really take to them. In high schools there is a limit to how
much sugar drinks can be in the machine. Right now 20% can be sugary drinks- like soda or
Gatorade. We still do that but it is being phased out. The district decided that, for purposes
outside of school, like when they have basketball games there are other people utilizing the
machines and so they still want to have that option. We cannot have them where meals are being
served so if they are in those areas they are on timers and are turned off. There are many rules for
vending that we have to follow. The high schools have some snack machines but we follow
nutrition policy on those too- so no candy or that kind of thing. At Harlandale foods in vending
machines must have below 5 grams of fat per serving and that is not part of Nutrition Policy but
we are doing that because we are trying to be better. We have to still provide things but we try to
do the best we can while we are providing. Ultimately there are more than just students that
utilize these campuses so our district still wants to cater to that clientele. And it is revenue- it
does not go to child nutrition- it goes to the school itself. So we try to have another form of
revenue to use for school functions but ultimately it will be phased out eventually.
59
What about advertising?
Our machines will have the Coca-Cola or Gatorade symbol on them. But at the
elementary/middle level it will be Dasani. Because we have a coke vendor. That’s part of the
gray area. I’d prefer not to do any vending- they are going to go to their stop and shop and get
what they want. If people know there aren’t vending machines on campus they will bring their
own. So we don’t really need vending machines. But those schools want the revenue. Would I
prefer to take it out- well yes but that eliminates a source of revenue. So it’s a toss up- so we try
to find the best way to make everyone happy and stay compliant. Menu wise, I get to do what I
want to do. I think vending will go out completely- we are headed in that direction- but we are
trying to ease it out.
Have you found funding decreased due to the economic downturn?
The funding has not decreased. Each year we receive a three percent increase on reimbursement
for each meal. It’s been that way for many years. The problem is that the price of food has
increased ten to fifteen percent. So our funding has not matched the increase in prices. It has
been tough, but if you utilize your commodity dollars the way you are supposed to and you take
the time to research you can find products. You need to price things correctly- but it’s possible.
Because we made money last year, so you can do it, but it takes a lot of effort. I watch my
numbers on a daily basis for how many reimbursed meals we have each day. It’s part of my job.
If I see something decrease I have to find out why- how did I lose a hundred kids one day- That’s
close to $10,000 lost. You add that up several times over the year, you are losing a lot! So the
funding is coming in but it doesn’t match food prices. Prices skyrocketed and they have stayed at
that point. For example, we have a huge milk budget and we were serving milk in the plastic
bottles which is more expensive. We had to switch back to the paper cartons and we saved
$400,000. You can make changes that enable you to still provide healthy foods. Our food may
not be organic but its healthy. And, of course, our clientele isn’t asking for organic food. Maybe
they are serving organic products in the Alamo Heights ISD, but they charge out the wazoo.
We can’t do that but thankfully our students aren’t asking for that. But we try to educate our
parents that what we are providing is healthy. You’re feeding my kids pizza, hotdogs,
hamburgers. We have comparison sheets that show our hotdog compared to a normal hotdog or
our pizza compared to a normal pizza. A lot comes down to portion sizes and many parents don’t
understand that. It’s called moderation! I try to drill that in. You eat in moderation and you can
still eat tasty foods. Kids have ONE slice of pizza and fruits or vegetables and milk. They eat it
and they are full. They could go back and buy another piece but they don’t.

60

61

62
REFERENCES
Campos, Alba. (1996). Intelligent Quotient of Obese Children and Adolescents by the Weschler
Scale. Rev Saude Publica, 30(1), 85-90.
Cooley, Charles Horton. 1902 [1983]. Human Nature and the Social Order. New Brunswick, NJ:
Transaction.
Crosnoe, Robert. (2007). Gender, Obesity, and Education. Sociology of Education, 80(3), 241-
260.
Crosnoe, Robert & Muller, Chandra. (2004). Body Mass Index, Academic Achievement, and
School Context: Examining the Educational Experiences of Adolescents at Risk of
Obesity. Journal of Health and Social Behavior, 45(4), 393-407.
American Academy of Child & Adolescent Psychiatry. 2008. ―Obesity in Children and Teens.‖
Retrieved on April 11, 2010 from
http://www.aacap.org/galleries/FactsForFamilies/79_obesity_in_children_and_teens.pdf.
Glewwe, Paul, Jacoby, Hanah, & King, Elizabeth. (2001). Early Childhood Nutrition and
Academic Achievement: A Longitudinal Analysis. Journal of Public Economics, 81(3),
345-369.
Greene, Lawrence. (1977). Malnutrition, Behavior, and Social Organization. New York:
Academic Press.
Gustafson, Katherine. 2010. ―Strange Bedfellows: Obesity and School Lunch.‖ Retrieved on
March 8, 2010 from
http://food.change.org/blog/view/strange_bedfellows_obesity_and_school_lunch.
Hofferth, Sandra & Curtin, Sally. (2005). Poverty, Food Programs, and Childhood Obesity.
Journal of Policy Analysis & Management, 24(4), 703-726.
Hunter, Robert. (1904). Poverty. New York: The MacMillan Company.
Ludwig. (2007). Childhood Obesity – The Shape of Things to Come. New England Journal of
Medicine, 357, 2325-2327.
MSNBC. 2005. ―Do Fast-Food Chains Cluster Around Schools?‖ Retrieved on March 7, 2010
from http://www.msnbc.msn.com/id/9053465/.
Organic Authority. 2010. ―Help School Lunches Go Organic!‖ Retrieved on March 3, 2010 from
http://www.organicauthority.com/organic-food/organic-food-articles/help-school-
lunches-go-organic.html.

63
PBS. 2002. NOW with Bill Moyers. ―Society and Community: Schools Inc.‖ Retrieved on
March 4, 2010 from http://www.pbs.org/now/society/schoolstats.html.
Pollitt, Ernesto. 1984. Nutrition and Educational Achievement. Paris, France: Unesco.
Pollit, Ernesto, Gersovitz, M., & Gargiulo, M. (1978). Educational Benefits of the United States
School Feeding Program: A Critical Review of the Literature. American Journal of
Public Health, 68(5), 277.
Ross, Catherine E. (1994). Overweight and Depression. Journal of Health and Social Behavior,
33, 63-75.
Ruiz, Rebecca. 2007. ―America’s Most Obese Cities.‖ Retrieved on April 10, 2010 from
http://www.forbes.com/2007/11/14/health-obesity-cities-forbeslife-
cx_rr_1114obese.html
Schafft, Kai, Jensen, Eric, & Hinrichs, Clare. (2009). Food Deserts and Overweight
Schoolchildren: Evidence from Pennsylvania. Rural Sociology, 74(2), 153-177.
Schanzenbach, Diane. 2005. ―Do School Lunches Contribute to Childhood Obesity?‖ Retrieved
on March 1, 2010 from http://academics.hamilton.edu/economics/home/lunch6.pdf.
Schwimmer Jeffrey, Burwinkle, Tasha, & Varni, James. (2003). Health-related Quality of Life of
Severely Obese Children and Adolescents. Jama, 289(14), 1813-1819.
Shashidhar, Harohalli. 2009. Malnutrition. Medscape. Retrieved on February 16, 2010 from
http://emedicine.medscape.com/article/985140-overview.
Taras, Howard & Potts-Datema, William. (2005). Obesity and Student Performance at School.
Journal of School Health, 75(8), 291-295.
The Hunger Site. 1999. Retrieved on February 16, 2010 from
http://www.thehungersite.com/clickToGive/aboutthecause.faces?siteId=1&link=ctg_ths_
aboutthecause_from_home_maincolumn.
The White House. 2010. ―President Obama Announces Steps to Reduce Dropout Rate and
Prepare Students for College and Careers.‖ Retrieved on April 1, 2010 from
http://www.whitehouse.gov/the-press-office/president-obama-announces-steps-reduce-
dropout-rate-and-prepare-students-college-an.
USDA. 2009. ―National School Lunch Program.‖ Retrieved on February 21, 2010 from
http://www.fns.usda.gov/cnd/lunch/aboutlunch/NSLPFactSheet.pdf.
USDA. 2010. ―Promoting Health Eating Behaviors: The Challenge.‖ Retrieved on March 1,
2010 at http://www.fns.usda.gov/tn/healthy/healthyeatingchallenge.html.