Understanding the Long-Term Budget Outlook · Understanding the Long-Term Budget Outlook Keith Hall...
14
CONGRESS OF THE UNITED STATES Testimony Understanding the Long-Term Budget Outlook Keith Hall Director Before the Committee on Homeland Security and Governmental Affairs United States Senate July 9, 2015 This document is embargoed until it is delivered at 10:00 a.m. (EDT) on Thursday, July 9, 2015. The contents may not be published, transmitted, or otherwise communicated by any print, broadcast, or electronic media before that time.
Transcript of Understanding the Long-Term Budget Outlook · Understanding the Long-Term Budget Outlook Keith Hall...

Testimony
Understanding the Long-Term Budget Outlook
Keith Hall Director
Before the Committee on
Homeland Security and Governmental Affairs United States Senate
July 9, 2015
This document is embargoed until it is delivered at 10:00 a.m. (EDT) on Thursday, July 9, 2015. The contents may not be published, transmitted, or otherwise communicated by any print, broadcast, or electronic media before that time.
CONGRESS OF THE UNITED STATES

Chairman Johnson, Senator Carper, and Members of the Committee, thank you for the opportunity to testify on the Congressional Budget Office’s assessment of the outlook for the federal budget over the long term. My statement today summarizes The 2015 Long-Term Budget Outlook, which CBO released last month.1
SummaryThe long-term outlook for the federal budget has changed little since last year, according to CBO’s projec-tions. If current laws remained generally unchanged in the future, federal debt held by the public would decline slightly relative to the economy’s annual output, or gross domestic product (GDP), over the next few years, CBO projects. After that, however, growing budget deficits—caused mainly by the aging of the population and rising health care costs—would push debt back to, and then above, its current high level. The deficit would grow from less than 3 percent of GDP this year to more than 6 per-cent in 2040. At that point, 25 years from now, federal debt held by the public would exceed 100 percent of GDP. (Federal debt is now equivalent to about 74 percent of GDP, a higher percentage than at any point in U.S. history except a seven-year period around World War II.)
Moreover, in 2040, debt would still be on an upward path relative to the size of the economy. The rising debt could not be sustained indefinitely; the government’s creditors would eventually begin to doubt its ability to cut spending or raise revenues by enough to pay its debt obligations, forcing the government to pay much higher interest rates to borrow money.
One way to measure the long-term fiscal imbalance is to assess the changes in revenues or noninterest spending that would be needed to achieve a chosen goal for federal debt. For example, if lawmakers wanted debt in 2040 to equal its current level of 74 percent of GDP, they could increase revenues or cut noninterest spending, relative to outcomes under current law, by a total of 1.1 percent of GDP each year starting in 2016—an amount equal to $210 billion in that year (see Figure 1). If they chose only to cut noninterest spending, that spending would have to be 5½ percent lower than CBO currently projects in each of the next 25 years. Alternatively, if they chose only to increase revenues, those revenues would have to be 6 percent higher each year than projected. Reducing debt
1. Congressional Budget Office, The 2015 Long-Term Budget Outlook (June 2015), www.cbo.gov/publication/50250.
to the average percentage of GDP seen over the past 50 years (38 percent) would require changes in spending or revenues more than twice as large.2
Budgetary outcomes are uncertain, however. They would undoubtedly differ from CBO’s projections—even if future tax and spending policies matched what is speci-fied in current law—because of unexpected changes in the economy, demographics, and other factors. Nonethe-less, CBO’s analysis shows that the main implication of this testimony applies under a wide range of possible values for some of those factors. That is, if current laws remained generally unchanged, federal debt, which is already high by historical standards, would probably be at least as high as it is today and would most likely be much higher.
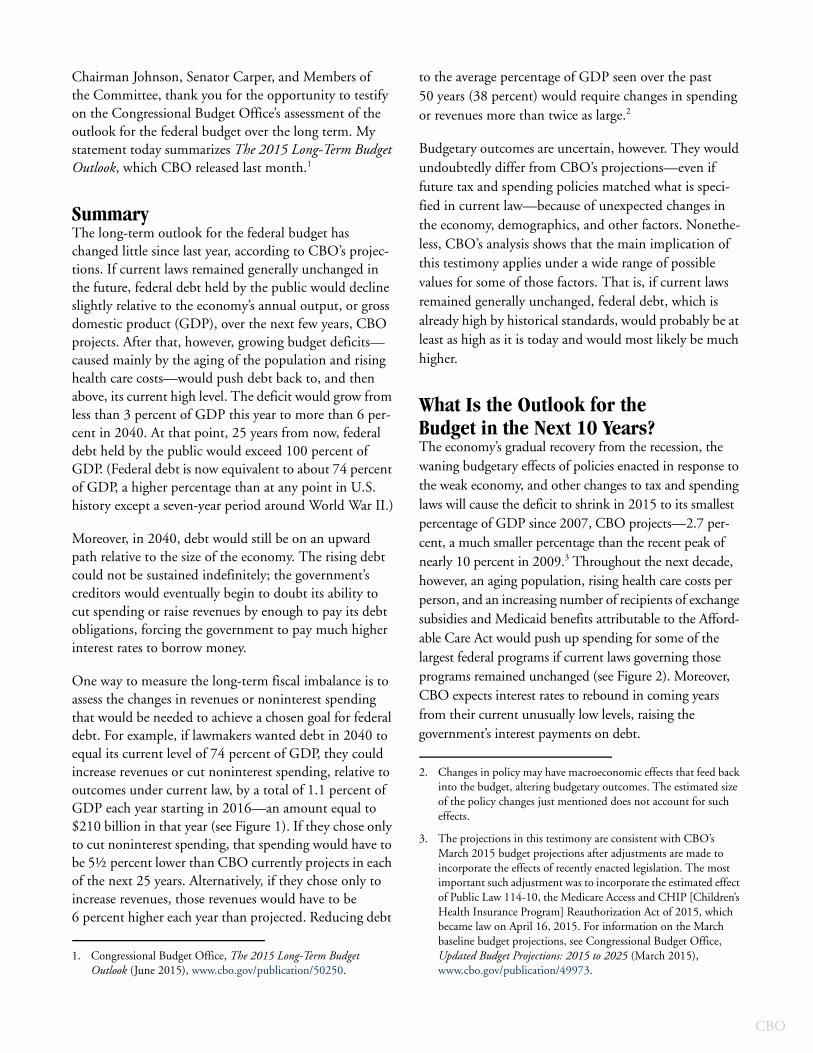
What Is the Outlook for the Budget in the Next 10 Years?The economy’s gradual recovery from the recession, the waning budgetary effects of policies enacted in response to the weak economy, and other changes to tax and spending laws will cause the deficit to shrink in 2015 to its smallest percentage of GDP since 2007, CBO projects—2.7 per-cent, a much smaller percentage than the recent peak of nearly 10 percent in 2009.3 Throughout the next decade, however, an aging population, rising health care costs per person, and an increasing number of recipients of exchange subsidies and Medicaid benefits attributable to the Afford-able Care Act would push up spending for some of the largest federal programs if current laws governing those programs remained unchanged (see Figure 2). Moreover, CBO expects interest rates to rebound in coming years from their current unusually low levels, raising the government’s interest payments on debt.
2. Changes in policy may have macroeconomic effects that feed back into the budget, altering budgetary outcomes. The estimated size of the policy changes just mentioned does not account for such effects.
3. The projections in this testimony are consistent with CBO’s March 2015 budget projections after adjustments are made to incorporate the effects of recently enacted legislation. The most important such adjustment was to incorporate the estimated effect of Public Law 114-10, the Medicare Access and CHIP [Children’s Health Insurance Program] Reauthorization Act of 2015, which became law on April 16, 2015. For information on the March baseline budget projections, see Congressional Budget Office, Updated Budget Projections: 2015 to 2025 (March 2015), www.cbo.gov/publication/49973.
CBO

2 UNDERSTANDING THE LONG-TERM BUDGET OUTLOOK JULY 2015
CBO
Figure 1.
The Size of Policy Changes Needed Over 25 Years to Make Federal Debt Meet Two Possible Goals in 2040
Source: Congressional Budget Office.
Notes: The values shown in this figure are relative to CBO’s extended baseline. The extended baseline generally reflects current law, following CBO’s 10-year baseline budget projections through 2025 and then extending the baseline concept for the rest of the long-term projection period. The sizes of the policy changes do not account for the macroeconomic feedback of the policies that might be changed or, in the case of the goal to reduce debt to 38 percent of GDP, of the reduction in debt.
GDP = gross domestic product.
If Lawmakers Aimed for . . .
Debt in 2040 to Equal Its 50-Year Average of
38% of GDP . . .Debt in 2040 to Equal Its Current Level of
74% of GDP . . .
What Would That Increase in Revenues or Reduction in Noninterest Spending Amount to in 2016?
$480 billion, which is equal to $1,450 per person $210 billion, which is equal to $650 per person
How Much Would They Need to Increase Revenues or Reduce Noninterest Spending per Year?
2.6% of GDP,which is equal to a
1.1% of GDP,which is equal to a
14% Increase in Revenues
13% Cut in Spending
6% Increase in Revenues
5½% Cut in Spending
or or
What If the Changes Were Increases (of Equal Percentage) in All Types of Revenues?
+$1,700One effect in 2016 is that, on average,
taxes on householdswould be higher than under current law. +$750
Values are for households in the middle fifth of the income distribution.Those taxes are projected to be $12,300 under current law.
-$2,400One effect is that
initial Social Security benefitswould be lower than under current law.
-$1,050
What If the Changes Were Cuts (of Equal Percentage) in All Types of Noninterest Spending?
Values are averages for people in the middle fifth of the lifetime earnings distribution who were born in the 1950s and who would claim benefits at age 65.Those benefits are projected to be $18,650 (in 2016 dollars) under current law.
TESTIMONY UNDERSTANDING THE LONG-TERM BUDGET OUTLOOK 3
Figure 2.
Increases in Spending and Revenues in CBO’s Baseline Between 2015 and 2025
Source: Congressional Budget Office.
a. Consists of all federal spending other than that for the major health care programs, Social Security, and net interest.
b. Consists of spending on Medicare (net of offsetting receipts), Medicaid, the Children’s Health Insurance Program, and subsidies offered through health insurance exchanges.
c. Consists of excise taxes, remittances to the Treasury from the Federal Reserve System, customs duties, estate and gift taxes, and miscellaneous fees and fines.
Other Noninterest Spendinga
Net Interest
Social Security
Major Health CareProgramsb
16%
24%
28%
31%
$2.4 TrillionTotal Increase inRevenues:
Total Increase inSpending:
$1.8 Trillion
Other Revenue Sourcesc
Corporate Income Taxes
Payroll Taxes
Individual Income Taxes
2%
10%
28%
60%
Budget deficits would not substantially increase at first, but eventually they would begin to rise. They would approach 4 percent of GDP toward the end of the 10-year period spanned by CBO’s baseline budget projec-tions, the agency anticipates. Deficits over the entire period would total about $7.4 trillion.
With deficits projected to remain close to their current percentage of GDP for the next few years, federal debt held by the public would remain at a very high level, between 73 percent and 74 percent of GDP, from 2016 through 2021. Thereafter, the larger deficits would boost debt—to 78 percent of GDP by the end of 2025.
What Is the Outlook for the Budget Through 2040?To analyze the state of the budget in the long term, CBO has extrapolated its 10-year baseline projections through 2040, yielding a set of extended baseline projections that span a total of 25 years. (Both sets of projections gener-ally incorporate the assumption that current law will not change.) Mainly because of the aging of the popula-tion and rising health care costs, the extended baseline projections show revenues that fall well short of spending over the long term, producing a substantial imbalance
in the federal budget (see Figure 3). As a result, budget deficits are projected to rise steadily and, by 2040, to raise federal debt held by the public to a percentage of GDP seen at only one previous time in U.S. history—the final year of World War II and the following year (see Figure 4).
The harmful effects that such large debt would have on the economy would worsen the budget outlook. The pro-jected increase in debt relative to the size of the economy, combined with a gradual increase in effective marginal tax rates (that is, the rates that would apply to an addi-tional dollar of income), would make economic output lower and interest rates higher than CBO projected when producing the extended baseline before considering those macroeconomic effects. Those effects would, in turn, feed back into the budget, leading to lower federal revenues and higher interest payments on the debt. (The harm that growing debt would cause to the economy was not fac-tored into CBO’s detailed long-term budgetary projec-tions; those effects were projected separately. Therefore, they are generally not reflected in the discussion of the extended baseline elsewhere in this testimony, but they are addressed in Chapter 6 of The 2015 Long-Term Budget Outlook.)
CBO

4 UNDERSTANDING THE LONG-TERM BUDGET OUTLOOK JULY 2015
CBO
Figure 3.
Federal Debt, Spending, and RevenuesPercentage of Gross Domestic Product
Source: Congressional Budget Office.
Note: The extended baseline generally reflects current law, following CBO’s 10-year baseline budget projections through 2025 and then extending the baseline concept for the rest of the long-term projection period. These projections do not reflect the macroeconomic feedback of the policies underlying the extended baseline.
2000 2005 2010 2015 2020 2025 2030 2035 20400
20
40
60
80
100
120
SpendingRevenues
Federal DebtHeld by the Public
In the extended baseline projections, before those feed-back effects are considered, federal spending rises from 20.5 percent of GDP this year to 25.3 percent of GDP by 2040 (see Table 1). (Its average over the past 50 years has been 20.1 percent.) The projected increase reflects the following paths for various types of spending:
Federal spending for Social Security and the government’s major health care programs—Medicare, Medicaid, the Children’s Health Insurance Program, and subsidies for health insurance purchased through the exchanges created by the Affordable Care Act—would rise sharply, to 14.2 percent of GDP by 2040, if current laws remained generally unchanged (see Figure 5 on page 7). That percentage would be more than twice the 6.5 percent average seen over the past 50 years. The boost in spending is projected to occur because of the aging of the population; growth in per capita spending on health care; and, to a lesser extent, an increased number of recipients of exchange subsidies and Medicaid benefits attributable to the Affordable Care Act.
The government’s net outlays for interest would grow to 4.3 percent of GDP by 2040, CBO projects. That percentage would be higher than the 2.0 percent
average of the past 50 years, because federal debt would be much larger.
In contrast, other noninterest spending—that is, spending on everything other than Social Security, the major health care programs, and net interest—would decline to 6.9 percent of GDP by 2040, which would be well below the 11.6 percent average of the past 50 years.
Federal revenues would also increase relative to GDP under current law, but much more slowly than federal spending would. Revenues would equal 19.4 percent of GDP by 2040, CBO projects, which would be higher than the 50-year average of 17.4 percent. That increase would occur mainly because people’s income grew more rapidly than inflation, pushing more income into higher tax brackets over time.4
4. One consequence is that individual income and payroll taxes as a share of income would grow for many households. For example, a married couple with two children earning the median income in 2014 and filing a joint tax return would have paid about 16 percent of their income in individual income and payroll taxes. Under current law, a similar couple earning the median income 25 years from now would pay about 19 percent of their income in individual income and payroll taxes.

TESTIMONY UNDERSTANDING THE LONG-TERM BUDGET OUTLOOK 5
Figure 4.
Federal Debt Held by the PublicPercentage of Gross Domestic Product
Source: Congressional Budget Office. For details about the sources of data used for past debt held by the public, see Congressional Budget
Office, Historical Data on Federal Debt Held by the Public (July 2010), www.cbo.gov/publication/21728.
Note: The extended baseline generally reflects current law, following CBO’s 10-year baseline budget projections through 2025 and then
extending the baseline concept for the rest of the long-term projection period. These projections do not reflect the macroeconomic
feedback of the policies underlying the extended baseline.
1790 1810 1830 1850 1870 1890 1910 1930 1950 1970 1990 2010 20300
20
40
60
80
100
120Actual Extended
BaselineProjection
Civil War World War I
GreatDepression
World War II The historically high and rising amounts of federal debt that CBO projects would have significant negative consequences, including reducing the total amounts of national saving and income in the long term; increasing the government’s interest payments, thereby putting more pressure on the rest of the budget; limiting lawmakers’ flexibility to respond to unforeseen events; and increasing the likelihood of a fiscal crisis.
By 2040, in CBO’s projections that do not account for macroeconomic feedback effects, the deficit equals 5.9 percent of GDP, a higher percentage than in any year between 1947 and 2008 (see Figure 6 on page 8). The resulting debt exceeds 100 percent of GDP in 2040, more than in any year except 1945 and 1946. Under the extended baseline with feedback effects included, CBO’s estimate of the deficit in 2040 is higher—6.6 percent of GDP—and so is its estimate of federal debt held by the public: 107 percent of GDP.
The outlook has worsened since 2007 mostly because of the severe economic downturn and significant changes in laws governing federal taxes and spending.5 In 2007, CBO projected that federal debt held by the public would equal 26 percent of GDP in 2040. By 2010, that projection had risen to 84 percent of GDP, and by 2013 to 105 percent of GDP. (Those projections did not incorporate macroeconomic feedback.)
5. For additional discussion of changes over time in CBO’s long-term projections, see Congressional Budget Office, The 2014 Long-Term Budget Outlook (July 2014), Appendix C, www.cbo.gov/publication/45471.
CBO typically expresses its long-term projections as per-centages of economic output. That approach automati-cally incorporates inflation and growth in population, output, and income, providing context for understanding the size of the government’s activities at different points in time and their effects on the sustainability of the budget.
What Consequences Would a Large and Growing Federal Debt Have?How long the nation could sustain such growth in federal debt is impossible to predict with any confidence. At some point, investors would begin to doubt the govern-ment’s willingness or ability to meet its debt obligations, requiring it to pay much higher interest costs in order to continue borrowing money. Such a fiscal crisis would present policymakers with extremely difficult choices and would probably have a substantial negative impact on the country. Unfortunately, there is no way to predict confi-dently whether or when such a fiscal crisis might occur in the United States. In particular, as the debt-to-GDP ratio rises, there is no identifiable point indicating that a crisis
CBO

6 UNDERSTANDING THE LONG-TERM BUDGET OUTLOOK JULY 2015
CBO
Table 1.
Key Projections Under CBO’s Extended BaselinePercentage of Gross Domestic Product
Source: Congressional Budget Office.
Notes: The extended baseline generally reflects current law, following CBO’s 10-year baseline budget projections through 2025 and then extending the baseline concept for the rest of the long-term projection period.
n.a. = not available.
a. These projections do not reflect the macroeconomic feedback of the policies underlying the extended baseline after 2025.
b. Net of offsetting receipts for Medicare.
c. Revenues include payroll taxes other than those paid by the federal government for federal employees, which are intragovernmental transactions. Revenues also include income taxes paid on Social Security benefits, which are credited to the trust funds.
RevenuesIndividual income taxes 8.4 9.5 10.4Payroll taxes 5.9 5.7 5.7Corporate income taxes 1.8 1.8 1.8Other sources of revenues 1.7 1.2 1.5____ ____ ____
Total Revenues 17.7 18.3 19.4
SpendingMandatory
Social Security 4.9 5.7 6.2Major health care programsb 5.2 6.1 8.0Other mandatory programs 2.6 2.3 1.8____ ____ ____
Subtotal 12.7 14.1 16.0Discretionary 6.5 5.1 5.1Net interest 1.3 3.0 4.3____ ____ ____
Total Spending 20.5 22.2 25.3
Deficit -2.7 -3.8 -5.9
Debt Held by the Public at the End of the Year 74 78 103
Deficit -2.7 -3.8 -6.6
Debt Held by the Public at the End of the Year 74 78 107
Memorandum:Social Securitya
Revenuesc 4.4 4.3 4.3Spending 4.9 5.7 6.2Net increase (-) in deficit -0.5 -1.4 -1.9
Medicarea
Revenuesc 1.5 1.6 1.7Spending 3.5 4.4 6.3Offsetting receipts -0.5 -0.8 -1.2Net increase (-) in deficit -1.5 -2.0 -3.4
Tax Expenditures 8.1 n.a. n.a.
Gross Domestic Product (Billions of dollars)a 18,016 27,456 50,800
With Macroeconomic Feedback
2015 2025 2040
Without Macroeconomic Feedbacka

TESTIMONY UNDERSTANDING THE LONG-TERM BUDGET OUTLOOK 7
Figure 5.
Spending and Revenues Under CBO’s Extended Baseline, Compared With Past AveragesPercentage of Gross Domestic Product
Source: Congressional Budget Office.
Note: The extended baseline generally reflects current law, following CBO’s 10-year baseline budget projections through 2025 and then extending the baseline concept for the rest of the long-term projection period. These projections do not reflect the macroeconomic feedback of the policies underlying the extended baseline.
a. Consists of spending on Medicare (net of offsetting receipts), Medicaid, the Children’s Health Insurance Program, and subsidies offered through health insurance exchanges.
b. Consists of all federal spending other than that for the major health care programs, Social Security, and net interest.
c. Consists of excise taxes, remittances to the Treasury from the Federal Reserve System, customs duties, estate and gift taxes, and miscellaneous fees and fines.
2040
2015
Average,1965–2014
7.9
8.4
10.4
2040
2015
Average,1965–2014
4.0
4.9
6.2
2.5
5.2
8.0
11.6
9.1
6.9
2.0
1.3
4.3
Social SecurityMajor Health CareProgramsa
Other NoninterestSpendingb Net Interest
1.7
1.7
1.5
OtherRevenue Sourcesc
IndividualIncome Taxes
TotalSpending
20.1
20.5
25.3
TotalRevenues
17.4
17.7
19.4
2.1
1.8
1.8
CorporateIncome Taxes
5.7
5.9
5.7
Payroll Taxes
is likely or imminent. But all else being equal, the larger a government’s debt, the greater the risk of a fiscal crisis.6
Even before a crisis occurred, the high and rising debt that CBO projects in the extended baseline would have macroeconomic effects with significant negative conse-quences for both the economy and the federal budget:
The large amount of federal borrowing would draw money away from private investment in productive capital over the long term, because the portion of people’s savings used to buy government securities would not be available to finance private investment. The result would be a smaller stock of capital, and therefore lower output and income, than would otherwise have been the case, all else being equal. (Despite those reductions, output and income per
6. For further discussion, see Congressional Budget Office, Federal Debt and the Risk of a Fiscal Crisis (July 2010), www.cbo.gov/publication/21625.
person, adjusted for inflation, would be higher in the future than they are now, thanks to the continued growth of productivity.)
Federal spending on interest payments would rise, thus requiring the government to raise taxes, reduce spending for benefits and services, or both to achieve any targets that it might choose for budget deficits and debt.
The large amount of debt would restrict policymakers’ ability to use tax and spending policies to respond to unexpected challenges, such as economic downturns or financial crises. As a result, those challenges would tend to have larger negative effects on the economy and on people’s well-being than they would otherwise. The large amount of debt could also compromise national security by constraining defense spending in times of international crisis or by limiting the country’s ability to prepare for such a crisis.
CBO

8 UNDERSTANDING THE LONG-TERM BUDGET OUTLOOK JULY 2015
CBO
Figure 6.
Spending, Revenues, and Deficits Under CBO’s Extended Baseline, Compared With Past AveragesPercentage of Gross Domestic Product
Source: Congressional Budget Office.
Note: The extended baseline generally reflects current law, following CBO’s 10-year baseline budget projections through 2025 and then extending the baseline concept for the rest of the long-term projection period. These projections do not reflect the macroeconomic feedback of the policies underlying the extended baseline.
2040
2015
Average,1965–2014
Federal Spending
Federal Revenues
20.1
17.4 -2.7 Deficit
20.5
17.7 -2.7
25.3
19.4 -5.9
How Uncertain Are the Long-Term Budget Projections?Budget projections are inherently uncertain. The projec-tions in this testimony generally reflect current law—so if future spending and tax policies differ from what is currently prescribed in law, budgetary outcomes will dif-fer from those in CBO’s extended baseline. But even if policies do not change, the economy, demographics, and other factors will undoubtedly differ from what CBO projects, and those differences will in turn cause budgetary outcomes to deviate from the projections in this testimony. Those variations could be within the ranges of experience observed in the relevant historical data—which, for the factors that CBO analyzes, cover roughly the past 50 to 70 years—or they might deviate from historical experience. Moreover, there could be sig-nificant budgetary effects from channels that CBO does not currently take into account in its estimates.
To illustrate some of the uncertainty about long-term budgetary outcomes, CBO has constructed alternative projections showing what would happen to the budget if various underlying factors differed from the values that were used in most of The 2015 Long-Term Budget Out-look. The agency focused on four factors that are among the most fundamental and yet most uncertain inputs into
the agency’s long-term economic and budget projections. Specifically, CBO quantified the consequences of alternative paths for the following variables:
The decline in mortality rates;
The growth rate of total factor productivity (that is, the efficiency with which labor and capital are used to produce goods and services);
Interest rates on federal debt held by the public; and
The growth rate of federal spending per beneficiary for Medicare and Medicaid.
For CBO’s alternative projections, the ranges of variation for those four factors were based on the historical varia-tion in their 25-year averages as well as on consideration of possible future developments, which together offer a guide (though admittedly an imperfect one) to the amount of uncertainty that surrounds projections of those factors over the next 25 years. To better capture overall uncertainty, CBO also constructed two projec-tions in which all four factors simultaneously varied from their values under the extended baseline. In one of those cases, all of the factors varied in ways that increased the

TESTIMONY UNDERSTANDING THE LONG-TERM BUDGET OUTLOOK 9
Figure 7.
Federal Debt Given Different Rates of Mortality Decline, Productivity Growth, Interest, and Growth of Federal Health Care SpendingPercentage of Gross Domestic Product
Source: Congressional Budget Office.
Notes: The extended baseline generally reflects current law, following CBO’s 10-year baseline budget projections through 2025 and then extending the baseline concept for the rest of the long-term projection period.
Federal debt refers to debt held by the public. Estimates for the extended baseline with macroeconomic feedback are CBO’s central estimates from ranges determined by alternative assessments about how much deficits crowd out investment in capital goods such as factories and computers (because a larger portion of private saving is being used to purchase government securities) and about how much people respond to changes in after-tax wages by adjusting the number of hours they work. To arrive at the other two sets of estimates, CBO used rates for four factors that were higher and lower than those used in the extended baseline with macroeconomic feedback by the following amounts: mortality rates, 0.30 percentage points; productivity growth, 0.30 percentage points; interest rates, 0.45 percentage points; and growth of per-beneficiary federal spending on Medicare and Medicaid, 0.45 percentage points.
2000 2005 2010 2015 2020 2025 2030 2035 20400
50
100
150
Extended Baseline WithMacroeconomic Feedback
76
107
144
All Four Factors LowerProjected Deficits
Actual Projected All Four Factors RaiseProjected Deficits
amount of federal debt; in the other, they varied in ways that reduced the amount of debt.
Different paths for those four factors would affect the budget in various ways. For example, lower-than-projected mortality rates would mean longer average life spans, which would increase the number of people who received benefits from such programs as Social Security, Medicare, and Medicaid; lower mortality rates would also boost the size of the labor force and thereby add to tax revenues (but by less than the increase in benefit costs). Faster growth in spending per beneficiary for Medicare and Medicaid would boost outlays for those two pro-grams. Either of those changes would increase deficits and debt—which would lead to lower output and higher interest rates, macroeconomic feedback that would fur-ther worsen the budget outlook. By contrast, faster growth in productivity or lower interest rates on federal debt held by the public would reduce deficits and debt—
the former, by raising output and increasing revenues, and the latter, by lowering the government’s interest payments.
The projected budgetary outcomes under the alternative paths differ widely. The simulated variations in productiv-ity, interest rates, and Medicare and Medicaid spending have large effects on the budget within 25 years, whereas the simulated variation in mortality rates does not. When only one of the factors is changed, CBO’s projections of federal debt held by the public in 2040 range from 89 per-cent of GDP to 130 percent, whereas debt is projected to be 107 percent under the extended baseline with macro-economic feedback. When all four factors are changed at once, projections of federal debt in 2040 range from 76 percent to 144 percent of GDP (see Figure 7). Those projected levels of debt are all high by historical standards, and a number of them exceed the peak of 106 percent of GDP that the United States reached in 1946.
CBO

10 UNDERSTANDING THE LONG-TERM BUDGET OUTLOOK JULY 2015
CBO
The four factors listed above are not the only ones that could differ from CBO’s expectations and, in turn, affect the agency’s budget projections. For example, an increase in the birthrate or in labor force participation could boost the growth of the labor force and thus raise tax revenues. Similarly, decisions by states about how much they spend on Medicaid could increase or decrease federal spending relative to CBO’s projections.
Large disruptions in the economy could have significant effects on the budget that are not quantified in this analy-sis. The analytic approach that CBO used for this long-term analysis focuses on projecting average outcomes. An economic depression, unexpectedly large losses on federal financial obligations, a large-scale military conflict, the development of a previously underused natural resource, or a major catastrophe—to give just a few examples— could create conditions in the next 25 years that are substantially better or worse than those that produced the historical data on which the analysis is based.
What Choices Do Policymakers Have?The unsustainable nature of the federal tax and spending policies specified in current law presents lawmakers and the public with difficult choices. Unless substantial changes were made to the major health care programs and Social Security, spending for those programs would equal a much larger percentage of GDP in the future than in the past. Federal spending as a whole would rise rapidly—even though, under current law, spending for all other federal benefits and services would make up a smaller percentage of GDP by 2025 than at any point in more than 70 years. Federal revenues would also repre-sent a larger percentage of GDP in the future than they have, on average, in the past few decades. Even so, spend-ing would soon start to exceed revenues by increasing amounts relative to GDP, generating rising budget defi-cits. As a result, federal debt held by the public would grow faster than the economy, starting a few years from now. Because debt is already unusually high relative to GDP, further sustained increases could be especially harmful to economic growth.
To put the federal budget on a sustainable path for the long term, lawmakers would have to make major changes to tax policies, spending policies, or both—by reducing spending for large benefit programs below the projected amounts, letting revenues rise more than they would under current law, or adopting some combination of
those approaches. The size of such changes would depend on the amount of federal debt that lawmakers considered appropriate.
For instance, if lawmakers set a goal for 2040 of reducing debt held by the public to the average percentage of GDP seen over the past 50 years (38 percent), one approach would be to increase revenues and cut noninterest spend-ing, relative to outcomes under current law, by a total of 2.6 percent of GDP each year beginning in 2016. That amount would be about $480 billion, or $1,450 per person, in 2016 (see Figure 1 on page 2).7 Many combi-nations of policies could be adopted to meet that goal, including the following:
At one end of the spectrum, lawmakers could choose to reduce deficits solely by increasing revenues. Such a policy would require boosting revenues by 14 percent in each year over the 2016–2040 period relative to the amounts that CBO projects in the extended baseline. For households in the middle fifth of the income distribution in 2016, a 14 percent increase in all types of revenues would raise federal tax payments for that year by about $1,700, on average.
At the other end of the spectrum, lawmakers could choose to reduce deficits solely by cutting noninterest spending, in which case they would have to make such spending 13 percent lower than projected in the extended baseline in each of the next 25 years. For example, a 13 percent cut would lower initial Social Security benefits by an average of about $2,400 for people in the middle fifth of the lifetime earnings distribution who were born in the 1950s and who claimed benefits at age 65.
Another goal might be to reduce debt in 2040 to its current percentage of GDP—74 percent. Meeting that goal would require increases in revenues and cuts in non-interest spending, relative to outcomes under current law, totaling 1.1 percent of GDP in each year beginning in 2016.8 Of course, other goals and other patterns for the timing of savings are possible as well.
7. The estimated size of those policy changes does not account for the macroeconomic effects either of the particular policies that might be changed or of the reduction in debt.
8. The estimated size of those policy changes does not account for the macroeconomic effects of the particular policies that might be changed.

TESTIMONY UNDERSTANDING THE LONG-TERM BUDGET OUTLOOK 11
In deciding how quickly to carry out policies to put fed-eral debt on a sustainable path—regardless of the chosen goal for debt—lawmakers would face difficult trade-offs:
The sooner significant deficit reduction was implemented, the smaller the government’s accumulated debt would be; the smaller the policy changes would need to be to achieve the chosen goal; and the less uncertainty there would be about what policies might be adopted. However, precipitous spending cuts or tax increases would give people little time to plan and adjust to those policy changes, and the changes would weaken the economic expansion during the next two years or so—a period when the Federal Reserve would have little ability to lower short-term interest rates to boost the economy.
Spending cuts or tax increases that were implemented several years from now would have a smaller negative effect on output and employment in the short term. However, waiting for some time before reducing spending or increasing taxes would result in a greater accumulation of debt, which would represent a greater drag on output and income in the long term and increase the size of the policy changes needed to reach the chosen target for debt.
CBO has estimated how much a delay in deficit reduc-tion would increase the size of the policy changes needed to achieve a chosen goal for debt. If the goal was to reduce debt to its 50-year historical average by 2040, but lawmakers waited to implement new policies until 2021, the combination of increases in revenues and reductions in noninterest spending over the 2021–2040
period would need to equal 3.2 percent of GDP—0.6 percentage points more than if policy changes took effect in 2016. If lawmakers chose the same goal but post-poned taking action until 2026, the necessary policy changes over the 2026–2040 period would amount to 4.2 percent of GDP.
Even if policy changes that shrank deficits in the long term were not implemented for several years, making decisions about them sooner rather than later could hold down longer-term interest rates, reduce uncertainty, and enhance businesses’ and consumers’ confidence. Such decisions could thereby make output and employment higher in the next few years than they would have been otherwise.
This testimony summarizes information presented in The 2015 Long-Term Budget Outlook, which is one in a series of reports on the state of the budget and the economy that CBO issues each year. That report represents the work of many people at CBO. In accor-dance with CBO’s mandate to provide objective, impar-tial analysis, this testimony makes no recommendations. It is available on CBO’s website at www.cbo.gov/publication/50316.
Keith Hall Director
CBO