Understanding the link between Sarcopenia and Frailty sarcopenia frailty september1… ·...
60
Understanding the link between Sarcopenia and Frailty José A. Morais MD, FRCPC Associate Professor and Director McGill Division of Geriatric Medicine Crabtree Nutrition Laboratories MUHC - Royal Victoria Hospital, Montreal
Transcript of Understanding the link between Sarcopenia and Frailty sarcopenia frailty september1… ·...
Understanding the link between Sarcopenia and Frailty
José A. Morais MD, FRCPCAssociate Professor and DirectorMcGill Division of Geriatric MedicineCrabtree Nutrition LaboratoriesMUHC - Royal Victoria Hospital, Montreal

Disclosure
None

Learning objectives
To understand
the physiological changes associated with aging leading to sarcopenia
the relationship between muscle mass, strength and physical function
measures of effective counteracting sarcopenia

Weight changes
WT
Age (y)
Men
Women
○,∆: American
●,▲: Canadian
Ministry of Health Canada 1980 & Vital Heath Statistics USA 1976


Muscle mass maintenance in man
Short K and Nair S, 2000
•Relative loss of MM ~ 50%
•Relative gain in FM ~ 84%


Inter-relationship between muscle and fat tissues
Aging
Muscle Fat
BMR
Exercise Diet
Cytokines
Nair KS 2005; Cesari
M 2005; Schrager
MA 2007
•Adiponectin
•Leptin
•TNF-α
•IL-6
•MCP-1

Sarcopenia:
Origins and Clinical Relevance
“…
In fact, there may be no single feature of age-related decline more striking than the age-
decline in lean body mass in affecting ambulation, mobility, energy intake, overall nutrient intake and
status, independence and breathing. …”
J. Nutr. 127: 990S–991S, 1997.
Irwin H. Rosenberg Jean Mayer Human Nutrition Research Center on Aging at Tufts University, Boston, MA
“… The Greek roots of the word are sarx for flesh and penia for loss. The term actually describes important changes in body composition and related functions. …” (term originally proposed in 1988)

Sarcopenia
SARCOPENIA
Hormones GH, E2
, T
Nutrition & Dietaryintake
InactivityCytokines
IL-6, TNF-
Weaknesses Metabolic Reserves
Disability, Morbidity, Mortality
Insulin ?
CNS & PNS (loss of
motoneurones)
Vandervoort
AA 2002; Solomon AM 2006; Dreyer HC 2005; Szulc
P 2004; Visser
M 2002

Both the amount and the proportion of muscle mass decline with age
Janssen et al J Appl Physiol 88, 200020 y.o 70 y.o 85 y.0

n
= 60,r
= 0.72; P<0.001
Muscle mass versus muscle strength
Upper leg muscle CSA (cm2)
1-R
M le
g pr
ess
(kg)
Verdijk
et al., unpublished

Importance of maintaining muscle mass

Skeletal muscle fiber loss• 1/4 between 30 and 70 years Lexell J. 1983
• type II > I
Muscle fiber atrophy (type IIa et IIx) Aniansson A. 1986
Muscle Tissues Age-related Changes
Subject27 yrs old
Fibre I
Fibre IIaFibre IIx
Subject77 yrs old
Lee W.S. et al. Clin Orthop Relat Res 2006;450:231-7
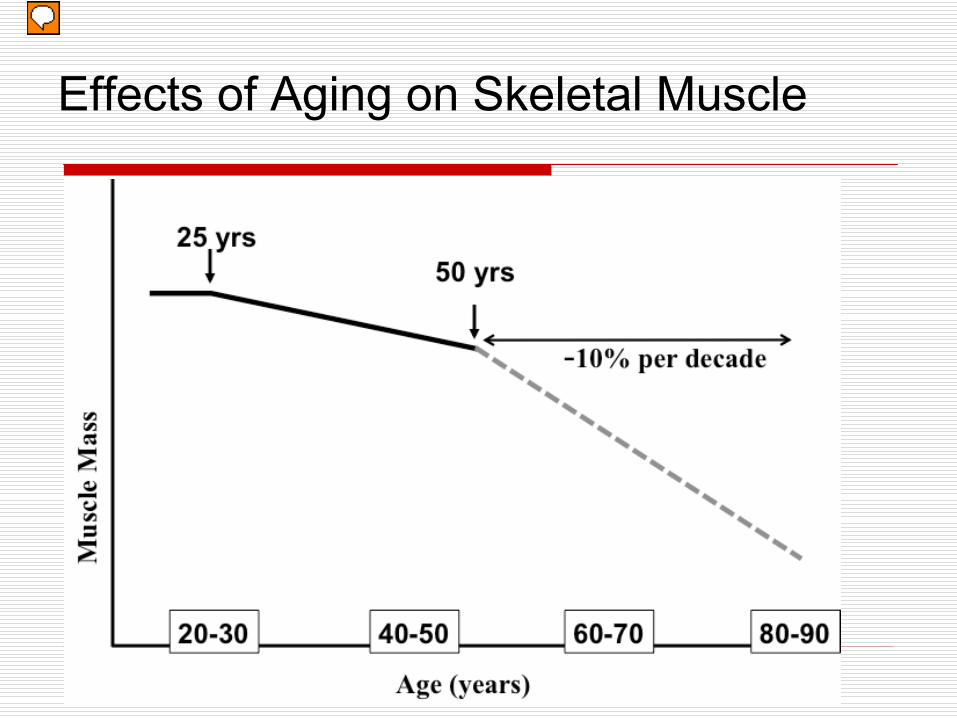
Effects of Aging on Skeletal Muscle
Presenter
Presentation Notes
On average, there is a peak in muscle mass in our twenties, with a slow decline until about 50. At this point, an accelerated loss begins. Of course, this is dependent on many factors, for example likely genetics and activity level.

External Causes and Skeletal Muscle Loss with Aging
Hip Replacement
Pneumonia
Injury/Fall
Presenter
Presentation Notes
As we get older, we lose the ability to fully recover from injury or severe muscle loss. So, if we look at our graph again, if I superimpose some of these events we can see how these might contribute to the accelerated rate of muscle loss in aging

Age-related decline in muscle strength
20
40
60
80
100
20 y 30 y 50y 70 y 90y
Maximal strength decline
• 1 to 1.5 % / year between 50 & 60 yrs
• 2 to 3 % / year after 60 yrs
• ++ isokinetic
• ++ concentric
• ++ lower limbs
• asymetrical decline agonist /antagonist
Lindle RS et al. J. Appl. Physiol. 83(5): 1581–1587, 1997

Muscle loss versus strength loss
Ferrucci
et al.,
J. Gerontology, 2012

Muscle power (strength x speed) loss• 2 to 3 X more important than strength loss Skelton DA 2002
• /
contraction speed +++ De vito G. 1998, Macaluso A. 2004
• Functional impact +++ Rantanen T. 1997, Foldvari M. 2000
- Mobility - Risk of fall - Stair climbing - Sit-to-Stand
Age-related decline in muscle power
Reduced muscle quality (Muscle Strength / Muscle mass)
• Knee extension torque/leg lean mass: decreased with age and body fat (Newman AB. Am J Geriatr Soc 2003;51:323-330)
• Strong relationship with muscle fat infiltration (Goodpaster BH 2006)
Function is more than strength
• It involves coordination, antagonizing muscles, balance…higher brain
function (decision making, risk assessment, emotional state)

Relationship between CNS and muscle: the motor units (MU)
McNeil et al 2005

Sarcopenia - Definition
« Progressive and inevitable age-related skeletal muscle mass loss » Evans W.J. 1995; Rosenberg I.H. 1997
Quantitative definition using DXA (Baumgartner R.N. et al. Am J Epidemiol 1998;147:755-63)
MM Index= Appendicular skeletal MM (kg) / Height (m²)
Threshold : - 2SD < MMI in a reference young population
Sarcopenia associated with self-reported IADL disability (♂&♀) and balance abnormality and use of cane in ♂
Prevalence: 10 to 24 % between 65 and 70 yrs30 to 60 % > 80 yrs old

Sarcopenia - DefinitionUsing Bioimpedance Analysis (BIA)
SMI = SMM/Body mass x 100
Class I: 1 SD bellow young
Class II: 2 SD bellow youngJanssen I et al. JAGS 2002;50:889-96
Sarcopenia: associated with 2-4 greater functional impairment and disability vs. non-sarcopenic
individuals
In the absence of a reference young population by either DXA or BIA Sarcopenia
: lowest 2 quintiles of MMI or lowest 20% of MMI Newman A et al. JAGS 2003;51:1602-9 ; Norman K et al. Clin Nutr 2009;28:78-82

Obesity and disability
Vincent HK Obesity reviews 2010

Sarcopenic-Obesity
Def. combines those of sarcopenia and obesityObesity: 2 SD > young reference groups %BF
Baumgartner RN. Ann NYAcad Sci 2000;904:437-48
♂: 27%; ♀: 38% ~ BMI of 27 kg/m2
SO: 2% 60-60 y; 10% > 80 y
SO was associated with 2-3 higher IADL disability over 7 y, while either obesity or sarcopenia alone were not
WHO def. of obesity BMI > 30 kg/m2
If no ref group Davinson KK JAGS 2002;50:1802-9
upper 2 quantiles of FM and lower 3 of MM
SO in pop > 70 y: ♂: 9.6%; ♀: 7.4%

Relation between sarcopenia, strength, fat mass and function
Variables not retained: muscle mass, muscle quality
Physical function: gait speed & balance (measured) + 5 questions (walking ¼ mile, stair climbing, kneeling, lifting 10 lbs, standing for 2 h)
Bouchard DR. J Aging Health 2010

Dynapenic-Obesity
Decrease in strength = Dynapenia (D) In principle, worse case scenario would be
dynapenic-obesity (DO)From NHANES: sex, age and height
adjusted residuals of leg strength and fat mass were classified in tertiles and groups defined for DO, O, D and N
DO had slower gait speed vs O and normal groups but not vs D!Bouchard D J Gerontol A Biol SciMed Sci 2010; 65A:71-77

Sarcopenia - Definition
Evolution of the sarcopenia definition:Now, it takes into account loss of muscle performance (muscle strength) or functionEWGSOP: Cruz-Jentoft AJ et al. Age & Ageing 2010;39:412-23
Strength: Handgrip (Fried L J Gerontol A Bio Sci Med Sci 2001;56:M146-56)
Function: SPPB or gait speed (Guralnik JM J Gerontol 1994;49:M85-94)

Phenotype of Frailty
Frailty: ≥
3 of the following; pre-frailty ≤
2Loss of body mass Unintentional weight loss: > 10 lbs prior year
Sarcopenia
Weakness
Low hand grip strength: < 20th perc for BMI and sex
Slowness
TUG, gait speed (<0.8 m/s)
Fatigue: reported exhaustionLow physical activity
Fried L et al J Gerontol
A Bio Sci
Med Sci
2001;56:M146-56
√
√
√

Frailty Cycle
AgeAnorexia
Chr. DiseasesEnvironment
Chronic Malnutrition
Dysregulations•Hormones
•Inflammation•Coagulation
(Central adiposity)SarcopeniaOsteopenia
Energy Expenditure Frailty
Insulin ResistanceVO2 max
Strength/CapacityGait Speed
Physical Activity Basal Metabolic Rate

The vicious circle of sarcopenia
Nair KS AJCN 2005

The NuAge Study
Disease free & healthy: walk without help (cane accepted) 300 m or climb 10 stairs, cognitively intact (3MS > 79), independent for ADL
Body composition DXA & BIA; Performance: TUG, gait speed, Ms strength (handgrip, knee extension and elbow flexors), sit-to-stand x 5 and balance (one leg stand); blood tests; dietary intake; questionnaires, etc. Annual assessments for 4 y.
1793
1328
1062
36,183Random sample of Quebec Medicare Database from areas of Sherbrooke
and Montreal. ♀
& ♂: 68-72y, 73-77y, 78-82yContact by telephone & clinical examination (Gaudreau
P et al. Rejuvenation Res 2007;10:377-86)
For sarcopenia
data: Exclusion if diabetes based on reported DM or taking ADM or fasting glu
> 7 mmol/L
Available body composition measurements

Sarcopenia and physical function
Total MM was estimated by DXA (Kim et al 2005) and by BIA (Janssen I et al 2002) and MMI (kg/m2) was calculated as well as %body fat (%BF)
Quintiles of MMI and %BF were calculated
Sarcopenia (S): lowest 2 quintiles for MMI
Obesity (O): highest 2 quintiles for %BF
Four groups were defined: SO, S, O, Normal
Groups were compared by GLM with age, sex, smoking, # chr diseases and physiacl activity (PASE), as co-factors

Body composition and performance
SO S O N P-value
N (%) 169 (16) 255 (24) 258 (24) 380 (36)
Age (y) 75.2±4.1 74.8±4.2 73.8±3.9 73.0±4.0 <0.0001 b,c,d,e,f
MMI (kg/m2)
7.6±1.3 7.6±1.4 9.2±1.4 9.2±1.4 <0.0001 b,c,d,f
%BF 40.3±6.7 29.7±7.8 40.4±6.8 29.6±8.0 <0.0001 a,c,d,e
BMI 28.3±2.7 23.4±2.3 31.9±3.7 26.4±2.8 <0.0001 a,b.c.d.e.f
TUG (s) 10.6±2.0 10.4±2.2 10.5±2.0 10.0±2.0 0.045 e
Gait speed (m/s)
1.13±0.21 1.16±0.23 1.10±0.18 1.16±0.19 0.001 d,e
a: SO vs
S; b: SO vs
O; c: SO vs
N; d: S vs
O; e: O vs
N; f: S vs
N

Body composition and performance
SO S O N P-value*
Handgrip R
62.6±17.6 66.6±17.6 66.2±19.3 67.4±19.1 NS
Elbow flexion R
38.1±13.7 38.2±15.3 42.7±17.3 42.7±16.8 <0.0001 b,c,d,f
Knee extension R
51.1±20.2 51.9±20.2 58.5±24.1 58.9±22.1 <0.0001 b,c,d,f
Knee flexion R
35.6±13.1 36.0±14.7 40.2±17.0 40.4±16.1 <0.0001 b,c,d,f
One leg stand
11.6±14.8 20.4±21.1 11.4±15.0 20.8±20.8 <0.0001 a,c,d,e
a: SO vs
S; b: SO vs
O; c: SO vs
N; d: S vs
O; e: O vs
N; f: S vs
N
* Similar significance in the left/non-dominant side
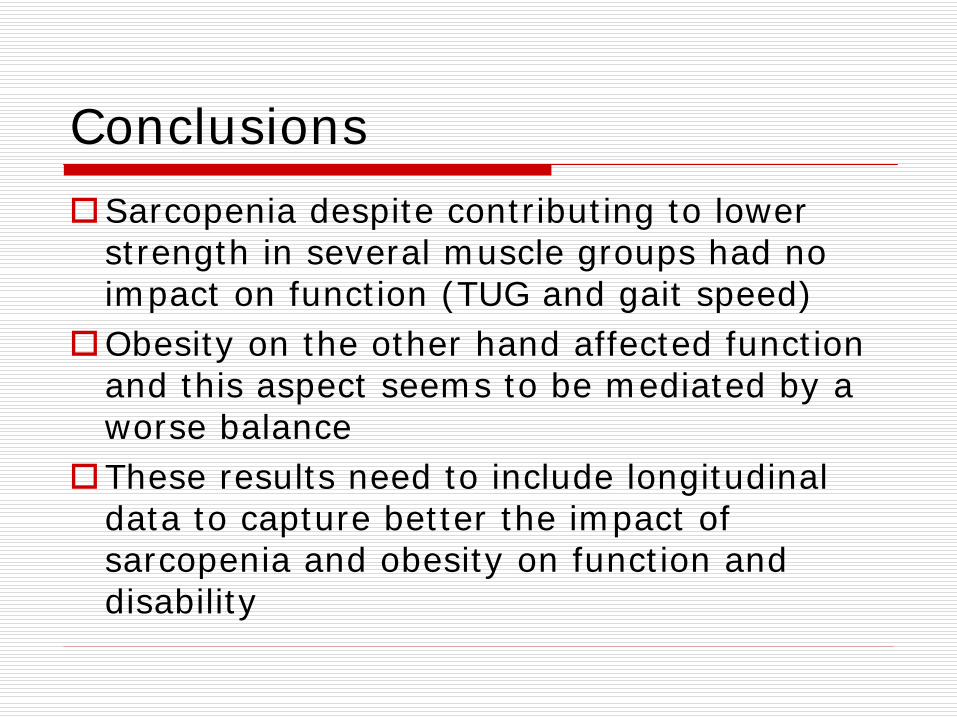
Conclusions
Sarcopenia despite contributing to lower strength in several muscle groups had no impact on function (TUG and gait speed)
Obesity on the other hand affected function and this aspect seems to be mediated by a worse balance
These results need to include longitudinal data to capture better the impact of sarcopenia and obesity on function and disability

Olga Kotelko, 93 y.o
Measures to counteract Muscle loss and strength
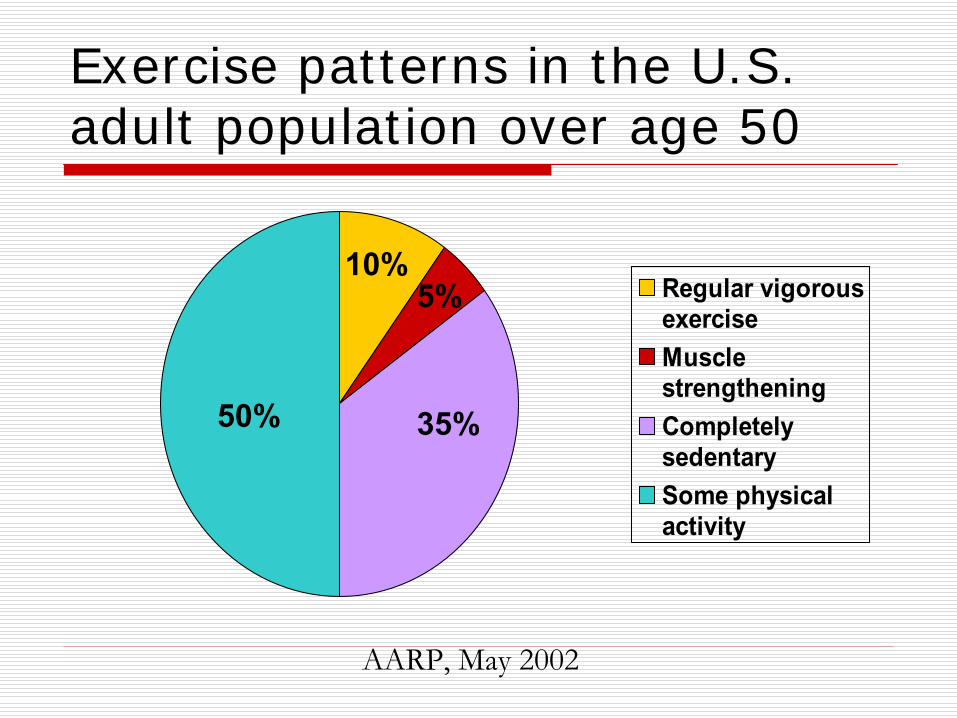
Exercise patterns in the U.S. adult population over age 50
Regular vigorousexerciseMusclestrengtheningCompletelysedentarySome physicalactivity
50% 35%
10%5%
AARP, May 2002

Exercise and Physical Capacity
Exercise is the best anti-aging strategy (ACSM & AHA,
Circulation 2007) Any type of physical activity is better than no
activity for protection against functional limitations, but exercise confers greater benefit for physical capacity (Brach JS JAGS 2004;52:502-9 )
Aerobic exercise has effects on the progression of MCI (Baker LD Arch Neurol. 2010;67:71-9)
♀: improved executive function♂: favorable effect only on Trails B test
Aerobic exercise prevents weight gain (adiposity) and insulin resistance (Solomon TSJ J Appl Physiol
2008;104:1313-19)

Masters Athletes McGill University Health Center Collaboration -
T Taivassalo, R Hepple, J.A. Morais et al

McGill Masters Athletes
Greater number of MUs
in Tibialis
Anterior

Effects of exercise training
Intervention ControlN 66 49Age (y) 83 83% Females 52 53# meds 4 4PPT score (out of 36)28.4 28.3VO2 max (ml/kg/min) 15.6 15.4FS-36 26.6 26.6
9 months of progressive flexibility/balance, resistance and endurance exercise vs. flexibility exercise at home
Binder EF JAGS 2002;50:1921

Binder EF JAGS 2002:50:1921

Proven efficacy of strength trainingMeta-analysis on 47 studies including 1079 participants aged 50-92 yrs (mean age 67.4±6.3 yrs)
Duration: 6-52 wks (mean duration 17.6 wks)
Frequency: 1-3 times/wk
Intensity: 40%-85% of 1 RM (mean = 70% 1RM)
Sets: 1-6 sets per muscle
Repetitions: 2-20 (mean 10±2.6 repetitions)
0%� 5%� 10%� 15%� 20%� 25%� 30%� 35%� 40%�
%�GAIN�Lat�pull�
Chest�press�
Leg�extension�
Leg�press�
Peterson et al. Ageing Research Revs 9, 2012


Presenter
Presentation Notes

Results the Health ABC Cohort Study
Median total protein intake as a percentage of total energy intake (g.kg-1.d-1) by quintile (from quintile 1 to quintile 5) was 11.2% (0.7 g.kg-1.d-1), 12.7% (0.7 g.kg-1.d-1), 14.1% (0.8 g.kg-1.d-1), 15.8% (0.9 g.kg-1.d-1), and 18.2% (1.1 g.kg-1.d-1) N= 2066; Duration: 3 years
Houston DK AJCN 2008

Lesser muscle response with a small bolus of EAA
Mean (SEM) leg phenylalanine net balance 3.5 h after the ingestion of 7g EAA
calculated by measuring the area under the phenylalanine net balance response curve in the elderly (n11) and the young (n8). Data were analyzed with a t test. *Significantly different from the young, P 0.010.
0
5
10
15
20
25
Young Elderly
Phe Net Balance(mg/kg)
*
Katsanos
CS AJCN 2005

Muscle Response to Feeding with Aging
0.00
0.02
0.04
0.06
0.08
0.10
0.12
Young (n=7) Elderly (n=6)
(FSR
, %/h
)□
Postabsorptive
IV Feeding (23 g protein)
Young Elderly
*Feeding effect, P<0.01 Chevalier S, Morais et al J Gerontol A Biol Sci Med Sci, 2011
ANOVA *

Adequate quantity of EAA improves muscle protein synthesis
Mixed muscle fractional synthetic rate (FSR) in young and elderly before and after ingestion of 15 g of EAA. †Significant difference from corresponding postabsorptive
values: young, P 0.012; elderly, P 0.029.
†
Paddon-Jones D Am J Physiol
Metab
2004

Cermak
et al., Am J Clin
Nutr, 2012.
Exercise training and protein supplementation (FFM)
Weighted mean difference: 0.69 kg; 95% CI: 0.47, 0.91 kg; P < 0.00001

Exercise training and protein supplementation (1-RM leg press)
Cermak
et al., Am J Clin
Nutr, 2012.
Weighted mean difference: 13.5 kg; 95% CI: 6.4, 20.7 kg; P < 0.005

Protein supplementation in frail elderly
Tieland
et al., JAMDA, 2012-A
Treatment x Time interaction effect p<0.02
RCT of 15 g of protein supplementation BID, n=65

Protein supplementation in frail elderly
Tieland
et al., JAMDA, 2012-B
RCT of Resistance EX 2 sessions / week ±
15 g of protein BID

Best fitting model using NuAge data with all paths significant
RMSEA: goodChi‐square: good
CFI: goodNFI: goodNNFI: good
Matta J & Morais JA, unpublished

What can we learn from the revised model
Mobility and strength were significantly associated
For each unit increase in strength, there is a 0.37 unit increase in mobility
Mobility significantly impacted on physical activity Fat mass & muscle mass negatively impacted on
mobilityMuscle mass but not fat mass was associated with
strength
For each unit increase in muscle mass, there was a 6 unit increase in strength
Muscle mass was positively associated with physical activity whereas fat mass was negatively associated

What can we learn from the revised model
Greater muscle mass may not be the best target to enhance mobility, and since fat mass is also negatively associated with mobility, weight loss would be desirable in this population
However, weight loss should be directed exclusively towards fat mass and not muscle mass since our results suggest that muscle mass has a significant positive association with strength. What is needed is to improve muscle quality (strength/mass)

What can we learn from the revised model
Containing fat mass while increasing strength (or muscle mass) could be achieved through physical activity
Physical activity is the right approach to improve physical capacity. Indeed, physical activity was positively associated with mobility

Conclusions
One cannot totally eliminate the effect of the “passage of time” on body composition and physical performance
Decreases in functional capacity with aging can be minimized by regular physical exercise and adequate nutrition
Even in the most frail person, some gains in function can be obtained
Ex > protein supplementation
Better in combination

Thank you


![Quality of Life in Sarcopenia and Frailty · ‘‘sarcopenia’’ is already a fairly well-known term, the introduction of another may lead to confusion [3]. The EWGSOP consensus](https://static.fdocuments.in/doc/165x107/5f6f31e982898415ee0d4301/quality-of-life-in-sarcopenia-and-frailty-aasarcopeniaaa-is-already-a-fairly.jpg)


![Nutritional Status, Muscle Health, and Sarcopenia ... · Sarcopenia, the progressive loss of muscle mass and function that occurs with age [4], is a core component of frailty [5].](https://static.fdocuments.in/doc/165x107/5f6f31ea82898415ee0d4308/nutritional-status-muscle-health-and-sarcopenia-sarcopenia-the-progressive.jpg)