Haiti Earthquake PDNA: Assessment of damage, losses, general ...
UNIVERSIDADE DA BEIRA INTERIOR
Ciências
Understanding the interaction between pDNA and
different chromatographic supports
Gregory Silva Dutra
Dissertação para obtenção do Grau de Mestre em
Bioquímica
(2º ciclo de estudos)
Orientador: Prof. Doutor Ana Cristina Mendes Dias Cabral
Co-orientador: Prof. Doutor Fani Sousa
Covilhã, outubro de 2016

ii

iii
Só por hoje…

iv

v
Acknowledgments
First of all, I would like to thank Professor Cristina Dias-Cabral for her guidance, supervision,
support and encouragement. Her enthusiastic and contagious passion in this investigation
project was essential in this work accomplishment.
A special thanks to my co-supervisor Professor Fani Sousa. Her prompt availability and help
were also a key for the project to come forward.
I would also like to acknowledge the research center CICS-UBI and lab colleagues, especially
from my work group. Patrícia, Filipa, Cláudia, Sara, John, Gonçalo, Francisco and João thanks
for the best working environment. This is also yours.
A very special tanks to John for his friendship and lessons. You already change someone in the
world.
To my friends, especially from Desertuna, thank you for being part of my life.
To my little brother that have the capability to cheer me up even in my worst days.
Now and always to mom and dad.

vi

vii
Resumo Alargado
A terapia génica e as vacinas de DNA são terapias recentes que aproveitam o potencial do DNA
plasmídeo (pDNA) como uma molécula terapêutica para o tratamento e cura de muitas doenças.
Na última década, as empresas farmacêuticas deram muita atenção a ambas as técnicas devido
à sua simplicidade, versatilidade e segurança.
O uso do pDNA como uma molécula com um propósito farmacêutico requer a sua produção em
grande escala, com um alto grau de pureza e homogeneidade. Estes parâmetros são
fundamentais para garantir uma boa resposta e a segurança do paciente.
São utilizados vários processos na purificação de plasmídeos, tanto na eliminação de impurezas
como restos celulares, proteínas, DNA genómico, etc., como para separar as diferentes
isoformas em que um plasmídeo se pode encontrar (linear, circular aberto ou superenrolado).
As propriedades únicas do pDNA fazem com que a sua purificação seja a parte mais complicada
de todo o processo de fabrico.
A cromatografia de troca aniónica e de interação hidrofóbica são as técnicas utilizadas com
mais sucesso na purificação de plasmídeos. Contudo, o mecanismo de separação de plasmídeos
por estas técnicas não é totalmente compreendido. É difícil prever o comportamento das
moléculas durante a separação, e ainda, os métodos usados na escala laboratorial são
economicamente e ambientalmente incompatíveis com a escala industrial. Assim sendo, uma
melhor compreensão dos mecanismos subjacentes à cromatografia terá um elevado interesse
prático.
A análise dos eventos termodinâmicos dos processos de adsorção através da Microcalorimetria
de Fluxo (FMC) tem vindo a provar a sua boa utilidade na obtenção de uma melhor compreensão
das forças motrizes, dos mecanismos e das cinéticas envolvidas no processo de adsorção de
biomoléculas em diferentes sistemas cromatográficos. Por isso, neste trabalho, através da
utilização da microcalorimetria de fluxo, pretende-se compreender e comparar o mecanismo
de adsorção de um plasmídeo na sua forma linear (ln pDNA) a um suporte cromatográfico de
troca aniónica (Q-sepharose Fast Flow) e a um suporte cromatográfico de interação hidrofóbica
(Phenyl-sepharose 6 Fast Flow), e ainda a adsorção de um plasmídeo na sua forma linear e
superenrolada (sc pDNA) a um suporte cromatográfico de troca aniónica (Q-sepharose Fast
Flow). Os resultados serão analisados dando enfase às diferenças entre cada sistema. Para além
da microcalorimetria de fluxo, foram também realizados estudos da capacidade de ligação em
modo estático (static binding capacity) para obter uma melhor compreensão do mecanismo de
adsorção.
Os resultados obtidos nos estudos de capacidade de ligação revelaram que o processo de
adsorção do plasmídeo na forma linear segue uma isotérmica de Langmuir até uma certa

viii
concentração de plasmídeo em equilíbrio. Em todos os casos testados, a capacidade de ligação
do suporte aumenta com o aumento da concentração de plasmídeo em equilíbrio até se atingir
um patamar em que a saturação do suporte cromatográfico é alcançada. O suporte de troca
iónica revelou ter uma capacidade de ligação maior para o ln pDNA do que o suporte de
interação hidrofóbica, como esperado. Não foi possível fazer os mesmos testes com o sc pDNA
dado a sua instabilidade nas condições em que os testes são realizados. Não obstante,
conseguiu-se de forma teórica chegar a uma previsão da capacidade máxima de ligação do sc
pDNA ao suporte de troca aniónica que revelou ser inferior à capacidade teórica atingida na
adsorção de ln pDNA.
Os estudos realizados utilizando a microcalorimetria de fluxo foram efetuados na zona linear
das isotérmicas. Dois modos diferentes de injeção foram utilizados através da introdução de
um pulso de amostra na célula do microcalorímetro ou através da alimentação contínua de
amostra à célula. Estes modos de injeção foram conseguidos usando loops de diferentes
volumes.
Considerando os resultados do FMC obtidos com a adsorção do ln pDNA à Phenyl Sepharose,
todos os termogramas são compostos por um pico endotérmico seguido de um ou dois picos
exotérmicos, dependendo do modo de injeção, e um último pico endotérmico. Os termogramas
foram deconvoluidos e as áreas e o timing dos picos considerados na comparação com o
processo de adsorção do ln pDNA a Q-Sepharose. O primeiro pico endotérmico relaciona-se com
o processo de desolvatação. O primeiro pico exotérmico está associado à interação entre o ln
pDNA e o suporte. Visto que este apresenta valores energéticos similares aos da interação do
ln pDNA com a Q-Sepharose, verificou-se que a Phenyl Sepharose também interage
electrostaticamente com o DNA plasmídeo através de interações anião- Utilizando a
alimentação contínua da coluna (loop de 430 µL), encontraram-se diferenças não só na
magnitude e no timing de cada sinal, como também no perfil do termograma. A presença de
diferentes picos num termograma indica a existência de diferentes eventos durante o processo
de adsorção. O segundo pico exotérmico, encontrado apenas utilizando o modo de alimentação
contínua, está relacionado com adsorção secundária. Este processo também acontece na
adsorção do ln pDNA à Q-Sepharose. Considerou-se que o último pico endotérmico estivesse
relacionado com a reorganização das moléculas de água e iões na interface do ln pDNA com a
solução. Acredita-se que este processo seja causado pela alta concentração de sulfato de
amónio na solução.
As experiencias realizadas no FMC com sc pDNA e Q-Sepharose resultaram em termogramas
compostos por um pico endotérmico seguido de um exotérmico. O pico endotérmico obtido com
o loop de 430 µL foi deconvoluidos, posteriormente, em dois sinais endotérmicos. Tal como no
caso anterior, as intensidades, áreas e o timing dos sinais foram considerados na comparação
com a adsorção do ln pDNA à Q-Sepharose. Acredita-se que o primeiro sinal endotérmico esteja
relacionado com processo de desolvatação, tal como na adsorção do ln pDNA. Contudo,

ix
verificou-se que o processo é mais energético no caso do sc pDNA dado que este tem uma maior
densidade de carga que é conferida pela isoforma superenrola, conduzindo a um maior gasto
energético na desolvatação. Ao utilizar o loop de 430 µL conseguiu-se promover uma sobrecarga
no volume de amostra que passa na coluna. Este método resultou no aparecimento de um
segundo sinal endotérmico. Este sinal relaciona-se com as repulsões entre as moléculas de sc
pDNA livres na solução. Por último, a área e o timing do pico exotérmico leva-nos a acreditar
que este está relacionado com a reorientação da molécula e com adsorção secundária.
As entalpias de adsorção revelaram que o processo global de adsorção é exotérmico (perto de
zero) na adsorção do ln pDNA à Phenyl Sepharose. Alguns estudos mostram que os processos
cromatográficos que envolvem interações hidrofóbicas são fortemente influenciados pela
variação da entropia, e são muitas vezes considerados maioritariamente endotérmicos. Neste
caso particular, não temos um processo só com interações hidrofóbicas o que explica a
divergência dos resultados. Na adsorção do sc pDNA à Q-Sepharose, o processo global é
conduzido entropicamente visto que este é endotérmico para todos os casos estudados, este
resultado é similar aos obtidos anteriormente com o estudo da adsorção pela análise de van´t
Hoff [24].
Palavras-chave
Microcalorimetria de Fluxo; Adsorção; DNA plasmídeo linear e superenrolado; Cromatografia de
troca aniónica; cromatografia de interação hidrofóbica.

x

xi
Abstract
Gene Therapy and DNA vaccines are recent therapies that take advantage of the potential of
plasmid DNA as a therapeutic molecule for the treatment and cure of several diseases. In the
last decade both techniques have received a great deal of attention by pharmaceutical
companies due to their simplicity, versatility and safe profile. Hence, the usage of pDNA as
biopharmaceutical molecule requires its production at the gram scale, with a high purity and
homogeneity level as a vital parameter to ensure a good response and the patient safety.
Anion-exchange chromatography and hydrophobic interaction chromatography have been
successfully used in pDNA purification. Nevertheless, the mechanism of pDNA separation for
both purification techniques is still not completely understood. A better understanding of the
driving forces and mechanisms underlying both purification processes are of great interest to
help optimize chromatographic systems.
Flow Microcalorimetry (FMC) has proven its ability to provide an improved understanding of the
driving forces, mechanisms and kinetics involved in the interaction process during biomolecules
adsorption onto several chromatographic systems]. Thus, using Flow Microcalorimetry as a
central technique, this study aims to understand and compare the interaction between
different pDNA isoforms (pVAX1-LacZ) and the anion-exchange support (Q-sepharose Fast Flow)
or the hydrophobic support (Phenyl Sepharose 6 Fast Flow), considering only the isotherm linear
conditions, showing the role of nonspecific effects on the adsorptive process.
The results obtained in the binding capacity studies revealed that the ln pDNA adsorption
process follows a Langmuir isotherm up to a specific ln pDNA equilibrium concentration. In all
cases, the binding capacity increases with the plasmid concentration in equilibrium until it
reaches a level at which saturation of the chromatographic medium is achieved. The anion-
exchange support was found to have a higher binding capacity for ln pDNA adsorption than the
hydrophobic interaction support, as expected. FMC results reveled that for both processes the
endothermic heat major contributor was suggested to be the desolvation and changes in the
solvation shell processes while exothermic heats were related to the interaction (electrostatic
attraction) between pDNA and support and also to the secondary adsorption of already adsorbed
pDNA molecules. The enthalpies of adsorption showed that the overall adsorption process is
mainly enthalpically driven for the adsorption of ln pDNA onto Phenyl Sepharose and
entropically driven for the sc pDNA-Q-sepharose system.
Keywords
Flow Microcalorimetry; Adsorption; Supercoiled and linear plasmid DNA; Anion-exchange
chromatography; Hydrophobic Interaction chromatography.

xii

xiii
Table of Contents
1. Introduction ............................................................................................... 1
1.1. Plasmid DNA (pDNA) ............................................................................... 1
Gene Therapy and DNA Vaccines: pDNA as biopharmaceutical molecule ......... 1
1.1.2. Structure and Proprieties .................................................................. 3
1.1.3 Plasmid conformational forms ............................................................ 5
1.2. Biotechnological plasmid DNA production..................................................... 7
1.2.2. Upstream Processing ........................................................................ 8
1.2.3. Downstream Processing .................................................................... 9
1.3. Liquid Chromatography technique for pDNA purification ................................ 13
1.3.1. Physical proprieties of different stationary phases. ................................ 15
1.3.2. Anion-Exchange Chromatography principles for pDNA purification .............. 17
1.3.3. Hydrophobic Interaction Chromatography principles for pDNA purification .... 19
1.4. Adsorption process and equilibrium .......................................................... 21
1.4.1. Langmuir Model and static binding capacity .......................................... 22
1.5. Thermodynamic study of biomolecules adsorption ........................................ 25
1.5.1. Flow Microcalorimetry .................................................................... 25
1.6. Goal of Study ..................................................................................... 29
2. Materials and methods ................................................................................ 31
2.1. Materials .......................................................................................... 31
2.2. Apparatus and Software ........................................................................ 31
2.3. Plasmid DNA Production ........................................................................ 31
2.3.1. Fermentation ............................................................................... 31
2.3.2. Recovery .................................................................................... 32
2.3.3. Plasmid DNA quantification .............................................................. 33
2.3.4. Plasmid Isoform Separation .............................................................. 33
2.3.5. Agarose Gel Electrophoresis ............................................................. 33
2.4. Plasmid DNA Purification ....................................................................... 33

xiv
2.4.1. sc pDNA purification with Toyopearl GigaCap Q 650-M ................................ 33
2.4.2. sc pDNA purification with CIM DEAE ................................................... 34
2.4.3. Sample Concentration and buffer change............................................. 34
2.4.4. Sample Characterization ................................................................. 34
2.5. Flow Microcalorimetry (FMC) .................................................................. 35
3. Results and Discussion ................................................................................ 37
3.1. Plasmid production .............................................................................. 37
3.2. sc pDNA Purification ............................................................................ 38
3.2.2. Toyoperl GigaCap Q 650-M ............................................................... 38
3.2.3. CIM DEAE .................................................................................... 40
3.3. Static Binding Capacity ......................................................................... 41
3.4. Flow Microcalorimetry .......................................................................... 43
3.4.1. ln pDNA adsorption onto Phenyl-Sepharose........................................... 44
3.4.2. sc pDNA adsorption onto Q-Sepharose ................................................. 53
4. Conclusion and Future work ......................................................................... 61
5. References .............................................................................................. 63
6. Appendix ................................................................................................ 69
xv
Figures
Figure 1.1.1 - Indications addressed by plasmid-based gene therapy clinical trials. Adapted
image from The Journal of Gene Medicine [59] .......................................................... 1
Figure 1.1.2 - Vectors used in gene therapy clinical trials. Adapted image from The Journal of
Gene Medicine [59] ............................................................................................ 2
Figure 1.1.3 – DNA nucleotide chemical structure ....................................................... 3
Figure 1.1.4 – DNA different nucleotide bases............................................................ 4
Figure 1.1.5 - DNA chain ...................................................................................... 4
Figure 1.1.6 - Linear, open circular and supercoiled plasmid DNA, respectively. ................. 5
Figure 1.1.7 - Schematic model a negatively supercoiled plasmid [19,30]. The DNA double helix
is represented by the thick line. The superhelix axis is the dashed curve crossing the nodes and
bisecting the area enclosed by the two DNA double strands between adjacent nodes. The
superhelix radius is the distance between the superhelix axis and the DNA double strands. .... 6
Figure 1.2.1 - Schematic process steps for the development of plasmid DNA. ..................... 7
Figure 1.3.1 - LC molecule-stationary phase base interaction illustration. Respectively SEC, HIC,
IEX and AC [31]. .............................................................................................. 14
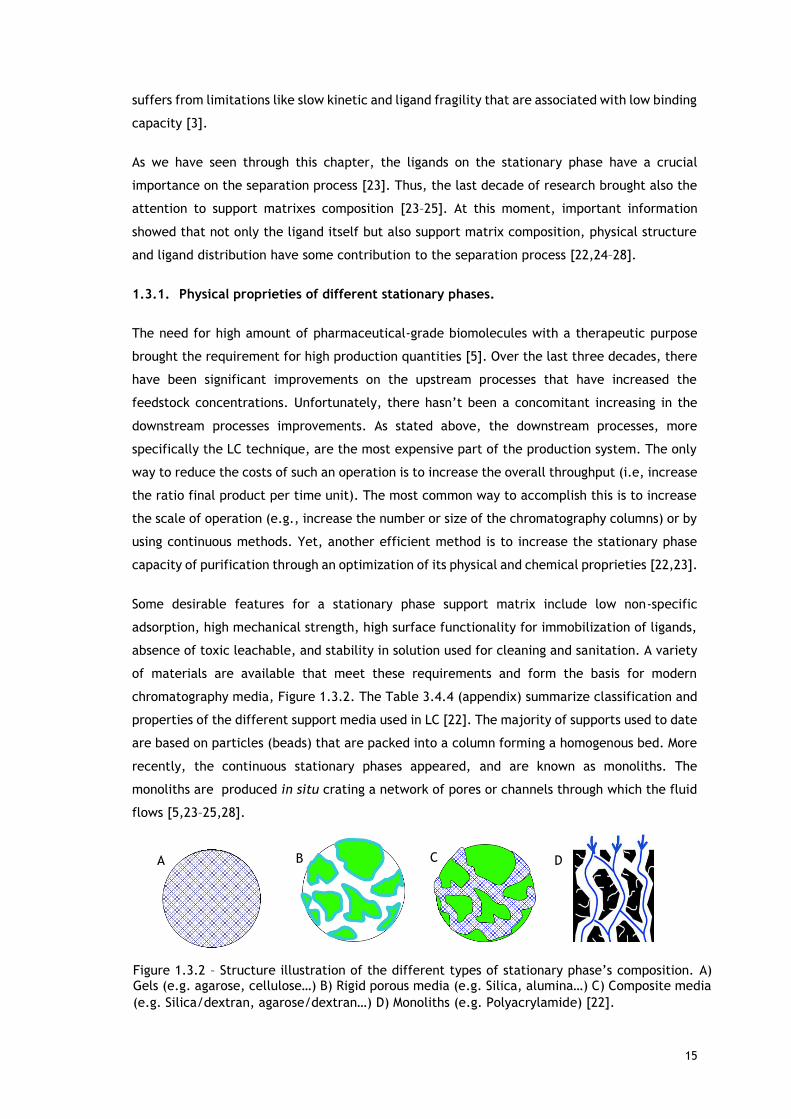
Figure 1.3.2 – Structure illustration of the different types of stationary phase’s composition. A)
Gels (e.g. agarose, cellulose…) B) Rigid porous media (e.g. Silica, alumina…) C) Composite
media (e.g. Silica/dextran, agarose/dextran…) D) Monoliths (e.g. Polyacrylamide) [22]. ..... 15
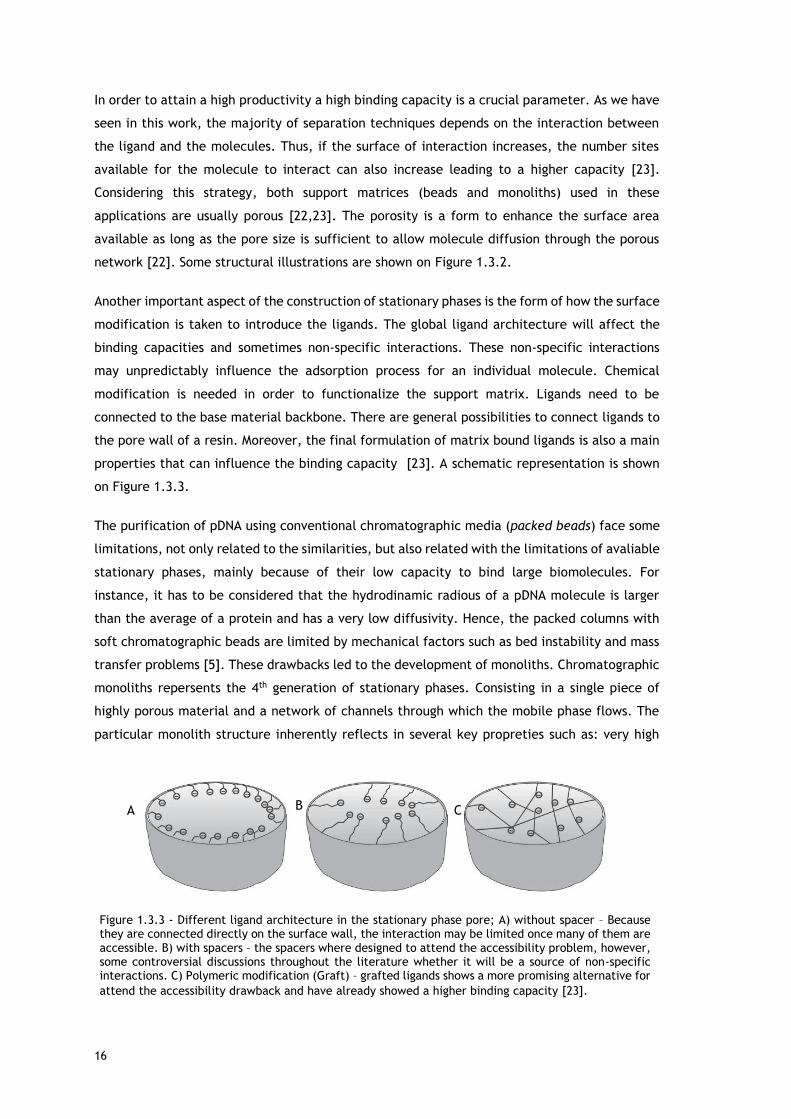
Figure 1.3.3 - Different ligand architecture in the stationary phase pore; A) without spacer –
Because they are connected directly on the surface wall, the interaction may be limited once
many of them are accessible. B) with spacers – the spacers where designed to attend the
accessibility problem, however, some controversial discussions throughout the literature
whether it will be a source of non-specific interactions. C) Polymeric modification (Graft) –
grafted ligands shows a more promising alternative for attend the accessibility drawback and
have already showed a higher binding capacity [23]. ................................................. 16
Figure 1.3.4 - Anion-exchange separation principles. Adapted from GE Healthcare handbook.
.................................................................................................................. 17
Figure 1.3.5 - Typical AEC chromatogram. (D) - Denaturated pDNA (OC) – open circular isoform
(SC) supercoiled isoform. [60] ............................................................................. 19

xvi
Figure 1.3.6 - A) Highly ordered water shells surround the hydrophobic surfaces of ligands and
proteins. Hydrophobic substances are forced to merge to minimize the total area of such shells.
Salts enhance the hydrophobic effect. B) The equilibrium of the hydrophobic interaction is
controlled predominantly by the salt concentration [31]. ........................................... 19
Figure 1.3.7 - Solubilizing properties of water molecules and its ability to interact with dipoles
and form hydrogen bonds [31] . .......................................................................... 20
Figure 1.4.1 - Langmuir adsorption isotherm with the limiting behavior for low and high C
values. M is the initial slope and 1/K is the liquid phase concentration in equilibrium with one-
half of qm [22]. ............................................................................................... 24
Figure 1.5.1 - Flow microcalorimeter representative scheme. ...................................... 26
Figure 1.5.2 - Typical FMC thermogram for linear pDNA adsorption on Q-Sepharose. .......... 27
Figure 3.1.1 - Electrophoresis results of pDNA in different conformations. A – pDNA after
recovery and clarification with Qiagen Kit. B – pDNA after 1 day at room temperature after A.
C - pDNA after 2 day at room temperature after A.D – (a) pDNA after 3 day at room temperature
after A and (b) pDNA after Hind II digestion. 1 – Open circular (oc) pDNA. 2 – linear (ln) pDNA.
3 – supercoiled (sc) pDNA. 4 – molecular weight marker (adapted from [1]). .................... 37
Figure 3.1.2 – Typical chromatogram obtained by injection of the plasmid sample recovered
from the the Qiagen Kit, onto the CIMac™ DEAE column. ............................................ 38
Figure 3.2.1 - Chromatographic profile of the plasmid isoform separation from a clarified pDNA
sample (sc + oc) in the Toyoperl GigaCap Q 650-M column. The Elution method was based in
the separation method suggested by Prazeres et al.[18] ............................................. 39
Figure 3.2.2 -Tipycal chromatographic profiles of the plasmid isoform separation from a
clarified pDNA sample (sc + oc) in the Toyoperl GigaCap Q 650-M column. Different colors mean
different injection concentrations. ...................................................................... 40
Figure 3.2.3 - Chromatographic profile of the plasmid isoform separation from a clarified pDNA
sample (sc + oc) in the with the CIM® DEAE-0.34 Disk. ............................................... 41
Figure 3.4.1 - Thermograms of ln pDNA adsorption onto Phenyl-sepharose using the 230 μL loop.
Black 124.97 µg pDNA/g Phenyl Sepharose; Red 171.75 µg pDNA/g Phenyl Sepharose; Blue
413.18 µg pDNA/g Phenyl Sepharose. Vertical dashed line represents the time where the pDNA
solution plug is replaced with pDNA-free mobile phase around 1650 seconds. .................. 44
Figure 3.4.2 - Thermograms of ln pDNA adsorption onto Phenyl sepharose using the 430 μL loop.
Black 117.67 µg pDNA/g Phenyl Sepharose; Green 363.42 µg pDNA/g Phenyl Sepharose; Orange
xvii
614.70 µg pDNA/g Phenyl-Sepharose. Vertical dashed line represents the time where the pDNA
solution plug is replaced with pDNA-free mobile phase around 2100 seconds. ................... 44
Figure 3.4.3 - PEAKFIT de-convolution of 230 µL loop thermograms for loading concentrations
of A – 124.97 µg pDNA/g Phenyl Sepharose; B 171.85 µg pDNA/g Penyl Sepharose; C – 413.18 µg
pDNA/g Phenyl Sepharose. Curves shown are for experimental data. Total peak fit (black line
(–)) and peaks resulting from deconvolution (blue and red lines (...))Vertical dashed line
represents the time where the pDNA solution plug is replaced with pDNA-free mobile phase
around 1650 seconds. ....................................................................................... 46
Figure 3.4.4 - PEAKFIT de-convolution of 430 µL loop thermograms for loading concentrations
of A – 117.45 µg pDNA/g Phenyl Sepharose; B - 362.91 µg pDNA/g Penyl Sepharose; C – 613.82
µg pDNA/g Phenyl Sepharose. Curves shown are for experimental data. Total peak fit (black
line (–)) and peaks resulting from deconvolution (blue and red lines (...)). Vertical dashed line
represents the time where the pDNA solution plug is replaced with pDNA-free mobile phase
(Grey – 230 µL loop and Black – 430 µL loop). .......................................................... 47
Figure 3.4.5 - Endothermic heats of ln pDNA adsorption onto (●) Phenyl Sepharose (♦) Q-
Sepharose [1]. ................................................................................................ 49
Figure 3.4.6 - Exothermic heats of ln pDNA adsorption onto (●) Phenyl Sepharose (♦) Q-
Sepharose [1]. ................................................................................................ 50
Figure 3.4.7 – Comparison between the ln-pDNA-Q-Sepharose first endothermic peak energy (♦)
and ln-pDNA-Phenyl Sepharose second endothermic peak (●). ..................................... 51
Figure 3.4.8 - Net heats (sum of all energetic contributions) of ln pDNA adsorption onto (●)
Phenyl Sepharose (♦) Q-Sepharose [1]. .................................................................. 52
Figure 3.4.9 - Thermograms of sc pDNA adsorption onto Q-sepharose using the 30 μL loop. Black
13.24 µg pDNA/g Q-Sepharose; Red 52.97 µg pDNA/g Q-Sepharose; Blue (--) 102.85 µg pDNA/g
Q-Sepharose. Vertical dashed line represents the time where the pDNA solution plug is
replaced with pDNA-free mobile phase around 1150 seconds. ...................................... 53
Figure 3.4.10 - Thermograms of sc pDNA adsorption onto Q-sepharose using the 430 μL loop.
Black 117.26 µg pDNA/g Q-Sepharose; Blue 1172.60 µg pDNA/g Q-Sepharose. Vertical dashed
line represents the time where the pDNA solution plug is replaced with pDNA-free mobile phase
around 2100 seconds. ...................................................................................... 53
Figure 3.4.11 - PEAKFIT de-convolution of thermograms for loading concentrations of A – 13.24
µg pDNA/g Q-Sepharose; B -13.24 µg pDNA/g Q-Sepharose; C - 102.85 µg pDNA/g Q-Sepharose.
Curves shown are for experimental data. Total peak fit (black line (–)) and peaks resulting from

xviii
deconvolution (blue and red lines (...))Vertical dashed line represents the time where the pDNA
solution plug is replaced with pDNA-free mobile phase around 1150 seconds. .................. 55
Figure 3.4.12 - Endothermic heats of sc pDNA adsorption (●) and ln pDNA adsorption (♦) onto
Q-Sepharose[1]. .............................................................................................. 57
Figure 3.4.13 – PEAKFIT de-convolution of thermograms for loading concentrations of A – 117.86
µg pDNA/g Q-Sepharose and B - 1172.60 µg pDNA/g Q-epharose. Curves shown are for
experimental data. Total peak fit (black line (–)) and peaks resulting from deconvolution (blue
and red lines (...))Vertical dashed line represents the time where the pDNA solution plug is
replaced with pDNA-free mobile phase around 2100 seconds. ...................................... 57
Figure 3.4.14 - Endothermic heats of sc pDNA adsorption onto (●) and ln pDNA adsorption
(♦)onto Q-Sepharose [1]. ................................................................................... 59
Figure 3.4.15 – Net heats (sum of all energitc contributions) of sc pDNA adsorption onto (●) and
ln pDNA adsorption (♦)onto Q-Sepharose [1]. .......................................................... 60
Figure 3.4.16 - Thermograms of ln pDNA adsorption onto Q-Sepharose, at pH 8. Injection loop:
30 µL. (a) Black (–) 12.6 µg ln pDNA/g Q-Sepharose; red (– –) 53.4 µg ln pDNA/g Q-Sepharose;
blue (-..-) 111.2 µg ln pDNA/g Q-Sepharose; (b)–(d) PEAKFIT deconvolution of thermograms for
loading concentrations of (b) 12.6 µg ln pDNA/g Q-Sepharose, (c) 53.4 µg ln pDNA/g Q-Sepharose
and (d) 111.2 µg ln pDNA/g Q-Sepharose. Curves shown are for experimental data (red line (–
)); total peak fit (black line (–)) and peaks resulting from deconvolution (blue line (...)). Vertical
dashed line represents the time where the pDNA-containing plug of solution is replaced with
pDNA-free mobile phase. ................................................................................... 70
Figure 3.4.17 - Thermograms of ln pDNA adsorption onto FF Q-Sepharose. Injection loop: 429
µL. PEAKFIT de-convolution of thermogram for loading concentrations of 1359.6 µg ln pDNA/g
Q-Sepharose. Vertical dashed line represents the time where the pDNA-containing plug of
solution is replaced with pDNA-free mobile phase. ................................................... 71

xix
Tables
Table 1.2.1 – Agencies guidelines for application of pharmaceutical grade of sc pDNA. ....... 11
Table 1.3.1 - Branches of modern Liquid Chromatography summary. ............................. 13
Table 2.3.1 - Recovery of pDNA using QIAGEN® Plasmid Maxi Kit. ................................. 32
Table 3.4.1 - Heat of adsorption for ln pDNA adsorption onto Phenyl-sepharose using the 230
and 430 μL loop. ............................................................................................. 45
Table 3.4.2 – Sum of heat of adsorption for ln pDNA adsorption onto Phenyl-sepharose using the
230 and 430 μL loop. ........................................................................................ 45
Table 3.4.3 - Heat of adsorption for sc pDNA adsorption onto Q-sepharose using the 30 and 430
μL loop. ........................................................................................................ 54
Table 3.4.4 - Classification and properties of the different support media used in Liquid
Chromatography. ............................................................................................ 69
Table 3.4.5 - Heat of adsorption for ln pDNA adsorption on Q-Sepharose at pH 8; flow rate: 1.5
mL/h; adsorbent sample size: 21.89 mg; and temperature: 25◦C. Enthalpies were determined
from the deconvoluted thermograms. ................................................................... 70

xx

1
1. Introduction
1.1. Plasmid DNA (pDNA)
Gene Therapy and DNA Vaccines: pDNA as biopharmaceutical molecule
Plasmid DNA (pDNA) is the base for promising DNA vaccines and gene therapies against many
infectious resulting from acquired or genetic diseases [3–11]. For approximately two decades,
these techniques elicited a great deal of attention and like any other novel therapeutic
approach, it has also given rise to excessive short-term expectations [4,12]. The data on Figure
1.1.1 shows the main indications and target diseases where plasmid-based therapies have been
applied.
Gene therapy can be defined as a treatment strategy which uses heterologous genetic
information, usually in the form of deoxyribonucleic acid (DNA), to compensate or correct a
genetic malfunction in order to obtain a therapeutic effect in animal models and human
individuals [12]. DNA vaccines are made of small circular genetically engineered pieces of DNA,
pDNA, used to generate in situ production of antigen that promotes immunological responses
against infectious agents [3,10,13]. Naked pDNA vaccines first received attention in the 1990s,
since then, a great deal of progress has been made [10].
Indications Adressed by Plasmid-based Gene Therapy Clinical Trials
Cancer diseases 58% (n=223)
Cardiovascular diseases 23% (n=89)
Infection diseases 4% (n=15)
Healthy volunteers 4% (n=15)
Neurological diseases 3% (n=13)
Monogenic diseases 2% (n=6)
Ocular diseases 1% (n=5)
Other diseases 5% (n=21)
Figure 1.1.1 - Indications addressed by plasmid-based gene therapy clinical trials. Adapted image from The Journal of Gene Medicine [59]
2
These therapeutic applications involve essentially three steps: (1) Administration of a gene or
a vector containing a gene into the body; (2) Gene delivery from the site of administration to
the nucleus of the target cells and (3) gene expression, leading to the production of a
therapeutic molecule/antigen[12].
As much significant as the gene that is introduced, the vehicle that will transport it to the
target cells also plays a very important role. These vehicles are called vectors, and the main
types are viral and non-viral vectors. All viruses attack their hosts and introduce the genetic
material into the host cell as a part of their replication cycle [14,15]. Gene therapy based on
viral vectors exploit part of this natural process in order to introduce exogenous DNA to the
target cells. [15,16]. Following this, a burst of clinical studies came up showing the wide range
application for this type of therapy. However, this enthusiastic period didn’t last long due to
therapy risks, its limitations and the occurrence of deaths during clinical trials [14,15]. Besides
some unexceptional results of most clinical studies, other several viral and hosts factors
hampered the progress [15]. Nevertheless, the search for a safe gene delivery didn’t stop and
non-viral vectors began to attract attention as result of their universal application range and,
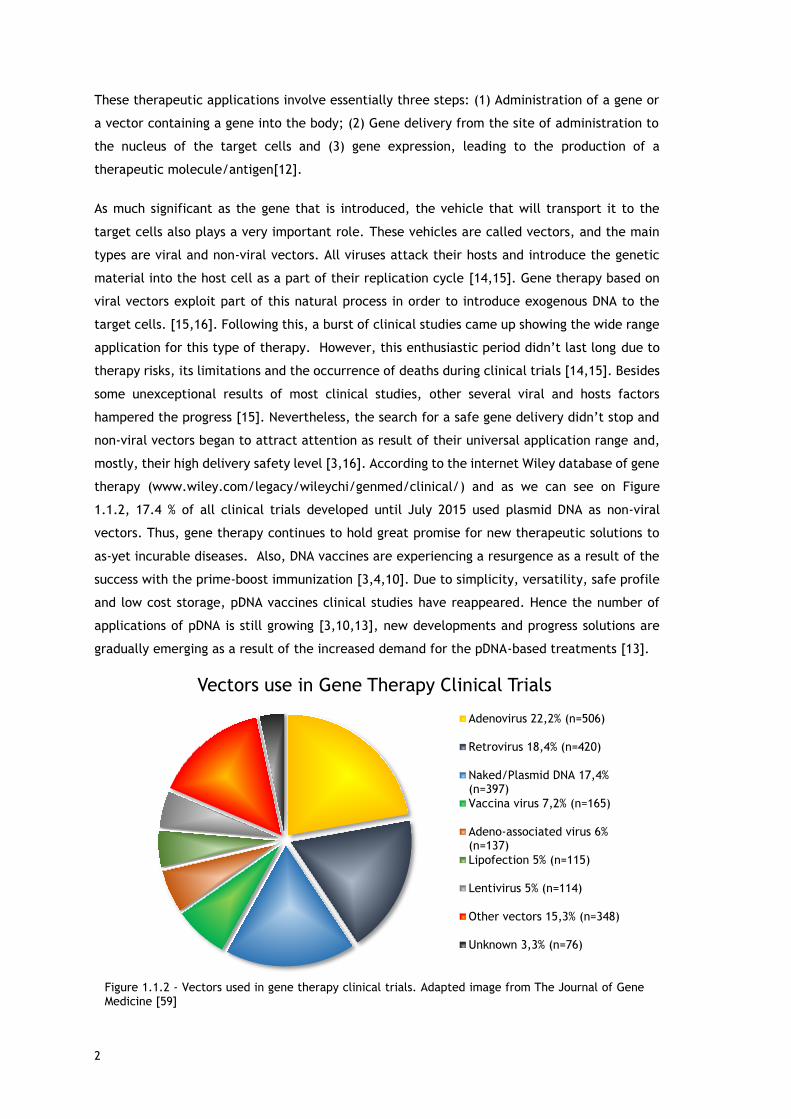
mostly, their high delivery safety level [3,16]. According to the internet Wiley database of gene
therapy (www.wiley.com/legacy/wileychi/genmed/clinical/) and as we can see on Figure
1.1.2, 17.4 % of all clinical trials developed until July 2015 used plasmid DNA as non-viral
vectors. Thus, gene therapy continues to hold great promise for new therapeutic solutions to
as-yet incurable diseases. Also, DNA vaccines are experiencing a resurgence as a result of the
success with the prime-boost immunization [3,4,10]. Due to simplicity, versatility, safe profile
and low cost storage, pDNA vaccines clinical studies have reappeared. Hence the number of
applications of pDNA is still growing [3,10,13], new developments and progress solutions are
gradually emerging as a result of the increased demand for the pDNA-based treatments [13].
Vectors use in Gene Therapy Clinical Trials
Adenovirus 22,2% (n=506)
Retrovirus 18,4% (n=420)
Naked/Plasmid DNA 17,4%(n=397)
Vaccina virus 7,2% (n=165)
Adeno-associated virus 6%(n=137)
Lipofection 5% (n=115)
Lentivirus 5% (n=114)
Other vectors 15,3% (n=348)
Unknown 3,3% (n=76)
Figure 1.1.2 - Vectors used in gene therapy clinical trials. Adapted image from The Journal of Gene Medicine [59]
3
To date, three veterinary DNA vaccines are licensed for treatment, the west wile virus in horses,
infectious hematopoietic necrosis virus in salmon and melanoma in dogs [11]. The awareness
about the relevance of the pDNA as a therapeutic is growing and causing a substantial demand
for this therapeutic molecule. This higher demand of pDNA for different indications combined
with the amount of pDNA used per dose, which are much higher compared with the protein-
based biotherapeutics, intensifies the need for a large scale of production. In addition, a high
purity level and homogeneity is a pivotal parameter to ensure a good therapeutic response and
the patient safety. Thus, an efficient purification process is vital as well. Furthermore, the
whole production process and storage requires an efficient quality control characterization.
Thus, all the manufacturing steps, from production to the final product, are analyzed and
controlled by regulatory agencies guidelines like Food and Drug Administration (FDA), European
Agency for the Evaluation of Medical Products (EMEA) and World Health Organization (WHO).
Summarizing, it’s needed a well-established and economically affordable process that can be
controlled and that ensures a large scale production and highly pure pDNA [3]. The well-
publicized potential of gene therapy, together with ongoing clinical trials of DNA vaccines and
an increase in the number of the regulatory approvals for veterinary vaccines, makes enormous
the market potential for pDNA [3]. Nevertheless, research, laboratory and industrial innovation
is still needed to enable the efficient production and control of these high pure quantities
[3,10,11].
1.1.2. Structure and Proprieties
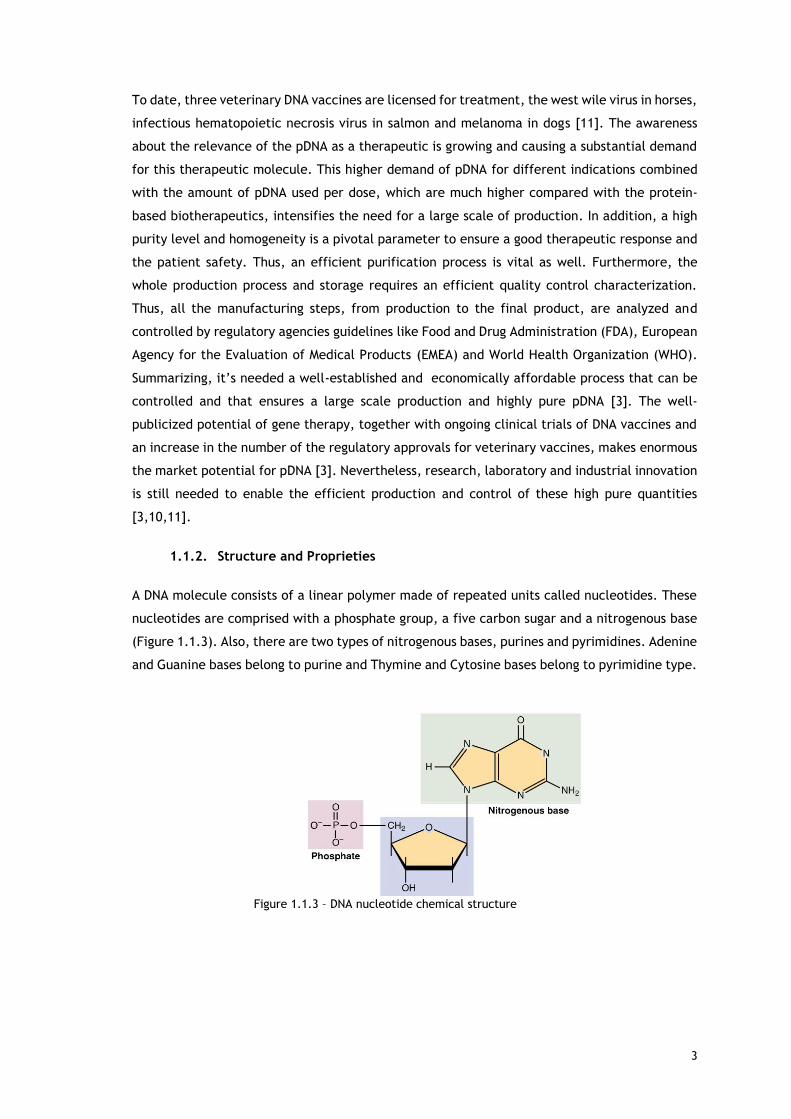
A DNA molecule consists of a linear polymer made of repeated units called nucleotides. These
nucleotides are comprised with a phosphate group, a five carbon sugar and a nitrogenous base
(Figure 1.1.3). Also, there are two types of nitrogenous bases, purines and pyrimidines. Adenine
and Guanine bases belong to purine and Thymine and Cytosine bases belong to pyrimidine type.
Figure 1.1.3 – DNA nucleotide chemical structure
4
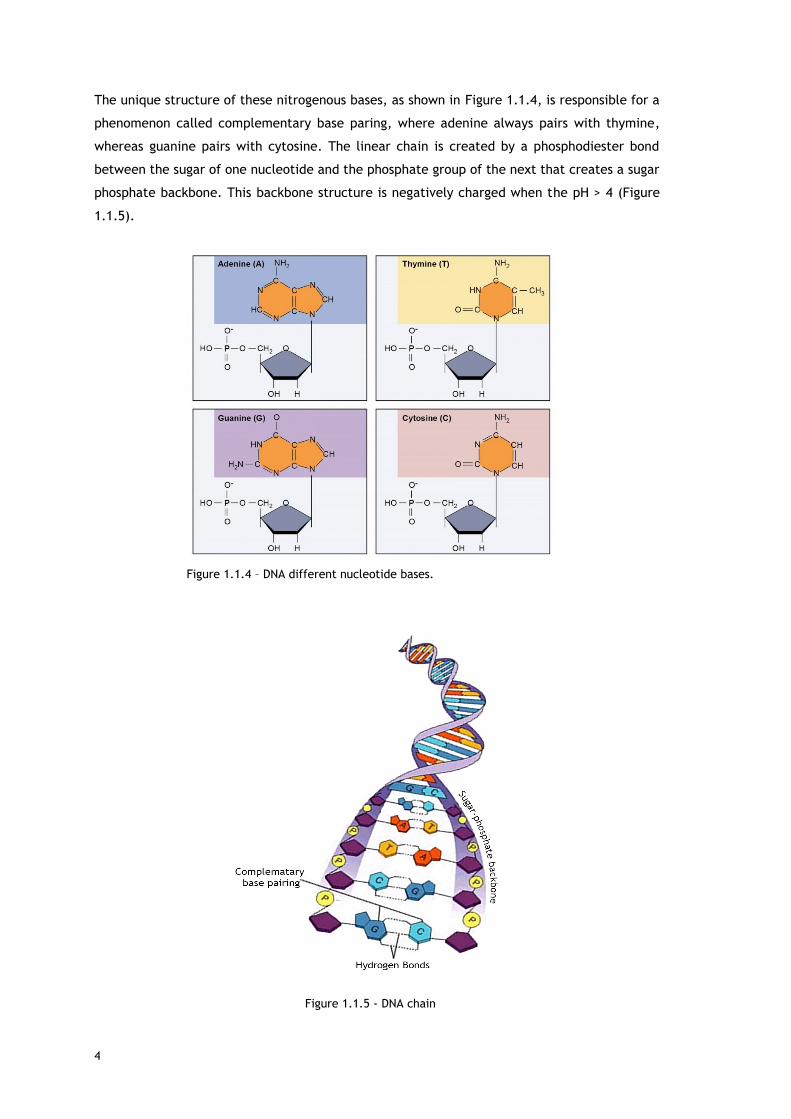
The unique structure of these nitrogenous bases, as shown in Figure 1.1.4, is responsible for a
phenomenon called complementary base paring, where adenine always pairs with thymine,
whereas guanine pairs with cytosine. The linear chain is created by a phosphodiester bond
between the sugar of one nucleotide and the phosphate group of the next that creates a sugar
phosphate backbone. This backbone structure is negatively charged when the pH > 4 (Figure
1.1.5).
Figure 1.1.5 - DNA chain
Figure 1.1.4 – DNA different nucleotide bases.
5
The winding of two anti-parallel complementary nucleotides in each DNA strand are connected
by hydrogen bonds, along a common axis forming the well-known right-handed double helix
structure with highly hydrophobic grooves accessible to solvents and ligand molecules [13].
Plasmids are molecules in which the two ends of the DNA strand are covalently linked, forming
a closed loop. Like the chromosomal DNA, it contains genetic information that can benefit the
host. In addition, it is physically separated from the chromosomal DNA which makes this
molecule a form of gene transmission. Plasmids are considered replicons, which are capable of
autonomously replicate inside a suitable host. They can occur naturally in bacteria, but can
also be found in some eukaryotic organisms [13,17].
The size of the plasmids can vary from 1 to over 1000 kilo-base pair (kbp) and the number of
plasmids inside the same cell can be enormous under some circumstances and may appear in
one of many conformations. The conformations can greatly influence the biological activity of
plasmids, and this is one of the reasons of the importance of separation studies, that enable
the purification of the most active pDNA topology. Thus, different conformational types of
pDNA should be regarded in this work [13].
1.1.3 Plasmid conformational forms
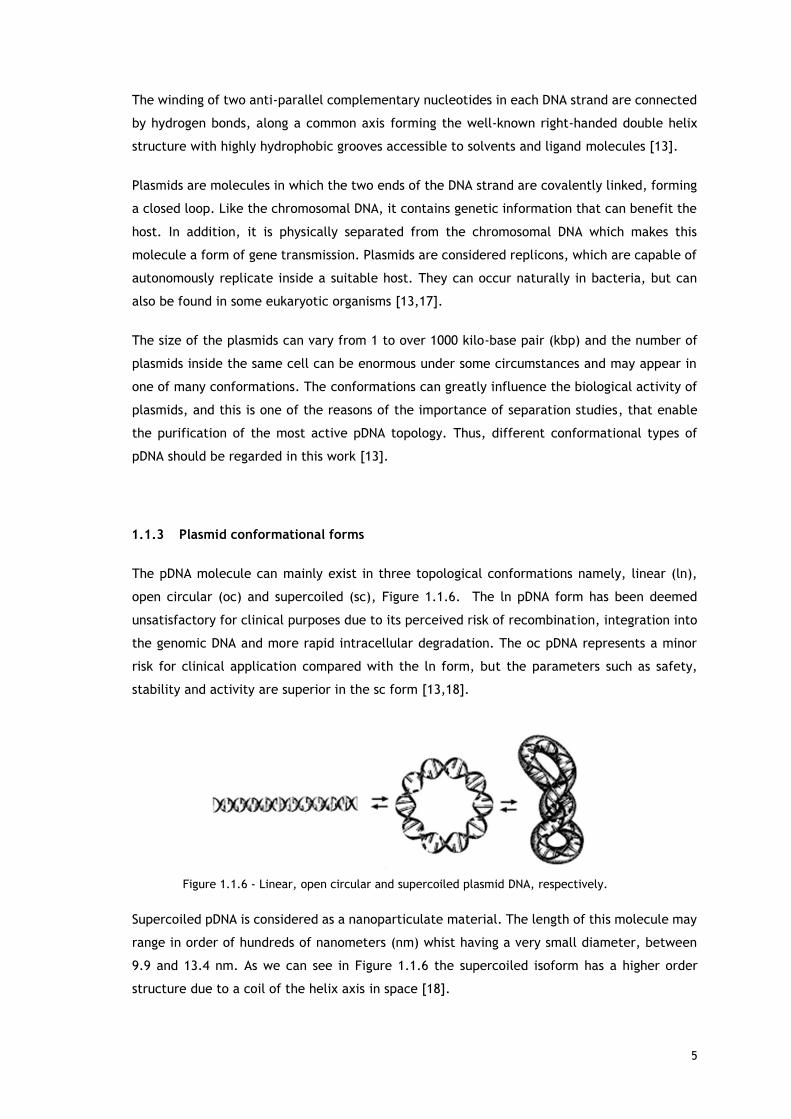
The pDNA molecule can mainly exist in three topological conformations namely, linear (ln),
open circular (oc) and supercoiled (sc), Figure 1.1.6. The ln pDNA form has been deemed
unsatisfactory for clinical purposes due to its perceived risk of recombination, integration into
the genomic DNA and more rapid intracellular degradation. The oc pDNA represents a minor
risk for clinical application compared with the ln form, but the parameters such as safety,
stability and activity are superior in the sc form [13,18].
Supercoiled pDNA is considered as a nanoparticulate material. The length of this molecule may
range in order of hundreds of nanometers (nm) whist having a very small diameter, between
9.9 and 13.4 nm. As we can see in Figure 1.1.6 the supercoiled isoform has a higher order
structure due to a coil of the helix axis in space [18].
Figure 1.1.6 - Linear, open circular and supercoiled plasmid DNA, respectively.

6
The number of times that the two strands of DNA helix are intertwined is called linking number,
Lk. For an oc pDNA the linking number is Lko, which is equal to the number of base pairs (bp)
in the molecule divided by the helical repeat (10.6 bp/turn). The negatively charged sc plasmids
are characterized by a deficiency in the Lk, in which Lk<Lko. These supercoiling degree can also
be described in terms of a specific linking number difference, or superhelix density, σ, given
by: [18,19]
𝜎 =(𝐿𝑘−𝐿𝑘𝑜)
𝐿𝑘𝑜 (1)
Most supercoiled plasmids molecules isolated from prokaryotes have σ values between -0.05
and -0.07. [18]. At these degree of supercoiling, plasmid molecules have a clearly defined
branched shape as shown in Figure 1.1.7.
In addition, Boles et al. [19] found out that for 3.5 and 7.0 kbp molecules, the superhelix axis
length is independent of σ and is about 41% of the total DNA length. For the same plasmids, the
superhelix radius decreased hyperbolically with the superhelix density, σ, according to the
relation [18,19] :
1
r= 0.00153 − 0.268𝜎 (2)
Moreover, it is important to mention that the size of pDNA for vaccine production typically
ranges from 3 to 15 kbp, depending on the vector complexity, with the expectation that the
size could increase in the future, namely for the production of multivalent vaccines [18,19] .
Figure 1.1.7 - Schematic model a negatively supercoiled plasmid [19,30]. The DNA double helix is represented by the thick line. The superhelix axis is the dashed curve crossing the nodes and bisecting the area enclosed by the two DNA double strands between adjacent nodes. The superhelix radius is the
distance between the superhelix axis and the DNA double strands.

7
1.2. Biotechnological plasmid DNA production
As stated before, the potential of gene therapy and DNA vaccines are increasing the interest of
using pDNA as a biopharmaceutical molecule. This interest already increased the need of a
large scale manufacture and also the improvement of good manufacturing practices (GMP)
[3,5].
The pDNA biotechnological production process can be divided into two sequential phases. The
upstream processing which comprise the steps that goes from the plasmid production and host
development to the cell fermentation. The downstream processing is responsible for the
harvest, lysis and purification of the desired molecule. With the scale up to an industrial
production, some methods used in laboratory-scale became inadequate and had to be replaced
by others more economically reliable and environmentally safer. Figure 1.2.1 shows the general
steps in the pDNA production [3,5,13].
The final product quality depends on the production system. Thus, it is very important to design
and evaluate all the manufacturing steps previous to the scale up in order to achieve the best
pDNA productivity and quality. Even with a well stabilized process of manufacturing, it is crucial
to control all the steps [5,13].
Figure 1.2.1 - Schematic process steps for the development of plasmid DNA.
8
1.2.2. Upstream Processing
The manufacturing process begins with the isolation of the desired gene and its insertion on
the plasmid, a process known as vector construction. Generally, the vector consists of a plasmid
backbone that includes very common elements like one replication origin, a stronger promoter,
a polyadenylation signal sequence, an antibiotic resistance gene and the encoding therapeutic
gene. Next, the host cells to take up the designed vector need to be prepared. All process is
well characterized and has been used for years, making the vector construction and cell bank
preparation to take about 1-2 weeks. The use of antibiotics assist the strains selection [3,5].
The most commonly used host for pDNA production is the bacterium Escherichia coli (E. coli)
for high cell-density cultivations (HCDC). Several strains have been reported to be effective in
the pDNA production and most of them are selected because of its well documented usage in
laboratory-scale protocols. For HCDC, the commercial E. coli DH5α strain still have some
drawbacks, like the increased aerobic acetate production that causes loss of productivity and
waste of carbon source. Even so, this commercial strain has a higher production when compared
with the other strains like DH5, DH1, DH10B and JM108 that are used in laboratory-scale as
well. In addition, the DH5α strain cultivations have a higher supercoiled fraction in comparison
with the above cited strains. For a plasmid size of 6.1 kbp, the commercial E. coli DH5α have
shown to produce 12.73±0.10 mg/L of pDNA with 80% of supercoiled fraction, when cultivated
with 100 g/L of glucose to achieve the HCDC in batch mode [5,20].
Nevertheless, the host and strain selection is by far the only factor to have in concern. Other
factors as medium composition, growth temperature, and time of fermentation are also very
important and have a direct relation on the quality and quantity of the product. At laboratory
scale, the production of plasmids seems to be relatively easy and simple once the fermentations
are conducted in a batch mode and the quantity needed it’s not very high [5]. Plasmids
represents around 3% WW-1 of the E. coli total extract, and since the open circular and linear
ones are considered unsatisfactory by the regulating agencies, the final and desired product
will be even smaller [5,13]. Biomass productivity (volumetric yields), plasmid number of copies
(specific yields) and quality are key concerns that have to be improved trough the optimization
of the biological production system for an economically affordable industrial scale-up. In this
process, for an optimal plasmid production both volumetric and specific yields have to be
maximized. Thus, high volumetric yields will enable smaller and economical fermentations and
high specific yields will increase the plasmid purity leading to an easier and reliable economic
separation and purification process [5].
9
1.2.3. Downstream Processing
Sequentially, after the whole production procedure, the recovery and purification processes
are necessary. These include the cell harvest, lysis, separation of the cellular debris,
clarification, chromatographic purification and concentration [3,13]. In general, this is the
most technically difficult part, since the product of interest are labile requiring mild processing
conditions. Specially in this case, pDNA has some concern associated with the conventional
purification of biological samples [13]. These major concerns are related substantially with the
pDNA structural nature, mainly the conformation. As stated before, only the supercoiled
fraction has clinical importance, as it presents higher biological activity. The diversity of
biomolecules present in the pDNA containing extracts and the structural and chemical
similarities between the pDNA and impurities are also some of the central challenges for the
recovery and purification of pDNA [3,13]. Actually, most of the critical contaminants share
some similar characteristics like: negative charge (RNA, genomic DNA, and endotoxins),
identical size (genomic DNA, endotoxins) and hydrophobicity (endotoxins). Samples with these
kind of complexity and similarities usually require the establishment of purification processes
with larger number of steps to efficiently separate the different species [5,13]. However, the
intensification of the process steps in extraction, isolation and purification induce a
considerable structural stress which can result in damage of the supercoiled isoform. Once
more, it is crucial to evaluate every step previously in order to avoid product degradation and
maximize the product yield [3,13].
Before the lyses, the cell harvest must be performed. This is a process that will decrease the
fermentation volume by concentrating the cells 3 to 5 times. Depending on the scale, either
centrifugation or filtration are suitable to be used on the cell harvesting. The filtration step
needs to minimize shear and permeate control. On the other hand, centrifugation is more cost-
effective at large scales but to maintain the throughput necessary, high shear forces are
needed; therefore, filtration should be preferred at all scales [5,13].
On the lysis process, the main goal is to disrupt the cell to release the pDNA and eliminate the
solid debris. There are chemical, physical and mechanical methods for this step, however for
pDNA recovery, alkaline lysis accompanied by the use of detergents such as Triton was
developed many years ago and it still is one of the most methods used at laboratory-scale. This
is a very well stabilished method, since the detergent solubilizes the cell wall and the alkaline
environment denatures the genomic DNA. Generally, after the chemical lysis, a chemical
precipitation is performed in order to remove major impurities such as high molecular weight
RNA, proteins, endotoxins and genomic DNA and concentrate the sample. It is important to
mention that this last step is not a good process for the scale up and other methods should be
considered for an industrial scale [3].
10
At the end of the lysis step the sample remains with some of the impurities and most important,
all the plasmid conformational states are present[13],but the initial volume decrease
substantially and more vital, the pDNA molecule is maintained in solution which will facilitate
the purification process [3,13]. There are a few purifications processes, but liquid
chromatography (LC) is the most commonly used technology for biological sample purification,
either as processing step or as analytical tool [5,17,18].
In the last few decades, some advances in the biotechnological areas have introduced several
technologies for the purification of complex biomolecules [5]. Even so, an evaluation of the
global process showed that the downstream operations have a significant relevance, being one
of the most important and more expensive steps [5]. Some precipitation and ultrafiltration
techniques can be involved in the isolation process, and also aqueous tow-phase systems have
been applied in the purification steps; however LC is undoubtedly the most used technique
[3,5].
Liquid chromatography is central not only to the small-scale purification of plasmids, but also
to the industrial large-scale. This technique can be used as a purification step and as an
analytical tool used for monitoring process development and product quality control [13,18].
The goal of LC as a separation step consists in the separation of the pDNA from residual
impurities and undesirable isoforms through biomolecule capture and flow-through steps [5,18].
The different proprieties such as the size, the conformation form and hydrophobicity of
different nucleic acids have been explored in order to give some insight about the possible
interactions that are responsible for their adsorption process. Information is crucial to better
understand the chromatographic step, with the final goal of improving future systems [5].
For a therapeutic application of pDNA, the final product has to be in a highly purified and
homogenous preparation of sc isoform, to obey the strict guidelines established by the
regulatory agencies. Table 1.2.1 shows the prerequisites of pDNA for therapeutic application
[3,5,13].
To sum up, the development of a plasmid purification process must first consider the complex
origin of the plasmid-containing extract. As stated before, one of the problems on the sc pDNA
purification is mainly due to the physiochemical similarities between the target molecule and
the contaminants. Unquestionably the central technique used to purify sc pDNA from its other
isoforms and related impurities is liquid chromatography.
There are several chromatographic systems used to purify such molecules. These
chromatographic systems and their differences will be addressed in the following chapter.

11
Table 1.2.1 – Agencies guidelines for application of pharmaceutical grade of sc pDNA.
FDA and EMEA Units
sc pDNA >97 %
gDNA <2 µg/mg pDNA
Proteins <3 µg/mg pDNA
RNA <0.2 µg/mg pDNA
Endotoxins <10 EU/mg pDNA

12
13
1.3. Liquid Chromatography technique for pDNA purification
Mikhail Tswett defined chromatography as: “Any liquid or gaseous mixture of the substances is
divided into its components during the process of its movement through a layer of sorbent, if
there are differences in sorption interaction between the components of the mixture and the
sorbent” [21]. Nowadays, LC can be defined as a two-dimensional process that employs a fixed-
bed, known as the stationary phase, to separate a mixture of components that are carried
though the bed by a fluid phase known as the mobile phase. When different components are
fed into the stationary phase, they are expected to have different types of interaction. The
feed components that interact more strongly with the stationary phase are retarded and are
eluted later than those that interact more weakly and travel faster. Thus, the nature of
interactions of solutes between the two phases depends on the molecular interactions between
the feed components, the functional groups present on the surface of the stationary phase and
the system conditions provided by the mobile phase. One exception is the size exclusion
chromatography, where the stationary phase is steric leading to a separation based only on the
size of molecules [22]. Table 1.3.1 provides a brief summary of the various branches of modern
LC as they apply to biopolymer separation, defined by the type of stationary phase ligate.
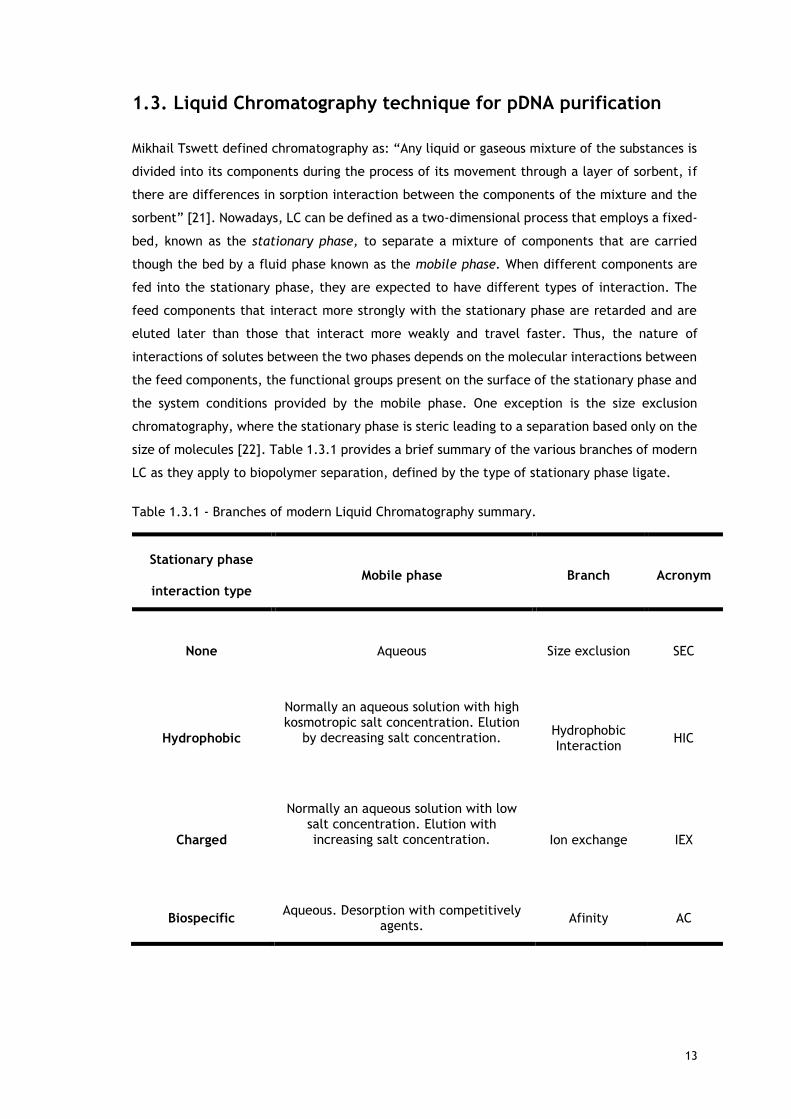
Table 1.3.1 - Branches of modern Liquid Chromatography summary.
Stationary phase
interaction type
Mobile phase Branch Acronym
None Aqueous Size exclusion SEC
Hydrophobic
Normally an aqueous solution with high kosmotropic salt concentration. Elution
by decreasing salt concentration.
Hydrophobic Interaction
HIC
Charged
Normally an aqueous solution with low salt concentration. Elution with increasing salt concentration.
Ion exchange IEX
Biospecific Aqueous. Desorption with competitively
agents. Afinity AC
14
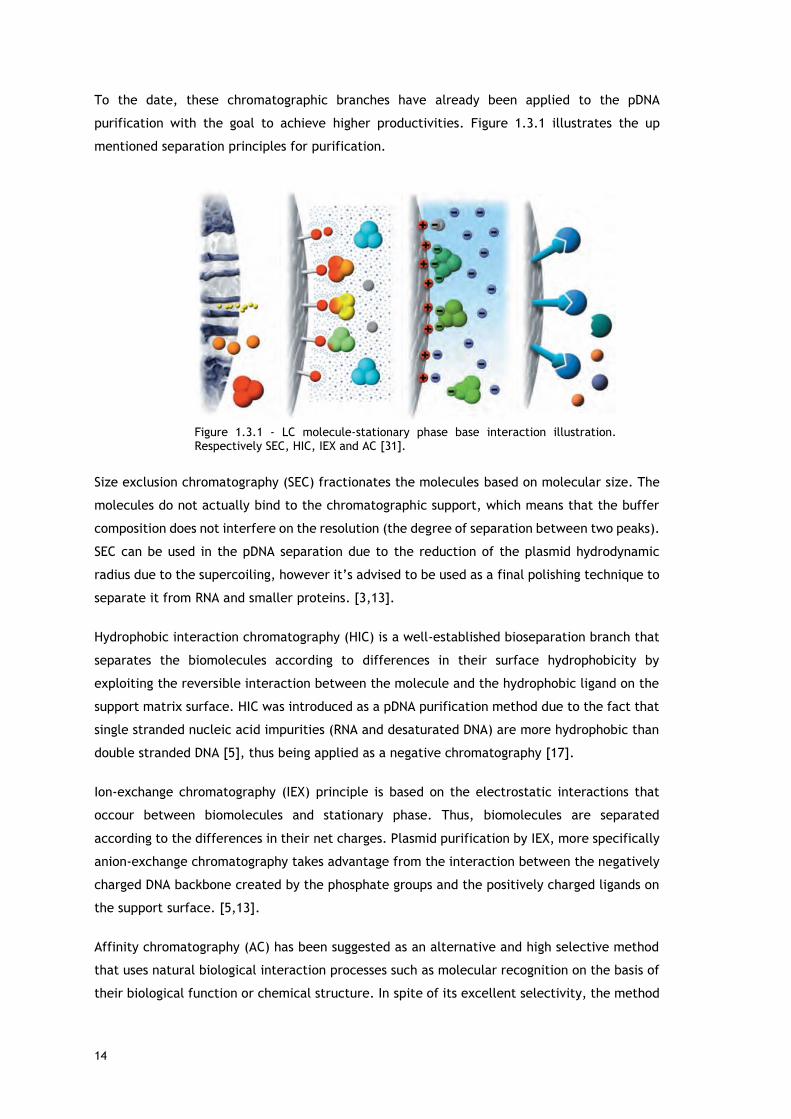
To the date, these chromatographic branches have already been applied to the pDNA
purification with the goal to achieve higher productivities. Figure 1.3.1 illustrates the up
mentioned separation principles for purification.
Size exclusion chromatography (SEC) fractionates the molecules based on molecular size. The
molecules do not actually bind to the chromatographic support, which means that the buffer
composition does not interfere on the resolution (the degree of separation between two peaks).
SEC can be used in the pDNA separation due to the reduction of the plasmid hydrodynamic
radius due to the supercoiling, however it’s advised to be used as a final polishing technique to
separate it from RNA and smaller proteins. [3,13].
Hydrophobic interaction chromatography (HIC) is a well-established bioseparation branch that
separates the biomolecules according to differences in their surface hydrophobicity by
exploiting the reversible interaction between the molecule and the hydrophobic ligand on the
support matrix surface. HIC was introduced as a pDNA purification method due to the fact that
single stranded nucleic acid impurities (RNA and desaturated DNA) are more hydrophobic than
double stranded DNA [5], thus being applied as a negative chromatography [17].
Ion-exchange chromatography (IEX) principle is based on the electrostatic interactions that
occour between biomolecules and stationary phase. Thus, biomolecules are separated
according to the differences in their net charges. Plasmid purification by IEX, more specifically
anion-exchange chromatography takes advantage from the interaction between the negatively
charged DNA backbone created by the phosphate groups and the positively charged ligands on
the support surface. [5,13].
Affinity chromatography (AC) has been suggested as an alternative and high selective method
that uses natural biological interaction processes such as molecular recognition on the basis of
their biological function or chemical structure. In spite of its excellent selectivity, the method
Figure 1.3.1 - LC molecule-stationary phase base interaction illustration. Respectively SEC, HIC, IEX and AC [31].
15
suffers from limitations like slow kinetic and ligand fragility that are associated with low binding
capacity [3].
As we have seen through this chapter, the ligands on the stationary phase have a crucial
importance on the separation process [23]. Thus, the last decade of research brought also the
attention to support matrixes composition [23–25]. At this moment, important information
showed that not only the ligand itself but also support matrix composition, physical structure
and ligand distribution have some contribution to the separation process [22,24–28].
1.3.1. Physical proprieties of different stationary phases.
The need for high amount of pharmaceutical-grade biomolecules with a therapeutic purpose
brought the requirement for high production quantities [5]. Over the last three decades, there
have been significant improvements on the upstream processes that have increased the
feedstock concentrations. Unfortunately, there hasn’t been a concomitant increasing in the
downstream processes improvements. As stated above, the downstream processes, more
specifically the LC technique, are the most expensive part of the production system. The only
way to reduce the costs of such an operation is to increase the overall throughput (i.e, increase
the ratio final product per time unit). The most common way to accomplish this is to increase
the scale of operation (e.g., increase the number or size of the chromatography columns) or by
using continuous methods. Yet, another efficient method is to increase the stationary phase
capacity of purification through an optimization of its physical and chemical proprieties [22,23].
Some desirable features for a stationary phase support matrix include low non-specific
adsorption, high mechanical strength, high surface functionality for immobilization of ligands,
absence of toxic leachable, and stability in solution used for cleaning and sanitation. A variety
of materials are available that meet these requirements and form the basis for modern
chromatography media, Figure 1.3.2. The Table 3.4.4 (appendix) summarize classification and
properties of the different support media used in LC [22]. The majority of supports used to date
are based on particles (beads) that are packed into a column forming a homogenous bed. More
recently, the continuous stationary phases appeared, and are known as monoliths. The
monoliths are produced in situ crating a network of pores or channels through which the fluid
flows [5,23–25,28].
C D A
A
B
Figure 1.3.2 – Structure illustration of the different types of stationary phase’s composition. A) Gels (e.g. agarose, cellulose…) B) Rigid porous media (e.g. Silica, alumina…) C) Composite media
(e.g. Silica/dextran, agarose/dextran…) D) Monoliths (e.g. Polyacrylamide) [22].
16
In order to attain a high productivity a high binding capacity is a crucial parameter. As we have
seen in this work, the majority of separation techniques depends on the interaction between
the ligand and the molecules. Thus, if the surface of interaction increases, the number sites
available for the molecule to interact can also increase leading to a higher capacity [23].
Considering this strategy, both support matrices (beads and monoliths) used in these
applications are usually porous [22,23]. The porosity is a form to enhance the surface area
available as long as the pore size is sufficient to allow molecule diffusion through the porous
network [22]. Some structural illustrations are shown on Figure 1.3.2.
Another important aspect of the construction of stationary phases is the form of how the surface
modification is taken to introduce the ligands. The global ligand architecture will affect the
binding capacities and sometimes non-specific interactions. These non-specific interactions
may unpredictably influence the adsorption process for an individual molecule. Chemical
modification is needed in order to functionalize the support matrix. Ligands need to be
connected to the base material backbone. There are general possibilities to connect ligands to
the pore wall of a resin. Moreover, the final formulation of matrix bound ligands is also a main
properties that can influence the binding capacity [23]. A schematic representation is shown
on Figure 1.3.3.
The purification of pDNA using conventional chromatographic media (packed beads) face some
limitations, not only related to the similarities, but also related with the limitations of avaliable
stationary phases, mainly because of their low capacity to bind large biomolecules. For
instance, it has to be considered that the hydrodinamic radious of a pDNA molecule is larger
than the average of a protein and has a very low diffusivity. Hence, the packed columns with
soft chromatographic beads are limited by mechanical factors such as bed instability and mass
transfer problems [5]. These drawbacks led to the development of monoliths. Chromatographic
monoliths repersents the 4th generation of stationary phases. Consisting in a single piece of
highly porous material and a network of channels through which the mobile phase flows. The
particular monolith structure inherently reflects in several key propreties such as: very high
A B C
Figure 1.3.3 - Different ligand architecture in the stationary phase pore; A) without spacer – Because they are connected directly on the surface wall, the interaction may be limited once many of them are accessible. B) with spacers – the spacers where designed to attend the accessibility problem, however, some controversial discussions throughout the literature whether it will be a source of non-specific interactions. C) Polymeric modification (Graft) – grafted ligands shows a more promising alternative for
attend the accessibility drawback and have already showed a higher binding capacity [23].

17
porosity, high binding capacity for extremely large molecules and mass transport bases on
convection [28]. Among to the different chromatographic stationary phases methacrylate
monoliths seem to be especially attractive due to a short purification time, flow unafected
properties, high dynamic bindig capacity and aplicability to industrial scale [26,28]. The typical
plasmid size found in DNA vaccines ranges from 3 to 15kbp with the future expectation that the
size could increse [3]. With the aplication of monolithic stationary phases, the “small” plasmid
purificatin turned to be easier and separation of plamids up to 62kbp already began to appear
[26–28].
1.3.2. Anion-Exchange Chromatography principles for pDNA purification
An Anion-Exchange chromatographic column consists of a matrix substituted with ionic groups
that are positively charged. The first step in a chromatographic procedure is to equilibrate the
stationary phase (Figure 1.3.4 A) with a buffer that has adequate pH and ionic strength to bind
the negatively charged sc pDNA and not bind positively charged impurities. The bound
biomolecules are concentrated in the column while biomolecules with the same charge as the
medium pass through the column (flow through), eluting during or just after the sample
application (Figure 1.3.4 B). After all the sample has been loaded into the column and non-
binding biomolecules eluted (UV signal returns to baseline) conditions are altered by changing
the buffer, usually increasing the ionic strength (salt concentration), leading to the elution of
the bound biomolecules. These biomolecules start to elute as the ionic strength increases
because salt ions start to compete for the medium binding sites (Figure 1.3.4 C). The first
biomolecules to be eluted from the column are the ones with the lowest net charge at the
A B
C D
Figure 1.3.4 - Anion-exchange separation principles. Adapted from GE Healthcare
handbook.
18
selected pH, thereafter, the ones with the higher net charge will be most strongly retained and
be eluted last. Thus, controlling the changes in ionic strength, different biomolecules can be
eluted differentially in a purified and concentrated form [29].
The final step is the regeneration of the column through the use of a very high ionic strength
buffer that will remove all the tightly bound biomolecules (Figure 1.3.4 D). Before a next run,
the column has to be re-equilibrated using the same initial conditions buffer and the process
can work as a cycle [29].
Depending on the source of the feed material, various types of impurities (host cell proteins,
nucleic acids, retroviral particles, process additives and lipids) if not removed during the
washing, may be trapped in the chromatography medium causing carryover from one cycle to
the next. In that case, cleaning-in-place (CIP) of the chromatography column is important for
the integrity and safety of the final product. Sodium hydroxide is the gold standard for cleaning
and sanitizing chromatography columns [30].
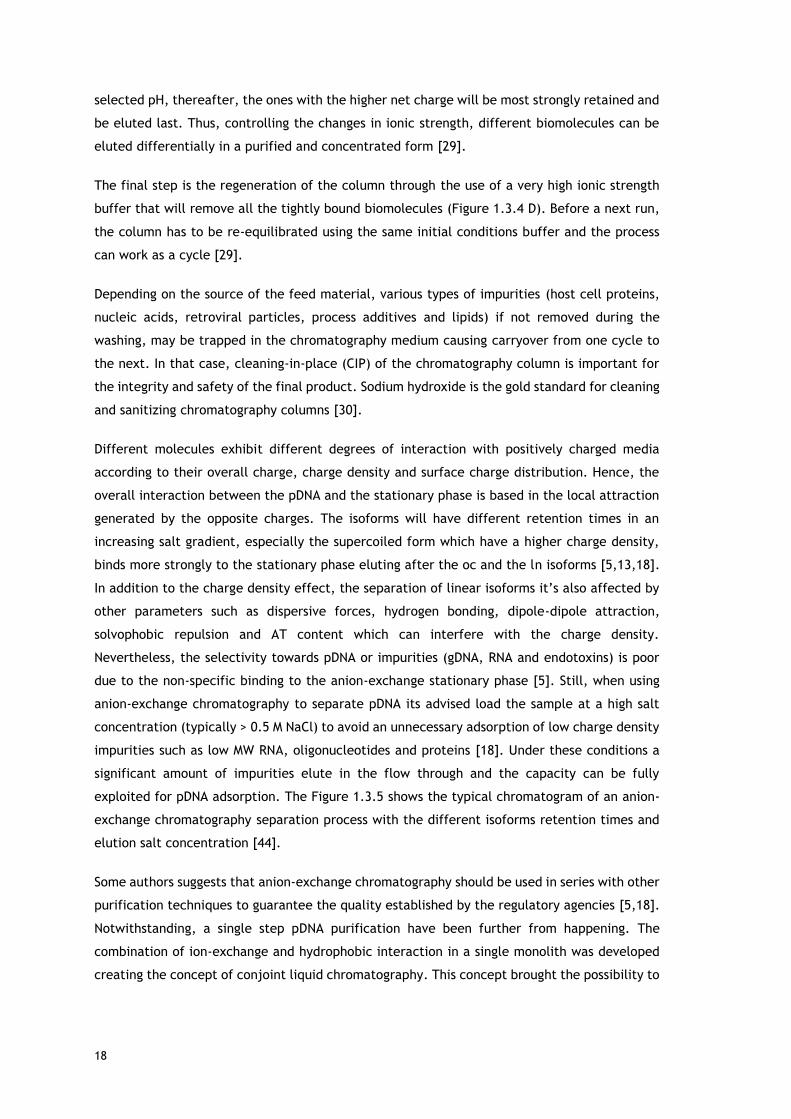
Different molecules exhibit different degrees of interaction with positively charged media
according to their overall charge, charge density and surface charge distribution. Hence, the
overall interaction between the pDNA and the stationary phase is based in the local attraction
generated by the opposite charges. The isoforms will have different retention times in an
increasing salt gradient, especially the supercoiled form which have a higher charge density,
binds more strongly to the stationary phase eluting after the oc and the ln isoforms [5,13,18].
In addition to the charge density effect, the separation of linear isoforms it’s also affected by
other parameters such as dispersive forces, hydrogen bonding, dipole-dipole attraction,
solvophobic repulsion and AT content which can interfere with the charge density.
Nevertheless, the selectivity towards pDNA or impurities (gDNA, RNA and endotoxins) is poor
due to the non-specific binding to the anion-exchange stationary phase [5]. Still, when using
anion-exchange chromatography to separate pDNA its advised load the sample at a high salt
concentration (typically > 0.5 M NaCl) to avoid an unnecessary adsorption of low charge density
impurities such as low MW RNA, oligonucleotides and proteins [18]. Under these conditions a
significant amount of impurities elute in the flow through and the capacity can be fully
exploited for pDNA adsorption. The Figure 1.3.5 shows the typical chromatogram of an anion-
exchange chromatography separation process with the different isoforms retention times and
elution salt concentration [44].
Some authors suggests that anion-exchange chromatography should be used in series with other
purification techniques to guarantee the quality established by the regulatory agencies [5,18].
Notwithstanding, a single step pDNA purification have been further from happening. The
combination of ion-exchange and hydrophobic interaction in a single monolith was developed
creating the concept of conjoint liquid chromatography. This concept brought the possibility to
19
achieve a pDNA sample with the level required for human treatment in a single chromatographic
step [26].
1.3.3. Hydrophobic Interaction Chromatography principles for pDNA purification
HIC separates molecules according to differences in their hydrophobicity by exploiting a
reversible interaction between them and the hydrophobic surface of a HIC medium. Thus,
molecules with different degrees of surface hydrophobicity can be separated. In contrast to
anion-exchange chromatography, the interaction between the pDNA and the HIC medium is
influenced significantly by the presence of kosmotropic salts in the running buffer. In pure
water any hydrophobic effect is too weak to cause interaction between ligand and molecules
or between the molecules themselves. However, kosmotropic salts enhance hydrophobic
effect, and adding salts bring about binding of the target biomolecule to HIC media. High salt
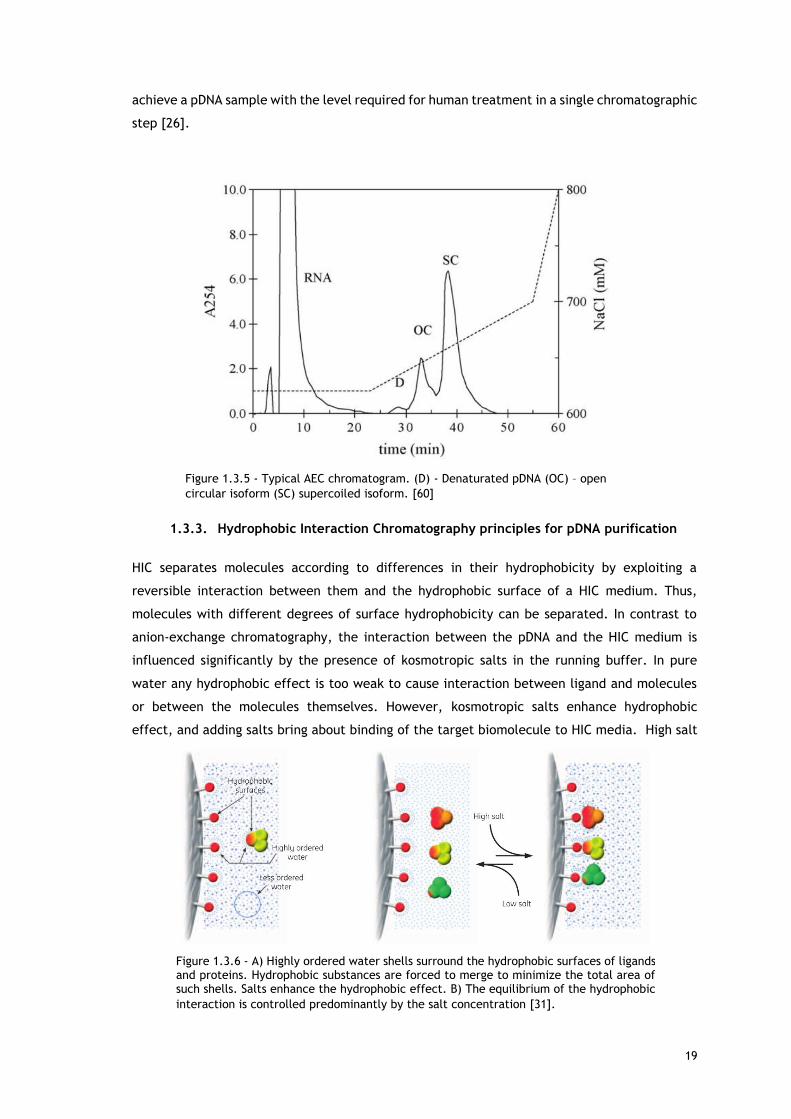
Figure 1.3.6 - A) Highly ordered water shells surround the hydrophobic surfaces of ligands and proteins. Hydrophobic substances are forced to merge to minimize the total area of such shells. Salts enhance the hydrophobic effect. B) The equilibrium of the hydrophobic
interaction is controlled predominantly by the salt concentration [31].
Figure 1.3.5 - Typical AEC chromatogram. (D) - Denaturated pDNA (OC) – open
circular isoform (SC) supercoiled isoform. [60]
20
concentrations enhances the interaction while lowering the salt concentration weakens the
interaction [31]. Figure 1.3.6 shows the main principles in HIC.
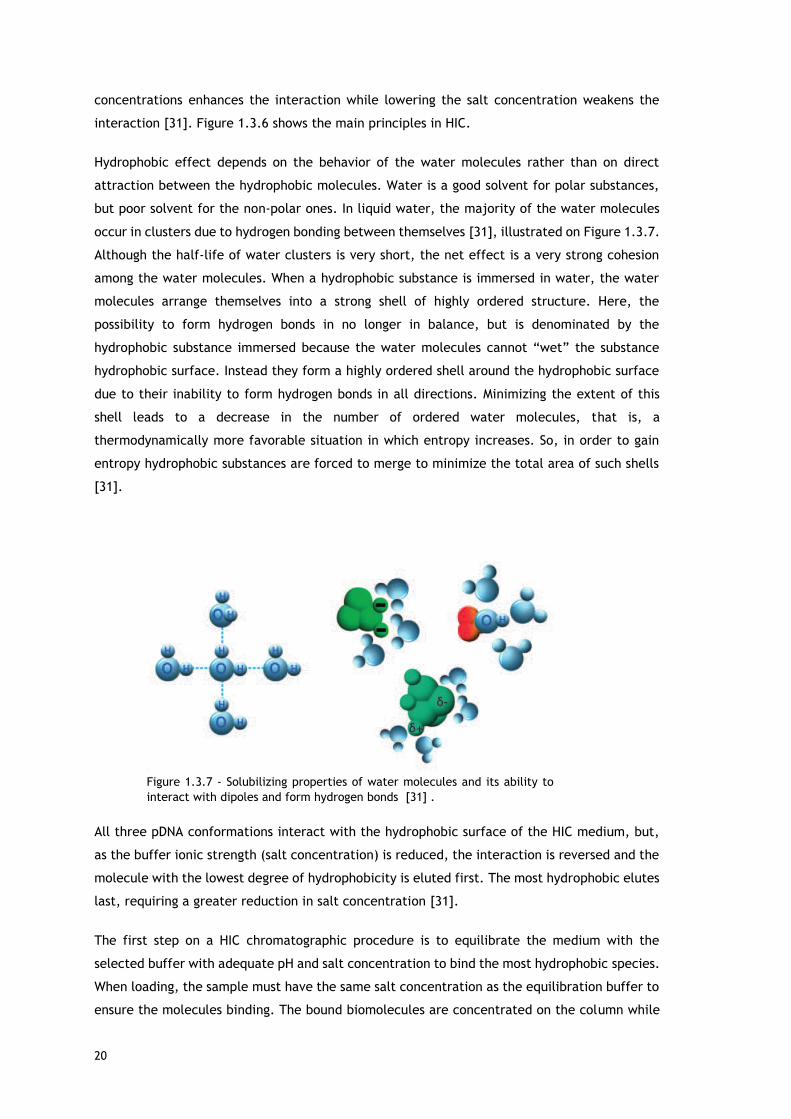
Hydrophobic effect depends on the behavior of the water molecules rather than on direct
attraction between the hydrophobic molecules. Water is a good solvent for polar substances,
but poor solvent for the non-polar ones. In liquid water, the majority of the water molecules
occur in clusters due to hydrogen bonding between themselves [31], illustrated on Figure 1.3.7.
Although the half-life of water clusters is very short, the net effect is a very strong cohesion
among the water molecules. When a hydrophobic substance is immersed in water, the water
molecules arrange themselves into a strong shell of highly ordered structure. Here, the
possibility to form hydrogen bonds in no longer in balance, but is denominated by the
hydrophobic substance immersed because the water molecules cannot “wet” the substance
hydrophobic surface. Instead they form a highly ordered shell around the hydrophobic surface
due to their inability to form hydrogen bonds in all directions. Minimizing the extent of this
shell leads to a decrease in the number of ordered water molecules, that is, a
thermodynamically more favorable situation in which entropy increases. So, in order to gain
entropy hydrophobic substances are forced to merge to minimize the total area of such shells
[31].
All three pDNA conformations interact with the hydrophobic surface of the HIC medium, but,
as the buffer ionic strength (salt concentration) is reduced, the interaction is reversed and the
molecule with the lowest degree of hydrophobicity is eluted first. The most hydrophobic elutes
last, requiring a greater reduction in salt concentration [31].
The first step on a HIC chromatographic procedure is to equilibrate the medium with the
selected buffer with adequate pH and salt concentration to bind the most hydrophobic species.
When loading, the sample must have the same salt concentration as the equilibration buffer to
ensure the molecules binding. The bound biomolecules are concentrated on the column while
Figure 1.3.7 - Solubilizing properties of water molecules and its ability to
interact with dipoles and form hydrogen bonds [31] .
21
the molecules that don’t interact with the media flows through. After all the sample has been
loaded into the column and non-binding biomolecules eluted, conditions are altered by
decreasing the buffer salt concentration, leading to the elution of the bound biomolecules. The
first biomolecules being eluted from the column are the ones with the lowest hydrophobicity
at the selected ion strength, thereafter, the ones with the higher hydrophobicity that are
strongly retained and be eluted last. Once more, controlling the ionic strength, different
biomolecules can be eluted differentially in a purified and concentrated form [31].
The final step is the regeneration of the column through a zero salt concentration buffer that
will remove all the tightly bound biomolecules. Before a next run, the column has to be re-
equilibrated using the same initial conditions buffer and the process can work as a cycle [31].
HIC has also been used analytically for the monitoring and control of pDNA quality. The sc and
oc pDNA isoforms ranging from 4 to 30 kbp were successfully resolved in a TSKgel Butyl-NPR
analytical column (Tosoh). Due to the predominantly hydrophilic nature of pDNA, very high salt
concentrations (about 3M of ammonium sulfate) is required to bind the sc pDNA onto the resin
surface. A reverse salt gradient was used to elute the oc and sc isoforms sequentially. The
separation of the isoforms was attributed to the increased exposition of hydrophobic bases as
a consequence of the underwinding of the sc form [17].
1.4. Adsorption process and equilibrium
As discussed earlier in this work, the increasing demand for pharmaceutical-grade pDNA is
requiring an improvement in the industrial purification systems. These improvements rely on
the system optimization, and for that, it is essential to understand the mechanism underling
the adsorption process onto the chromatographic media.
In general, adsorption is defined as the concentration of species at a solid surface. The
chromatographic separations may involve many different non-covalent interactions between
the molecule and the ligand on the solid support. The interaction with surface can result in two
types of forces: dispersion-repulsion forces that are also known as London or van der Waals
forces; and electrostatic forces which depends of the molecule net charge. Short-range
repulsive forces are dominant very near the surface, but decrease rapidly as the distance from
the surface increases, while electrostatic forces are generally longer range. As a result, the
concentration of molecules near the surface varies with the distance from it. The process seems
quite simple, however, adsorption of macromolecules is usually much more complicated and
currently not amenable to a precise theoretical treatment [22].
There are several adsorption complicating factors, and as result of this complexity, empirical
or semi-empirical approaches are generally needed to describe the adsorption equilibrium. The
22
prediction of multicomponent adsorption it’s even more challenging. Experimental
determinations are almost always necessary. Thus, adsorption equilibria is frequently measured
by suspending the particles in a protein solution and allowing the sufficient time for equilibrium
to be attained. It is often easier to determine the ultimate binding capacity with a high protein
concentration. However, the same can’t be applied when working with more labile molecules
such as sc pDNA. In addition, determine the binding capacity at low concentration is often
difficult since the time needed to achieve the equilibrium can become very long.
Chromatographic methods like fontal analysis, isocratic elution and linear gradient elution can
be one alternative to determine the adsorption equilibria with molecules like plasmids. In
practice, in the context of a biopharmaceutical process development, acquisition of adsorption
equilibrium data is often difficult because the amounts of pDNA can be very limited. As a result,
care must be taken to ensure that precise data are obtained with minimal waste. Following
empirical determinations of adsorption equilibria, the data is generally correlated using
suitable adsorption isotherm expressions [22].
1.4.1. Langmuir Model and static binding capacity
The concentration of adsorbed molecule in the stationary phase at equilibrium with the mobile
phase is expressed by the adsorption isotherm. The molecules are adsorbed on a fixed number
of located sites, which can accept only one molecule, and are organized as monolayers. [22,32].
So, by definition the binding capacity can be defined as:
Q =Bound molecules
Volume of packed resin (3)
The binding capacity (Q) has to be defined for a specific process, a specific resin and individual
type of molecule [23]. The adsorption isotherms are obtained while maintaining constant the
mobile phase composition, temperature and pH [22]. A linear relationship between the bounded
molecules and free molecules at equilibrium, is expected in the low concentration range, but
the relationship becomes non-linear at higher concentrations reaching to a maximum capacity.
At high concentrations, the adsorption sites become saturated, leading to a curvature of the
isotherm into an asymptote [1,32]. So, the linear limit is dependent on the concentration of
accessible binding sites. Conversely, the maximum capacity is generally limited by the
accessible area or by the mumber of binding sites [22].
A model commonly used to describe the protein adsorption equilibrium is the Langmuir
isotherms, which was originally developed for adsorption of gases onto metal surfaces
[1,22,23,32,33]. Ferreira et al (2000) tried to propose a model of adsorption-desorption of
plasmid onto an anion-exchange support but given to some drawbacks, the Langmuir model was
favored to study the plasmid adsorption mechanism [33]. The Langmuir model states that the
molecules are adsorbed on a limited number of sites, which accepts only one molecule. Also,
every adsorption site is energetically equivalent and there is no interaction between adsorbed
23
molecules [32,33]. However, it’s important to mention that the Langmuir isotherm model may
not be applicable to all biomolecules adsorption mechanisms once it does not consider solute-
solute interactions neither steric rearrangements on the solute or the support ligands[1].
Despite that, this model is still being used as a starting point for the adsorption mechanisms
studies [22,33]. A simple derivation of the original model [22] assumes a stoichiometric
association of an adsorbate molecule, P, with a surface-bound ligand, L, according to the
following equation:
L + P ⇌ LP (4)
where k1 and k2 are forward and reverse rate constants for adsorption and desorption,
respectively. Accordingly, the adsorption rate is described by the following equation:
𝑑[PL]
𝑑𝑡= k1[P][L] − k2[PL] (5)
which is subject to the following constraint:
[L] = [L0] − [PL] (6)
where [L0] is the total concentration of surface-bound ligands.
At equilibrium,
𝑑[PL]
𝑑𝑡= 0 (7)
In this case, combining equations 5 and 6 yields:
q =qmKC
1+KC (8)
where q ∝ [PL] is the adsorbed concentration, qm ∝ [L0] the maximum adsorption capacity, C
∝ [P] the concentration in solution and K = k1/k2 is the equilibrium constant for reaction 4. The
capacity q is normally expressed per unit volume or mass of stationary phase and can be defined
in molar or mass units.
The Figure 1.4.1 illustrates the effects of the parameters qm and K and the limiting behavior of
the isotherm [22]. As C → 0, the Langmuir isotherm penchants the linear limit:
q ≈ qmKC = mC (9)
K1
K2

24
where m = qmK is the initial slope of the isotherm, which is also called the Henry constant. On
the other hand, as C → ∞ , the isotherm approaches the maximum capacity q≈qm. The term
1/K represents the liquid phase concentration at which q is equal to one-half of the maximum
capacity, qm.
The capacity of chromatographic column to capture molecules is frequently characterized by
the dynamic binding capacity (DBC). The DBC is generally related to the equilibrium binding
capacity (EBC) also known as static capacity, but is influenced by dispersive factors,
approaching the EBC only for conditions where the column has infinite efficiency. The static
capacity depends only on thermodynamics and molecule feed concentration and is thus
expected to be independent of flow and column length. The relationship between DBC and
stactic capacity is complicated and is dependent on the exact nature of the dispersive
mechanisms. However, in a cases where binding is very favorable the DBC can be approximatly
75% of the maximum static capacity (qm) [22].
Figure 1.4.1 - Langmuir adsorption isotherm with the limiting behavior for low and high C values. M is the initial slope and 1/K is the liquid phase concentration in equilibrium with one-half of qm [22].

25
1.5. Thermodynamic study of biomolecules adsorption
The use of Langmuir isotherms it´s a good starting point to explain the adsorption mechanism
to IEX and HIC supports. Nevertheless, traditional methods cannot completely characterize
complex adsorption mechanisms of biomolecules in liquid chromatography. They are limited
once they do not consider non-ideal effects associated with the adsorption of large
biomolecules such as large proteins and pDNA. In this way, these complex adsorption
mechanisms have been studied by thermodynamic analysis [1,32,34,35]. The biomolecules
adsorption and desorption thermodynamic parameters can be accessed by performing batch
equilibrium experiments, analyzing data from van’t Hoff plots or from microcalorimetric
measurements. Notwithstanding, van’t Hoff analysis is an indirect method that becomes too
complex in the presence of multiple sub processes related with adsorption and batch
experiments have a limited resolution. On the other hand, calorimetric methods such as
Isotheral Titration Calorimetry (ITM) and Flow Microcalorimetry (FMC) have shown in the past
few decades their aptitude to help understand the underlying absorption mechanism of several
biomolecules onto different chromatographic media [1,2,32,34–39].
1.5.1. Flow Microcalorimetry
The behavior of biomolecules at liquid-solid interface is the net result of several types of
interactions that occur between the different components present in the systems, i.e. the
biomolecules, sorbent, solvents and other solutes. The feasibility of a protein or plasmid to be
adsorbed is determined by the change in the standard Gibbs free energy,∆𝐺 of the system,
which for a reversible process can be written as:
∆Gads = ∆Hads − T∆Sads (10)
where ∆Hads and ∆Sads are the adsorption enthalpy and entropy changes respectively [1,32,35].
During the adsorption and desorption process a small, but measurable, thermal signal is
released which can be related to the adsorption mechanism. In this way, absorption enthalpy
measurements through microcalorimetry can provide some useful information that can help to
understand the adsorption mechanisms onto a chromatographic support [1,32,34,35].
Microcalorimetric methods allow the measurement of the heat flow caused by interaction
during the adsorption process of biomolecules onto chromatographic media. More specifically,
FMC allows a dynamic measurement of the heat signals as the signal is measured online during
the adsorption and desorption process of a biomolecule that flows through a small column
packed with the adsorbent. Given to these unique characteristics, FMC is prone to provide an
improved understanding of the driving forces, mechanisms and kinetics involved in complete
interaction processes [1,2,32,38,39].

26
As stated above, a flow microcalorimeter as the ability to simulate a packed-bed
chromatographic system in a micro-scale (Figure 1.5.1) and results are expected to be
representative of the mechanisms that happen in a real chromatographic system. The major
advantage of FMC towards a chromatographic system is that the data assessment occurs within
the column and not after the column, as in usual chromatography studies [1,32,39].
Interfaced with the microcalorimeter cell (Figure 1.5.1), that has a total volume of 171 µL and
where the adsorbent is packed are two highly sensitive thermistors capable of detecting very
small energy changes inside the cell within a short thermal response time. The constant system
flow rate is controlled by a syringe micropump and the samples injected in the column through
a multiport valve system. The injection system has a configurable injection loop that can
accommodate different sample volumes. After the cell measurements, the effluent passes
through an UV detector which allows the biomolecules output control. At the end, the effluent
can be collected and can be analyzed by other techniques.
The FMC thermograms can comprise endothermic and exothermic peaks, which will depend on
the absorption or release of energy during the liquid-solid interaction. The endothermic events
result in negative peaks on the FMC thermogram as the thermistors register a decrease in the
cell energy. Conversely, Exothermic events result in thermogram positive peaks as the
Figure 1.5.1 - Flow microcalorimeter representative scheme.
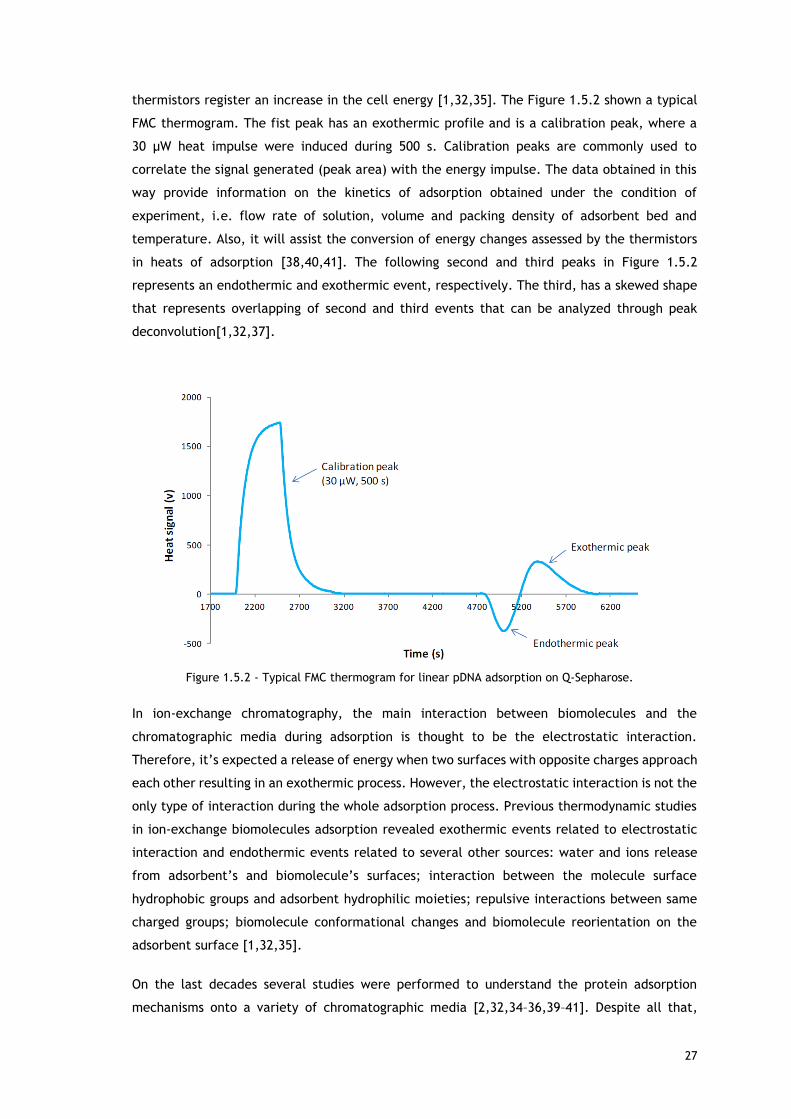
27
thermistors register an increase in the cell energy [1,32,35]. The Figure 1.5.2 shown a typical
FMC thermogram. The fist peak has an exothermic profile and is a calibration peak, where a
30 μW heat impulse were induced during 500 s. Calibration peaks are commonly used to
correlate the signal generated (peak area) with the energy impulse. The data obtained in this
way provide information on the kinetics of adsorption obtained under the condition of
experiment, i.e. flow rate of solution, volume and packing density of adsorbent bed and
temperature. Also, it will assist the conversion of energy changes assessed by the thermistors
in heats of adsorption [38,40,41]. The following second and third peaks in Figure 1.5.2
represents an endothermic and exothermic event, respectively. The third, has a skewed shape
that represents overlapping of second and third events that can be analyzed through peak
deconvolution[1,32,37].
In ion-exchange chromatography, the main interaction between biomolecules and the
chromatographic media during adsorption is thought to be the electrostatic interaction.
Therefore, it’s expected a release of energy when two surfaces with opposite charges approach
each other resulting in an exothermic process. However, the electrostatic interaction is not the
only type of interaction during the whole adsorption process. Previous thermodynamic studies
in ion-exchange biomolecules adsorption revealed exothermic events related to electrostatic
interaction and endothermic events related to several other sources: water and ions release
from adsorbent’s and biomolecule’s surfaces; interaction between the molecule surface
hydrophobic groups and adsorbent hydrophilic moieties; repulsive interactions between same
charged groups; biomolecule conformational changes and biomolecule reorientation on the
adsorbent surface [1,32,35].
On the last decades several studies were performed to understand the protein adsorption
mechanisms onto a variety of chromatographic media [2,32,34–36,39–41]. Despite all that,
Figure 1.5.2 - Typical FMC thermogram for linear pDNA adsorption on Q-Sepharose.
28
there’s still a lack of data and understanding of the process of plasmid DNA adsorption onto
chromatographic media. A batch adsorption of pDNA onto some anion-exchange
chromatographic supports study was performed by Ferreira and co-workers (2000). Regardless
good contribution, the data obtained does not account for non-ideal effects neither other
complex working conditions. Later on 2014, Aguilar et al.[1] perform ITC and FMC studies with
linear pDNA onto anion-exchange chromatographic media as well. The FMC results showed that
the overall adsorption process is exothermic, as expected for an anion-exchange interaction.
Also, as the ln pDNA loading increases the net heat of adsorption became more positive leading
to a both endothermic and exothermic enthalpies decrease. As result, each pDNA molecule foot
print on the adsorbent surface may decrease in order to accommodate more molecules, thus
less water molecules and ions need to be removed in the binding process, leading to a decrease
of the endothermic heat signal.
The firsts steps have been made, the next one is to understand the adsorption mechanism of ln
pDNA in other systems and more important the supercoiled isoform of the same pDNA. Despite
being the same molecule, the supercoiled isoform has different features such as size and charge
density. More important, the sc pDNA is the more biologically active and because of that is
most used in therapeutic applications [5,13,26,42].

29
1.6. Goal of Study
As mentioned earlier, plasmid DNA is the base for two promising therapeutic procedures with
an increasing interest. DNA vaccines and gene therapies holds the promise to treat and cure
many acquired or genetic diseases [4,6,9,12]. The well-publicized potential of gene therapy
and DNA vaccines makes enormous the market potential for pDNA [3]. The use of pDNA to treat
diseases requires its production at large scale, with high purity levels and in an economic and
environmentally way, complying with the guidelines from the regulatory agencies. Given the
pDNA unique characteristics, purification is the most challenging step in the production process.
Anion-exchange and hydrophobic interaction chromatography are the techniques of election
regarding the pDNA purification [3,5,13,17,18,26–28]. Nevertheless, the mechanism of pDNA
separation using anion-exchange or hydrophobic interaction chromatography is still not
completely understood. Prediction of separation behavior is generally unreliable and laboratory
scale methods do not have an unaffordable outcome at industrial scale. A better understanding
of the mechanisms underlying the chromatography of biomolecules may help to optimize the
chromatographic methods and consequently assist the design and implementation of scale-up
units. Flow Microcalorimetry (FMC) has proven its ability to provide an improved understanding
of the driving forces, mechanisms and kinetics involved in the interaction process on
biomolecules adsorption onto several chromatographic systems [1,2,32,40,43–45]. Hence, using
Flow Microcalorimetry as a central technique, this study aims to understand and compare the
interaction of ln pDNA between an anion-exchange and a hydrophobic interaction support, and
also the interaction of ln and sc pDNA in an anion-exchange support. Only linear conditions will
be addressed emphasizing the adsorptive process differences in each system. Furthermore,
static binding capacity will be performed to obtain a better understanding of the adsorption
mechanism.

30
31
2. Materials and methods
2.1. Materials
E. coli DH5α strain transformed with the 6.05 kbp plasmid pVAX1-LacZ (Invitrogen, Carlsband,
CA, USA), bearing kanamycin resistance gene was obtained from CICS – Health Sciences
Research Centre, University of Beira Interior (Covilhã, Portugal). Toyopearl GigaCap Q 650-M
was kindly offered by Tosoh bioscience (Toquio, Japan). CIM® DEAE-0.34 disk-shaped monolith
was kindly offered by Professor Ales Podgornik. Phenyl Sepharose 6 Fast Flow hydrophobic
interaction resin and Q-sepharose Fast Flow anion exchanger was obtained from GE Healthcare
(Uppsala, Sweden). CIMac™ DEAE-0.1 Analytical Column was obtained by BIA Separations
(Ajdovščina, Slovenia). QIAGEN Plasmid Maxi Kit was obtained from Qiagen (Hilden, Germany).
Hind III restriction enzyme was obtained from NZYTech (Lisbon, Portugal). All used reagents
were of analytical grade, Sigma-Aldrich (Sigma-Aldrich, Madrid, Spain).
2.2. Apparatus and Software
Supercoiled plasmid DNA isoform purification was achieved in ÄKTA Pure system from GE
Healthcare (Uppsala, Sweden). Data was collected and analyzed by UNICORN software from GE
Healthcare (Uppsala, Sweden).
Plasmid DNA mass was quantified with xMarK TM Microplate spectrophotometer from Bio-rad
Life Science Research (California, USA).
Thermodynamic studies were performed using a Flow Microcalorimeter FMC 4 Vi from Microscal
Ltd (London, UK). Data was collected and analyzed with CALDOS4 software from Microscal Ltd
(London, UK). Further analysis was done through peak deconvolution using PEAKFIT software
package (version 4.12, Seasolve Software Inc., San Jose, USA).
2.3. Plasmid DNA Production
2.3.1. Fermentation
E. coli DH5α cells containing pVAX1-LacZ plasmid were cultivated overnight on solid agar LB
medium (Conda Laboratories, Spain) containing 30 μg/mL of kanamycin. Cell colonies grown on
the solid medium were collected and inoculated on liquid Terrific Broth (TB) medium (12 g/L
tryptone, 24 g/L yeast extract, 4 mL/L glycerol, 0.017 M KH2PO4, 0.072 M K2HPO4) supplemented

32
with 30 μg/mL of kanamycin, for pre-fermentation. That occurred in 500 mL Erlenmeyers,
containing 125 mL of medium, incubated in an orbital shaker at 37 ºC, 250 rpm, until OD600 ≈
2.5 was reached. For the fermentation, a fresh batch of liquid TB medium (250 mL in a 1000
mL Erlenmeyer) was inoculated from the pre-fermentation in order to obtain an initial OD600 =
0.2. Fermentation was carried out at 37 ºC and 250 rpm, until OD600 ≥ 6 was reached.
2.3.2. Recovery
The E. coli DH5α cells containing pVAX1-LacZ plasmid were recovered by centrifugation at 4
°C, 5000 G for approximately 8 min and stored in 50 mL falcon tubes at -20°C until posterior
utilization.
Plasmids (pVAX1-LacZ) were recovered from cells using QIAGEN® Plasmid Maxi Kit according to
the manufacturer’s instructions resumed in Table 2.3.1.
Table 2.3.1 - Recovery of pDNA using QIAGEN® Plasmid Maxi Kit.
Alkaline Lysis
Bacterial pellet (250 mL of cells) was re-suspended in 20 mL of 50 mM
Tris-HCl, 10 mM EDTA, 100 μg/mL RNase A, pH 8.0
Cell lysis was performed by adding 10 mL of 200 mM NaOH, 1% SDS (w/v)
After 5 min of incubation at room temperature, add 10 mL of pre-chilled
3 M potassium acetate, pH 5.5 to precipitate genomic DNA, proteins, and
cell debris
Centrifuge twice at ≥ 20000 g for 30 min at 4 ºC, reserving the
supernatant which contains pDNA
pDNA Binding
Equilibrate the QIAGEN-tip by applying 10 mL of 750 mM NaCl, 50 mM
MOPS pH 7.0, 15% isopropanol (v/v), 0.15% Triton X-100 (v/v)
Apply the supernatant from alkaline lysis, allowing the pDNA to bind to
the support.
Washing
Wash the QIAGEN-tip by applying 60 mL of 1 M NaCl, 50 mM MOPS pH 7.0,
15% isopropanol (v/v), allowing the removal of contaminants that
remained bound in the support
Elution Elute the pDNA by applying 15 mL of 1.25 M NaCl, 50 mM Tris-HCl pH 8.5,
15% isopropanol (v/v)
Precipitation
Precipitate the pDNA by adding 0.7 volumes of isopropanol to the eluted
pDNA
Centrifuge at ≥ 15000 g for 30 min at 4 ºC and recover the pellet
Re-dissolve the pDNA pellet in a suitable volume of buffer (e.g. 1
mL of 10 mM Tris-HCl, pH 8.0)
33
2.3.3. Plasmid DNA quantification
Plasmid DNA concentrations were assessed by absorbance measurements (UV, 260 nm) with a
microplate spectrophotometer. All measurements were performed in triplicates.
2.3.4. Plasmid Isoform Separation
In order to obtain linear plasmid DNA (ln pDNA) an enzymatic digestion was performed. To
facilitate the pDNA digestion process, samples were previously left overnight at ambient
temperature to allow the conversion of sc pDNA into its oc conformation. Then, linear pDNA
conformation was obtained by cleavage of the oc pDNA with the restriction endonuclease Hind
III according to manufacturer’s instructions (incubation at 37 ºC during approximately 2 hours
adding the adequate buffers). Hind III enzyme was removed from pDNA samples after the
digestion through centrifugation, using 100 kDa membrane concentrators (1400 G at 4 ºC). For
storage and as a carrier fluid the buffer used was 10 mM Tris-HCl, pH 8.0.
2.3.5. Agarose Gel Electrophoresis
Isolated pDNA was analyzed by horizontal electrophoresis (120 V, 40 min) using 0.8 % agarose
gel in TAE buffer (40 mM Tris, 20 mM Acetic Acid, 1 mM EDTA, pH 8.0) and 0.6 μL of GreenSafe
as a nucleic acid stain. Gels were pictured in UVITEC Cambridge system (UVITEC Limited,
Cambridge, UK).
2.4. Plasmid DNA Purification
Regarding the supercoiled isoform, after the recovery with the QIAGEN® Plasmid Maxi Kit the
samples were purified by fast performance liquid chromatography (FPLC).
2.4.1. sc pDNA purification with Toyopearl GigaCap Q 650-M
A XK16 empty chromatographic column (GE Healthcare, Uppsala, Sweden) was packed with 3
mL of Toyopearl GigaCap Q 650-M and experiments were performed in ÄKTA Pure system.
Before each assay, the system was equilibrated with at least 5 column volumes of 760 mM NaCl,
10 mM Tris pH 8.0 at a constant flow rate of 3 mL/min. After equilibrating the column with the
working buffer, a 500 μL pDNA sample (prepared with the same buffer conditions) was injected
onto the column. The elution of bound species was carried out with a 5 column volumes
stepwise gradient from 760 mM to 900 mM NaCl. The chromatographic data was collected and
analyzed by UNICORN 6.1 software. After each run, the column was washed with 3 column
volumes of water followed by 5 column volumes of 0.5 M NaOH, at least 10 column volumes of
water, and then equilibrated with the working conditions for the next run.
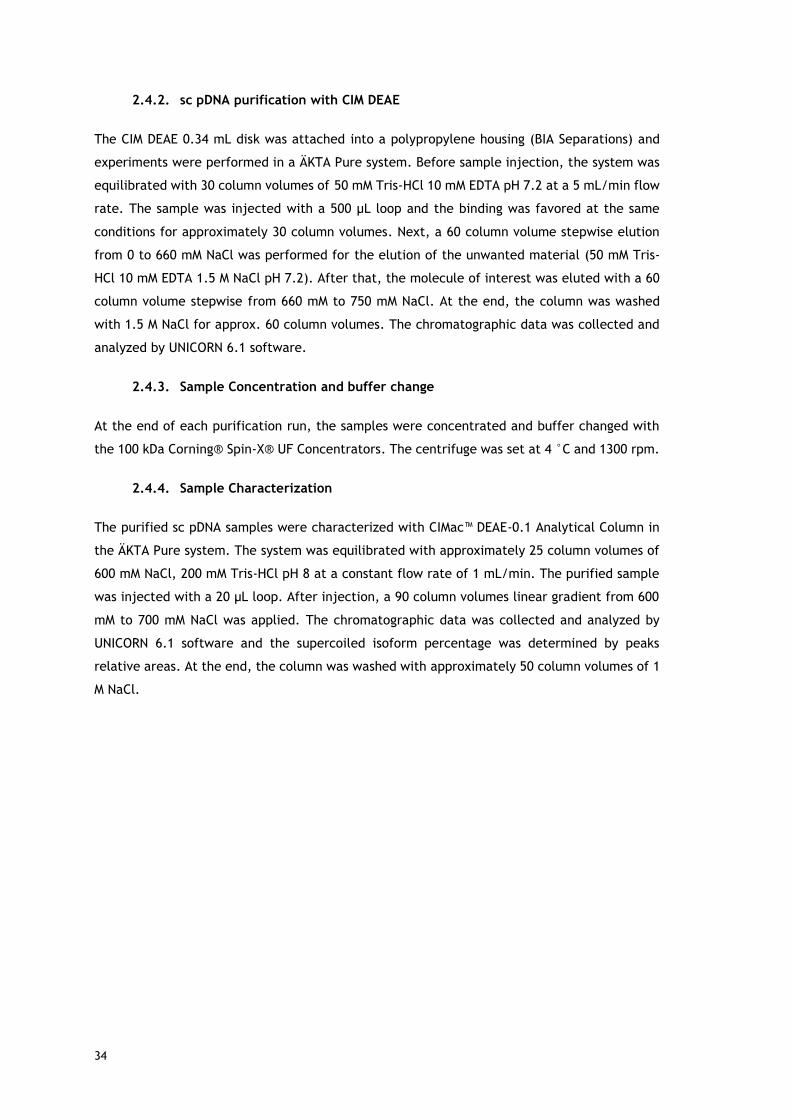
34
2.4.2. sc pDNA purification with CIM DEAE
The CIM DEAE 0.34 mL disk was attached into a polypropylene housing (BIA Separations) and
experiments were performed in a ÄKTA Pure system. Before sample injection, the system was
equilibrated with 30 column volumes of 50 mM Tris-HCl 10 mM EDTA pH 7.2 at a 5 mL/min flow
rate. The sample was injected with a 500 µL loop and the binding was favored at the same
conditions for approximately 30 column volumes. Next, a 60 column volume stepwise elution
from 0 to 660 mM NaCl was performed for the elution of the unwanted material (50 mM Tris-
HCl 10 mM EDTA 1.5 M NaCl pH 7.2). After that, the molecule of interest was eluted with a 60
column volume stepwise from 660 mM to 750 mM NaCl. At the end, the column was washed
with 1.5 M NaCl for approx. 60 column volumes. The chromatographic data was collected and
analyzed by UNICORN 6.1 software.
2.4.3. Sample Concentration and buffer change
At the end of each purification run, the samples were concentrated and buffer changed with
the 100 kDa Corning® Spin-X® UF Concentrators. The centrifuge was set at 4 °C and 1300 rpm.
2.4.4. Sample Characterization
The purified sc pDNA samples were characterized with CIMac™ DEAE-0.1 Analytical Column in
the ÄKTA Pure system. The system was equilibrated with approximately 25 column volumes of
600 mM NaCl, 200 mM Tris-HCl pH 8 at a constant flow rate of 1 mL/min. The purified sample
was injected with a 20 µL loop. After injection, a 90 column volumes linear gradient from 600
mM to 700 mM NaCl was applied. The chromatographic data was collected and analyzed by
UNICORN 6.1 software and the supercoiled isoform percentage was determined by peaks
relative areas. At the end, the column was washed with approximately 50 column volumes of 1
M NaCl.

35
2.5. Flow Microcalorimetry (FMC)
Thermodynamic studies were performed in the Flow Microcalorimeter (FMC). FMC column was
packed with approximately 171µL Q-sepharose Fast Flow and/or Phenyl Sepharose, which after
the swelling process filled the 171 μL of the FMC cell. The swelling process was conducted by
passing the equilibration buffer through the cell at a constant flow rate of 1.5 mL/h for at least
12 h. The equilibration buffer was 10 mM Tris-HCl (pH 8.0).
Calibration curve was constructed measuring the heat of 5 different energy impulses generated
by a specific outlet (calibrator) in the packed cell: 0.3 mJ (3 μW for 100 s), 1 mJ (10 μW for
100 s), 3 mJ (30 μW for 100 s), 7.5 mJ (30 μW for 250 s) and 15 mJ (30 μW for 500 s). All the
measurements were performed in triplicates. Considering this range of energy, the relation
between the energy impulse and the resulting heat (peak area) was linear for both resins. These
experiments also allow to determine the calibration factor of the packed system. This factor
will be later used to convert cell temperature changes in heat signals.
To study the adsorption of ln pDNA (pVAX1-LacZ) onto Phenyl Sepharose and sc pDNA onto Q-
sepharose Fast Flow, first the system was packed as explained above and, after the thermal
equilibrium was reached, a sample of pDNA prepared in 10 mM Tris pH 8.0 was loaded into a
configurable injection loop (of 30, 229 or 429 µL) and then injected into the cell through
switching a multiport valve, using a constant flow rate of 1.5 mL/h. The adsorption process of
the sample into the adsorbent surface causes a temperature change in the cell, which through
the calibration factor is converted to a heat signal by the FMC. CALDOS 4 software was used to
acquire, store, process and present all the FMC data. In order to know the adsorbed quantity
of pDNA a mass balance was calculated subtracting the concentration of the collected effluent
to the concentration of the injected sample. Those concentrations were assessed by measuring
at 260 nm the absorbance in the UV microplate spectrophotometer. Between injections, it was
used 0.5 M NaOH as a washing solution and the system was re-equilibrated with 10 mM Tris pH
8.0 (G.E. Healthcare, 2007).

36
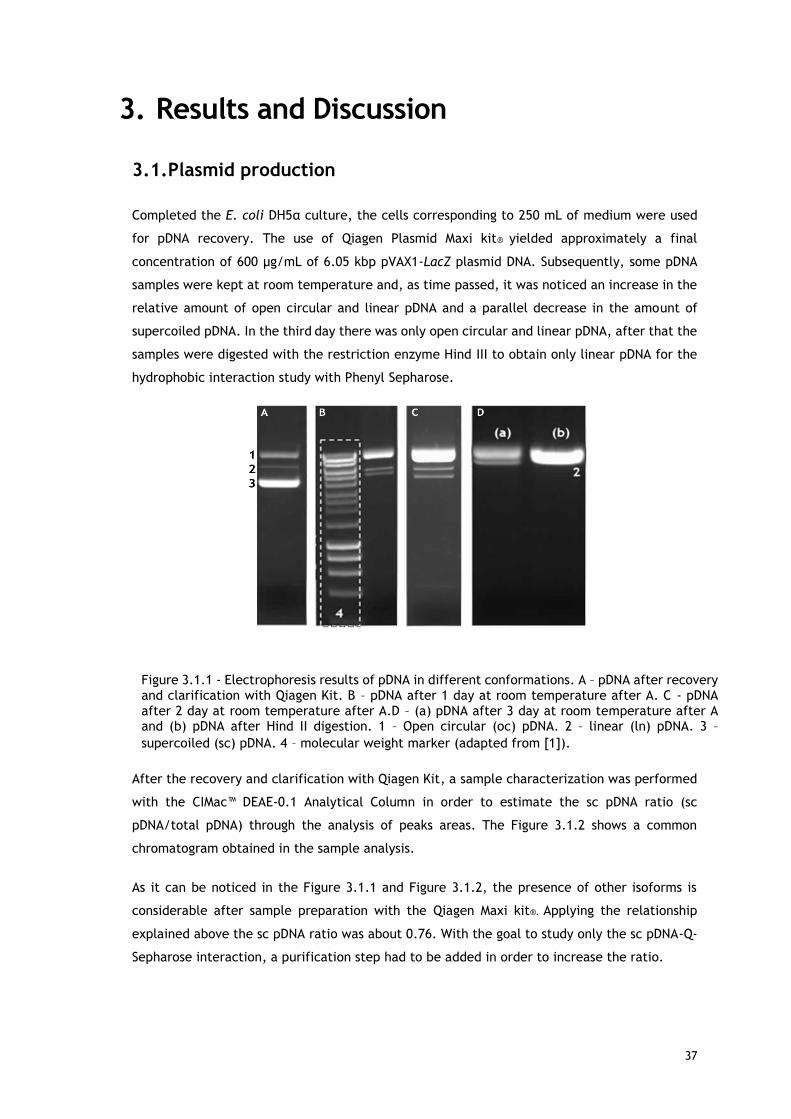
37
3. Results and Discussion
3.1. Plasmid production
Completed the E. coli DH5α culture, the cells corresponding to 250 mL of medium were used
for pDNA recovery. The use of Qiagen Plasmid Maxi kit® yielded approximately a final
concentration of 600 μg/mL of 6.05 kbp pVAX1-LacZ plasmid DNA. Subsequently, some pDNA
samples were kept at room temperature and, as time passed, it was noticed an increase in the
relative amount of open circular and linear pDNA and a parallel decrease in the amount of
supercoiled pDNA. In the third day there was only open circular and linear pDNA, after that the
samples were digested with the restriction enzyme Hind III to obtain only linear pDNA for the
hydrophobic interaction study with Phenyl Sepharose.
After the recovery and clarification with Qiagen Kit, a sample characterization was performed
with the CIMac™ DEAE-0.1 Analytical Column in order to estimate the sc pDNA ratio (sc
pDNA/total pDNA) through the analysis of peaks areas. The Figure 3.1.2 shows a common
chromatogram obtained in the sample analysis.
As it can be noticed in the Figure 3.1.1 and Figure 3.1.2, the presence of other isoforms is
considerable after sample preparation with the Qiagen Maxi kit®. Applying the relationship
explained above the sc pDNA ratio was about 0.76. With the goal to study only the sc pDNA-Q-
Sepharose interaction, a purification step had to be added in order to increase the ratio.
Figure 3.1.1 - Electrophoresis results of pDNA in different conformations. A – pDNA after recovery and clarification with Qiagen Kit. B – pDNA after 1 day at room temperature after A. C - pDNA after 2 day at room temperature after A.D – (a) pDNA after 3 day at room temperature after A and (b) pDNA after Hind II digestion. 1 – Open circular (oc) pDNA. 2 – linear (ln) pDNA. 3 –
supercoiled (sc) pDNA. 4 – molecular weight marker (adapted from [1]).
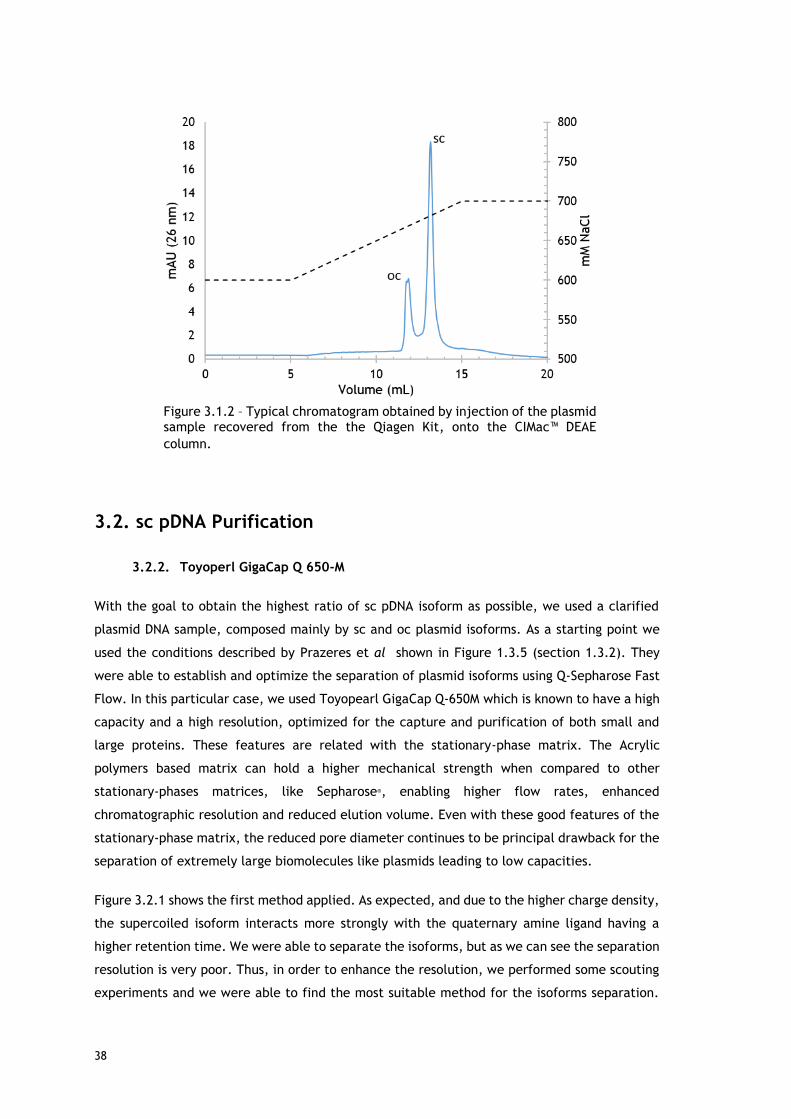
38
3.2. sc pDNA Purification
3.2.2. Toyoperl GigaCap Q 650-M
With the goal to obtain the highest ratio of sc pDNA isoform as possible, we used a clarified
plasmid DNA sample, composed mainly by sc and oc plasmid isoforms. As a starting point we
used the conditions described by Prazeres et al shown in Figure 1.3.5 (section 1.3.2). They
were able to establish and optimize the separation of plasmid isoforms using Q-Sepharose Fast
Flow. In this particular case, we used Toyopearl GigaCap Q-650M which is known to have a high
capacity and a high resolution, optimized for the capture and purification of both small and
large proteins. These features are related with the stationary-phase matrix. The Acrylic
polymers based matrix can hold a higher mechanical strength when compared to other
stationary-phases matrices, like Sepharose®, enabling higher flow rates, enhanced
chromatographic resolution and reduced elution volume. Even with these good features of the
stationary-phase matrix, the reduced pore diameter continues to be principal drawback for the
separation of extremely large biomolecules like plasmids leading to low capacities.
Figure 3.2.1 shows the first method applied. As expected, and due to the higher charge density,
the supercoiled isoform interacts more strongly with the quaternary amine ligand having a
higher retention time. We were able to separate the isoforms, but as we can see the separation
resolution is very poor. Thus, in order to enhance the resolution, we performed some scouting
experiments and we were able to find the most suitable method for the isoforms separation.
Figure 3.1.2 – Typical chromatogram obtained by injection of the plasmid sample recovered from the the Qiagen Kit, onto the CIMac™ DEAE
column.

39
Figure 3.2.2 shows the optimized separation method for the Toyoperl GigaCap Q 650-M resin.
A relatively high salt concentration is used to avoid the unnecessary adsorption of undesired
species (oc pDNA), so the capacity can be fully exploited for the sc pDNA adsorption [18].
Different plasmid loadings were tested in an attempt to maximize column productivity and as
shown in Figure 3.2.2 -Tipycal chromatographic profiles of the plasmid isoform separation from
a clarified pDNA sample (sc + oc) in the Toyoperl GigaCap Q 650-M column. it was verified that
the established method was very reproducible. Consistent results were obtained in terms of
yield, purity, quality and elution profiles. We obtained a sc pDNA yield average of 26±5%, with
a purity average of 91±3% using a loading average of 22.13±1.10 µg pDNA/ mL gel.
Apparently, we were able to increase the sc pDNA ratio. DNAs are known to bind to anion
exchange chromatography stationary phase quite strongly. The pDNA increased binding sites
value and the high charge density from the supercoiled isoforms can also favor the selectivity
[24,27,28,30,46]. Nevertheless, the very low yield make this process not recommended.
Prazeres et al.[18] obtained higher yields (approximately 50%) using Q-Sepharose, but the pDNA
size, which was 2 times lower, also have to be considered. As mentioned above, Toyoperl
GigaCap Q 650-M is a resin designed for small and large proteins and even largest proteins (like
BSA) are considered small when compared to plasmids. Hence, the large plasmid adsorption
footprint and the reduced resin pore diameter are the principal causes for the resin capacity
substantial decrease resulting in the poor yield.
Figure 3.2.1 - Chromatographic profile of the plasmid isoform separation from a clarified pDNA sample (sc + oc) in the Toyoperl GigaCap Q 650-M column. The Elution method was based in the separation method suggested by Prazeres et
al.[18]

40
3.2.3. CIM DEAE
With the same purpose, enhance the sc pDNA ratio, and using the same sample characteristics
the CIM® DEAE-0.34 Disk was tested. The CIM® DEAE-0.34 is a shallow, disk-shaped monolith
suitable for initial screening and method development. DEAE (diethylamine) is a weak type of
anion exchange group, fully charged between pH 3-9. The DEAE versatile chemistry has proven
to be excellent for any kind of pDNA purification. The poly(methacrylate) matrix forms network
channels big enough to fit extremely large biomolecules like plasmid DNA allowing a high-
binding capacity. In addition, high productivity can be attained using high flow rates with a
considerable small pressure drop. Considering this features the yield problem should be fixed.
The separation was carried out according to the method suggested by BIA Separations for the
purification of large plasmids from E. coli. After small alterations a good separation with a high
resolution was attained as shows the Figure 3.2.3. Applying this method, we obtained yield
average of 84±5%, and a purity average of 95±2% of sc pDNA using a loading average of
558.82±45.35 µg pDNA/ mL gel.
Once again our main goal was ensured. As a matter of fact, we obtained higher sc pDNA ratio.
Comparing the yield results with the ones obtained with Toyopearl GigaCap Q-650M it can be
noticed that with the monolith we have a notorious improvement. These large yield is easily
explained by the higher capacity, a consequence of the monolith open structure. Moreover, the
monolith convective based transport facilitates the separation of large molecules with low
Figure 3.2.2 -Tipycal chromatographic profiles of the plasmid isoform separation from a clarified pDNA sample (sc + oc) in the Toyoperl GigaCap Q
650-M column. Different colors mean different injection concentrations.

41
diffusivities, like polynucleotides. Considering these results, the purification with the
monolithic column was our technique of election.
3.3. Static Binding Capacity
Adsorption behavior under linear and overloaded conditions was studied for ln pDNA adsorption
onto a hydrophobic interaction support. As we stated before in section 1.4.1, adsorption
equilibria are frequently measured by suspending the resin in biomolecule solution and allowing
the sufficient time for equilibrium to be attained. This process cannot be performed with more
labile molecules such as sc pDNA. In addition, determine the binding capacity at low
concentration is often difficult since the time needed to achieve the equilibrium can become
very long.
The adsorption isotherm obtained with Phenyl Sepharose is shown in Figure 3.1.1 along with
results for the anion-exchange support Q-Sepharose (data already presented in a previous study
[1], included here just for comparison). ). In both curves, the surface ln pDNA concentration
(qpDNA) increases linearly from zero to a plateau region as the ln pDNA equilibrium liquid
concentration (CpDNA) increases. Before, Aguilar et al. [1] showed that the Q-Sepharose Fast
Flow isotherm shape fits the Langmuir model. For Phenyl Sepharose, this model is only obeyed
for ln pDNA equilibrium concentrations lower than approximately 55 µg.mL-1. At higher
concentrations, the plateau is followed by a region of rapidly increase in the capacity. Previous
authors already discussed this second upturn when proteins were used as adsorbate, and
postulated that the increase beyond the plateau was due to re-orientation or conformational
alterations of the adsorbed molecules, rather than due to bi-layer formation [43,44]. This
Figure 3.2.3 - Chromatographic profile of the plasmid isoform separation from a
clarified pDNA sample (sc + oc) in the with the CIM® DEAE-0.34 Disk.

42
explanation appears to be as well valid for the present case once it is not expected pDNA-on-
pDNA adsorption at the studied pH, due to the known biomolecule negative net charge under
the considered conditions [30].
In order to accomplish a more direct comparison between the two isotherms, the Langmuir
model was also applied to the Phenyl Sepharose isotherm (equilibrium concentrations lower
than 55 µg.mL-1). Fitted parameters, association constant (KA) and maximum binding capacity
(qmax), were respectively 0.15 ±0.02 mL.µg-1 and 2241 ± 20.03 µg.g-1 gel. These results are
very different from the ones previously obtained with Q-Sepharose (KA= 0.31±0.02 mL.µg-1 and
qmax= 6496±30.00 µg.g-1 gel) which show higher affinity and capacity. The observed differences
are explained by the support ligand used for the interaction and the structure of the ln pDNA
molecule itself. DNA strands have negatively charged edges surrounding a more hydrophobic
interior [47] and at the used working pH the biomolecule presents a negative net charge. These
two factors may hinder the interaction between the ln pDNA hydrophobic zones and phenyl
ligands on the support [47], and may also structure the biomolecule interaction with the ligands
due to aromatic π-interactions, explaining the lower affinity and capacity of Phenyl Sepharose.
Regarding the adsorption of sc pDNA onto Q-Sepharose, we were not able to produce an
experimental isotherm to apply the Langmuir Model. Nevertheless, we can forecast a maximum
binding capacity theoretic value. Using a simple model, like Aguilar et al. [1] and Tarmann et
al. [24], we assumed a simple rod shape for the sc pDNA that assumes an upright orientation
Figure 3.3.1 - Equilibrium binding isotherms for linear plasmid DNA adsorption onto hydrophobic interaction (10 mM Tris HCl with 1.8M (NH4)2SO4 pH 8) and ion exchange (10 mM Tris-HCl pH 8) resins
at 25 ºC. (●) Phenyl Sepharose 6 Fast Flow, () Q-Sepharose Fast Flow [1].

43
during adsorption. The theoretic maximum adsorption capacity can be obtained from the
equation [1]:
𝑞𝑚 =𝐴𝑚
𝑁𝜎
where Am is the support surface area, N is the Avogadro number and σ is the effective area of
gel surface covered by a molecule of pDNA. Once Q-sepharose Fast flow can be assumed as
nonporous media for pDNA [24], the maximum adsorption capacity has been predicted
considering only the support external surface area, which was roughly estimated [22] using
support particle diameter (90 µm) and extraparticle porosity (0.38 [48]). We obtained a 0.041
m2 mL-1 for the external area per volume of packed bed. The effective area of gel surface
covered by a molecule of pDNA can be estimated considering that the plasmid branched shape,
with have 41% of the linear plasmid length [1,19] and a radius of 50 nm. As result, we assumed
a rod with the equivalent dimension of 100 nm x 843 nm. The theoretical binding capacity of
248 µg.g-1 gel were calculated. This estimation is much smaller than the value obtained with
the linear isoform. This may be explained by the fact that the supercoiled isoform has a higher
repulsion between adsorbed molecules or higher footprint.
3.4. Flow Microcalorimetry
FMC experiments were performed in order to have more information about the events and the
driving forces present during the interaction of ln pDNA with the Phenyl-Sepharose support and
sc pDNA with the Q-Sepharose support. The magnitude and chronology of the thermal events
may further elucidate the interaction mechanism, as previously demonstrated for other
chromatographic systems [1,2,32,39]. As in Aguilar et al. [1] work, in the present study,
experiments were run using different loops (30, 230 and 430 µL). Considering the 171 μL of the
FMC cell, the use of the 30 μL loop means that the sample is introduced into the column as a
pulse because it has 0.2 times the cell volume and the use of the 229 μL loop fulfils the FMC
cell, representing 1.3 times of the cell volume. On the other hand, the use of the 429 μL loop
we fill the cell 2.5 times, leading to a continuous feed of the biomolecule into the column,
resembling the frontal analysis in chromatographic systems [22]. All experiments were
performed on the isotherm linear zone.
Aguilar et al. [1] work results used for comparison with this present work are available in the
appendix.

44
3.4.1. ln pDNA adsorption onto Phenyl Sepharose
Figure 3.4.2 and Figure 3.4.1 illustrate examples of thermograms obtained with the 230 and
430 μL injection loops respectively. In each thermogram, different signals resulted from
different loading concentrations. Considering the same loop, it can be noticed that the peak
profile is maintained as the injection concentration changes
All thermograms obtained using Phenyl Sepharose are comprised with an initial small
endothermic peak, followed by an exothermic one or two when using 430 uL loop, and ends
with an endothermic signal. To note that, for approximately the same surface concentration
the second exothermic peak is only visible when the larger loop is used (Figure 3.4.2 and Figure
3.4.1). To be as well highlighted is the presence of the second endothermic signal; this was not
present in the thermograms concerning the pDNA absorption onto the Q-Sepharose support [1].
Figure 3.4.2 - Thermograms of ln pDNA adsorption onto Phenyl sepharose using the 430 μL loop. Black 117.67 µg pDNA/g Phenyl Sepharose; Green 363.42 µg pDNA/g Phenyl Sepharose; Orange 614.70 µg pDNA/g Phenyl-Sepharose. Vertical dashed line represents the time where the pDNA solution plug is replaced with
pDNA-free mobile phase around 2100 seconds.
Figure 3.4.1 - Thermograms of ln pDNA adsorption onto Phenyl-sepharose using the 230 μL loop. Black 124.97 µg pDNA/g Phenyl Sepharose; Red 171.75 µg pDNA/g Phenyl Sepharose; Blue 413.18 µg pDNA/g Phenyl Sepharose. Vertical dashed line represents the time where the pDNA solution plug is replaced with
pDNA-free mobile phase around 1650 seconds.
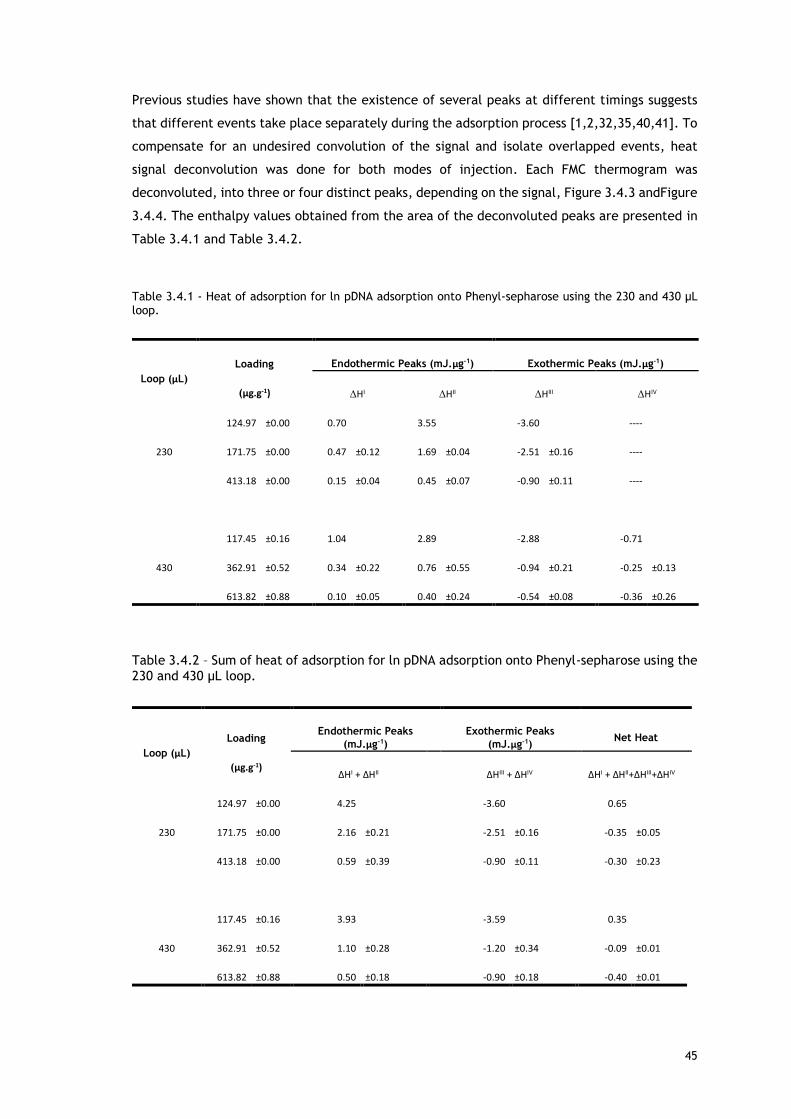
45
Previous studies have shown that the existence of several peaks at different timings suggests
that different events take place separately during the adsorption process [1,2,32,35,40,41]. To
compensate for an undesired convolution of the signal and isolate overlapped events, heat
signal deconvolution was done for both modes of injection. Each FMC thermogram was
deconvoluted, into three or four distinct peaks, depending on the signal, Figure 3.4.3 andFigure
3.4.4. The enthalpy values obtained from the area of the deconvoluted peaks are presented in
Table 3.4.1 and Table 3.4.2.
Table 3.4.1 - Heat of adsorption for ln pDNA adsorption onto Phenyl-sepharose using the 230 and 430 μL loop.
Table 3.4.2 – Sum of heat of adsorption for ln pDNA adsorption onto Phenyl-sepharose using the
230 and 430 μL loop.
Loop (µL)
Loading
(µg.g-1)
Endothermic Peaks (mJ.µg-1) Exothermic Peaks (mJ.µg-1)
ΔHI ΔHII ΔHIII ΔHIV
230
124.97 ±0.00 0.70 3.55 -3.60 ----
171.75 ±0.00 0.47 ±0.12 1.69 ±0.04 -2.51 ±0.16 ----
413.18 ±0.00 0.15 ±0.04 0.45 ±0.07 -0.90 ±0.11 ----
430
117.45 ±0.16 1.04 2.89 -2.88 -0.71
362.91 ±0.52 0.34 ±0.22 0.76 ±0.55 -0.94 ±0.21 -0.25 ±0.13
613.82 ±0.88 0.10 ±0.05 0.40 ±0.24 -0.54 ±0.08 -0.36 ±0.26
Loop (µL)
Loading
(µg.g-1)
Endothermic Peaks
(mJ.µg-1)
Exothermic Peaks
(mJ.µg-1) Net Heat
ΔHI + ΔHII ΔHIII + ΔHIV ΔHI + ΔHII+ΔHIII+ΔHIV
230
124.97 ±0.00 4.25 -3.60 0.65
171.75 ±0.00 2.16 ±0.21 -2.51 ±0.16 -0.35 ±0.05
413.18 ±0.00 0.59 ±0.39 -0.90 ±0.11 -0.30 ±0.23
430
117.45 ±0.16 3.93 -3.59 0.35
362.91 ±0.52 1.10 ±0.28 -1.20 ±0.34 -0.09 ±0.01
613.82 ±0.88 0.50 ±0.18 -0.90 ±0.18 -0.40 ±0.01

46
A
C
B
Figure 3.4.3 - PEAKFIT de-convolution of 230 µL loop thermograms for loading concentrations of A – 124.97 µg pDNA/g Phenyl Sepharose; B 171.85 µg pDNA/g Penyl Sepharose; C – 413.18 µg pDNA/g Phenyl Sepharose. Curves shown are for experimental data. Total peak fit (black line (–)) and peaks resulting from deconvolution (blue and red lines (...))Vertical dashed line represents the time where the pDNA solution plug
is replaced with pDNA-free mobile phase around 1650 seconds.

47
A
C
B
Figure 3.4.4 - PEAKFIT de-convolution of 430 µL loop thermograms for loading concentrations of A – 117.45 µg pDNA/g Phenyl Sepharose; B - 362.91 µg pDNA/g Penyl Sepharose; C – 613.82 µg pDNA/g Phenyl Sepharose. Curves shown are for experimental data. Total peak fit (black line (–)) and peaks resulting from deconvolution (blue and red lines (...)). Vertical dashed line represents the time where the pDNA solution plug
is replaced with pDNA-free mobile phase (Grey – 230 µL loop and Black – 430 µL loop).
48
For the thermograms analysis, and considering previous studies [1], it is worth doing it in view
of the sub processes defined by Chen et al. [35,49,50]. According to them, the binding process
of biomolecules at a liquid-solid interface can be divided into several sub processes, these
include: (1) Dehydration or removal of ions from the biomolecule surface (endothermic
process); (2) Dehydration or removal of ions from the sorbent surface (endothermic process);
(3) Interactions between the biomolecule and the sorbent (exothermic process); (4) Structural
rearrangement of the biomolecule upon adsorption (endothermic process); and (5) Solvation
and hydration process of the bound biomolecules and rearrangement of the excluded water
molecules or ions in the bulk solution (endothermic process) [35,49]. Previous calorimetric
studies have supported the existence of these sub processes. It has been shown that exothermic
peaks are mostly a result of attractive biomolecule-sorbent interactions and attractive lateral
interactions of already adsorbed biomolecules [1,2,32,35,45]. On the other hand, endothermic
peaks have been related to different events, such as water molecules and ions release from the
surface of the adsorbent and of the biomolecule [35], repulsive interactions [2,51],
conformational changes and molecule reorientation on the surface [2,32,51].
Taking into account the above-described assumptions, the first endothermic event, obtained
with both injection modes (Figure 3.4.3 and Figure 3.4.4), can result from one or more of the
sub processes (1), (2), (4), (5). At approximately 700 seconds, ln pDNA molecules reach the
sorbent, but before the adsorption itself, the water molecules and ions have to be partially
excluded to decrease the distance between the pDNA and the sorbent [2,35,43]. Given that,
we were taken to believe that the first endothermic peak comprises mainly a combination of
the sub processes (1) and (2) regarding desolvation. A great contribution from dehydration is
expected once we are working with a mobile phase (1.8 M ammonium sulfate) that favors
hydrophobic effect. This dehydration endothermic event was already observed by other authors
[1,2,32,35,43]. Besides, the first endothermic peak enthalpy decreases with the increase in
loading concentration Table 3.4.1. Dias-Cabral and co-workers [43] suggested that the
destabilization of organized water molecules around the ligand and the disruption of the water-
surface structure by the initial biomolecule adsorption may reduce energetic requirements for
the next dehydration process accompanying subsequent biomolecule adsorption. Finally,
compared with the anion exchange support (Figure 3.4.5) the first endothermic signal obtained
in presence of Phenyl Sepharose is characteristically smaller. This is to be expected, due to the
lower energetic requirement for surface (of biomolecule and adsorbent) dehydration. The use
of a high concentration of an kosmotropic salt encourage dehydration of the biomolecule and
adsorbent surfaces, reducing its energy requirements [2].

49
The first exothermic peak (Figure 3.4.3 A) may be related to the heat release caused by the
short-range interactions between the ln pDNA and the Phenyl Sepharose ligands (sub process
3). It is important to note that the molecules that already went through the dehydration process
start to adsorb whilst the other molecules and sorbent groups are still under the dehydration
process. At the beginning, the number of molecules passing through the dehydration process is
much higher than the number of molecules interacting with the support leading to the
observation of an endothermic peak followed by an exothermic peak. However, according to
the deconvolution Figure 3.4.3, the events that cause the first endothermic and exothermic
peaks start at the same time. Interestingly, the endothermic peak disappears as the exothermic
peak reaches its maximum. This does not mean that the dehydration process stopped, because
there are still more molecules entering the FMC cell. Therefore, the energy released from the
ln pDNA-solid phase interaction has to be much higher than the energy consumed during the
dehydration process. Considering the 430 µL loop injections (Figure 3.4.4), we believe that, the
first exothermic peak present is also a result of the interplay between sub processes (1), (2)
and (3), but with a greater contribution from biomolecule support interactions.
The short-range attractive interactions that are involved in the exothermic signal, at first sight,
are expected to result mainly from van der Waals interactions between the phenyl ligand and
ln pDNA hydrophobic zones. In hydrophobic interaction chromatography, the ln pDNA-stationary
phase (or support ligand) distance has to be relatively small in order to reduce hydrophobic
zones exposure to water [35]. Due to the fact that hydrophobic effect can only be observed
owing to the interaction of non-polar patches (hydrophobic zones), the only interactions
possible to be established between this zones are the van der Waals ones. In addition, the
global adsorption process is expected to be accompanied by large entropy gains that
compensate for the enthalpically unfavorable dehydration. Even so, our results are in
contradiction with these expectations, overall heat of adsorption is mainly exothermic (Table
3.4.2) and the exothermic enthalpies obtained by the adsorption of ln pDNA onto Q-Sepharose
Figure 3.4.5 - Endothermic heats of ln pDNA adsorption onto (●) Phenyl Sepharose
(♦) Q-Sepharose [1].

50
(Figure 3.4.6) are similar to the ones obtained for the present system. Attractive electrostatic
forces between the biomolecule and the charged resin Q-Sepharose are anticipated to generate
a larger heat release compared to the short range van der Waals interactions observed between
Phenyl Sepharose and ln pDNA hydrophobic zones. Thus, other factors seem to be significantly
influencing adsorption. More precisely, anion – interactions may be contributing to the
observed exothermic signal [52]. This controversial interaction, intuitively assumed as
repulsion, turned from controversial to a well-established noncovalent interaction over the past
quarter of a century [52]. A large number of studies revealed that the interactions of anions
with -systems relies mainly on two effects – the electrostatic attraction and the ion-induced
polarization [52,53]. Thus, the observed high exothermic heats may be justified by the
existence of an attractive electrostatic interaction between pDNA anions and the electron-
deficient arenes present in support ligands. This type of interaction is more consistent with the
high exothermic enthalpies observed in presence of the Phenyl ligand.
Regarding the 430 µL loop, the thermograms present a second exothermic peak. This profile
also happens in the adsorption of ln pDNA onto Q-Sepharose under the same conditions [1].
Moreover, the peaks have the same timing. We suspect a similar event generate these peaks.
Under the continuous injection mode (430 µL loop) the ln pDNA-support interaction have an
extended contact time. Thus, despite the repulsion between the already adsorbed ln pDNA
molecules and the ones in the feed solution, this interaction promotes the reorientation and
subsequent secondary adsorption of already bound biomolecules. This will create free space
for adsorption of ln pDNA in solution. As reported by Aguilar et al. [1], this is further supported,
by comparing the thermograms obtained using the 229 µL and 429 µL loops. Considering the
429 µL heat signal and observing it until the 229 µL loop pDNA plug ends (Figure 3.4.4 A) we
can see that the peak profile is similar to the one obtained with the 229 µL loop (Figure 3.4.3
A). After that, the adsorption enters in the volume overloading and the heat signal magnitude
increases due to the up mentioned mechanism.
Figure 3.4.6 - Exothermic heats of ln pDNA adsorption onto (●) Phenyl Sepharose (♦)
Q-Sepharose [1].
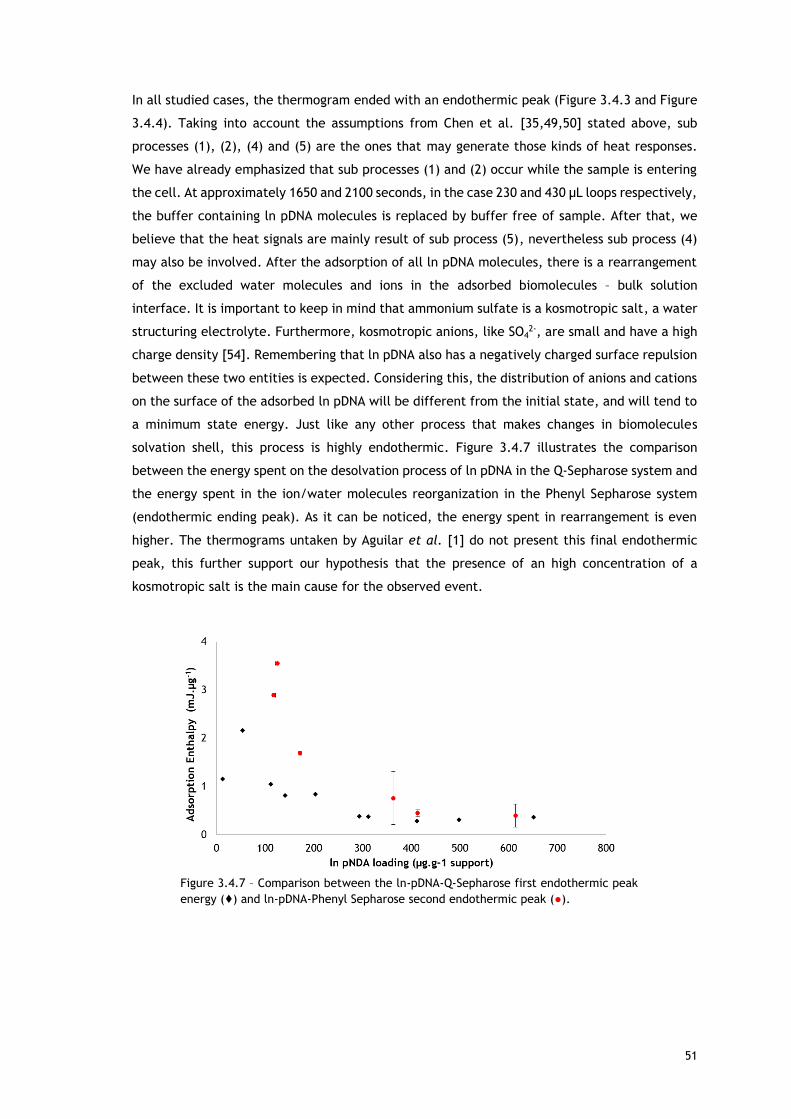
51
In all studied cases, the thermogram ended with an endothermic peak (Figure 3.4.3 and Figure
3.4.4). Taking into account the assumptions from Chen et al. [35,49,50] stated above, sub
processes (1), (2), (4) and (5) are the ones that may generate those kinds of heat responses.
We have already emphasized that sub processes (1) and (2) occur while the sample is entering
the cell. At approximately 1650 and 2100 seconds, in the case 230 and 430 µL loops respectively,
the buffer containing ln pDNA molecules is replaced by buffer free of sample. After that, we
believe that the heat signals are mainly result of sub process (5), nevertheless sub process (4)
may also be involved. After the adsorption of all ln pDNA molecules, there is a rearrangement
of the excluded water molecules and ions in the adsorbed biomolecules – bulk solution
interface. It is important to keep in mind that ammonium sulfate is a kosmotropic salt, a water
structuring electrolyte. Furthermore, kosmotropic anions, like SO42-, are small and have a high
charge density [54]. Remembering that ln pDNA also has a negatively charged surface repulsion
between these two entities is expected. Considering this, the distribution of anions and cations
on the surface of the adsorbed ln pDNA will be different from the initial state, and will tend to
a minimum state energy. Just like any other process that makes changes in biomolecules
solvation shell, this process is highly endothermic. Figure 3.4.7 illustrates the comparison
between the energy spent on the desolvation process of ln pDNA in the Q-Sepharose system and
the energy spent in the ion/water molecules reorganization in the Phenyl Sepharose system
(endothermic ending peak). As it can be noticed, the energy spent in rearrangement is even
higher. The thermograms untaken by Aguilar et al. [1] do not present this final endothermic
peak, this further support our hypothesis that the presence of an high concentration of a
kosmotropic salt is the main cause for the observed event.
Figure 3.4.7 – Comparison between the ln-pDNA-Q-Sepharose first endothermic peak
energy (♦) and ln-pDNA-Phenyl Sepharose second endothermic peak (●).

52
The adsorption process net heat (sum of all contributions) for both supports is illustrated in
Figure 3.4.8. For an interaction to occur the Gibbs free energy (ΔG = ΔH − TΔS) has to be
negative [35]. In the case of Q-Sepharose the overall adsorption process is undoubtedly
enthalpically driven, once it is exothermic for all the studied conditions [1]. Previous authors
have reported that the hydrophobic interaction process is, in most cases, entropically driven
[35,43]. Regarding our results with the Phenyl Sepharose resin it is not possible to define a
strict conclusion once, as shown in Figure 3.4.8, the process appears to be entrolpically driven
at lower concentrations and enthalpically driven at higher concentrations.
Figure 3.4.8 - Net heats (sum of all energetic contributions) of ln pDNA
adsorption onto (●) Phenyl Sepharose (♦) Q-Sepharose [1].

53
3.4.2. sc pDNA adsorption onto Q-Sepharose
Figure 3.4.9 and Figure 3.4.10 illustrate de thermograms obtained with the 30 and 430 µL
respectively. The signals are a result of different loading concentrations that range from 13 to
107 µg.g-1 gel and 117 to 1172 µg.g-1 gel in the 30 µL and 430 µL loop respectively. Once again,
we see that the thermogram profile only changes when a different injection loop is used. The
profile obtained with the 30 µL loop is very similar to the one generated by the interaction of
ln pDNA with Q-Sepharose reported by Aguilar et al.[1]. In contrast, the 430 µL loop profile has
a great divergence showing that the ln and sc pDNA adsorption onto Q-Sepharose are not so
similar after all.
Figure 3.4.9 - Thermograms of sc pDNA adsorption onto Q-sepharose using the 30 μL loop. Black 13.24 µg pDNA/g Q-Sepharose; Red 52.97 µg pDNA/g Q-Sepharose; Blue (--) 102.85 µg pDNA/g Q-Sepharose. Vertical dashed line represents the time where the pDNA solution plug is replaced with pDNA-free mobile phase
around 1150 seconds.
Figure 3.4.10 - Thermograms of sc pDNA adsorption onto Q-sepharose using the 430 μL loop. Black 117.26 µg pDNA/g Q-Sepharose; Blue 1172.60 µg pDNA/g Q-Sepharose. Vertical dashed line represents the time
where the pDNA solution plug is replaced with pDNA-free mobile phase around 2100 seconds.
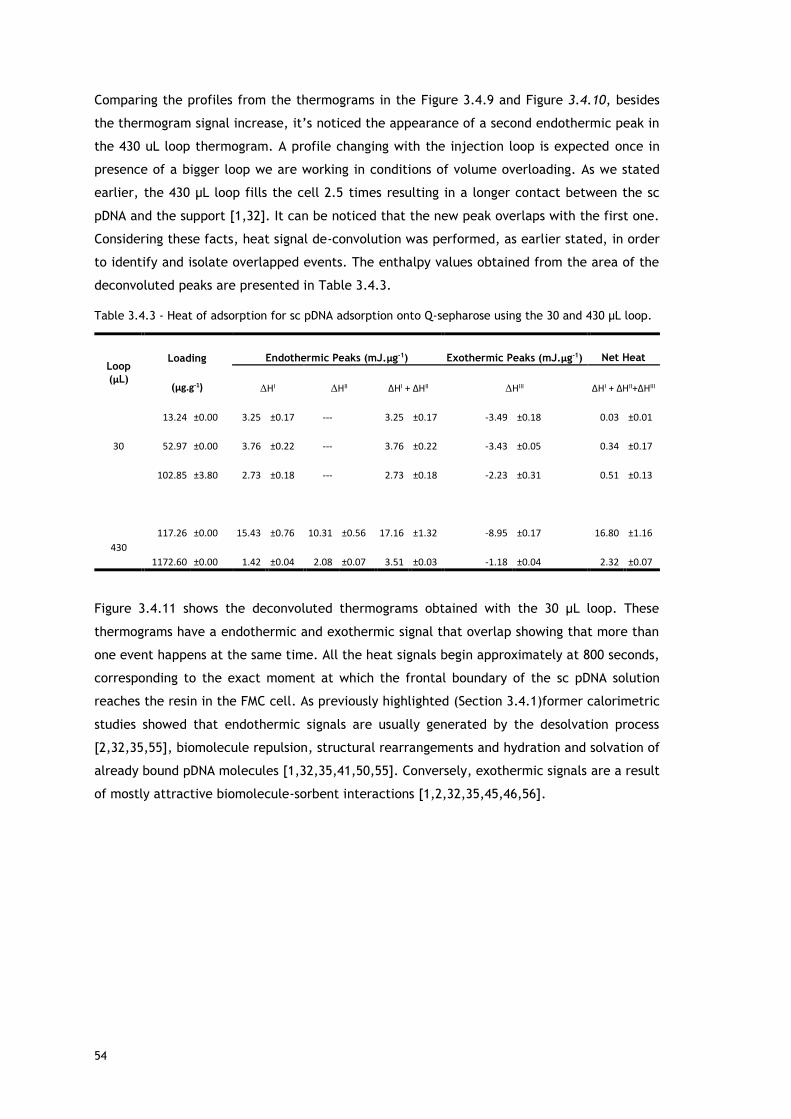
54
Comparing the profiles from the thermograms in the Figure 3.4.9 and Figure 3.4.10, besides
the thermogram signal increase, it’s noticed the appearance of a second endothermic peak in
the 430 uL loop thermogram. A profile changing with the injection loop is expected once in
presence of a bigger loop we are working in conditions of volume overloading. As we stated
earlier, the 430 μL loop fills the cell 2.5 times resulting in a longer contact between the sc
pDNA and the support [1,32]. It can be noticed that the new peak overlaps with the first one.
Considering these facts, heat signal de-convolution was performed, as earlier stated, in order
to identify and isolate overlapped events. The enthalpy values obtained from the area of the
deconvoluted peaks are presented in Table 3.4.3.
Table 3.4.3 - Heat of adsorption for sc pDNA adsorption onto Q-sepharose using the 30 and 430 μL loop.
Figure 3.4.11 shows the deconvoluted thermograms obtained with the 30 µL loop. These
thermograms have a endothermic and exothermic signal that overlap showing that more than
one event happens at the same time. All the heat signals begin approximately at 800 seconds,
corresponding to the exact moment at which the frontal boundary of the sc pDNA solution
reaches the resin in the FMC cell. As previously highlighted (Section 3.4.1)former calorimetric
studies showed that endothermic signals are usually generated by the desolvation process
[2,32,35,55], biomolecule repulsion, structural rearrangements and hydration and solvation of
already bound pDNA molecules [1,32,35,41,50,55]. Conversely, exothermic signals are a result
of mostly attractive biomolecule-sorbent interactions [1,2,32,35,45,46,56].
Loop
(µL)
Loading
(µg.g-1)
Endothermic Peaks (mJ.µg-1) Exothermic Peaks (mJ.µg-1) Net Heat
ΔHI ΔHII ΔHI + ΔHII ΔHIII ΔHI + ΔHII+ΔHIII
30
13.24 ±0.00 3.25 ±0.17 --- 3.25 ±0.17 -3.49 ±0.18 0.03 ±0.01
52.97 ±0.00 3.76 ±0.22 --- 3.76 ±0.22 -3.43 ±0.05 0.34 ±0.17
102.85 ±3.80 2.73 ±0.18 --- 2.73 ±0.18 -2.23 ±0.31 0.51 ±0.13
430
117.26 ±0.00 15.43 ±0.76 10.31 ±0.56 17.16 ±1.32 -8.95 ±0.17 16.80 ±1.16
1172.60 ±0.00 1.42 ±0.04 2.08 ±0.07 3.51 ±0.03 -1.18 ±0.04 2.32 ±0.07

55
Figure 3.4.11 - PEAKFIT de-convolution of thermograms for loading
concentrations of A – 13.24 µg pDNA/g Q-Sepharose; B -13.24 µg pDNA/g Q-
Sepharose; C - 102.85 µg pDNA/g Q-Sepharose. Curves shown are for
experimental data. Total peak fit (black line (–)) and peaks resulting from
deconvolution (blue and red lines (...))Vertical dashed line represents the
time where the pDNA solution plug is replaced with pDNA-free mobile phase
around 1150 seconds.
A
C
B
56
The deconvoluted thermograms were analyzed considering the already mentioned mechanism
proposed by Chen et al. [35,49,50] that divide the adsorption process into sequential sub
processes (Section 3.4.1).
The DNA molecule has a polyelectrolyte nature in solution, which allows its binding to charged
ligands, molecular condensation and conformational changes [19,57,58]. DNA molecules are
highly-charged in aqueous environment. They need to be charged to avoid precipitation and
phase separation at physiological concentrations [19,57,58]. The DNA molecule has an effective
charge density of one negative charge every 0.17nm of its length [57,58]. In the present study,
where different isoforms of the same plasmid are used, the ln and the sc isoforms have an equal
charge number because they are composed of the same number of nucleotides [19]. However,
the sc pDNA has a higher charge density once it has the same number of charges confined in
less space. These high charge density attracts more water and counter ions which increases the
solvation shell. The distribution and disruption of this solvation shell will have important
consequences in the thermodynamics of interaction [57,58]. As we can see in the Figure 3.4.11,
during the time that the pDNA molecules are entering and flowing through the cell (before the
1200s, pulg end, time where the mobile phase containing sc pDNA molecules is replaced by a
pDNA-free mobile phase) the endothermic peak area is much larger that the exothermic one.
Taking into account the above stated assumptions, the endothermic heat changes may be
mainly caused by subprocesses (1) and (2). Interactions involving a net change in the solvation
shell are often strongly driven by entropy alterations attending the release of ions and water
molecules [2,35,50,55,57]. Obviously, this process is enthalpically unfavorable, but the release
of water molecules contributes to a large entropy gain that compensate the unfavorable
condition [1,35]. Aguilar et al.[1] reported this same event for the adsorption of ln pDNA onto
Q-Sepharose.
Figure 3.4.12 illustrates the comparison between the endothermic enthalpy values for both ln
and sc pDNA adsorption onto Q-Sepharose. For the same amount of pDNA it can be seen that
enthalpy changes involved in the desolvation process are much higher for the sc pDNA isoform.
Since the charge density of sc pDNA is higher when compared to ln pDNA, the amount of energy
required for desolvation process will also increase.
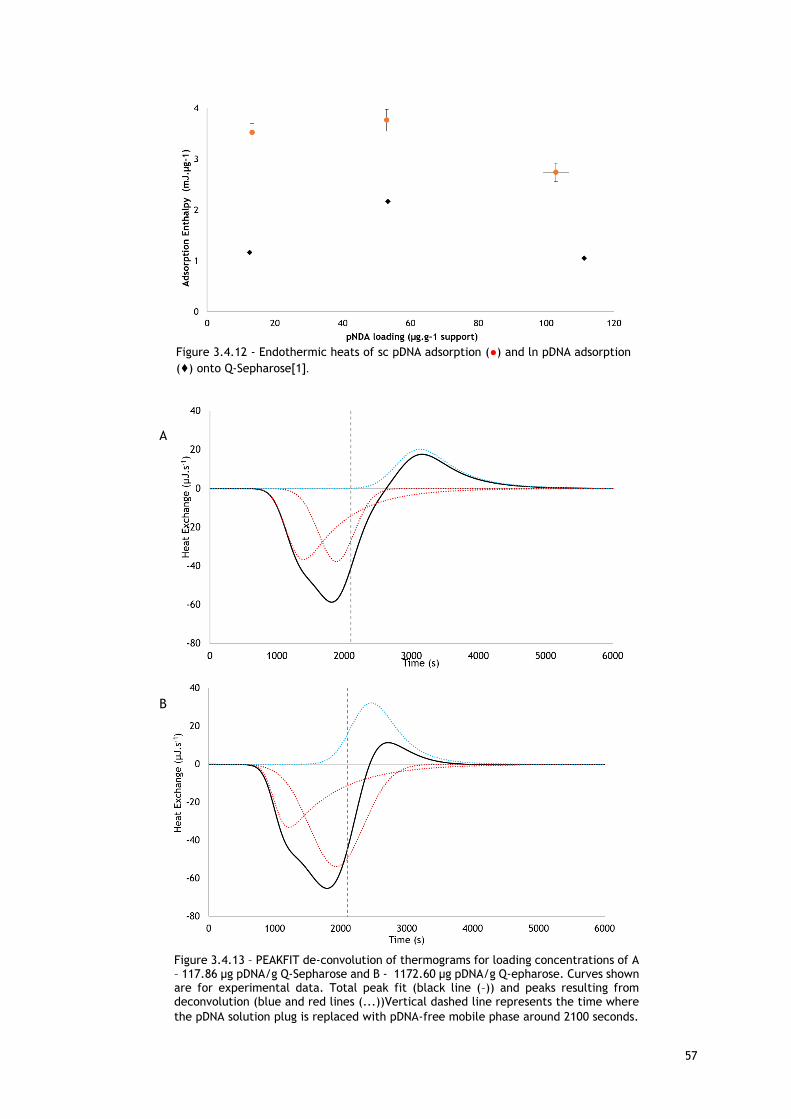
57
Figure 3.4.12 - Endothermic heats of sc pDNA adsorption (●) and ln pDNA adsorption
(♦) onto Q-Sepharose[1].
A
B
Figure 3.4.13 – PEAKFIT de-convolution of thermograms for loading concentrations of A – 117.86 µg pDNA/g Q-Sepharose and B - 1172.60 µg pDNA/g Q-epharose. Curves shown are for experimental data. Total peak fit (black line (–)) and peaks resulting from deconvolution (blue and red lines (...))Vertical dashed line represents the time where
the pDNA solution plug is replaced with pDNA-free mobile phase around 2100 seconds.

58
Figure 3.4.13 show the deconvoluted thermograms obtained with the 430 µL loop. Changing the
injection volume results into different profiles. This happens because the transition from a
pulse to a continuous feed of sc pDNA into the cell has influence in the equilibrium already
reached by the bound molecules and consequently in the sub processes involved at the
adsorption mechanism. This is also supported by Aguilar et al.[1].To analyze the thermograms,
the interaction between bound pDNA molecules and free pDNA molecules in the feed solution
has be accounted [50].
As in the 30 µL loop, for the 430 µL loop the signal before the plug end (2100s) is mainly
endothermic. According to the chronological sequence of sub processes proposed by Chen et
al. [35,49,50] and the peak timing, the first endothermic event is compatible with the
desolvation process. The appearance of a second peak suggests that the heat changes involved
in the structural rearrangements upon adsorption, due to the interaction between the bound
pDNA molecules and the free pDNA molecules in the feed solution are considerable. For the
adsorption of ln pDNA onto Q-Sepharose, Aguilar et al. [1] reported that the heat changes
involved in the hydration and solvation of already bound pDNA molecules and biomolecule
repulsion are considered minimal when compared to the heat changes in desolvation.
Nevertheless, under physiological pH conditions molecules with high charge density, like sc
pDNA, gives rise to strong repulsion between the same charge neighboring molecules and ions
[57,58]. In this particular case, the desolvation process still have a substantial contribution to
the endothermic enthalpy changes, but a great part of the enthalpy change is caused by the
repulsions between the sc pDNA molecules. In fact, according to the data shown in Table 3.4.3,
the energy of the second endothermic event tends to be higher than the energy involved in the
desolvation process as the loading increases. This and the fact that the second peak reaches its
maximum near the plug end, supports even further our hypothesis, because a system with more
free sc pDNA molecules will probably have more repulsion.
Simultaneously to the water molecules and ions release in the desolvation sub process, the
interaction of sc pDNA and Q-sepharose occurs through an electrostatic attraction, (Figure
3.4.11 and Figure 3.4.12) (sub process 3) [35,49,50]. This may explain why the exothermic peak
overlaps with the endothermic signal in the 30 µL loop thermograms (Figure 3.4.11 B). The
electrostatic attractive forces between the sc pDNA molecule and the sorbent are expected to
generated larger heats compared to other nonspecific interactions [35]. But, as reported earlier
[1], the fact that the maximum of the exothermic peak appears after the sc pDNA plug end
(after the mobile phase plug containing pDNA was replaced with pDNA-free mobile phase)
indicate the presence of other thermal events, such as secondary adsorption of bound pDNA
(biomolecules reorientation) or hydration of the already adsorbed biomolecules, an exothermic
process [1,45]. After the primary adsorption of sc pDNA on Q-Sepharose surface, the pDNA
molecules may undergo a surface reorientation, shifting to a minimum energetic state, creating
new sites on its surface which become available for favorable interactions with the adsorption
surface [45].
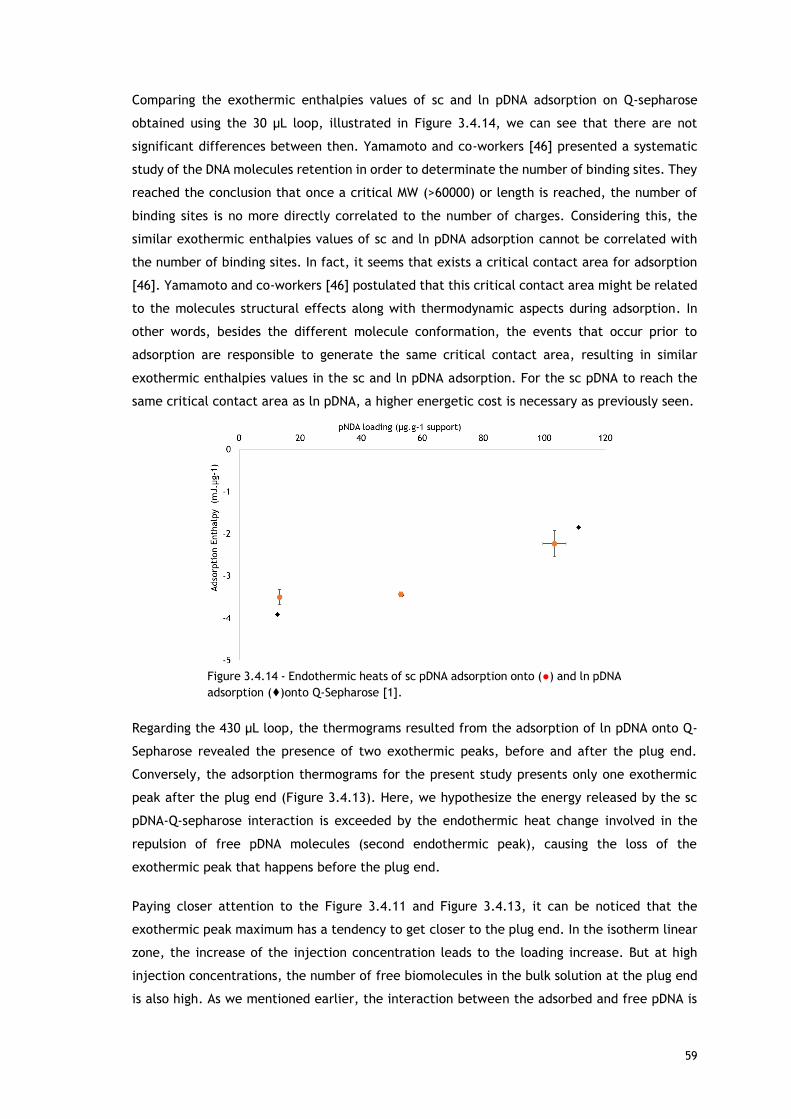
59
Comparing the exothermic enthalpies values of sc and ln pDNA adsorption on Q-sepharose
obtained using the 30 µL loop, illustrated in Figure 3.4.14, we can see that there are not
significant differences between then. Yamamoto and co-workers [46] presented a systematic
study of the DNA molecules retention in order to determinate the number of binding sites. They
reached the conclusion that once a critical MW (>60000) or length is reached, the number of
binding sites is no more directly correlated to the number of charges. Considering this, the
similar exothermic enthalpies values of sc and ln pDNA adsorption cannot be correlated with
the number of binding sites. In fact, it seems that exists a critical contact area for adsorption
[46]. Yamamoto and co-workers [46] postulated that this critical contact area might be related
to the molecules structural effects along with thermodynamic aspects during adsorption. In
other words, besides the different molecule conformation, the events that occur prior to
adsorption are responsible to generate the same critical contact area, resulting in similar
exothermic enthalpies values in the sc and ln pDNA adsorption. For the sc pDNA to reach the
same critical contact area as ln pDNA, a higher energetic cost is necessary as previously seen.
Regarding the 430 µL loop, the thermograms resulted from the adsorption of ln pDNA onto Q-
Sepharose revealed the presence of two exothermic peaks, before and after the plug end.
Conversely, the adsorption thermograms for the present study presents only one exothermic
peak after the plug end (Figure 3.4.13). Here, we hypothesize the energy released by the sc
pDNA-Q-sepharose interaction is exceeded by the endothermic heat change involved in the
repulsion of free pDNA molecules (second endothermic peak), causing the loss of the
exothermic peak that happens before the plug end.
Paying closer attention to the Figure 3.4.11 and Figure 3.4.13, it can be noticed that the
exothermic peak maximum has a tendency to get closer to the plug end. In the isotherm linear
zone, the increase of the injection concentration leads to the loading increase. But at high
injection concentrations, the number of free biomolecules in the bulk solution at the plug end
is also high. As we mentioned earlier, the interaction between the adsorbed and free pDNA is
Figure 3.4.14 - Endothermic heats of sc pDNA adsorption onto (●) and ln pDNA
adsorption (♦)onto Q-Sepharose [1].
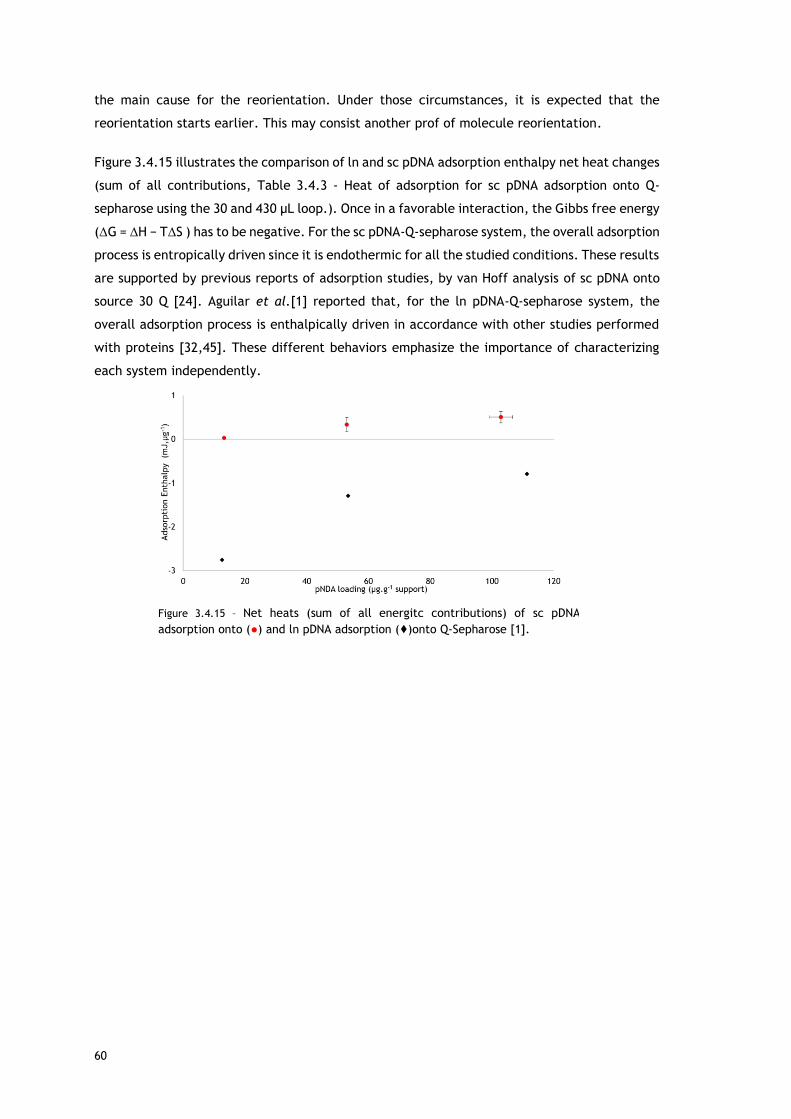
60
the main cause for the reorientation. Under those circumstances, it is expected that the
reorientation starts earlier. This may consist another prof of molecule reorientation.
Figure 3.4.15 illustrates the comparison of ln and sc pDNA adsorption enthalpy net heat changes
(sum of all contributions, Table 3.4.3 - Heat of adsorption for sc pDNA adsorption onto Q-
sepharose using the 30 and 430 μL loop.). Once in a favorable interaction, the Gibbs free energy
(ΔG = ΔH − TΔS ) has to be negative. For the sc pDNA-Q-sepharose system, the overall adsorption
process is entropically driven since it is endothermic for all the studied conditions. These results
are supported by previous reports of adsorption studies, by van Hoff analysis of sc pDNA onto
source 30 Q [24]. Aguilar et al.[1] reported that, for the ln pDNA-Q-sepharose system, the
overall adsorption process is enthalpically driven in accordance with other studies performed
with proteins [32,45]. These different behaviors emphasize the importance of characterizing
each system independently.
Figure 3.4.15 – Net heats (sum of all energitc contributions) of sc pDNA
adsorption onto (●) and ln pDNA adsorption (♦)onto Q-Sepharose [1].
61
4. Conclusion and Future work
Considering the different thermogram profiles and the energy changes from different sources
that are involved in the adsorption process, the flow microcalorimetry technique displayed
once more the capability to study the adsorption process, giving a valuable insight on the overall
mechanism.
Static binding capacity studies revealed that the mechanism of ln pDNA adsorption onto Phenyl
Sepharose also follows a Langmuir-type isotherm profile under a certain equilibrium
concentration. However, the association constant and the maximum revealed to be much lower
than the adsorption onto Q-sepharose. We were not able to study the sc pDNA adsorption onto
Q-sepharose in the same way due to the molecule instability under the test conditions, but
theoretical binding capacity calculations were performed for comparation with the ln pDNA
case.
Regarding the FMC tests with ln pDNA and Phenyl Sepharose, all obtained thermograms
comprised an endothermic peak follow by one or two exothermic peaks, depending on the
injection mode, and a final endothermic peak. The thermogram peaks were deconvoluted and
the area and timing considered for comparation with the ln pDNA adsorption onto Q-sepharose.
The initial endothermic peak was related to the desolvation process. The first exothermic peak
was related to the ln pDNA-support interaction. Given the energetic similarity between the ln
pDNA interaction between the Phenyl and Q-Sepharose, it was found that Phenyl Sepharose also
interact electrostatically with the pDNA molecule though anion- interactions. Using the
continuous feed (430 µL loop) differences were found not only in the heat signal magnitude and
in the time at which each event took place, but also in the peak profile. The presence of
different peaks in a thermogram suggested the existence of different events during the
adsorption process. The second exothermic peak, only found in the continuous feed mode, was
related to ln pDNA reorientation and secondary adsorption similarly to what happens with the
ln pDNA adsorption onto Q-sepharose. The final endothermic peak was found to be related to
the reorganization of ions and water molecules in the ln pDNA-bulk solution interface given the
presence of a high concentration of ammonium sulfate.
The FMC experiments with sc pDNA and Q-Sepharose resulted in thermograms comprised of an
endothermic peak follow by an exothermic one. The endothermic peak obtained with the 430
µL injection loop was later deconvoluted into two endothermic signals. As in the first case, the
peaks intensity, area and timing were considered and compared with the ln pDNA adsorption
onto Q-sepharose. The first endothermic signal was found to be related to the desolvation
process just like in the ln pDNA adsorption. However, the signal is more energetic in the sc
pDNA adsorption due to the high charge density granted by the supercoiled isoform that leads
to a higher energetic cost for desolvation. When working with the 430 µL loop we were able to

62
promote the column volume overloading which resulted in a second endothermic signal. This
signal was related with the repulsions between the free sc pDNA molecules in solution. At last,
the exothermic peak timing and area led us to believe that was related to molecule
reorientation and secondary adsorption.
The enthalpies of adsorption showed that the overall adsorption process is exothermic, near to
zero, for the adsorption of ln pDNA onto Phenyl Sepharose. Some studies reported that liquid
chromatographic processes involving hydrophobic interactions are believed to be markedly
influenced by the entropy change and are often considered to be mainly endothermic. In this
particular case, we do not have a pure hydrophobic interactions system which explains the
divergent result. For the sc pDNA-Q-sepharose system, the overall adsorption process is
entropically driven since it is endothermic for all the studied cases, these results are supported
by previous reports of adsorption studies by van Hoff analysis [24].
For future work, further experiments should be conducted with the same hydrophobic
interaction resin in order to understand the influence of arenes and anion- interaction in the
hydrophobic adsorption process. sc pDNA could be used once it is known to have a weak
interaction with hydrophobic interaction resins (at low salt concentrations) and a high charge
density. Even though, experiments with other hydrophobic interaction resins, like octyl
sepharose, should be conducted in order to understand the mechanisms underlying a pure
hydrophobic system.
Additionally, chromatographic monoliths repersents the 4th generation of stationary phases.
They are especially attractive due to a short purification time, flow unafected properties and
high dynamic bindig capacity for high molecular weight molecules. It will be interesting to
perform the studies using sc pDNA and monoliths to compare the results with ones obtained
with particles resins. This will give us information about the stationary phase thermodynamic
contributions to the purification process.

63
5. References
[1] P. a. Aguilar, A. Twarda, F. Sousa, A.C. Dias-Cabral, Thermodynamic study of the
interaction between linear plasmid deoxyribonucleic acid and an anion exchange
support under linear and overloaded conditions, J. Chromatogr. A. 1372 (2014) 166–173.
[2] J. Korfhagen, A.C. Dias-Cabral, M.E. Thrash, Nonspecific Effects of Ion Exchange and
Hydrophobic Interaction Adsorption Processes, Sep. Sci. Technol. 45 (2010) 2039–2050.
[3] A. Xenopoulos, P. Pattnaik, Production and purification of plasmid DNA vaccines: is there
scope for further innovation?, Expert Rev. Vaccines. 13 (2014) 1537–1551.
[4] Kewal K. Jain, Textbook of Gene Therapy, Hogrefe & Huber Publishing, 1999.
[5] F. Sousa, L. Passarinha, J.A. Queiroz, Biomedical application of plasmid DNA in gene
therapy: a new challenge for chromatography., Biotechnol. Genet. Eng. Rev. 26 (2010)
83–116.
[6] K. Lundstrom, G. Gun, New Era in Gene Therapy, Elsevier Inc., 2015.
[7] M.A. Liu, DNA vaccines: an historical perspective and view to the future., Immunol. Rev.
239 (2011) 62–84.
[8] W.J. Kelly, Perspectives on plasmid-based gene therapy: challenges for the product and
the process., Biotechnol. Appl. Biochem. 37 (2003) 219–23.
[9] D. Fioretti, S. Iurescia, V.M. Fazio, M. Rinaldi, DNA vaccines: developing new strategies
against cancer., J. Biomed. Biotechnol. 2010 (2010) 174378.
[10] B. Ferraro, M.P. Morrow, N.A. Hutnick, T.H. Shin, C.E. Lucke, D.B. Weiner, Clinical
applications of DNA vaccines: current progress., Clin. Infect. Dis. 53 (2011) 296–302.
[11] Y. Cai, S. Rodriguez, H. Hebel, DNA vaccine manufacture: scale and quality., Expert
Rev. Vaccines. 8 (2009) 1277–91.
[12] K.K. Jain, A Special Report on Gene Therapy, John Wiley & Sons, 2000.
[13] A. Ghanem, R. Healey, F.G. Adly, Current trends in separation of plasmid DNA vaccines:
a review., Anal. Chim. Acta. 760 (2013) 1–15.
[14] M.B. Appaiahgari, S. Vrati, Adenoviruses as gene/vaccine delivery vectors: promises and
pitfalls., Expert Opin. Biol. Ther. 15 (2015) 337–51.
[15] L. Vannucci, M. Lai, F. Chiuppesi, L. Ceccherini-Nelli, M. Pistello, Viral vectors: a look
back and ahead on gene transfer technology., New Microbiol. 36 (2013) 1–22.
[16] K. Lundstrom, Novel Approaches and Strategies for Biologics, Vaccines and Cancer
Therapies, Elsevier, 2015.
64
[17] M.M. Diogo, J.A. Queiroz, D.M.F. Prazeres, Chromatography of plasmid DNA, J.
Chromatogr. A. 1069 (2005) 3–22.
[18] D.M.F. Prazeres, T. Schluep, C. Cooney, Preparative purification of supercoiled plasmid
DNA using anion-exchange chromatography, J. Chromatogr. A. 806 (1998) 31–45.
[19] T.C. Boles, J.H. White, N.R. Cozzarelli, Structure of plectonemically supercoiled DNA.,
J. Mol. Biol. 213 (1990) 931–51.
[20] G.M. Borja, E. Meza Mora, B. Barrón, G. Gosset, O.T. Ramírez, A.R. Lara, Engineering
Escherichia coli to increase plasmid DNA production in high cell-density cultivations in
batch mode., Microb. Cell Fact. 11 (2012) 132.
[21] S.G. MOKRUSHIN, Definition of Chromatography, Nature. 178 (1956) 1244–1245.
[22] G. Carta, A. Jungbauer, Protein chromatography process development and scale-up,
Wiley, 2010.
[23] E. Müller, Properties and Characterization of High Capacity Resins for
Biochromatography, Chem. Eng. Technol. 28 (2005) 1295–1305.
[24] C. Tarmann, A. Jungbauer, Adsorption of plasmid DNA on anion exchange
chromatography media, J. Sep. Sci. 31 (2008) 2605–2618.
[25] X. Shi, L. Qiao, G. Xu, Recent development of ionic liquid stationary phases for liquid
chromatography., J. Chromatogr. A. 1420 (2015) 1–15.
[26] V. Smrekar, F. Smrekar, A. Strancar, A. Podgornik, Single step plasmid DNA purification
using methacrylate monolith bearing combination of ion-exchange and hydrophobic
groups., J. Chromatogr. A. 1276 (2013) 58–64.
[27] N.L. Krajnc, F. Smrekar, J. Černe, P. Raspor, M. Modic, D. Krgovič, A. Štrancar, A.
Podgornik, Purification of large plasmids with methacrylate monolithic columns, J. Sep.
Sci. 32 (2009) 2682–2690.
[28] A. Podgornik, S. Yamamoto, M. Peterka, N.L. Krajnc, Fast separation of large
biomolecules using short monolithic columns., J. Chromatogr. B. Analyt. Technol.
Biomed. Life Sci. 927 (2013) 80–9.
[29] H. Walton, Ion-exchange chromatography, Anal. Chem. (2015) 187.
[30] D.M.F. Prazeres, T. Schluep, C. Cooney, Preparative purification of supercoiled plasmid
DNA using anion-exchange chromatography, J. Chromatogr. A. 806 (1998) 31–45.
[31] GE Healthcare, Hydrophobic Interaction and Reversed Phase Chromatography: Principles
and Methods, (2012) 168.
[32] G.L. Silva, F.S. Marques, M.E. Thrash, A.C. Dias-Cabral, Enthalpy contributions to
adsorption of highly charged lysozyme onto a cation-exchanger under linear and
overloaded conditions., J. Chromatogr. A. 1352 (2014) 46–54.
65
[33] G.N. Ferreira, J.M. Cabral, D.M. Prazeres, Studies on the batch adsorption of plasmid
DNA onto anion-exchange chromatographic supports., Biotechnol. Prog. 16 416–24.
http://www.ncbi.nlm.nih.gov/pubmed/10835244 (accessed February 14, 2016).
[34] D.S. Gill, D.J. Roush, K.A. Shick, R.C. Willson, Microcalorimetric characterization of the
anion-exchange adsorption of recombinant cytochrome b5 and its surface-charge
mutants, J. Chromatogr. A. 715 (1995) 81–93.
[35] F. Lin, W. Chen, M.T.W. Hearn, Thermodynamic analysis of the interaction between
proteins and solid surfaces : application to liquid chromatography, J. Mol. Recognit. 15
(2002) 55–93.
[36] S.R. Gallant, A. Kundu, S.M. Cramer, Modeling non-linear elution of proteins in ion-
exchange chromatography, J. Chromatogr. A. 702 (1995) 125–142.
[37] J.M. Phillips, N.G. Pinto, Calorimetric investigation of the adsorption of nitrogen bases
and nucleosides on a hydrophobic interaction sorbent, J. Chromatogr. A. 1036 (2004)
79–86.
[38] M. a. Groszek, Flow Adsorption Microcalorimetry, Mater. Sci. Forum. 25–26 (1988) 483–
486.
[39] N.G. Esquibel-King, Maria A.; Dias-Cabral, Ana Cristina; Queiroz, João A.; Pinto, Albumin
Under Overloaded Conditions Using Flow Microcalorimetry, J. Chromatogr. A. 865 (1999)
111–122.
[40] M.E. Thrash, N.G. Pinto, Characterization of enthalpic events in overloaded ion-
exchange chromatography, J. Chromatogr. A. 944 (2002) 61–68.
[41] M.E. Thrash, N.G. Pinto, Flow microcalorimetric measurements for bovine serum
albumin on reversed-phase and anion-exchange supports under overloaded conditions,
J. Chromatogr. A. 908 (2001) 293–299.
[42] N.L. Krajnc, F. Smrekar, J. Cerne, P. Raspor, M. Modic, D. Krgovic, A. Strancar, A.
Podgornik, Purification of large plasmids with methacrylate monolithic columns., J. Sep.
Sci. 32 (2009) 2682–90.
[43] A.C. Dias-Cabral, J.A. Queiroz, N.G. Pinto, Effect of salts and temperature on the
adsorption of bovine serum albumin on polypropylene glycol-Sepharose under linear and
overloaded chromatographic conditions, J. Chromatogr. A. 1018 (2003) 137–153.
[44] M.A. Esquibel-King, A.C. Dias-Cabral, J.A. Queiroz, N.G. Pinto, Study of hydrophobic
interaction adsorption of bovine serum albumin under overloaded conditions using flow
microcalorimetry, J. Chromatogr. A. 865 (1999) 111–122.
[45] A. Katiyar, S.W. Thiel, V. V. Guliants, N.G. Pinto, Investigation of the mechanism of
protein adsorption on ordered mesoporous silica using flow microcalorimetry, J.
Chromatogr. A. 1217 (2010) 1583–1588.
66
[46] S. Yamamoto, N. Yoshimoto, C. Tarmann, Binding site and elution behavior of DNA and
other large biomolecules in monolithic anion-exchange chromatography, J. Chromatogr.
A. 1216 (2009) 2616–2620.
[47] C.J. van Oss, Hydrophobicity of biosurfaces - Origin, quantitative determination and
interaction energies, Colloids Surfaces B Biointerfaces. 5 (1995) 91–110.
[48] M.C. Flickinger, Downstream Industrial Biotechnology : Recovery and Purification,
Wiley, 2013.
[49] W.-Y. Chen, Z.-C. Liu, P.-H. Lin, C.-I. Fang, S. Yamamoto, The hydrophobic interactions
of the ion-exchanger resin ligands with proteins at high salt concentrations by adsorption
isotherms and isothermal titration calorimetry, Sep. Purif. Technol. 54 (2007) 212–219.
[50] F.-Y.Y. Lin, C.-S.S. Chen, W.-Y.Y. Chen, S. Yamamoto, Microcalorimetric studies of the
interaction mechanisms between proteins and Q-Sepharose at pH near the isoelectric
point (pI), J. Chromatogr. A. 912 (2001) 281–289.
[51] F.-Y. Lin, W.-Y. Chen, M.T.W. Hearn, Thermodynamic analysis of the interaction
between proteins and solid surfaces: application to liquid chromatography., J. Mol.
Recognit. 15 55–93.
[52] M. Giese, M. Albrecht, K. Rissanen, Experimental investigation of anion–π interactions –
applications and biochemical relevance, Chem. Commun. 52 (2016) 1778–1795.
[53] D.-X. Wang, M.-X. Wang, Anion−π Interactions: Generality, Binding Strength, and
Structure, J. Am. Chem. Soc. 135 (2013) 892–897.
[54] M. Chaplin, Kosmotropes and Chaotropes, Water Struct. Sci. (2016).
http://www1.lsbu.ac.uk/water/kosmotropes_chaotropes.html (accessed October 5,
2016).
[55] W.-Y. Chen, M.-S. Lin, P.-H. Lin, P.-S. Tasi, Y. Chang, S. Yamamoto, Studies of the
interaction mechanism between single strand and double-strand DNA with
hydroxyapatite by microcalorimetry and isotherm measurements, Colloids Surfaces A
Physicochem. Eng. Asp. 295 (2007) 274–283.
[56] A.M. Lenhoff, Protein adsorption and transport in polymer-functionalized ion-
exchangers., J. Chromatogr. A. 1218 (2011) 8748–59.
[57] G.N. Goparaju, Evaluation of cationic peptide-plasmid DNA complexes for gene delivery,
2008.
[58] D.H. Bloomfield, Victor A.; Crothers, Donald M.; Tinoco, Ignacio, Jr.; contributions from
Hearst, John E.; Wemmer, David E.; Kollman, Peter A.; Turner, Nucleic Acids:
Structures, Properties, and Functions, J. Chem. Educ. 78 (2001) 314.
67
[59] M.L. Edelstein, Gene Therapy Clinical Trials Worldwide, J. Gene Med. (2015).
http://www.wiley.com//legacy/wileychi/genmed/clinical/ (accessed November 28,
2015).
[60] G.N.M. Ferreira, J.M.S. Cabral, D.M.F. Prazeres, Studies on the batch adsorption of
plasmid DNA onto anion-exchange chromatographic supports, Biotechnol. Prog. 16
(2000) 416–424.

68

69
6. Appendix
Table 3.4.4 - Classification and properties of the different support media used in Liquid Chromatography.
Support media class Matrix material General features
Natural Polymers Agarose, Cellulose, Dextran
and Chitosan
Low solid densities (90-96%
water)
Limited mechanical strength
Smaller Pores (Gels)
Easy functionalization
Resistance to CIP
Low non-specific binding
Synthetic Polymers
Acrylic polymers,
Poly(methacrylate),
Poly(styrene-divinyl benzene,
Acrylamido and vynil co-
polymers
Higher solid densities (50-80%
water)
Large pore sizes possible
Greater mechanical strength
Resistance to CIP
Moderate or high non-
specific binding
Relatively difficult to
functionalize
Inorganic Materials
Hydroxyapatite, Silica,
Controlled pore glass,
Zirconia and TiO2.
Highest solid densities (30-
60% water)
Larger pore sizes possible
Rigidity
May not be resistant to CIP
Moderate or high non-
specific binding
Relatively difficult to
functionalize

70
Table 3.4.5 - Heat of adsorption for ln pDNA adsorption on Q-Sepharose at pH 8; flow rate: 1.5 mL/h; adsorbent sample size: 21.89 mg; and temperature: 25◦C. Enthalpies were determined from the deconvoluted thermograms.
Figure 3.4.16 - Thermograms of ln pDNA adsorption onto Q-Sepharose, at pH 8. Injection loop: 30 µL. (a) Black (–) 12.6 µg ln pDNA/g Q-Sepharose; red (– –) 53.4 µg ln pDNA/g Q-Sepharose; blue (-..-) 111.2 µg ln pDNA/g Q-Sepharose; (b)–(d) PEAKFIT deconvolution of thermograms for loading concentrations of (b) 12.6 µg ln pDNA/g Q-Sepharose, (c) 53.4 µg ln pDNA/g Q-Sepharose and (d) 111.2 µg ln pDNA/g Q-Sepharose. Curves shown are for experimental data (red line (–)); total peak fit (black line (–)) and peaks resulting from deconvolution (blue line (...)). Vertical dashed line represents the time where the pDNA-containing plug of solution is replaced with pDNA-free mobile phase.
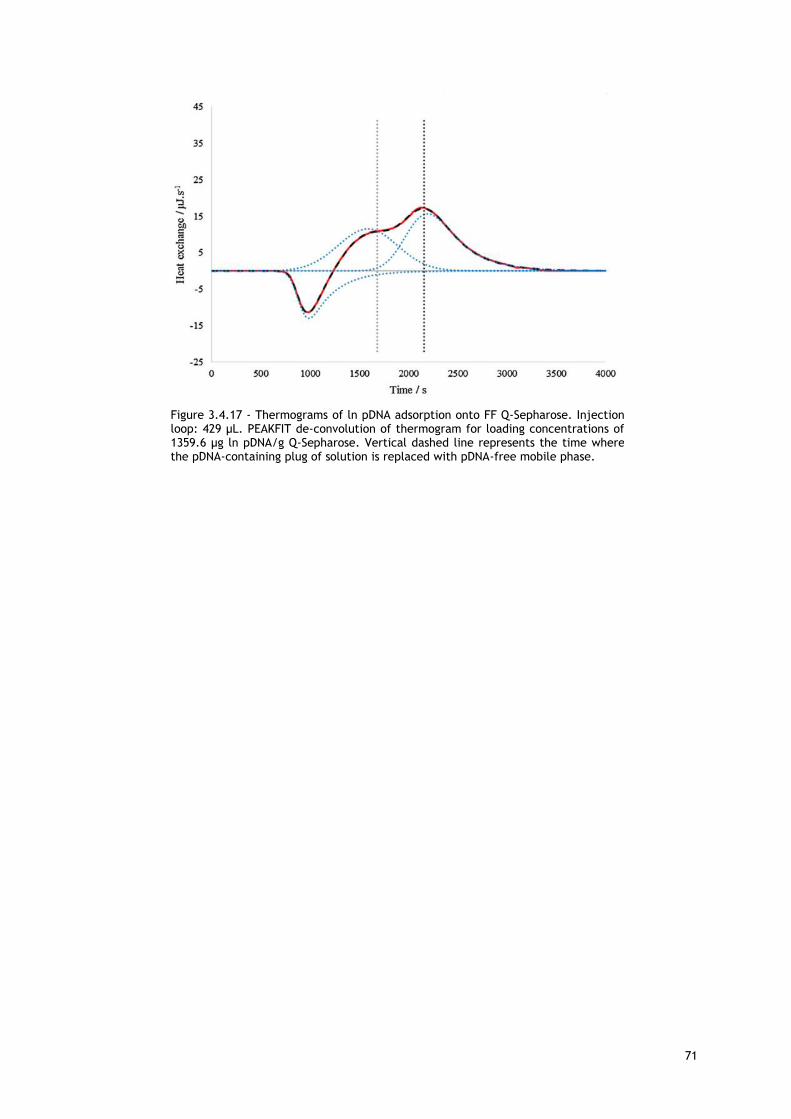
71
Figure 3.4.17 - Thermograms of ln pDNA adsorption onto FF Q-Sepharose. Injection loop: 429 µL. PEAKFIT de-convolution of thermogram for loading concentrations of 1359.6 µg ln pDNA/g Q-Sepharose. Vertical dashed line represents the time where the pDNA-containing plug of solution is replaced with pDNA-free mobile phase.


![A Covilhã: uma paisagem cultural evolutiva. Algumas notas ... · Adão pecaram, os da Covilhã sempre [todos] cardaram (Dias 1958: 35-48). A acentuada desindustrialização que,](https://static.fdocuments.in/doc/165x107/601ff714fc3fa47a855b5964/a-covilh-uma-paisagem-cultural-evolutiva-algumas-notas-ado-pecaram-os.jpg)