Understanding The Impact Of The Network On DB2 Performance Woods - DB2 Network.pdf · IBM Software...
35
® IBM Software Group © 2009 IBM Corporation Understanding The Impact Of The Network On DB2 Performance Ed Woods Consulting IT Specialist IBM Corporation
Transcript of Understanding The Impact Of The Network On DB2 Performance Woods - DB2 Network.pdf · IBM Software...

®
IBM Software Group
© 2009 IBM Corporation
Understanding The Impact Of The Network On DB2 Performance
Ed Woods
Consulting IT Specialist
IBM Corporation

IBM Software Group | Tivoli software
2
Agenda
� Introduction
� The Network And The DB2 Application Time Line
� Understanding The Network
� Sources Of Analysis Information And Analysis Examples
� Useful Commands
� Summary And Recommendations

IBM Software Group | Tivoli software
3
The Challenges Of Performance And Availability Management Of Complex Systems
� Most new applications are composite by design
�Applications cross multiple subsystems and platforms
�Integration and utilization of multiple core technologies
�Pose challenges from a management and monitoring perspective
� Common Technical Challenges
�Multiple platforms
�Potentially multiple DB systems
�Middleware considerations
�One or multiple network hops
�How best to do alerting, problem isolation, and root cause analysis

IBM Software Group | Tivoli software
4
DB2 Distributed Data Base Access
� DB2 supports two different types of remote access between the requesting
application and the serving DBMS
�DRDA - Distributed Relational Database Architecture
� A database interoperability standard from The Open Group
� With DRDA access, an application can access data at any server that supports
DRDA
� DRDA supports all SQL features, including user-defined functions, LOBs,
stored procedures, and XML data
� DRDA minimizes the number of binds required, and supports multi-row FETCH
� DRDA is the preferred method for remote access with DB2
�DB2 private protocol
� Private protocol is an older method for remote access. It can be used only
between DB2 subsystems and only over a SNA network.
IBM Software Group | Tivoli software
5
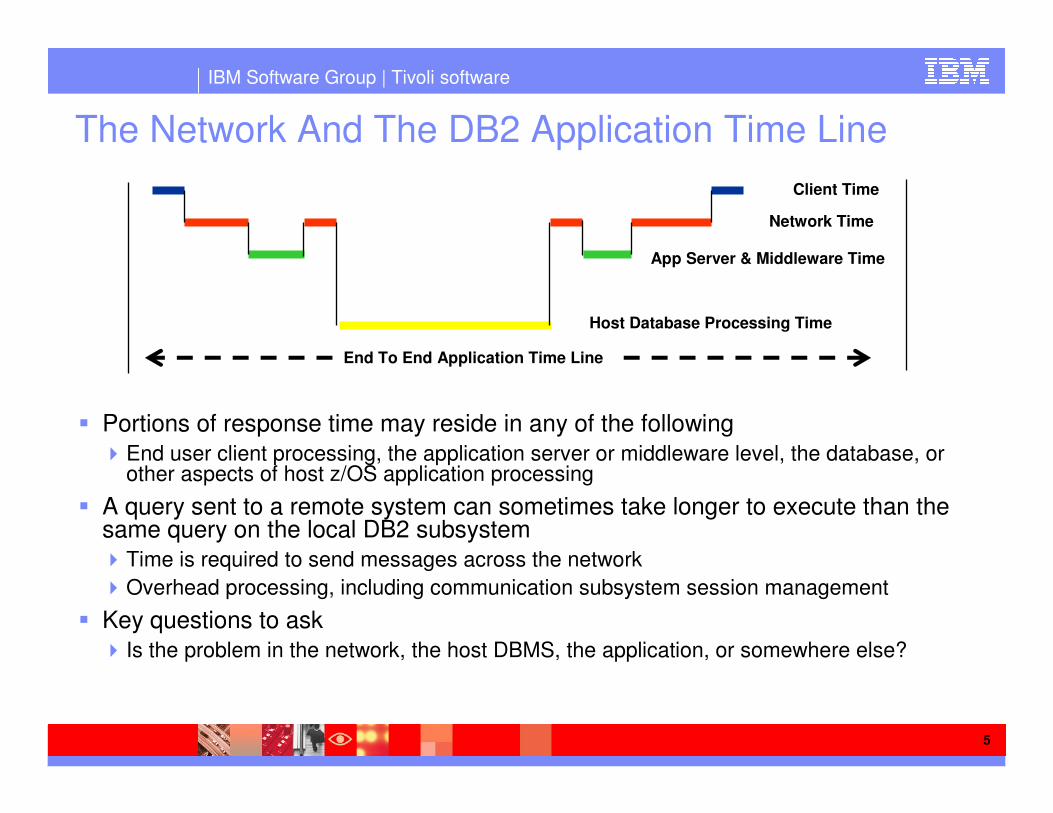
The Network And The DB2 Application Time Line
� Portions of response time may reside in any of the following
�End user client processing, the application server or middleware level, the database, or other aspects of host z/OS application processing
� A query sent to a remote system can sometimes take longer to execute than the same query on the local DB2 subsystem
�Time is required to send messages across the network
�Overhead processing, including communication subsystem session management
� Key questions to ask
� Is the problem in the network, the host DBMS, the application, or somewhere else?
Network Time
Client Time
Host Database Processing Time
App Server & Middleware Time
End To End Application Time Line

IBM Software Group | Tivoli software
6
Understanding TCP/IPA Layered Network Protocol
Application
TCPTransmission Control Protocol
IPInternet Protocol
Network Interface
Application
TCPTransmission Control Protocol
IPInternet Protocol
Network Interface
WWW, FTP, Telnet
End to EndAcknowlegement
Datagram Delivery
Physical Connection
Port Port Port Port
WebBrowser
HTTP
Server
App Interface App Interface

IBM Software Group | Tivoli software
Understanding TCP/IPThree Way Handshake
� TCP assigns a SEQ number to each segment sent
� Each segment received is ACK’ed by the receiver
� Time Algorithm
Send
SEQ=200
established
SendSEQ=201ACK=400+1
Listen
Received
Send
SEQ=400ACK=200+1
established
SEQ=200
SEQ=400, ACK=201
SEQ=201, ACK=401
Client Server

IBM Software Group | Tivoli software
The Performance Characteristics Of TCP/IP
� Visualize as a mesh-connected network
�No defined mechanism to limit the number of users on the network
�Path to destination may have multiple hops
�Data routes are not necessarily symmetric
� Network routers have a finite amount of memory to store information
� IP allows routers to drop packets when buffers overflow
�Congestion avoidance cannot help when demand outstrips network
capacity
� Only two ways to correct the problem:
� Increase capacity and add additional bandwidth
�Reduce network demand through DB2 and application optimization and
tuning

IBM Software Group | Tivoli software
9
DB2 Has Several Potential Performance Bottlenecks
DBM1MSTR
EDM
PTs, SKPTs, CTs, SKCTs
DSC – Dynamic SQL
Buffer Mgr - VPs
Sort Pool RID Pool
SQL
DDFDistributed
threads
Locking
IRLM
Connections
Threads
Logging
z/OS
IMS
Stored Procedures
SP Addr Space(s)
UDFs
CICS
Batch
TSO
WebSphere
DB2 Connect
DB2 App DB2 App
Networkdelays
Lock Conflicts
DB, BPI/O delays
Connectionbottlenecks
Connectionbottlenecks
SQL
SP SchedDelays
Networkdelays
DB2 Performance IssuesDB2 thread connection issuesLong running threadsDB2 SQL delays and long running SQLDB2 database I/O delays and BP perf.Network and/or OS delaysDB2 lock conflicts Connect GW
bottlenecks

IBM Software Group | Tivoli software
10
Optimizing Network Processing
� Minimizing the number of messages sent between the application requester and the DBMS is a primary way to optimize performance
� BIND options
�Consider the DEFER(PREPARE) bind option to reduce the number of messages that
must be sent back and forth across the network
�Consider ISOLATION(CS) to reduce contention and message overhead
� SQL statement options
�Commit frequently to avoid holding resources at the server
�Minimize SQL statements
� Avoid using several SQL statements when one well-tuned statement can do the job
� Consider using stored procedures
� Block fetching of result sets
�Block fetch can significantly decrease the number of messages sent across the network
�Block fetch is used only with cursors that do not update or delete data
�With block fetch, DB2 groups the rows that are retrieved by an SQL query into a “block”
of rows that fit in a message buffer and will transmit the block over the network

IBM Software Group | Tivoli software
11
Exploit The Power Of SQL To Optimize Network Traffic
� Do more with SQL to eliminate redundant back/forth activity
� Crossing more layers will mean more overhead
� Don’t put too much business logic in the DB layer
HTTP Server
App Server
DB Server
HTTP Server
App Server
DB Server
Network
Network
Network
Network
OR
Multiple SQLs Single SQL
SQLSQLSQL SQLSQL
IBM Software Group | Tivoli software
12
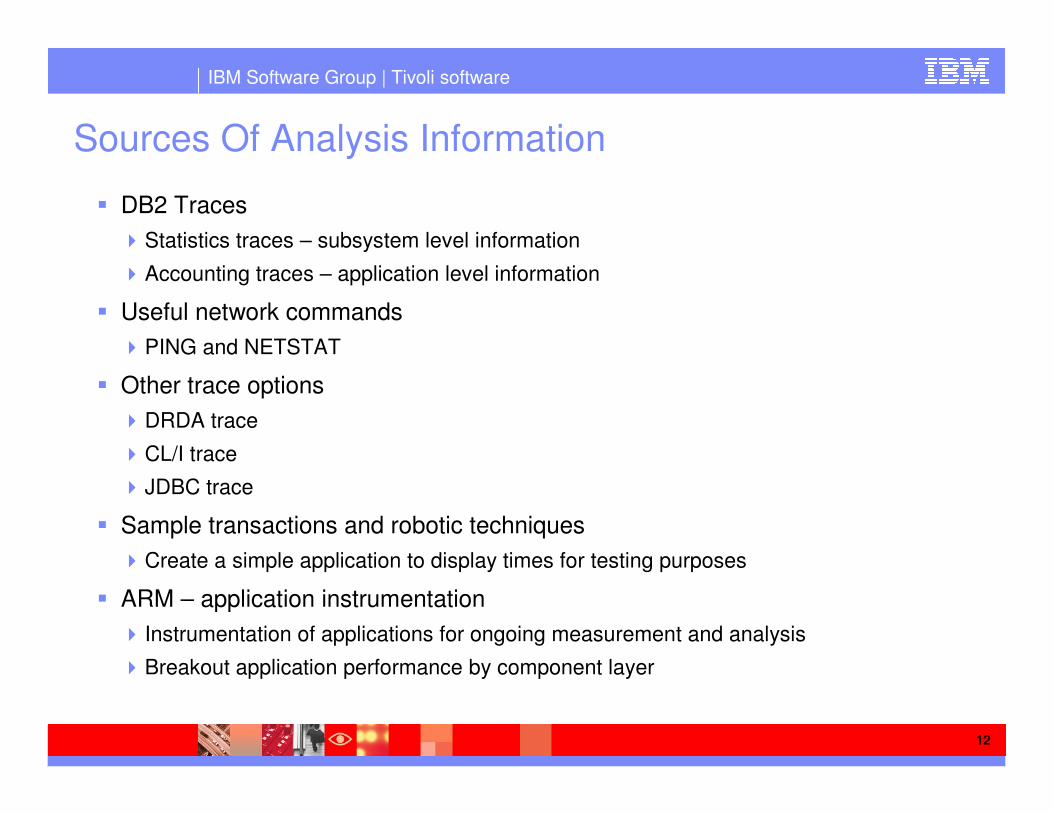
Sources Of Analysis Information
� DB2 Traces
�Statistics traces – subsystem level information
�Accounting traces – application level information
� Useful network commands
�PING and NETSTAT
� Other trace options
�DRDA trace
�CL/I trace
�JDBC trace
� Sample transactions and robotic techniques
�Create a simple application to display times for testing purposes
� ARM – application instrumentation
� Instrumentation of applications for ongoing measurement and analysis
�Breakout application performance by component layer

IBM Software Group | Tivoli software
13
DB2 TracesGather Information At Multiple Levels Of Detail
� An effective trace gathering, retention, and analysis strategy is important
� Traces have costs, so used the appropriate tool in the right manner
� Different traces have different levels of granularity
StatisticsTrace
AccountingTraces
PerformanceTraces
Subsystem level#calls and type by time interval
Application level#calls and type by application
Detail event levelSQL call level detail
Detail & Granularity

IBM Software Group | Tivoli software
14
DB2 Statistics TracesDB2 Subsystem Performance Analysis
� System-wide performance data gathered at specified intervals (set in ZPARMs)
� Written to SMF with type 100 header
�Two IFCIDs written per period
� Overhead small (approximately 1%)
SSAS StatisticsDB2 CPU, Storage, Log, &
IRLM statistics
DBAS StatisticsSQL, Buffer, EDM & RDS
statistics
IFCID 1
SMF Type 100
IFCID 2
-START TRACE (STAT)

IBM Software Group | Tivoli software
15
DB2 Statistics DataDistributed Stats For The Entire Subsystem
> DISTRIBUTED DATA FACILITY STATISTICS DFST
+ Collection Interval: REALTIME Start: 06/04 13:40:46 + Report Interval: 4 sec End: 06/04 13:40:49 + + Location Name = NDCDB203 DDF Status = ACTIVE + DDF CPU Rate = 00.0% Dist Allied Threads = 0 + Active DBATs = 3 Inactive DBATs = 0 + DDF Send Rate = 0K/sec DDF Receive Rate = 0K/sec + Resync Attempts = 0 Resync Successes = 0 + Cold Start Connections = 0 Warm Start Connections = 0 + DBAT Queued = 0 Conversations Dealloc = 0 + HWM All DBATs = 5 HWM Active DBATs = 5 + Max DB Access (MAXDBAT)= 500 HWM Inactive DBATs = 0 + + Remote Location Name = DRDA REMOTE LOCS + + Conversations Queued = 0 Binds for Remote Access = 0 + Message Buffer Rows = 174874 Block Mode Switches = 0 + Commits/Remote = 0 Rollbacks/Remote = 0 + Indoubts/Remote = 0 + + Tran SQL Row Message Byte Commit Abort Conv Blocks + ------- ------- ------- ------- -------- ------- ------- ------- -------+ Sent 0 0 174927 2486 43164569 0 0 0 1746 + Recv 55 1714 0 2285 238429 363 8 55 0 +
Recv – received into DB2Sent – out to client/apps
Is buffering occurring?
Thread creation queues?
HWM of DBAT usage
Bytes and messages sent and received

IBM Software Group | Tivoli software
16
Accounting TracesThe Starting Point For DB2 Application Analysis
� Data written @ thread termination
� Five main classes of accounting traces
� Written to SMF as a type 101 record
Accounting Class 1Thread elapsed times,
SQL stats, Buffer & lock stats
Accounting Class 2“In-DB2” Time
Accounting Class 3“Wait” times and counts
IFCID 3
SMF Type 101
-START TRACE (ACCTG) CLASS (1,2,3,7,8)
Accounting Class 7 “In-DB2” Package level
Accounting Class 8“Wait” times Package level

IBM Software Group | Tivoli software
17
First Example - Accounting Information
> DISTRIBUTED THREAD DETAIL PLAN
+ Thread: Plan=DISTSERV Connid=SERVER Corrid=db2bp.exe Authid=DNET581 + Dist : Type=DATABASE ACCESS, Luwid=G941491B.PA10.090604181240=168 + Location : 9.65.73.27 rsum
+ Distributed TCP/IP Data +Location IP Addr Port Ctbuser Srvclsnam Prod ID Workstation Name +---------------- -------- ---- -------- ---------- -------- ------------------+9.65.73.27 0941491B 448 dnet581 NT SQL09013 IBM-1E47754C52F + + Transaction name: db2bp.exe + TCP/IP Userid: dnet581 + + Distributed SQL Statistics + + Remote Location Name = 9.65.73.27 Remote Location Luname = + + Protocol Used = Conversations Queued = 0 + Block Mode Switches = 0 Message Buffer Rows = 0 + Bind Remote Access = 0 Max Allocated Conv = 0 + Conv Allocated = 0 Conv Deallocated = 0 + Indoubt/Remote = 0 Commit/Remote = 0 + Rollback/Remote = 0 + + Tran SQL Row Message Byte Commit Abort Conv Blocks + ------- ------- ------- ------- -------- ------- ------- ------- -------+ Sent 0 0 4 54 47953 0 0 0 20 + Recv 1 40 0 54 4625 10 0 1 0 + + Last 2-Phase Commit Backout+ 2-PHASE COMMIT: Prepare Agent Commit Backout Forget Resp Resp+ ------- ------- -------- ------- ------- ------- -------+ Sent 0 0 0 0 0 0 0 + Recv 0 0 0 0 0 0 0 ===============================================================================
Note no buffering
Multiple executions of a single-row SELECT statement
SELECT * FROM TABLEAWHERE NAME = ‘AAA’
Sample invoked 10 times
# of messages sent DRDA blocks for queries# SQL calls
Recv – received into DB2Sent – out to client/app

IBM Software Group | Tivoli software
18
First Example – Accounting SQL Counts
> CURRENT SQL COUNTS PLAN
+ Thread: Plan=DISTSERV Connid=SERVER Corrid=db2bp.exe Authid=DNET581 + Dist : Type=DATABASE ACCESS, Luwid=G941491B.PA10.090604181240=168 + Location : 9.65.73.27 sqls
+ Commit = 10 Abort = 0 Select = 0 + Open Cursor = 10 Close Cursor = 0 Fetch = 10 + Insert = 0 Delete = 0 Update = 0 + Describe = 10 Lock Table = 0 Prepare = 10 + Grant = 0 Revoke = 0 Set Rules = 0 + Increm Bind = 0 Label/Comm On = 0 Set SQLID = 0 + Set Host Var = 0 Set Connection = 0 Set Degree = 0 + Connect Type 1 = 0 Connect Type 2 = 0 Set Path = 0 + Rename Table = 0 Hold Locator = 0 Free Locator = 0 + Release = 0 Assoc Locator = 0 Allocate Cursor = 0 + + + SQL Call Statements = 0 SQL Calls Timed Out = 0 + Stored Proc SQL Reqs = 0 SQL Calls Rejected = 0 + Stored Procedures Abended = 0 + + UDFs Executed = 0 UDFs ABENDed = 0 + UDFs Timed Out = 0 UDFs Rejected = 0 + + Stmt Triggers Activated = 0 Row Triggers Activated = 0 + SQL Error in Trigger = 0 Maximum Nested SQL = 0 + + Prepare Statistics: + Copied from Cache = 10 Implicit - KEEPDYNAMIC(YES) = 0 + No Match = 0 Avoided - KEEPDYNAMIC(YES) = 0 + Discarded - MAXKEEPD = 0 Purged - DROP/ALTER/REVOKE = 0 +
Sample call was invoked 10 times. This can be easily seen from the pattern of call counts.
Same call invoked multiple times results in DSC cache hits
SPs were not called in this example

IBM Software Group | Tivoli software
19
First Example Accounting Information
> THREAD DETAIL PLAN
+ Thread: Plan=DISTSERV Connid=SERVER Corrid=db2bp.exe Authid=DNET581 + Dist : Type=DATABASE ACCESS, Luwid=G941491B.PA10.090604181240=168 + Location : 9.65.73.27 act
+ Thread Activity User Defined Functions+ ------------------------------------- -------------------------------------+ DB2 Status = WAIT-REMREQ TCB Time (SQL) = 00:00:00.000 + MVS Status = Wait for TCB Time = 00:00:00.000 + Total Elapsed Time = 00:07:45.561 Elapsed Time = 00:00:00.000 + CP CPU Utilization = 00.0% Elapsed Time (SQL) = 00:00:00.000 + Total CP CPU Time = 00:00:00.082 SQL Events = 0 + IIP CPU Time = 00:00:00.000 + Total Parallel Tasks = 0 + Current Parallel Tasks= 0 + + Stored Procedures Triggers + ------------------------------------- -------------------------------------+ Total CPU = 00:00:00.000 TCB not in Enclave = 00:00:00.000 + Elapsed time = 00:00:00.000 Elapsed not in Enclave = 00:00:00.000 + Elapsed Time (SQL) = 00:00:00.000 TCB prior to Enclave = 00:00:00.000 + Wait for TCB Time = 00:00:00.000 + Wait Event Count = 0 + Curr Wait TCB Time = 00:00:00.000 + + SavePoints+ -------------------------------------+ Savepoint Requests = 0 + Release Savepoints = 0 + Rollback Savepoints = 0 + + In-DB2 Times Total Current + ------------------------------ ------------ ------------+ Elapsed Time 00:00:00.079 00:00:00.000 + CP CPU Time 00:00:00.033 00:00:00.000 + IIP CPU Time 00:00:00.041 N/A + Stored Procedure CPU Time 00:00:00.000 00:00:00.000+ + Waits Count Total Current + --------------------------------- ---------- ------------ ------------+ Synchronous I/O Wait 0 00:00:00.000 00:00:00.000+ Asynchronous Read I/O Wait 0 00:00:00.000 00:00:00.000+ Asynchronous Write I/O Wait 0 00:00:00.000 00:00:00.000+ Local Lock/Latch Wait 0 00:00:00.000 00:00:00.000+ Page Latch Wait 0 00:00:00.000 00:00:00.000+ Drain Lock Wait 0 00:00:00.000 00:00:00.000+ Drain of Claims Wait 0 00:00:00.000 00:00:00.000+ Archive Log Mode(Quiesce) Wait 0 00:00:00.000 00:00:00.000+ Archive Read from Tape Wait 0 00:00:00.000 00:00:00.000+ Switch to Open/Close Wait 0 00:00:00.000 00:00:00.000+ Switch to SYSLGRNG Service Wait 0 00:00:00.000 00:00:00.000+ Switch to DMS Waits 0 00:00:00.000 00:00:00.000+ Other Service Waits 0 00:00:00.000 00:00:00.000+ Force at Commit Waits 0 00:00:00.000 00:00:00.000+ Log Write I/O Wait 0 00:00:00.000 00:00:00.000+ Sync EX Unit Sw-com/abort/dealloc 0 00:00:00.000 00:00:00.000+ ------------------------------------------------------------+ Total Class 3 Wait Time 00:00:00.000
Elapsed time includes ‘think’ time between calls to DB2
IN-DB2 time represents time executing the calls
CPU times shows general CP time and time on zIIP
No delays in this example

IBM Software Group | Tivoli software
20
> ENCLAVE DETAIL INFORMATION PLAN
+ Thread: Plan=DISTSERV Connid=SERVER Corrid=db2bp.exe Authid=DNET581 + Dist : Type=DATABASE ACCESS, Luwid=G941491B.FA05.090605140121=294 + Location : 9.65.73.27 enc
+ ENCLAVE TOKEN: 5C0002D6C9 Enclave Type: Original Indep+ Owning System: DEMOMVS Owning Job: DSNCDIST + WLM Mode: Goal Enclave CPU Time 00:00:00.007 + + SERVICE PERIOD INFORMATION + Period(s) for Service Class DDFDEF: 2 + Current Period for This Thread: 1 + Performance Index This Period: .50 + + +----------------------------- Period Number + | +--------------------------- Importance + | | +------------------------- Duration in Service Units + | | | +------------------- Percentile + | | | | +-------------- Response Time Goal or Velocity + | | | | | +-------- Response Time Unit + | | | | | | Goal Description + - - +---- +--- +---- +-------- -------------------+ 1 3 500 80% 2500 MilliSecs Percentile Response Time Goal + 2 4 .20 Velocity Goal + + SERVICE CLASS INFORMATION + CPU Critical: No Storage Protection: No + + Name Description + -------- --------------------------------+ Service Class: DDFDEF DDF Default + Workload: DB_WKL database workloads + Resource Group: + Report Class: RDDFDEF default for ddf+ + WLM APPLICATION ENVIRONMENT + Application Environment Name: NO WLM ENVIRONMENT + Description: + Subsystem Type: + WLM Started Task Procedure Name: + Start Parameters: + + + CLASSIFICATION WORK QUALIFIERS + Subsystem Type: DDF Correlation: DB2BP.EXE + Proc Name: Trans Program Name: + UserId: DNET581 Transaction Class: + Network ID: Logical Unit Name: + Plan Name: DISTSERV Package Name: SQLC2F0A + Connection: SERVER Collection: NULLID + Function Name: DB2_DRDA Subsystem Name: DSNC + Accounting Info: SQL09013NT Subsystem Parm: DNET581 + Perform: Subsystem Priority: N/A+ Scheduling Env: Subsys Coll Name: + Process Name: DB2BP.EXE + + Performance Index Input Data for Percentile Response Time Goal+ Observations: 14 Percent Count of Transacti+ --------- ------------------+ Goal Percentile This Observation ---> 50% 165707 + 60% 62
Thread Enclave Information
See enclave token, WLM service class, and service class performance index (PI)
What service class is this thread executing in?
WLM qualifiers used to select service class

IBM Software Group | Tivoli software
21
Don’t Overlook The Importance Of WLM And Enclave Priority To Performance
� Each Enclave is an individual transaction to be managed by priorities as defined in Workload Manager
�As a DDF request arrives in DB2 an enclave is created to tie together the SRB tasks and to allow WLM to set its priority
ssnmDIST
DDF
SRB
Enclave
ssnmDBM1
Query
Rows Returned
SRB
DB2
WLMPriority
Client
IBM Software Group | Tivoli software
22
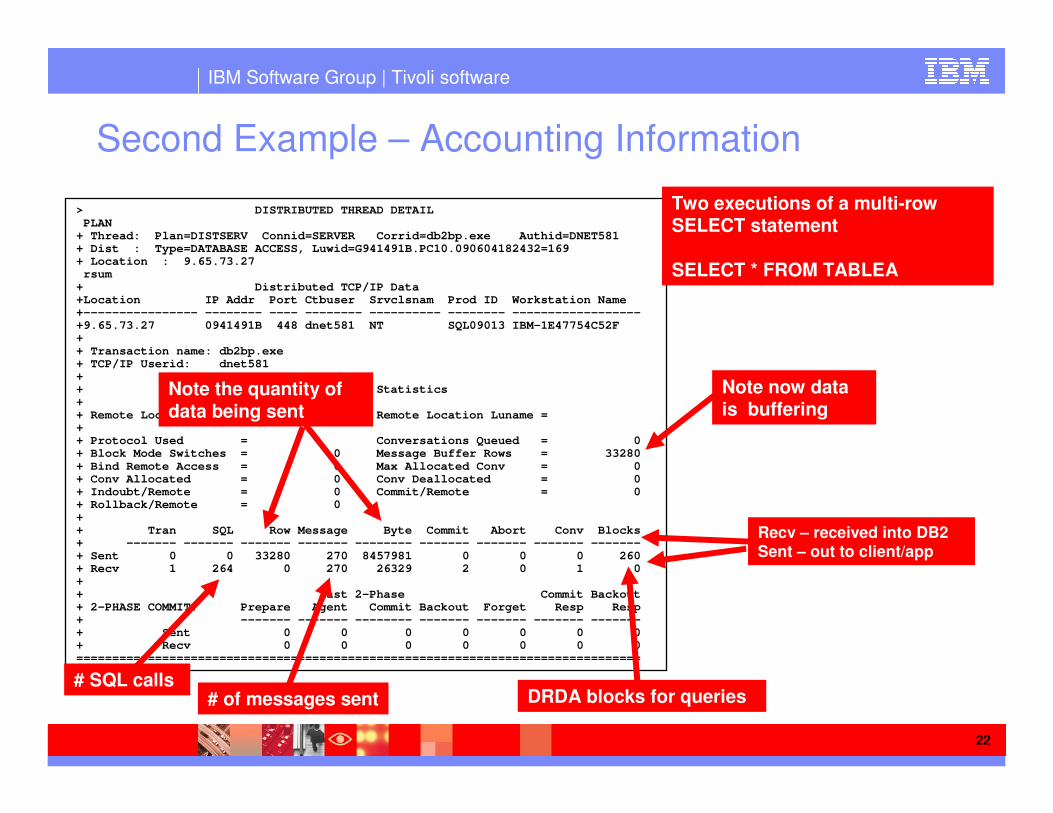
> DISTRIBUTED THREAD DETAIL PLAN + Thread: Plan=DISTSERV Connid=SERVER Corrid=db2bp.exe Authid=DNET581 + Dist : Type=DATABASE ACCESS, Luwid=G941491B.PC10.090604182432=169 + Location : 9.65.73.27 rsum+ Distributed TCP/IP Data +Location IP Addr Port Ctbuser Srvclsnam Prod ID Workstation Name +---------------- -------- ---- -------- ---------- -------- ------------------+9.65.73.27 0941491B 448 dnet581 NT SQL09013 IBM-1E47754C52F + + Transaction name: db2bp.exe + TCP/IP Userid: dnet581 + + Distributed SQL Statistics + + Remote Location Name = 9.65.73.27 Remote Location Luname = + + Protocol Used = Conversations Queued = 0 + Block Mode Switches = 0 Message Buffer Rows = 33280 + Bind Remote Access = 0 Max Allocated Conv = 0 + Conv Allocated = 0 Conv Deallocated = 0+ Indoubt/Remote = 0 Commit/Remote = 0+ Rollback/Remote = 0 + + Tran SQL Row Message Byte Commit Abort Conv Blocks+ ------- ------- ------- ------- -------- ------- ------- ------- -------+ Sent 0 0 33280 270 8457981 0 0 0 260+ Recv 1 264 0 270 26329 2 0 1 0+ + Last 2-Phase Commit Backout+ 2-PHASE COMMIT: Prepare Agent Commit Backout Forget Resp Resp+ ------- ------- -------- ------- ------- ------- -------+ Sent 0 0 0 0 0 0 0+ Recv 0 0 0 0 0 0 0===============================================================================
Second Example – Accounting Information
Note now data is buffering
Two executions of a multi-row SELECT statement
SELECT * FROM TABLEA
# of messages sent DRDA blocks for queries# SQL calls
Recv – received into DB2Sent – out to client/app
Note the quantity of data being sent

IBM Software Group | Tivoli software
23
> CURRENT SQL COUNTS PLAN + Thread: Plan=DISTSERV Connid=SERVER Corrid=db2bp.exe Authid=DNET581 + Dist : Type=DATABASE ACCESS, Luwid=G941491B.PC10.090604182432=169 + Location : 9.65.73.27 sqls+ Commit = 2 Abort = 0 Select = 0 + Open Cursor = 2 Close Cursor = 0 Fetch = 258 + Insert = 0 Delete = 0 Update = 0 + Describe = 2 Lock Table = 0 Prepare = 2 + Grant = 0 Revoke = 0 Set Rules = 0 + Increm Bind = 0 Label/Comm On = 0 Set SQLID = 0 + Set Host Var = 0 Set Connection = 0 Set Degree = 0 + Connect Type 1 = 0 Connect Type 2 = 0 Set Path = 0 + Rename Table = 0 Hold Locator = 0 Free Locator = 0 + Release = 0 Assoc Locator = 0 Allocate Cursor = 0 + + SQL Call Statements = 0 SQL Calls Timed Out = 0 + Stored Proc SQL Reqs = 0 SQL Calls Rejected = 0 + Stored Procedures Abended = 0 + + UDFs Executed = 0 UDFs ABENDed = 0 + UDFs Timed Out = 0 UDFs Rejected = 0 + + Stmt Triggers Activated = 0 Row Triggers Activated = 0 + SQL Error in Trigger = 0 Maximum Nested SQL = 0 + + Prepare Statistics: + Copied from Cache = 2 Implicit - KEEPDYNAMIC(YES) = 0 + No Match = 0 Avoided - KEEPDYNAMIC(YES) = 0 + Discarded - MAXKEEPD = 0 Purged - DROP/ALTER/REVOKE = 0 +
Second Example – Accounting SQL Counts
Sample call was invoked twice. This can be seen from the pattern of call counts (2 Open Cursors and 258 Fetches).
Same call invoked multiple times results in DSC cache hits
SPs were not called in this example

IBM Software Group | Tivoli software
24
> THREAD DETAIL PLAN
+ Thread: Plan=DISTSERV Connid=SERVER Corrid=db2bp.exe Authid=DNET581 + Dist : Type=DATABASE ACCESS, Luwid=G941491B.PC10.090604182432=169 + Location : 9.65.73.27 act
+ Thread Activity User Defined Functions+ ------------------------------------- -------------------------------------+ DB2 Status = WAIT-REMREQ TCB Time (SQL) = 00:00:00.000 + MVS Status = Wait for TCB Time = 00:00:00.000 + Total Elapsed Time = 00:08:20.797 Elapsed Time = 00:00:00.000 + CP CPU Utilization = 00.0% Elapsed Time (SQL) = 00:00:00.000 + Total CP CPU Time = 00:00:00.839 SQL Events = 0 + IIP CPU Time = 00:00:00.000 + Total Parallel Tasks = 0 + Current Parallel Tasks= 0 + + Stored Procedures Triggers + ------------------------------------- -------------------------------------+ Total CPU = 00:00:00.000 TCB not in Enclave = 00:00:00.000 + Elapsed time = 00:00:00.000 Elapsed not in Enclave = 00:00:00.000 + Elapsed Time (SQL) = 00:00:00.000 TCB prior to Enclave = 00:00:00.000 + Wait for TCB Time = 00:00:00.000 + Wait Event Count = 0 + Curr Wait TCB Time = 00:00:00.000 + + SavePoints+ -------------------------------------+ Savepoint Requests = 0 + Release Savepoints = 0 + Rollback Savepoints = 0 + + In-DB2 Times Total Current + ------------------------------ ------------ ------------+ Elapsed Time 00:00:23.032 00:00:00.000 + CP CPU Time 00:00:00.353 00:00:00.000 + IIP CPU Time 00:00:00.422 N/A + Stored Procedure CPU Time 00:00:00.000 00:00:00.000+ + Waits Count Total Current + --------------------------------- ---------- ------------ ------------+ Synchronous I/O Wait 444 00:00:01.910 00:00:00.000 + Asynchronous Read I/O Wait 2150 00:00:20.296 00:00:00.000 + Asynchronous Write I/O Wait 0 00:00:00.000 00:00:00.000+ Local Lock/Latch Wait 439 00:00:00.002 00:00:00.000 + Page Latch Wait 0 00:00:00.000 00:00:00.000+ Drain Lock Wait 0 00:00:00.000 00:00:00.000+ Drain of Claims Wait 0 00:00:00.000 00:00:00.000+ Archive Log Mode(Quiesce) Wait 0 00:00:00.000 00:00:00.000+ Archive Read from Tape Wait 0 00:00:00.000 00:00:00.000+ Switch to Open/Close Wait 0 00:00:00.000 00:00:00.000+ Switch to SYSLGRNG Service Wait 0 00:00:00.000 00:00:00.000+ Switch to DMS Waits 0 00:00:00.000 00:00:00.000+ Other Service Waits 0 00:00:00.000 00:00:00.000+ Force at Commit Waits 0 00:00:00.000 00:00:00.000+ Log Write I/O Wait 0 00:00:00.000 00:00:00.000+ Sync EX Unit Sw-com/abort/dealloc 0 00:00:00.000 00:00:00.000+ ------------------------------------------------------------+ Total Class 3 Wait Time 00:00:22.209
Second Example Accounting Information
Elapsed time includes ‘think’ time between calls to DB2
IN-DB2 time represents time executing the calls. Most of this time is I/O delays (see below).
CPU times shows general CP time and time on zIIP
I/O and Lock/latch delays in this example due to larger result set being retrieved

IBM Software Group | Tivoli software
Network Analysis ToolsPING Command
� PING is a simple, but highly useful command
� Verifies connection between hosts by sending ICMP packets to the specified
address (IP address or hostname)
� PING shows the time to echo a packet
� Beware - in some shops PING may have limitations
PING hostname -l # of bytes in echo packetPING hostname -n # of packets to echo
PING hostname -r record the route of the packetPING hostname -s report timestamps of hops
64 bytes from 198.210.45.27:icmp_seq=0 ttl=253 time=0.345 ms64 bytes from 198.210.45.27:icmp_seq=1 ttl=253 time=0.345 ms
64 bytes from 198.210.45.27:icmp_seq=2 ttl=253 time=0.345 ms
IBM Software Group | Tivoli software
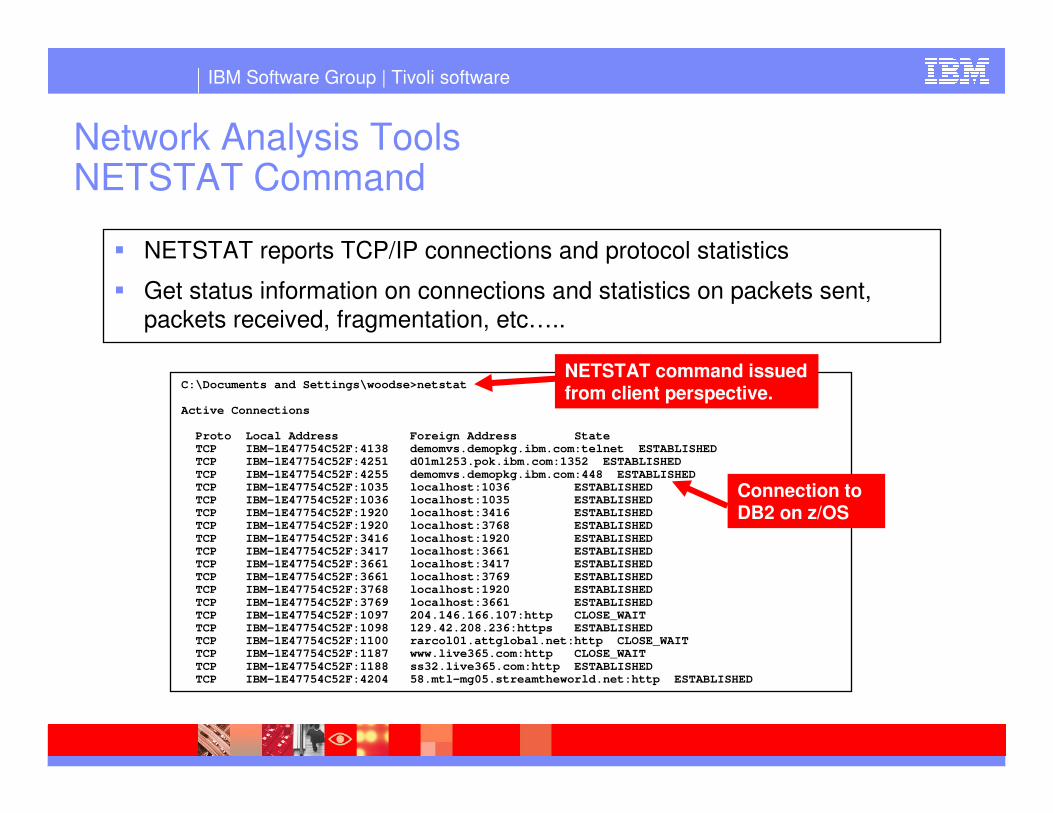
Network Analysis ToolsNETSTAT Command
� NETSTAT reports TCP/IP connections and protocol statistics
� Get status information on connections and statistics on packets sent,
packets received, fragmentation, etc…..
C:\Documents and Settings\woodse>netstat
Active Connections
Proto Local Address Foreign Address StateTCP IBM-1E47754C52F:4138 demomvs.demopkg.ibm.com:telnet ESTABLISHEDTCP IBM-1E47754C52F:4251 d01ml253.pok.ibm.com:1352 ESTABLISHEDTCP IBM-1E47754C52F:4255 demomvs.demopkg.ibm.com:448 ESTABLISHEDTCP IBM-1E47754C52F:1035 localhost:1036 ESTABLISHEDTCP IBM-1E47754C52F:1036 localhost:1035 ESTABLISHEDTCP IBM-1E47754C52F:1920 localhost:3416 ESTABLISHEDTCP IBM-1E47754C52F:1920 localhost:3768 ESTABLISHEDTCP IBM-1E47754C52F:3416 localhost:1920 ESTABLISHEDTCP IBM-1E47754C52F:3417 localhost:3661 ESTABLISHEDTCP IBM-1E47754C52F:3661 localhost:3417 ESTABLISHEDTCP IBM-1E47754C52F:3661 localhost:3769 ESTABLISHEDTCP IBM-1E47754C52F:3768 localhost:1920 ESTABLISHEDTCP IBM-1E47754C52F:3769 localhost:3661 ESTABLISHEDTCP IBM-1E47754C52F:1097 204.146.166.107:http CLOSE_WAITTCP IBM-1E47754C52F:1098 129.42.208.236:https ESTABLISHEDTCP IBM-1E47754C52F:1100 rarcol01.attglobal.net:http CLOSE_WAITTCP IBM-1E47754C52F:1187 www.live365.com:http CLOSE_WAITTCP IBM-1E47754C52F:1188 ss32.live365.com:http ESTABLISHEDTCP IBM-1E47754C52F:4204 58.mtl-mg05.streamtheworld.net:http ESTABLISHED
NETSTAT command issued from client perspective.
Connection to DB2 on z/OS

IBM Software Group | Tivoli software
27
NETSTAT CommandDisplay Connections To A Specific Port
netstat conn (port 448)
EZZ2350I MVS TCP/IP NETSTAT CS V1R10 TCPIP Name: TCPIP 19:10:22EZZ2585I User Id Conn Local Socket Foreign Socket State EZZ2586I ------- ---- ------------ -------------- -----EZZ2587I DSNCDIST 0000C90E 9.39.68.147..448 9.65.73.27..4255 Establ
shEZZ2587I DSNCDIST 0000005B 0.0.0.0..448 0.0.0.0..0 Listen
Connection to DB2 on z/OS
Command can be filtered a variety of ways including IP address and port number
IBM Software Group | Tivoli software
28
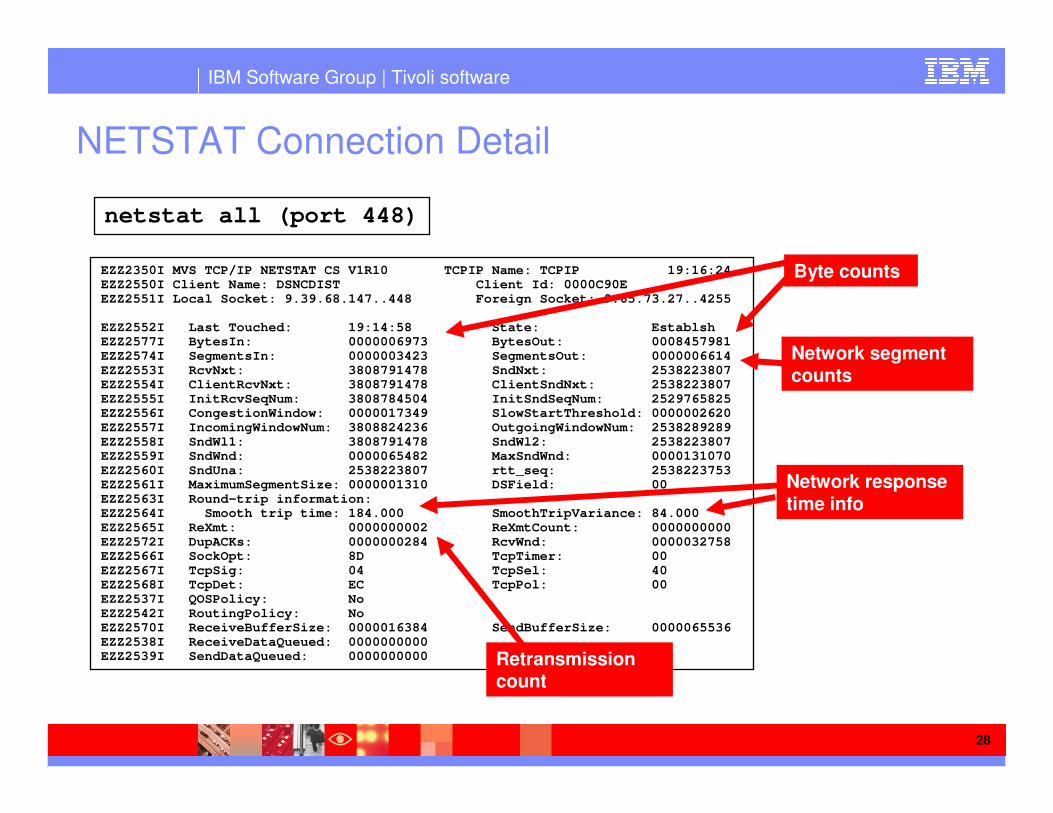
NETSTAT Connection Detail
netstat all (port 448)
EZZ2350I MVS TCP/IP NETSTAT CS V1R10 TCPIP Name: TCPIP 19:16:24EZZ2550I Client Name: DSNCDIST Client Id: 0000C90E EZZ2551I Local Socket: 9.39.68.147..448 Foreign Socket: 9.65.73.27..4255
EZZ2552I Last Touched: 19:14:58 State: EstablshEZZ2577I BytesIn: 0000006973 BytesOut: 0008457981EZZ2574I SegmentsIn: 0000003423 SegmentsOut: 0000006614EZZ2553I RcvNxt: 3808791478 SndNxt: 2538223807EZZ2554I ClientRcvNxt: 3808791478 ClientSndNxt: 2538223807EZZ2555I InitRcvSeqNum: 3808784504 InitSndSeqNum: 2529765825EZZ2556I CongestionWindow: 0000017349 SlowStartThreshold: 0000002620EZZ2557I IncomingWindowNum: 3808824236 OutgoingWindowNum: 2538289289EZZ2558I SndWl1: 3808791478 SndWl2: 2538223807EZZ2559I SndWnd: 0000065482 MaxSndWnd: 0000131070EZZ2560I SndUna: 2538223807 rtt_seq: 2538223753EZZ2561I MaximumSegmentSize: 0000001310 DSField: 00 EZZ2563I Round-trip information: EZZ2564I Smooth trip time: 184.000 SmoothTripVariance: 84.000 EZZ2565I ReXmt: 0000000002 ReXmtCount: 0000000000EZZ2572I DupACKs: 0000000284 RcvWnd: 0000032758EZZ2566I SockOpt: 8D TcpTimer: 00 EZZ2567I TcpSig: 04 TcpSel: 40 EZZ2568I TcpDet: EC TcpPol: 00 EZZ2537I QOSPolicy: No EZZ2542I RoutingPolicy: No EZZ2570I ReceiveBufferSize: 0000016384 SendBufferSize: 0000065536EZZ2538I ReceiveDataQueued: 0000000000 EZZ2539I SendDataQueued: 0000000000
Byte counts
Network segment counts
Network response time info
Retransmission count

IBM Software Group | Tivoli software
29
NETSTAT CONFIG
EZZ2350I MVS TCP/IP NETSTAT CS V1R10 TCPIP Name: TCPIP 19:04:15EZZ2720I TCP Configuration Table: EZZ2721I DefaultRcvBufSize: 00016384 DefaultSndBufSize: 00016384 EZZ2727I DefltMaxRcvBufSize: 00262144 SoMaxConn: 0000000010 EZZ2722I MaxReTransmitTime: 120.000 MinReTransmitTime: 0.500 EZZ2723I RoundTripGain: 0.125 VarianceGain: 0.250 EZZ2724I VarianceMultiplier: 2.000 MaxSegLifeTime: 30.000 EZZ2725I DefaultKeepALive: 00000120 DelayAck: Yes EZZ2726I RestrictLowPort: Yes SendGarbage: No EZZ2728I TcpTimeStamp: Yes FinWait2Time: 600 EZZ2729I TTLS: No
EZZ2730I UDP Configuration Table: EZZ2731I DefaultRcvBufSize: 00065535 DefaultSndBufSize: 00065535 EZZ2732I CheckSum: Yes EZZ2733I RestrictLowPort: Yes UdpQueueLimit: Yes
EZZ2735I IP Configuration Table: EZZ2736I Forwarding: Yes TimeToLive: 00064 RsmTimeOut: 00060 EZZ3073I IpSecurity: No EZZ2753I ArpTimeout: 01200 MaxRsmSize: 65535 Format: Short EZZ2738I IgRedirect: No SysplxRout: No DoubleNop: No EZZ2739I StopClawEr: No SourceVipa: No EZZ2740I MultiPath: No PathMtuDsc: No DevRtryDur: 0000000090 EZZ2750I DynamicXCF: No EZZ2746I IQDIORoute: No EZZ3070I TcpStackSrcVipa: No
Keepalive timer
TCPCONFIG
UDPCONFIG
IPCONFIG

IBM Software Group | Tivoli software
30
Providing Workload Classification Attributes To DB2
� Send accounting, user, and application information to DB2
�Provides more information for analysis purposes
�Allows the system more information for WLM prioritization
� ODBC/CLI/VB/ADO ... applications
�Use SQLSetConnectionAttr on:
� SQL_ATTR_INFO_ACCTSTR - accounting string (AI)
� SQL_ATTR_INFO_APPLNAME - application name (PC)
� SQL_ATTR_INFO_USERID - client userid
� SQL_ATTR_INFO_WRKSTNNAME - client workstation name
� Universal Driver for Java applications (JCC T2 or T4)
�Use methods against connection class instance
� setClientUser
� setClientApplicationInformation,
� setClientWorkStation
� setClientAccountingInformation
IBM Software Group | Tivoli software
31
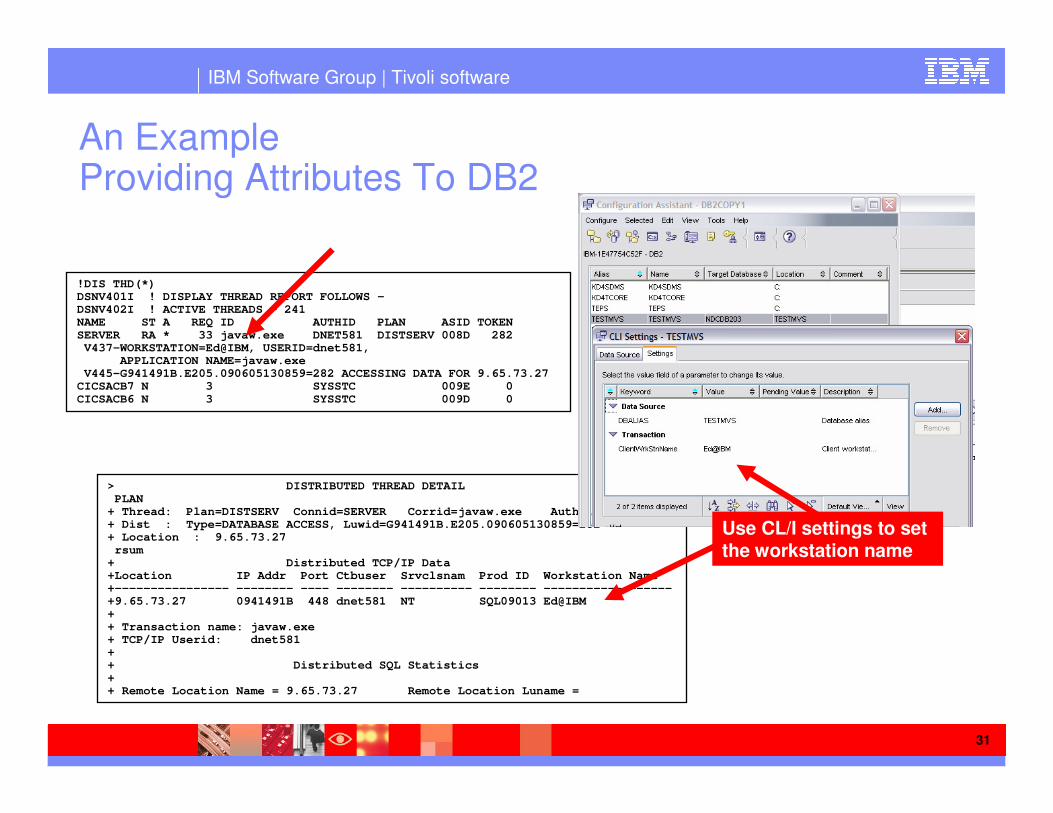
An ExampleProviding Attributes To DB2
!DIS THD(*) DSNV401I ! DISPLAY THREAD REPORT FOLLOWS -DSNV402I ! ACTIVE THREADS - 241 NAME ST A REQ ID AUTHID PLAN ASID TOKEN SERVER RA * 33 javaw.exe DNET581 DISTSERV 008D 282 V437-WORKSTATION=Ed@IBM, USERID=dnet581,
APPLICATION NAME=javaw.exeV445-G941491B.E205.090605130859=282 ACCESSING DATA FOR 9.65.73.27 CICSACB7 N 3 SYSSTC 009E 0 CICSACB6 N 3 SYSSTC 009D 0
> DISTRIBUTED THREAD DETAIL PLAN + Thread: Plan=DISTSERV Connid=SERVER Corrid=javaw.exe Authid=DNET581 + Dist : Type=DATABASE ACCESS, Luwid=G941491B.E205.090605130859=282 + Location : 9.65.73.27 rsum+ Distributed TCP/IP Data +Location IP Addr Port Ctbuser Srvclsnam Prod ID Workstation Name +---------------- -------- ---- -------- ---------- -------- ------------------+9.65.73.27 0941491B 448 dnet581 NT SQL09013 Ed@IBM+ + Transaction name: javaw.exe+ TCP/IP Userid: dnet581 + + Distributed SQL Statistics + + Remote Location Name = 9.65.73.27 Remote Location Luname =
Use CL/I settings to set the workstation name

IBM Software Group | Tivoli software
32
What Is ARM?
� ARM – An open industry standard
�The Open Group ARM Standard V4.0
�Application Response time Monitoring
�A standard for how to enable the instrumentation of applications
� ARM enablement provides important performance analysis information
�The ability to measure and break down performance by applicationcomponent layer
�Enable the ability to determine the application time line
� Two key components to ARM
�Application instrumentation to provide timing information
�Collection agent to gather response time information

IBM Software Group | Tivoli software
Summary - Optimizing PerformanceTuning The Requesting System
� Minimize message traffic between the requestor and the server
�Optimize SQL
�Reduce the number of SQL statements
�Use Stored Procedures to reduce SQL traffic
�Use RELEASE SQL statement to release remote connections no longer needed
�Use DEFER(PREPARE) to reduce back and forth message traffic
�Do not request more columns of data than needed
�Optimize for ‘n’ rows

IBM Software Group | Tivoli software
Summary - Optimizing PerformanceTuning The Server
� Consider DB2 thread connection issues
�Queuing for an available thread
� Consider DB2 SQL delays and long running SQL
�SQL cache performance
�Database I/O and database wait analysis
�CPU, memory, and resource availability
�Database lock contention
�SQL call optimization and Explain analysis
� Operating system delays
�Proper WLM classification and goals
� Goals for threads and DB2 address spaces
�SP address space management

IBM Software Group | Tivoli software
35
Thank You!