Understanding the Impact of Communication Delays on ...
179
Understanding the Impact of Communication Delays on Distributed Team Interaction Andrea S. Krausman Dissertation submitted to the Faculty of the Virginia Polytechnic Institute and State University in partial fulfillment of the requirement for the degree of Doctor of Philosophy In Industrial and Systems Engineering Brian M. Kleiner, Committee Chair Maury A. Nussbaum Joseph L. Gabbard Jessie Y. C. Chen March 7, 2019 Blacksburg, VA Keywords: distributed teams, computer-mediated communication, network delays
Transcript of Understanding the Impact of Communication Delays on ...
Understanding the Impact of Communication Delays on Distributed Team Interaction
Andrea S. Krausman
Dissertation submitted to the Faculty of the Virginia Polytechnic Institute and State University
in partial fulfillment of the requirement for the degree of
Doctor of Philosophy
In Industrial and Systems Engineering
Brian M. Kleiner, Committee Chair
Maury A. Nussbaum
Joseph L. Gabbard
Jessie Y. C. Chen
March 7, 2019
Blacksburg, VA
Keywords: distributed teams, computer-mediated communication, network delays

Understanding the Impact of Communication Delays on Distributed Team Interaction
Andrea S. Krausman
ABSTRACT
Communication delay in distributed teams is salient problem, especially in operational
settings where communication is critical to team safety and success. The present study
investigated the impact of communication delays on distributed team performance and processes,
and if being able to see one’s team member would lessen the effects of delays. In addition, team
gender composition was investigated, to see how delays affected the interactions of same and
mixed-gender teams, as well as teams with familiar and unfamiliar members. Lastly, a
supplemental analysis was performed on a subset of the experimental data to determine if teams
with familiar members’ communicated more efficiently than unfamiliar teams when coordination
complexity was high.
Thirty distributed dyads, were assigned the role of intelligence analysts, and performed a
collaborative problem solving task, using audioconferencing and videoconferencing
technologies. During the task, participants verbally shared and discussed information in order to
solve a fictitious terror plot. Communication between team members was delayed by 0 ms, 800,
or 1600 ms. Linear mixed models showed that participants took longer to solve the task at the
800 ms delay. Task accuracy was not affected by delays. At the 1600 ms delay, participants
shared less information with each other, and rated their frustration higher compared to the 0 ms
delay. Audiovisual technology affected overall workload scores, with lower scores at the 0 ms
delay compared to the 800 ms delay. Although delays did not have the anticipated effect on
familiar and same-gender teams, there were some interactive effects of interest. Specifically, in
gender-diverse teams task accuracy was higher with audiovisual technology than audio-alone,
but this effect was independent of delays. Also, familiar teams exhibited higher levels of
cognitive trust across all levels of delay and technology. Results of the supplemental analysis
showed no differences in communication efficiency between familiar and unfamiliar teams when
coordination complexity was high. Based on the results of this work, recommendations were
proposed for strategies to lessen the effects of communication delays and future research
directions were outlined.

Understanding the Impact of Communication Delays on Distributed Team Interaction
Andrea S. Krausman
GENERAL AUDIENCE ABSTRACT
Communication delay in distributed teams is salient problem, especially in operational
settings where communication is critical to team safety and success. In previous work,
communication delays have been shown to disrupt turn-taking in conversations and create
instances of overlaps or interruptions. The present study was conducted to further investigate the
effects of communication delays on various aspects of distributed team performance and to
determine if being able to see one’s team member via video technology may potentially lessen
the effects of delays. In addition, team gender composition was investigated, to see how delays
affected the interactions of same and mixed-gender teams, as well as teams with familiar and
unfamiliar members. Lastly, a supplemental analysis was performed using a subset of the
experimental data to determine if teams with familiar members’ communicated more efficiently
than unfamiliar teams when coordination complexity was high.
Thirty distributed teams of two members or dyads, performed a collaborative problem
solving task, using audioconferencing and videoconferencing technologies. During the task,
participants verbally shared and discussed information in order to identify the solution to a
fictitious terror plot. Communication between team members was delayed by 0 ms, 800, or 1600
ms. Overall, results showed that participants took longer to solve the task at the 800 ms delay,
with no effects on task accuracy. At the 1600 ms delay, participants shared less information with
each other, and rated their frustration higher compared to the 0 ms delay. When teams used
audiovisual technology, workload scores were lower at 0 ms compared to the 800 ms delay.
Although delays did not have the anticipated effects on familiar and same-gender teams, there
were some other interesting effects that emerged. Namely, gender-diverse teams scored higher
accuracy with audiovisual technology than audio-alone, but this effect was independent of
delays. Also, teams with familiar members exhibited higher levels of cognitive trust across all
levels of delay and technology. Results of the supplemental analysis showed that unfamiliar
teams communicated more efficiently with audiovisual technology, but only when coordination
complexity was low

iv
Acknowledgements
There are many people I would like to acknowledge for their support during this journey. First
and foremost, I want to thank God for providing this opportunity and the grace, strength, and
help that enabled me to persevere and cross the finish line.
A deep, heartfelt, THANK YOU to my husband, Bob, who willingly and happily walked this
path with me, and provided unwavering support throughout this project. I know I could never
have done this without you, and I am forever grateful for the gift of your patience, love and
friendship.
I would also like to express my heartfelt gratitude to the Army Research Laboratory (ARL) for
affording me the opportunity to comoplete this degree, providing financial support, and your
patience in the process. Thank you for your investment in me.
To my committee members: Dr. Brian Kleiner, Dr. Joe Gabbard, Dr. Maury Nussbaum, and Dr.
Jessie Chen, I am grateful for the opportunity to learn from each one you not only during the
course of this project, but during my time at Virginia Tech. Having the opportunity to glean
from your expertise and the way you challenged me to think “outside the box” has helped me
finish this project and has equipped me for much success in the future. Without your patience
and guidance, this work would not have been possible.
A special thank you to the many friends and colleagues within ARL who played a vital role in
the success of this project, there are too many to list here, but I wanted to recognize:
- Patty Burcham, for her assistance with the vision screening of participants, and for help with listening to endless audio files and transcribing volumes of data.
- Ashley Foots and Rachel Weatherless for their assistance with the auditory screening of participants.
- Jennifer Swoboda and Kathy Kehring, for help listening to hours upon hours of audio files and for their constant support and encouragement to keep moving forward.
- Kristin Schaeffer and Tony Baker for their enthusiastic support during the writing process and giving me such excellent and helpful feedback. This manuscript is much better because of your input. I also appreciate your persistence reminders that finishing is within reach, and to keep moving forward even when it seemed like things weren’t going anywhere.

v
To all of the research participants: thank you for your willingness to take time out of your busy
schedule to support this research. Without you, this work would not have been completed!
There are many friends and family members, too many to list here, who cheered me on and never
lost faith that I would one day hold the title, “Dr. Krausman”. THANK YOU SO MUCH!!! You
were instrumental in me crossing the finish line, and I am grateful for your constant support and
encouragement.
vi
Table of Contents
Chapter 1. Introduction ............................................................................................................ 1
1.2 Research questions and hypotheses....................................................................................... 6
1.3 Conceptual Research model ................................................................................................ 12
Chapter 2. Literature Review ................................................................................................ 14
2.1 Teams .................................................................................................................................. 14
2.2 Distributed Teams ............................................................................................................... 15
2.3 Teamwork............................................................................................................................ 17
2.4 Team Communication ......................................................................................................... 19
2.4.1 Interpersonal Trust ........................................................................................................ 21
2.4.2 Trust in Technology...................................................................................................... 22
2.4.3 Shared Understanding................................................................................................... 24
2.5 Distributed Team Communication ...................................................................................... 25
2.5.1 Theoretical Perspective ................................................................................................. 25
2.5.1.1 Media Richness Theory ......................................................................................... 25
2.5.1.2 Social Presence Theory .......................................................................................... 27
2.6 Communication Technologies............................................................................................. 28
2.6.1 Audio and Video Communication Technology ............................................................ 30
2.7 Distributed Team Communication Challenges ................................................................... 32
2.7.1 Real World Communication Delays ................................................................................ 34
2.7.1.1 Mobile Communications ........................................................................................ 34
2.7.1.2 VOIP (Voice over internet protocol) ......................................................................... 35
2.7.1.3 U.S. Army Operations ............................................................................................... 36
2.7.1.4 U.S. Military Air and Missile Defense Networks .................................................... 38

vii
2.7.1.5 Air Traffic Control (ATC) Operations ...................................................................... 38
2.7.1.6 Space Exploration ...................................................................................................... 39
2.8. Summary ............................................................................................................................ 41
2.9 Empirical Work on Communication Delays ....................................................................... 42
Chapter 3. Methodology ........................................................................................................ 52
3.1 Participants .......................................................................................................................... 52
3.2 Experiment Facility ............................................................................................................. 53
3.2.1 Experimental Rooms .................................................................................................... 53
3.2.2 Equipment: Audio Condition........................................................................................ 54
3.2.3 Equipment: Audiovisual Condition .............................................................................. 54
3.2.4 Equipment: Delay technology ...................................................................................... 55
3.3 Experimental Task: ELICIT ................................................................................................ 56
3.4 Experimental Design ........................................................................................................... 59
3.4.1 Objective measures ....................................................................................................... 59
3.4.1.1 Task Completion Time .......................................................................................... 59
3.4.1.2 Shared Understanding ............................................................................................ 60
3.4.1.3 Percentage of Shared Factoids ............................................................................... 60
3.4.2 Subjective measures ..................................................................................................... 60
3.4.2.1 Demographics and Computer Experience Questionnaire ...................................... 60
3.4.2.2 Mental Workload ................................................................................................... 61
3.4.2.3 Interpersonal Trust ................................................................................................. 61
3.4.2.4 Trust in Technology ............................................................................................... 62
3.4.2.5 Satisfaction ............................................................................................................. 62
3.5 Experimental procedures ..................................................................................................... 62

viii
3.6. Data Analysis ..................................................................................................................... 64
Chapter 4. Results ................................................................................................................... 66
4.1 Demographic Questionnaire Descriptive Statistics ............................................................. 66
4.2 Objective Results................................................................................................................. 68
4.2.1 Task completion time ................................................................................................... 68
4.2.2 Task Accuracy .............................................................................................................. 69
4.2.3 Percentage of Factoids Shared ...................................................................................... 69
4.3 Subjective Results ............................................................................................................... 70
4.3.1 NASA TLX Overall Workload..................................................................................... 70
4.3.2 NASA TLX Subscales .................................................................................................. 71
4.3.2.1 Mental Demand ...................................................................................................... 71
4.3.2.2 Physical Demand ................................................................................................... 71
4.3.2.3 Temporal Demand ................................................................................................. 72
4.3.2.4 Performance ........................................................................................................... 72
4.3.2.5 Effort ...................................................................................................................... 73
4.3.2.6 Frustration .............................................................................................................. 73
4.3.3 Interpersonal Trust: Affective ...................................................................................... 74
4.3.4 Interpersonal Trust: Cognitive ...................................................................................... 74
4.3.5 Trust in Technology...................................................................................................... 75
4.3.6 Satisfaction Data ........................................................................................................... 75
4.4 Discussion ........................................................................................................................... 75
Chapter 5. Results for Gender and Team Member Familiarity ........................................ 85
5.1 Objective Results................................................................................................................. 85
5.1.1 Task completion time ................................................................................................... 85

ix
5.1.2 Task Accuracy .............................................................................................................. 86
5.1.3 Percentage of Factoids Shared ...................................................................................... 88
5.2 Subjective Results ............................................................................................................... 88
5.2.1 NASA TLX Overall Workload..................................................................................... 88
5.2.2 NASA TLX Subscales .................................................................................................. 89
5.2.2.1 Mental Demand ...................................................................................................... 89
5.2.2.2 Physical Demand ................................................................................................... 89
5.2.2.3 Temporal Demand ................................................................................................. 90
5.2.2.4 Performance ........................................................................................................... 90
5.2.2.5 Effort ...................................................................................................................... 92
5.2.2.6 Frustration .............................................................................................................. 92
5.2.3 Interpersonal Trust - Affective ......................................................................................... 93
5.2.4 Interpersonal Trust - Cognitive ........................................................................................ 94
5.2.5 Trust in Technology ......................................................................................................... 97
5.2.6 Satisfaction ....................................................................................................................... 98
5.3 Discussion ........................................................................................................................... 98
5.4 Study Limitations .............................................................................................................. 104
5.5 Recommendations and Future Work ................................................................................. 106
5.6 Contribution ...................................................................................................................... 109
5.7 Conclusion ......................................................................................................................... 110
Chapter 6. Impacts of team member familiarity on distributed team communication efficiency with coordination complexity: A post hoc analysis .............................................. 112
6.1 Introduction ....................................................................................................................... 112
6.2 Background ....................................................................................................................... 113
6.2.1 Post-hoc Analysis Questions ...................................................................................... 117
x
6.2.2 Hypotheses.................................................................................................................. 117
6.3 Methods ............................................................................................................................. 117
6.3.1 Data set ....................................................................................................................... 117
6.3.2 Definitions .................................................................................................................. 118
6.3.2.1 Communication efficiency ................................................................................... 118
6.3.2.2 Coordination Complexity .................................................................................... 119
6.3.2.3 Team Familiarity .................................................................................................. 119
6.4 Data Analysis .................................................................................................................... 120
6.5 Results ............................................................................................................................... 121
6.6 Discussion ......................................................................................................................... 122
6.7 Limitations and Future Work ............................................................................................ 125
6.8 Conclusions ....................................................................................................................... 126
References .............................................................................................................................. 127
APPENDIX A – Consent Form............................................................................................ 142
APPENDIX A-1. VIRGINIA TECH IRB APPROVAL LETTER ................................. 146
APPENDIX B. DEMOGRAPHIC QUESTIONNAIRE ................................................... 147
APPENDIX C. NASA TLX WORKLOAD INSTRUCTIONS AND SCALE ................ 148
APPENDIX D. INTERPERSONAL TRUST SCALE ...................................................... 151
APPENDIX E. TRUST IN TECHNOLOGY QUESTIONNAIRE ................................. 153
APPENDIX F. SATISFACTION QUESTIONNAIRE..................................................... 155
APPENDIX G. PARTICIPANT INSTRUCTIONS .......................................................... 156
APPENDIX H – DESCRIPTIVE STATISTICS ................................................................ 158
xi
List of Tables
Table 1. Summary of Core Teamwork Components ................................................................... 18
Table 2. Communication Behaviors and Actions that Facilitate Trust ........................................ 22
Table 3. Communication Media Types ........................................................................................ 30
Table 4. ITU Recommendations for one-way transmission time. ............................................... 35
Table 5. Circuit Distance Delay Time (one-way) ........................................................................ 40
Table 6. Communication Delay Challenges ................................................................................ 40
Table 7. Summary of Audio Communication Delay Studies ....................................................... 47
Table 8. Sample ELICIT factoids ................................................................................................ 57
Table 9. Familiarity Simple Effects Summary for Cognitive Trust............................................. 95
Table 10. Data included in the Analysis .................................................................................... 120

xii
List of Figures
Figure 1. Teams as sociotechnical systems (adapted from Cano, 1997) ....................................... 6
Figure 2. Conceptual Model ........................................................................................................ 13
Figure 3. Characteristics of distributed and traditional teams. .................................................... 16
Figure 4. Model of the communication process (adapted from Yates, 2003) .............................. 20
Figure 5. Diagram of CASEL facility .......................................................................................... 53
Figure 6. Experimental Room Layout ......................................................................................... 54
Figure 7. Participants performing ELICIT task in audio-visual condition ................................... 55
Figure 8. DelayLine video and audio delay system (www.allenavionics.com)........................... 56
Figure 9. ELICIT user interface ................................................................................................... 58
Figure 10. ELICIT interface for identifying a solution................................................................ 59
Figure 11. Mean (SEM) Ratings of Experience with Communication Technology.................... 67
Figure 12. Mean (SEM) Ratings of Experience with Communication Technology by age group........................................................................................................................................................ 67
Figure 13. Mean (SEM) Task Completion Time as a function of Delay Length. ....................... 68
Figure 14. Mean (SEM) Percentage of Factoids Shared as a function of Delay Length. ............ 69
Figure 15. Mean (SEM) Overall Workload ratings as a function of Delay Length and Technology. .................................................................................................................................. 70
Figure 16. Mean (SEM) Physical Demand ratings as a function of Delay Length. .................... 72
Figure 17. Mean (SEM) Effort Ratings as a function of Delay Length and Technology. ........... 73
Figure 18. Mean (SEM) Frustration Ratings as a function of Delay Length. .............................. 74
Figure 19. Mean (SEM) Task Completion Time as a function of Delay Length, Technology, and Familiarity. .................................................................................................................................... 86
Figure 20. Mean (SEM) Task Accuracy as a function of Gender and Technology..................... 87

xiii
Figure 21. Mean (SEM) Performance Workload ratings as a function of Delay, Technology, and Familiarity. .................................................................................................................................... 91
Figure 22. Mean (SEM) Frustration ratings as a function of Delay, Technology, and Familiarity........................................................................................................................................................ 93
Figure 23. Mean (SEM) Affective Trust ratings as a function of Familiarity. ............................ 94
Figure 24. Mean (SEM) Cognitive Trust ratings as a function of Delay, Technology and Familiarity. .................................................................................................................................... 96
Figure 25. Mean Cognitive Trust as a function of Delay, Technology, and Familiarity. ............ 97
Figure 26. Mean (SEM) communication efficiency as a function of Familiarity, Delay, and Technology. ................................................................................................................................ 122

1
Chapter 1. Introduction
Organizations, such as government agencies, academic institutions, industry, and the
military utilize distributed teams that are geographically or spatially separated, and may not have
the opportunity for face-to-face interaction (Driskell, Radtke, & Salas, 2003). Subsequently,
distributed teams use various forms of synchronous and asynchronous communication
technologies to support their work activities (Krausman, 2017). A downside to these
technologies is that the information being shared is transmitted over a network that is subject to
delays, which may impact team communication effectiveness (Bowers, Jentsch, Salas, & Braun,
1998; Cannon-Bowers & Salas, 1998; Dickinson & McIntyre, 1997; Powell, Piccoli, & Ives,
2004). In a conversation occurring in real-time, a team member speaks a message, and then
waits for a quick response from his or her partner (Krausman, 2017). However, with a delay, the
partner’s response is not immediate and some interval of time passes before their response is
heard. Although the recipient thinks they responded immediately, their contribution is not heard
for some time because of the delay (Dove-Steincamp, 2012). For the purposes of this research,
communication delay is defined as the time interval between when a team member speaks a
message and when it is rendered on the other side (Krausman, 2017).
Communication delays can be a result of organizational protocol, which determines the
structure and flow of communication and therefore can influence how fast information travels.
For instance, in a rigid structure, such as a hierarchy, the flow of communication among
members may be restricted or delayed as information must travel through several levels before it
reaches the intended recipient. As a result, members of the same team may possess radically
different information, yet team members may be unaware of the differences (Dove-Steinkamp,
2012). A rather compelling example of this is depicted in the case study and book “Black Hawk
Down”, which describes U.S. military efforts in Mogadishu, Somalia in 1993, in which two
Blackhawk helicopters carrying U.S. Army Rangers was shot down with multiple casualties to
both the Soldiers and Somali civilians (Krausman, 2017). A U.S. military rescue team set out in
armored vehicles for the crash site, but encountered heavy enemy fire and difficulty navigating
to the crash site. Why the difficulty? The convoy was being directed to the crash site by
helicopters and a spy plane flying overhead. However, the spy plane was directed to relay all of
their communications to the Joint Operations Center, rather than to the convoy directly, so by the

2
time the convoy received the information to turn onto a specific street, it was too late, as the
convoy had already gone past their turn, and into enemy fire (Bowden, 1999).
Another cause of communication delay is the type of communication technology being
used. Asynchronous technologies such as email can provide instantaneous responses or delayed
responses depending on the availability of team members (Krausman, 2017). Of particular
concern in the present research are delays that occur during synchronous or “real-time”
communication using teleconferencing or videoconferencing technologies as a result of
limitations in the network supporting the interaction. Two important parameters that affect
information transfer over a network are bandwidth, which refers to the quantity of information
that can be transmitted between two locations, and processing speed, which refers to how fast the
information travels. Both parameters have finite values and subsequently there is a limit to the
quantity of information and speed with which information can travel from one location to
another (Dove-Steinkamp, 2012). Several factors can influence the speed of transmission
including the, the path of the transmission and number or routers, the current level of network
traffic, and the distance messages must travel (Gutwin, 2001). For instance, concerns regarding
the stress of communication delays experienced by space crews have been cited as one-way
transmission delays between Earth and Mars can vary from 3 – 22 minutes (Fisher, Mosier, &
Orasanu, 2013) and will only increase as crews explore farther away from Earth (Kanas, 2005).
Clearly, technological advances will help reduce or even alleviate shorter delays, however, it
may not be possible to eliminate all delays associated with distributed communication
(Krausman, 2017). In the present work, the focus was on communication delays that result from
the use of networked communication technology rather than organizational protocol, although
the underlying knowledge obtained could also be applied to a broader set of delays.
With respect to the empirical work into the effects of technology-induced delays, results
have shown that communication delays, even as short as 200 ms, disrupt turn taking and
feedback (Cohen, 1982; Krauss & Bricker, 1967; O’Conaill, Whitaker, & Wilbur, 1993), which
is important for maintaining conversations and establishing situation awareness among team
members. For the most part, people tolerate the short auditory delays that occur in cell phone
conversations, but the negative effects of longer delays, such as more interruptions and difficulty
sharing information, may seriously disrupt team activities, especially in operational

3
environments (Armstead, 2007). Some research has shown that delayed feedback and disrupted
turn taking may negatively impact the social and emotional experience of team members. For
example, Parkinson and Lea, (2011), compared immediate feedback and feedback that was
delayed by 200 ms and concluded that “lacking immediate interpersonal feedback seems to result
in greater disengagement from interaction when you do not share the other’s opinion about a
topic (pp. 114).” In general, participants felt more connected to their partner with immediate
feedback (Krausman, 2017).
While the existing literature has provided useful information with respect to how
communication delays affect team member interaction, there are still several questions that
remain unanswered. Evidence for how communication delays affect critical team processes such
as shared understanding and trust is limited (Krausman, 2017). Moreover, information regarding
how delays impact information sharing between team members is lacking, as is how
communication delays affect team satisfaction, and mental workload. In addition, few studies
have specifically addressed the use of a video channel to help lessen the effects of delays and in
those studies that have, results are conflicting (Krauss, Garlock, Bricker, & McMahon, 1977;
O’Malley, Langton, Anderson, Doherty-Sneddon, & Bruce, 1996). Therefore, in the present
research a video channel was incorporated to determine if the additional social cues provided by
video may lessen the impact of communication delay on team processes and information
exchange. Another issue that is relatively unexplored with respect to communication delay is
team diversity. Given the diverse nature of today’s workforce, it is likely that distributed teams
will include same and mixed gender members as well as team members who may or may not
have a history working together. Thus, this research sought to determine how team gender
composition and team member familiarity affect team member interaction at various levels of
delay. The goals of this research were to: (1) to determine how communication delays affect
task completion time and the development of critical team processes such as trust and shared
understanding, as well as team member satisfaction and workload (2) to understand how
communication delays impact the quantity of information shared among team members, (3) to
investigate how social cues provided by video technology may lessen the effects of delay, and
(4) to understand how gender composition and team member familiarity affect distributed team
interaction when communication is delayed (Krausman, 2017).

4
1.1 Research Framework
As distributed teams become increasingly prevalent, it becomes critical to understand the
factors that affect team coordination and subsequent team performance. With this in mind,
several researchers have proposed that research focused on teams in traditional collocated
environments may not provide an adequate theoretical framework to guide research in the
distributed team context due to the inherent differences in communication and interaction
between collocated and distributed teams. In addition, organizations often incorrectly assume
that technology is the panacea for performance problems and throw technology at problems
without considering how it will impact the users that rely on the technology to perform their job
(Gorman, Cooke, & Salas, 2010). Similarly, designers often view the human as an afterthought
and assign tasks to machines first with any “leftovers” assigned to humans (Hendrick, 2001;
Hendrick & Kleiner, 2001). Unfortunately, these approaches often result in suboptimal work
systems with decrements to quality and efficiency, increased injury, and worker dissatisfaction
(Dul, Bruder, Buckle, Carayon, Falzon, Marras, Wilson, & van der Doelen, 2012; Hendrick,
2001). Rather, what is needed is an approach that considers the complexity of work systems and
seeks to design systems that are well-balanced and optimized for performance and well-being
(Dul et al., 2012).
As an alternative to traditional system design approaches, sociotechnical systems (STS)
theory may provide a solid research framework for distributed work teams (see Hammond et al.,
2005). Sociotechnical system design describes work systems as having three subsystems: a
technological subsystem, a personnel or social subsystem, and a work system design that is
supported by the organization’s structure and processes (Hendrick, 2007). All three subsystems
interact with each other and with the external environment in order to produce outcomes (Figure
1). Of particular concern in sociotechnical design is the joint nature of the social and
technological subsystems (Kleiner, 2008). STS theory proposes that the personnel and
technological subsystems are interdependent and as a result, both are affected by causal events in
the environment. In other words, they operate under the sociotechnical concept of “joint
causation” (Hendrick, 2001), and therefore both subsystems should be optimized to ensure an
efficient work system.
5
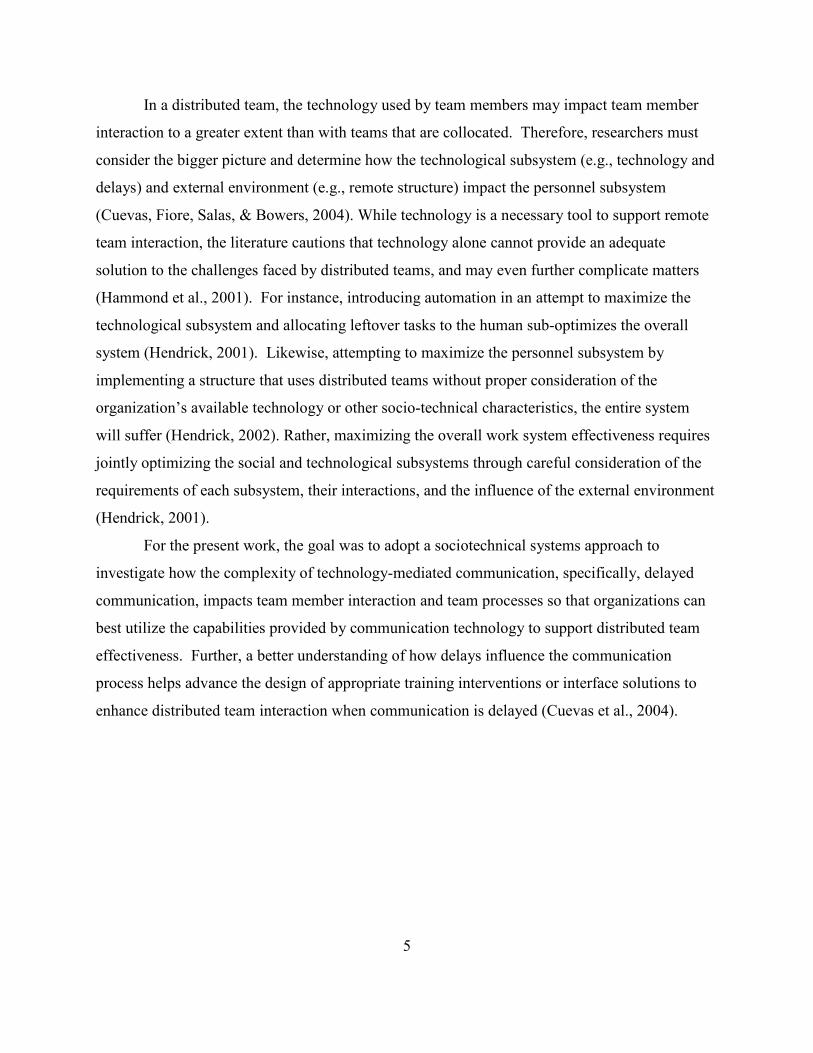
In a distributed team, the technology used by team members may impact team member
interaction to a greater extent than with teams that are collocated. Therefore, researchers must
consider the bigger picture and determine how the technological subsystem (e.g., technology and
delays) and external environment (e.g., remote structure) impact the personnel subsystem
(Cuevas, Fiore, Salas, & Bowers, 2004). While technology is a necessary tool to support remote
team interaction, the literature cautions that technology alone cannot provide an adequate
solution to the challenges faced by distributed teams, and may even further complicate matters
(Hammond et al., 2001). For instance, introducing automation in an attempt to maximize the
technological subsystem and allocating leftover tasks to the human sub-optimizes the overall
system (Hendrick, 2001). Likewise, attempting to maximize the personnel subsystem by
implementing a structure that uses distributed teams without proper consideration of the
organization’s available technology or other socio-technical characteristics, the entire system
will suffer (Hendrick, 2002). Rather, maximizing the overall work system effectiveness requires
jointly optimizing the social and technological subsystems through careful consideration of the
requirements of each subsystem, their interactions, and the influence of the external environment
(Hendrick, 2001).
For the present work, the goal was to adopt a sociotechnical systems approach to
investigate how the complexity of technology-mediated communication, specifically, delayed
communication, impacts team member interaction and team processes so that organizations can
best utilize the capabilities provided by communication technology to support distributed team
effectiveness. Further, a better understanding of how delays influence the communication
process helps advance the design of appropriate training interventions or interface solutions to
enhance distributed team interaction when communication is delayed (Cuevas et al., 2004).

6
Figure 1. Teams as sociotechnical systems (adapted from Cano, 1997)
1.2 Research questions and hypotheses
The present research addressed the following research questions related to the effects of
communication delays on distributed team interaction.
1. What effect do communication delays have on task completion time, shared understanding (task accuracy), information sharing, trust, satisfaction, and mental workload?
2. What effect does a video channel have on task completion time, shared understanding (task accuracy), information sharing, trust, satisfaction, and mental workload when team member communication is delayed?
3. How do team variables such as gender composition and team member familiarity affect
distributed team interaction at different levels of communication delay? For the purposes of this research, communication delays are defined as the time interval between
a verbal message being sent from one team member and when it is rendered on the other side
(Krausman, 2017). Knowledge gained from this research will help inform work system and team
Organizational design
(Lines of authority)
Social Subsystem
(Teamwork)
Technological
Subsystem
(Taskwork)
External environment
(socioeconomic, educational, political, cultural, legal)
Communication
Communication Communication

7
design practices and can be applied to the design of training programs or other interventions as a
way to counteract performance degradations caused by communication delays, thereby
enhancing distributed team interaction.
From the team performance literature, several research hypotheses were developed for testing in
this dissertation.
Hypothesis 1: H1: Increases in communication delay will result in: faster task completion times, lower task accuracy (shared understanding), less information shared, lower team member satisfaction scores, and lower trust scores.
Within teams, shared understanding is considered critical for team collaboration. A key
mechanism for the formation of shared understanding is communication. Therefore, we
anticipated that communication delays would disrupt the information sharing between team
members, leading to less information being exchanged. Subsequently, team members were
predicted to be more likely to solve the task prematurely, without considering all of the evidence,
leading to a reduction in task accuracy and faster task completion times. Further, conversational
mechanisms such as turn-taking, pauses, and timely feedback which are important to effective
communication, are often disrupted by communication delays, potentially leading to lower
satisfaction among team members. In fact, Ruhleder & Jordan (2001) suggested that the
negative impact of technology-generated delays and the subsequent impact on conversations:
more interruptions, overlaps, and the need to clarify or repeat messages may be partly
responsible for the feelings of discomfort and uncertainty regarding other’s competence
frequently expressed by users of communication technologies. Moreover, several authors have
cited the need for timely and substantial communication as a prerequisite for trust in teams
(Gibson, & Manuel, 2003; Rico, Alcover, Sanchez-Manzanares, Gil, 2009; Rocco, Finholt,
Hofer, and Herbsleb, 2001). When communication delays are present, it becomes increasingly
difficult to make timely contributions. Hence, we hypothesized that communication delay will
result in lower scores for both interpersonal trust and trust in technology.
Hypothesis 2: Increases in communication delay will result in subsequent increases in mental workload.

8
Teams are assembled based on the notion of synergy, meaning that teams have the
potential to combine the attributes and efforts of team members to arrive at outcomes or
solutions beyond the abilities of one individual member or even the pooled output of all
members combined (Cramton & Orvis, 2003; Salas, Rosen, Burke, & Goodwin, 2008).
As such, team members need to communicate and collaborate with one another; however, given
the challenges of technology-mediated communication, team members may experience an
increase in mental workload as they collaborate with one another. According to Caldwell &
Everhart (1998), most of the benefits of using teams are lost when operational tempo is high and
team member interactions are stressed or hindered (e.g., by delays). Specifically, as information
flow is restricted by medium constraints, participants’ interactions necessarily change as they try
to transmit the same information with only a limited set of cues, or in the case of the present
research, a delay in transmitting information. Therefore, it was expected that the effort to
maintain a conversation in the presence of communication delays would result in team members’
expending more effort, which in turn, would be reflected as an increase in mental workload
scores.
Hypothesis 3: Audiovisual technology, with social context cues, will lessen the effect of communication delay, such that: shared understanding will be higher, more information will be shared, and team member satisfaction scores and trust scores will be higher with video than audio.
Compared to audio, video is more adept at conveying social context cues, especially
affective cues, such as being able to see team members on a screen which can confirm the
presence of other team members (Watson, 2001). Tang & Isaacs (1993) demonstrated the value
of video for supporting remote collaboration: video was beneficial for gestures and to capture
participant’s attitudes, leading the authors to conclude that people desire access to video
connections and are reluctant to use desktop conferencing without a video system. In fact, even
when the audio portion of the conference was delayed by 570 msec, access to the video channel
was valuable in helping mediate interaction (Tang et al., 1993). During a videoconference
participants became annoyed with the audio delay, and switched off the audio portion of the
conference, preferring instead to use speakerphones as their audio source. While this solved the
delay problem, the audio quality was poorer, audio arrived before the video signal, and the
speakerphone only transmitted one speaker’s voice at a time (Wainfan et al., 2004). Still, users

9
preferred this arrangement to the annoying delays, confirming the adverse effect of audio delays
in remote activities.
Veinott, Olson, Olson, & Fu (1997) found that remotely located dyads working on a
collaborative task benefit from having a video of their partner when their verbal communication
is “stressed”, such as when native and non-native speakers communicate with one another.
Although their work referred to team members that speak different languages, in the present
study, it is expected that delays will serve as a communication stressor, so the inclusion of a
video would facilitate team communication through non-verbal cues as well as the ability to
visually monitor team member understanding. With respect to trust, frequent face-to-face
interactions have been shown to engender higher trust, suggesting that when visual cues are
reduced, trust may be reduced as well (Wilson, Straus, & McEvily, 2006). Further Zheng,
Veinott, Bos, Olson, & Olson (2003) showed that when face-to-face interaction is not feasible, a
photograph may help interpersonal trust develop among team members. For the current research
then, it was expected that the addition of video and its associated social cues would lead to richer
interactions and subsequently faster completion times, higher task accuracy (shared
understanding) scores, more information exchanged between team members, and higher ratings
of satisfaction and trust, compared to audio-only conditions.
Hypothesis 4: Video technology will lessen the effect of communication delay such that mental workload will be lower in the video condition than the audio condition.
Social Presence Theory asserts that communication technologies differ with respect to
level of social presence they offer, in other words, the degree to which users perceive exchanges
to be warm and personal, and the sense of connection felt between team members when using
specific media (Thatcher & DeLacour, 2003). According to this theory, participants have a
greater experience of “presence” when they have access to social context cues. Compared to
audio, video is more adept at conveying social context cues, especially affective cues such as
being able to see team members on a screen which can be confirm the presence of other team
members (Watson, 2001). For instance, text-based communication such as email is considered
very low in social presence, since it eliminates the visual and verbal cues that are plentiful in
face-to-face interaction. In contrast, face-to-face communication is regarded as being highest in
social presence (Bennett, 2009). Social presence is regarded as one of the most important factors

10
for facilitating interpersonal processes and collaboration in online teams (Ubon, 2005).
Successful communication and team dynamics have also been linked to the experience of social
presence in teams (Thatcher et al., 2003). The rich visual cues that are characteristic of video
technology, such as gaze, facial expressions, and gestures, have been shown to enrich the quality
of communication (O’Conaill et al., 1993), and makes interactions more personal than audio or
text-based technology (Olson et al., 2000). Other team member attributes such as level of
interest, physical appearance, and emotional status, are easily expressed through the visual
channel (Cano, 1997). Subsequently, it was expected that the incorporation of rich visual cues
provided via video technology might help facilitate distributed team interaction, thereby reducing
the effort required to communicate with delays, resulting in lower mental workload.
Hypothesis 5: When communication is delayed, gender diverse teams will: exhibit longer task completion times, lower task accuracy (shared understanding), share less information, have lower satisfaction scores, and higher mental workload than same-gender teams.
Previous studies examining gender differences in social interaction suggest men and
women communicate for different reasons. For the most part, women use language to facilitate
social interaction and building of relationships while men primarily use language as a means to
convey information (Balliet, Li, Macfarlan, & Van Vugt, 2011; Baron & Campbell, 2010).
These differences are consistent across all forms of communication, including online methods
such as email. When considering the quantity of communication across genders, stereotypically,
women are thought to talk more than men; however data suggests that quantity of
communication is more a function of the context of the interaction. For example, since women
communicate to build rapport and relationships, their volume of communication will tend to be
higher than men who communicate to seek or exchange information. In mixed-gender, one-to-
many online discussion forums, males have been known to contribute both longer and more
frequent posts. However, in one-to-one interactions females generate a greater quantity of
communication, possibly because they are pursuing a social experience (Herring, 2010).
James & Drakich (1993) suggested that differences in the quantity of communication
may also be a function of the gender roles assumed by men and women. For instance, women
are expected to assume roles that are supportive and self-sacrificing, so their interactions can be
characterized as more personable, friendly, and expressive. Men, in comparison, often assume

11
highly respected social roles and as such are considered to be more independent, assertive,
ambitious, and dominant, which may account for their abrupt and information-oriented
communication style (Balliet et al., 2011). Women also tend to perform better than men on tasks
that require complex social interaction, since women tend to have a greater propensity for social
interaction than men (Armstead, 2011). Given the differences in communication between men
and women, we hypothesized that in male-female dyads, communication delays would result in
lower shared understanding, less information exchanged, lower ratings of trust, lower
satisfaction, and higher ratings of mental workload, than same-gender dyads.
Hypothesis 6: When communication is delayed, teams with familiar members will have higher task accuracy, complete the task faster, share more information, have higher levels of trust, be more satisfied, and have lower workload than unfamiliar teams.
Given the diverse nature of today’s workforce, it is likely that distributed teams will be
comprised of team members of who may or may not have a history of working together.
Familiarity among group members may influence group interactions. For example, distributed
teams who have not worked together previously may find communicating more difficult because
they have not yet developed a “shared language” to enable collaboration (Powell et al., 2004).
Research suggests that as familiarity among team members increases, communication efficiency
is expected to improve, which is potentially due to the fact that more familiar team members
“possess more knowledge about one another’s skills, perspectives, and interpersonal styles”
(Gruenfeld, Mannix, Williams, & Neale,1996, pp. 2). This may in turn reduce the amount of
time it takes for familiar team members to arrive at a decision. Goodman & Leyden (1991)
studies coal-mining crews who possessed differing levels of familiarity with one another, as well
as differing levels of experience as miners. Findings showed that lower levels of familiarity
were associated with lower levels of productivity. In a study of performance on decision making
tasks, Watson et al (1991) found that familiarity among members enhanced group decision-
making effectiveness over time, compared to individual decision-making. These studies provide
some evidence that greater effectiveness can result from teams that share a history of working
together, relative to teams composed of strangers (Guzzo & Dickson, 1996).
When group members are more familiar with one another, they are more comfortable
with each other and subsequently are more willing to express disagreement, are willing to learn

12
from one another, and experience more satisfaction and less anxiety with team interactions and
outcomes (Gruenfeld et al., 1996). Team member familiarity has also been linked to the trust
development in distributed teams (Pantelli, 2003). Handy (1995), suggests that face-to-face
interaction is critical for trust to develop in distributed teams, which depending on the
circumstance, may or may not be possible. Other researchers agree with Handy’s assertion.
Being able to stop by a coworker’s office to talk about a project enables one to assess their
current work environment as well as any past projects and their level of proficiency (Pantelli,
2003). Researchers maintain that a lack of proximity among group members and the reliance on
technology to communicate pose difficulties for the development of trust in distributed settings
(Pantelli, 2003). For this research it was hypothesized that team members who are familiar with
one another would be more satisfied with their interactions and have higher levels of trust, even
with communication delays, because they have achieved a level of comfort with one another than
those who have no history working together. Further, it was assumed that familiar teams would
have shorter task completion times, higher accuracy (shared understanding), lower mental
workload, and exchange more information than teams with unfamiliar members.
1.3 Conceptual Research model
Drawing from the discussion above, a conceptual model was created to guide this research
(Figure 2). The model contains elements from the technological and personnel subsystems as
well as the organizational structure. Variables that were addressed in this research are shown as
bold. The goal was to investigate how communication delays and the lack of collocation impacts
teamwork processes and ultimately, shared understanding (task accuracy), information shared,
mental workload, interpersonal trust, trust in technology, and team member satisfaction.

13
Distributed Team Communication
• Delays • Network limitations
o Bandwidth o Routing issues o Congestion
Organizational structure
• Collocated teams • Distributed teams • Hybrid teams
Communication mode
• FtF • Synchronous
o Audio o Video o IM
• Asynchronous o Email o Org. Protocol o Discussion
boards
Task Outcome
• Task completion time • Shared understanding
(task accuracy) • Information exchange
Team Outcome
• Interpersonal trust • Technology trust • Satisfaction • Mental Workload
Team Diversity
• Gender • Familiarity • Culture • Functional • Organization
Figure 2. Conceptual Model
In the next chapter, a review of the team communication and team performance literature
that motivated the research hypotheses is provided, including definitions for the terminology
used, followed by details about the design of the experiment and a description of the expected
contribution to the current body of knowledge.

14
Chapter 2. Literature Review
2.1 Teams
Teams are not a new phenomenon. In fact, evidence of team-based work dates back to
ancient times, as designers, masons, engineers, and laborers joined together to build the pyramids
in Egypt and the stately architecture of Athens (van der Vegt, Emans, & van de Vliert, 2000).
Today, teams are common in academia, aviation, financial markets, nuclear power plants,
medicine, manufacturing, industry, the military, and several other work domains (Salas, Sims, &
Burke, 2005). Why teams? Organizations are often confronted with the need to continually
adapt in order to manage the increasing complexity of work, continual advancements in
technology, and the increasing pressure to maintain a competitive edge by doing more with less
(Salas et al., 2008; Salmon, Stanton, Houghton, Rafferty, Walker, & Jenkins, 2008). Not only do
teams provide additional manpower, they also provide a wealth of skills, abilities, and expertise
that are well-suited for today’s dynamic work environments (Salas, Burke, & Cannon-Bowers,
2000). In addition, it is generally accepted that the collective efforts of team members result in
the ability to handle more complex tasks, better decision making, and more efficient performance
under stress, fewer errors, and innovative responses to unexpected events (Salmon et al., 2008).
A team can be defined as “a distinguishable set of two or more people who interact
dynamically, interdependently, and adaptively toward a common and valued goal, objective, or
mission, who have each been assigned specific roles or functions to perform, and have a limited
life span of membership” (Salas, Dickinson, Converse & Tannebaum, 1992, pp. 4). A common
misconception is that any group that works together is a team and as a result, many authors use
the terms “team” and “(nominal) group” interchangeably (Andre et al., 1997). However, the
definitions cited above suggest that the word “team” is more than a label assigned to a collection
of people (Salas et al., 2008). Rather, there are some key characteristics that help differentiate
teams from nominal groups. First, groups tend to be loosely structured and flexible with respect
to communication and organization. In contrast, teams are rooted in an organizational context
and follow a specific structure. Second, roles in a group setting are assumed by members during
group interaction, whereas in teams, members are assigned specific roles (Grugle & Kleiner,
2007). Third, while group members sometimes rely on each other to attain a shared goal, they
frequently work on independent tasks without the need for input from other group members.

15
Consequently, group performance often depends on individual rather than collective efforts
(Neale, Carroll, & Rosson, 2004). In contrast, teams work collaboratively and performance
depends on the combined efforts of the team (Krokos, Baker, Alonso, & Day, 2009). Another
characteristic of teams is the ability to adapt to changing situations. By pooling their resources
they can more easily adapt to novel situations than individuals which is especially important for
teams that operate in complex work environments (Salas, Cannon-Bowers, Payne, Smith-
Jentsch, 1998). Although there are disparities between nominal groups and teams, over time, a
nominal group can develop into a team (Grugle et al., 2007).
From the definitions provided above, participants in the present study were considered to
comprise teams rather than nominal groups since members shared a common goal which they
pursued collaboratively, and they assumed a specific role throughout the experiment. Further,
the task performed during the experiment required a high degree of interdependence and could
not be solved without the collective efforts of both team members, so it was the coordinated
efforts of the team that determined success.
2.2 Distributed Teams
Distributed teams are defined as, “teams whose members are dispersed across distance
and time, are linked together by some form of electronic technology, and physically interact with
each other rarely or not at all” (Sessa, Hansen, Prestridge, & Kostler, 1999, pp. 10). There are
two primary characteristics that distinguish distributed teams from traditional teams (Figure 3):
team members are geographically or spatially separated from each other and they rely on
communication technology such as audio or video conferencing, email, telephone, smartboards
etc., as their primary, if not sole source for collaboration (Hinds et al., 2003; Bell et al., 2002).
Since members of distributed teams are not proximate, they do not share the same work site, and
may not even share the same continent (Bell et al., 2002). Although distributed teams may
occasionally meet face-to-face, the majority of their work is performed remotely, using a variety
of technologies to mediate their interactions. It is important to note that it is not only the use of
technology that differentiates a distributed team, because all teams use some form of technology.
Rather, it is the level of dependence on communication technologies that distinguishes
distributed teams from traditional ones (Cohen & Gibson, 2003). Some authors have even
suggested that it is more accurate to view distributed teams along a continuum rather than as a

16
dichotomy (Andre et al., 1997; Bell et al., 2002). Where a team falls on the continuum is
determined by the degree of geographic dispersion and how much they depend on technology-
mediated communication (Cohen et al., 2003).
Distributed team structures provide some substantial benefits to both employees and
organizations (Thompson & Coovert, 2006). Teams that collaborate asynchronously (different
time, different place) from remote locations enjoy a degree of flexibility not available in
traditional team contexts. For instance, members can provide input when it is convenient for
them, creating more flexibility and less of a need to synchronize schedules and activities with
that of other team members (Thompson et al., 2006). Asynchronous collaboration can also boost
productivity as team members in different time zones can “work around the clock” (Guthrie,
Rosen, Salas, Nelson, & Bolia, 2007). Moreover, organizations have access to a broader
knowledge base, allowing organizations to fully leverage the intellectual capital and expertise of
the workforce, thereby increasing organizational skills, and demographic diversity (Andre et al.,
1998). Organizations that encourage distributed teamwork can minimize travel and relocations
costs, and allowing personnel to work from home can reduce overhead and infrastructure costs to
house employees (Thompson et al., 2006).
For the purposes of this research, the focus is on teams that remain geographically
distributed throughout a project or mission, who have no capacity for face-to-face meetings, and
who rely solely on audio and video technology to mediate their communication.
Figure 3. Characteristics of distributed and traditional teams. (Horvath & Tobin, 2001)
17
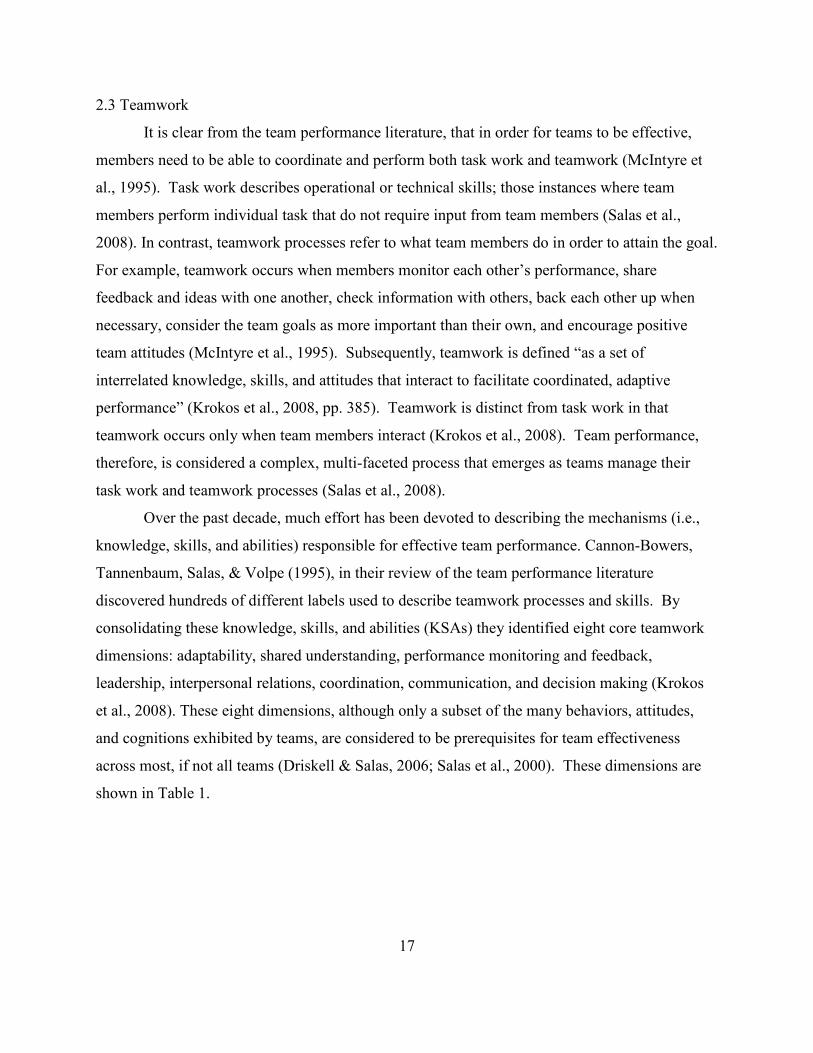
2.3 Teamwork
It is clear from the team performance literature, that in order for teams to be effective,
members need to be able to coordinate and perform both task work and teamwork (McIntyre et
al., 1995). Task work describes operational or technical skills; those instances where team
members perform individual task that do not require input from team members (Salas et al.,
2008). In contrast, teamwork processes refer to what team members do in order to attain the goal.
For example, teamwork occurs when members monitor each other’s performance, share
feedback and ideas with one another, check information with others, back each other up when
necessary, consider the team goals as more important than their own, and encourage positive
team attitudes (McIntyre et al., 1995). Subsequently, teamwork is defined “as a set of
interrelated knowledge, skills, and attitudes that interact to facilitate coordinated, adaptive
performance” (Krokos et al., 2008, pp. 385). Teamwork is distinct from task work in that
teamwork occurs only when team members interact (Krokos et al., 2008). Team performance,
therefore, is considered a complex, multi-faceted process that emerges as teams manage their
task work and teamwork processes (Salas et al., 2008).
Over the past decade, much effort has been devoted to describing the mechanisms (i.e.,
knowledge, skills, and abilities) responsible for effective team performance. Cannon-Bowers,
Tannenbaum, Salas, & Volpe (1995), in their review of the team performance literature
discovered hundreds of different labels used to describe teamwork processes and skills. By
consolidating these knowledge, skills, and abilities (KSAs) they identified eight core teamwork
dimensions: adaptability, shared understanding, performance monitoring and feedback,
leadership, interpersonal relations, coordination, communication, and decision making (Krokos
et al., 2008). These eight dimensions, although only a subset of the many behaviors, attitudes,
and cognitions exhibited by teams, are considered to be prerequisites for team effectiveness
across most, if not all teams (Driskell & Salas, 2006; Salas et al., 2000). These dimensions are
shown in Table 1.

18
Table 1. Summary of Core Teamwork Components
Component
Definition
Supporting Team Behaviors
(Baker, Day, Salas, 2006; Mills et al., 2000; Salas, Rosen, Burke, &
Goodwin, 2008)
Adaptability
Ability to revise plans and compensate for changing situations or conditions when necessary based on information gathered from the environment and other team members.
Identify when a change happens. Develop a plan to handle change Identify needed improvements Remain vigilant to internal and external changes in environment
Shared understanding
Commonality with respect to team goals, processes, and tasks, and the amount of overlap with respect to team member knowledge, skills, and abilities.
Team members anticipate the needs of other team members. Actively seek and share information relevant to the task/mission
Performance monitoring and feedback
Team members’ awareness and observation of each other’s progress to compensate for individual deficiencies.
Identifying mistakes Providing feedback to facilitate correction
Team leadership
Team leader facilitates teamwork by encouraging mutual performance monitoring, backup behavior, adaptability, and communication.
Specify task assignments Provide timely feedback to team Explain requirements, expectations Listen to concerns, feedback
Mutual Trust and Interpersonal Relations
Team members are willing to be vulnerable and take risks based on the expectations and intentions of others on the team.
Enthusiastic communication Timely and substantive responses Individual initiative Willingness to admit mistakes Willingness to accept feedback
Coordination
Team members manage resources, to ensure complete and timely completion of tasks.
Communicating status, needs, and objectives as often as necessary Downtime is minimized
Communication
The effective and timely exchange of information between team members.
Use standard terminology Acknowledge communication Verify accuracy of information Fulfill requests for information Repeat critical information
Decision Making
Team members pool collective information, discuss options, and evaluate outcomes.
Cross-check information Allocate and monitor resources Gather information Identify short and long term plans
(adapted from Driskell & Salas, 2006)
While there is general consensus supporting these core teamwork behaviors described above,
several researchers have placed a premium on effective communication as the vehicle for
accomplishing team tasks (Dickinson et al., 1997; Marks, Zaccaro, & Mathieu, 2000).

19
2.4 Team Communication
In the team context, communication is, “the process by which information is clearly and
accurately exchanged between two or more team members in the prescribed manner and with
proper terminology; the ability to clarify or acknowledge the receipt of information” (Salas et al.,
2000, pp. 343). Several researchers have shown that communication is vital for team
performance (Bowers et al., 1998; Cannon-Bowers et al., 1998; Morgan et al., 1993). In their
model of teamwork, Dickinson et al., (1997) described communication as the process that
connects all other teamwork components. Subsequently, when communication breaks down,
team performance can be compromised and there is a greater potential for errors to occur. For
instance, poor flight crew communication and human error, are considered to be one of the
leading causes in 60% – 80% of aircraft near-misses and accidents (Lassiter et al., 1990).
Communication failures are a major contributor to medical mishaps (Lassiter et al., 1990), and
have been implicated in fratricide incidents of U.S. military personnel during the Gulf War
(Andre et al., 1998; Wilson, Salas, Priest, & Andrews, 2007).
From the literature, we understand that communication is essential for the performance of
all teams, whether physically proximate or remote (Salas et al., 2001; Shanahan et al., 2007; van
der Kleij, Schraagen, Werkhoven, & De Dreu, 2009). Communication is the mechanism through
which teams accomplish their tasks, coordinate their actions, make decisions, and mature into a
cohesive team (Andre et al., 1998). Shannon & Weaver (1949) proposed a simple model of
communication (Figure 4). According to their model, communication starts with a sender, who
creates and sends a message that is sent/transmitted to a receiver, who receives the message and
provides a response as to whether the message was clear and understood. Unfortunately, “noise”
can distort the message, either in the mind of the sender/receiver, during transmission, or in the
environment while the message is in the process of being received (Yates, 2003).
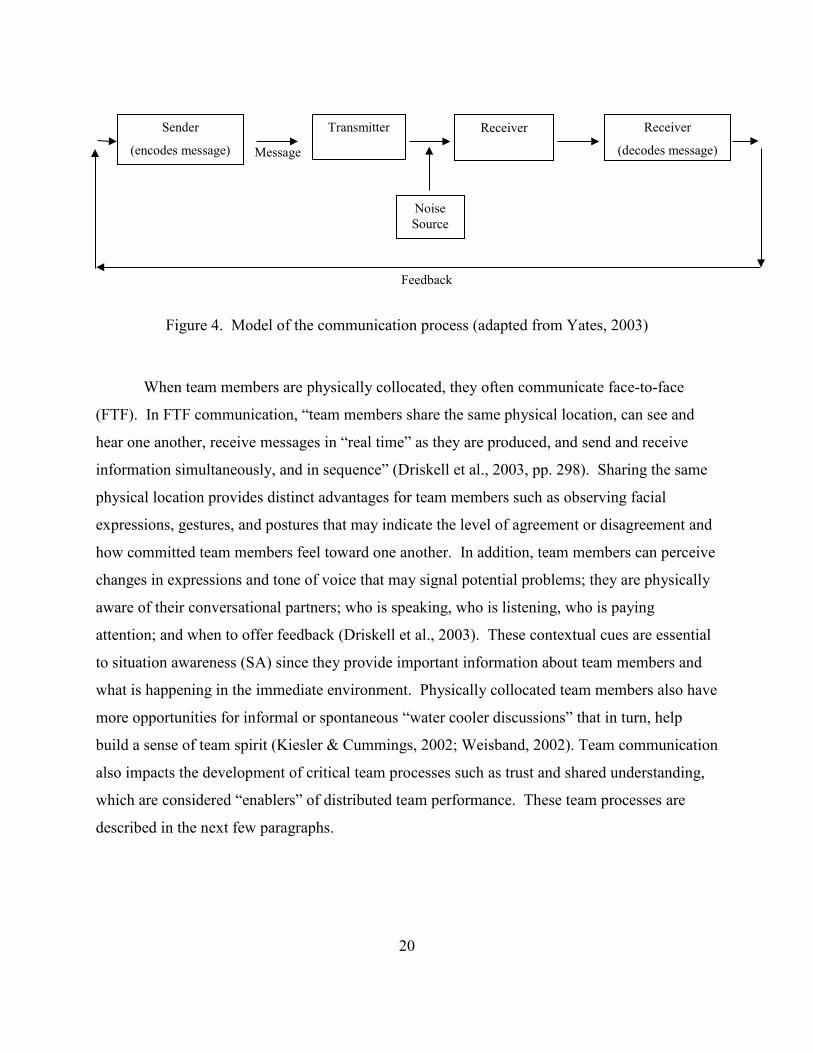
20
Figure 4. Model of the communication process (adapted from Yates, 2003)
When team members are physically collocated, they often communicate face-to-face
(FTF). In FTF communication, “team members share the same physical location, can see and
hear one another, receive messages in “real time” as they are produced, and send and receive
information simultaneously, and in sequence” (Driskell et al., 2003, pp. 298). Sharing the same
physical location provides distinct advantages for team members such as observing facial
expressions, gestures, and postures that may indicate the level of agreement or disagreement and
how committed team members feel toward one another. In addition, team members can perceive
changes in expressions and tone of voice that may signal potential problems; they are physically
aware of their conversational partners; who is speaking, who is listening, who is paying
attention; and when to offer feedback (Driskell et al., 2003). These contextual cues are essential
to situation awareness (SA) since they provide important information about team members and
what is happening in the immediate environment. Physically collocated team members also have
more opportunities for informal or spontaneous “water cooler discussions” that in turn, help
build a sense of team spirit (Kiesler & Cummings, 2002; Weisband, 2002). Team communication
also impacts the development of critical team processes such as trust and shared understanding,
which are considered “enablers” of distributed team performance. These team processes are
described in the next few paragraphs.
Receiver Receiver
(decodes message)
Sender
(encodes message)
Transmitter
Message
Noise Source
Feedback
21
2.4.1 Interpersonal Trust
Trust is necessary in teams due to the interdependent nature of teamwork. Due to the
interdependent nature of teams, members rely on each other for goal accomplishment, they must
be vulnerable and assume a certain level of risk as they interact (Krausman, 2013). In the
literature, Mayer, Davis, & Schoorman (1995, pp. 712), define interpersonal trust as “the
willingness of a party to be vulnerable to the actions of another party based on the expectation
that the other party will perform a particular action important to the trustor, irrespective of the
ability to monitor or control that other party.” According to McAllister (1997) there are two
components of interpersonal trust: affective trust and cognitive trust (Krausman, 2013).
Cognitive trust is grounded in a belief about the competence and reliability of team members.
For example, cognitive trust is established as team members demonstrate their capabilities in
performing tasks as well as their reliability in keeping their word and meeting deadlines (Rocco
et al., 2001). Affective trust, on the other hand, is based on the emotional connections and the
belief that team members genuinely care for each other (Rocco et al., 2001). Affective trust is
built as team members openly and honestly share ideas, concerns, and feelings with each other
(Krausman, 2013).
As shown in Table 2, communication is essential for developing interpersonal trust in
teams (Table 2). Through communication, team members learn to relate with each other, and lay
the groundwork for cooperation and positive future interactions (Gibson et al., 2003; Rocco,
Finholt, Hofer, & Herbsleb, 2001). Frequent social interactions among team members can help
build affective trust (McAllister, 1995). In addition, communication provides a vehicle through
which team members can express themselves and potentially reduces the frequency of conflict in
teams because of the open lines of communication (Gibson et al., 2003). Distributed teams may
find it more difficult to build and maintain trust without frequency of communication and the
informal interactions that take place in collocated teams (Krausman, 2103). Since
communication delays hinder social interaction and timely feedback, it is likely that
interpersonal trust will be lower when communication is delayed.

22
Table 2. Communication Behaviors and Actions that Facilitate Trust (adapted from Jarvenpaa et al., 1999, pp. 807)
Communication Behaviors that facilitated trust early in the team’s life:
• Social communication • Communication of enthusiasm
Communication Behaviors that helped maintain trust later in the team’s life:
• Predictable communication • Substantial and timely responses
Member Actions that facilitated trust early in the team’s life:
• Coping with technical uncertainty • Individual initiative
Member Actions that helped maintain trust later in a team’s life:
• Successful transition from social to procedural task focus
• Positive leadership • Unconcerned response to crisis
2.4.2 Trust in Technology
Several authors maintain that trust is not only an important aspect of human-human
interactions, trust is also essential as humans interact with technology (Hoff & Bashir, 2015;
Jian, Bisantz, & Drury, 2000, Schaefer, Chen, Szalma, & Hancock, 2016). Trust in technology is
defined as “a feeling of certainty that a tool, machine, or equipment will not fail and is often
based on inconclusive evidence” (Montague, Kleiner, & Winchester, 2009). Trust in technology
should cause users to accept or use a certain technology, and is a general assessment that the
technology is useful and reliable (Sheridan, 2002; Merritt & Ilgen, 2008). While trust in
technology can enhance system performance, it can also lead to system failures when the level of
trust in technology is inappropriate. Overreliance on automation was cited as a cause of the
crash of Eastern Airlines Flight 401 in the Florida Everglades, as the flight crew were unaware
that the autopilot had disengaged and the altitude of the plane was decreasing because they were
busy troubleshooting a problem with the landing gear (Parasuraman & Riley 1997). On the other
hand, when an operator lacks trust, they can disuse the technology. This is especially true when
systems provide false alarms and the operator tries to obscure or disable the alarm, leading to
accidents and injuries (Parasuraman et al., 1997). Both misuse and disuse of technology can
compromise safety and overall system performance (Lee & See, 2004).
Misuse and disuse of technology may depend on the user’s attitude and their level of trust
in a technology (Lee et al., 2004). In particular, many studies show that users respond socially

23
and react to technology in ways similar to human partners (Lee et al., 2004). When people trust,
there is a “secure willingness to depend on a trustee because of that trustee’s perceived
characteristics, such as trusting beliefs, trusting intentions, and trusting behaviors” (McKnight,
2005, pp. 330). Trusting beliefs is confidence that other team members are competent, have
integrity, and possess a level of benevolence. Through these qualities, trusting intentions are
created (McKnight, 2005). Trusting intentions means there is a level of vulnerability to the other
party which generates trusting behaviors (McKnight, 2005). Trusting behaviors are actions that
demonstrate that one party depends on the other party rather than trusting in oneself or trying to
control the other party (McKnight, 2005). Trusting behavior is the outward manifestation of
willingness to depend. For example, people can depend on others to perform a task such as
calculating numbers, or they can depend on a piece of software to perform the calculations. In
both of these instances, there is a trusting intention, or a willingness to depend (McKnight,
2005).
Most of these interpersonal trust characteristics can also be applied to trust in technology,
although the object of trust is different - technology or other people (McKnight, 2005). For
instance, both technology and people possess a level of competence in terms of what they can do,
meaning both are capable of performing a task or set of tasks (McKnight, 2005). However, the
main difference is in how to ascribe benevolence and integrity (McKnight, 2005). While these
traits are easily ascribed to humans, it is difficult to apply these characteristics to technology,
because technology is devoid of feelings (benevolence) and does not possess any moral qualities
(integrity). In other words, technology is trusted because of the capability it provides rather than
the degree of benevolence or integrity it possesses (McKnight, 2005).
In today’s work settings, the pervasiveness of technology has created a situation in which
humans and technology must necessarily work together in some fashion. Subsequently, users
must decide how best to interact with technology (Merritt et al., 2008). Based on the level of
trust in the technology, an individual may decide to use, or not use technology (Merritt et al.,
2008). Researchers suggest that trust in technology is built in a similar way as interpersonal
trust: positive experience and meaningful feedback. Just as people are reluctant to trust others if
they have no history or interactions have been difficult and unhelpful, users of technology are
reluctant to trust technology until they interacted with technology, and their interactions are

24
positive (McKnight, 2005). In remote teams, difficulties in communicating caused by
communication delays may negatively impact team member interaction and create reluctance to
use technology.
2.4.3 Shared Understanding
As mentioned previously, team members are by definition, interdependent. Although
there are many activities in which teams engage, their overall purpose is to coordinate activities
toward achieving a common goal. Therefore, team members must possess a shared
understanding of the goal they are working toward and the processes necessary to achieve these
goals. Shared understanding represents “a collective way of organizing and communicating
relevant knowledge, as a way of collaborating” (Hinds et al., 2003, pp. 21). Why is shared
understanding important for team performance? First, shared understanding helps teams
anticipate the decisions and actions of team members, which helps reduce the need to continually
monitor progress. Second, shared understanding also provides a level of certainty that team
members are in agreement and working toward the same outcome. Shared understanding also
can contribute to team member satisfaction and motivation, by creating a sense of team cohesion
as team members work together and learn about each other over time, which serves to promote
team identity formation and cooperation among team members (Peters, & Manz, 2007).
There are several factors that are thought to contribute to the development of shared
understanding in teams. Clearly, for teams that have had previous experiences working together
or are from similar backgrounds, shared understanding is easier to develop compared to teams
whose members have never met or never worked together, or whose members come from diverse
backgrounds (e.g., cross-cultural teams). Therefore, the more shared experiences and the longer
team members have known each other, the easier it should be to create shared understanding
(Hinds et al., 2003). In addition, communication has been shown to facilitate the development of
shared understanding as it provides the opportunity to share information and perspectives, talk
through problems, give and receive feedback, ask and respond to questions, helps keeps the team
on track, and reduces misunderstandings (Hinds et al., 2003).
In summary, regardless of the type of team, communication is the means through which
teams coordinate their actions and accomplish tasks. Distributed teams communicate for similar
reasons as traditional, nominal teams. What is different is how distributed teams communicate.

25
As described earlier, distributed teams are geographically dispersed and often do not have
opportunity for face-to-face encounters. Rather, their primary means of communication among
team members is through technology. Face-to-face interaction is characterized by (1) nearly
instantaneous interactions, (2) few, if any transmission lags, and (3) multiple verbal and
nonverbal cues to facilitate understanding (Whitaker, Fox, & Peters, 1993). Distributed
communication often lacks these characteristics. So, how will the properties of spoken
conversation change when team communication is mediated by technologies that lack these
characteristics? Of particular interest to this research was how delays in mediated
communication impact teamwork processes.
In the next section, a more thorough discussion of distributed communication is provided,
beginning with theoretical perspectives, and followed by a brief description of the advantages
and disadvantages of communication technologies.
2.5 Distributed Team Communication
2.5.1 Theoretical Perspective
In the literature, there are two main theories for understanding how different types of
communication technology affected distributed interactions: theories of social presence (Short,
Williams, & Christie, 1976), and media richness theory (Daft & Lengel, 1984). Both of these
theories claim that communication media/technologies differ with respect to their ability to
transmit different types of information (visual, verbal, and contextual cues), with text
transmitting the fewest number of cues. This is followed by audio, then video, and face- to-face
transmitting the most cues (Driskell et al., 2006).
2.5.1.1 Media Richness Theory
The media richness theory (MRT; Daft et al., 1984) suggests that communication
technologies differ with respect to the “richness” of information they transmit (Martins, Gilson,
& Maynard, 2004; van der Kleij, 2007). Information richness is a function of: “whether or not
feedback is immediate, quantity of social cues available, language variety, and the personal focus
of the medium” (Daft, Lengel, & Trevino, 1987, pp, 358). Immediate feedback refers to the
ability of the medium to provide near simultaneous, bi-directional communication between

26
sender and receiver. For example, a medium such as face-to-face interaction offers immediate
feedback with little delay other than the time required in considering how to respond to a
situation or request. In comparison, the use of keyed medium such as computer-mediated
communication (CMC) can be delayed significantly because of the time it takes to type the
message (Dennis & Kinney, 1998).
Second, communication media differ in the number of cues, such as voice tone or
gestures that can be communicated. And some technologies are better suited for transmitting
words, numbers, and graphic symbols (Daft et al., 1986). Subsequently, media that enable more
cues is presumably richer than those that enable fewer communication cues (Atkins, 2006).
From an MRT perspective then, text-based media such as email are considered less “rich” since
cues like gestures, body language, and voice cues are filtered out. Unlike face-to-face
communication, feedback is not immediate. For example, when compared to a high bandwidth
audio conference, the video in a low bandwidth videoconference is considered as “less rich” than
a high-bandwidth (quality) audio-only conference. Even though the videoconference has more
channels available, they are at a lower quality than that of the audio-conference and as a result,
the audio conference is deemed richer because more information is transmitted to the attendees
(Atkins, 2006).
Related to the concept of number of communication channels, is language variety
available to users. For example, text-based CMC, which is limited to the visual display of typed
language, can be considered leaner than a medium like the telephone, which also presents natural
language, but preserves the additional speech cues of tone, pitch, and volume. The visual
communication channel conveys non-verbal cues such as physical appearance, proximity, and
gaze including eye contact and therefore is considered a richer medium. Lastly, the concept of
personal focus refers to whether a medium was perceived to be personal or impersonal.
Technologies differ in richness and therefore differ to the degree they can fully support
team performance as well as reducing ambiguity and uncertainty (Andres, 2002). Uncertainty is
“the difference between the amount of information necessary to perform a task and the amount
of information already possessed by the team” (Daft et al., 1986, pp. 357). Highly uncertain
tasks necessitate that team members communicate in order to acquire the information required to
solve the problem or accomplish the task (Daft et al., 1986). Uncertainty reduction is best

27
managed using lean media, such as email and text-based communication since these media
transmit mostly factual information while minimizing the presence of socio-emotional cues
(Andres, 2002). Ambiguity exists when there are multiple or contradictory interpretations about
an organizational situation creating confusion and frequent misunderstandings (Daft et al., 1986).
To reduce ambiguity, rich media such as face-to-face or videoconferences are most suitable
because these media allow rapid exchange of information and support visual feedback cues that
facilitate understanding (Andres, 2002). In general, when performing uncertain tasks, people
prefer richer media, but with more routine tasks, less rich media is preferred (Andres, 2002).
2.5.1.2 Social Presence Theory
Social presence theory maintains that communication technologies differ with respect to
the degree of “social presence”, or the “feeling that communication is social, warm, personal and
sensitive” (Thatcher et al., 2003, pp. 204). Gunawardena (1995) suggested that social presence is
the experience of being more aware of a team member than the technology that allows the
interaction. The extent of social presence conveyed by a medium is directly related to its ability
to transmit rich social cues such as facial expressions, gaze, and gestures, which can be used to
express relevance, urgency, or concern with a statement or message, while verbal cues such as
tone of voice and back-channel cues (e.g. “hmm”, “okay”), help team members assess their
teammates level of attention, and acceptance of a message (Andres, 2002). Physical gestures can
also accompany a backchannel cue in order to emphasize team member concurrence or their
level of understanding. As the availability of social cues is reduced in a communication
medium, the presence of other team members involved in the interaction becomes less salient,
thereby diminishing the experience of social presence (Andres, 2002).
Social presence or the sense of connection among team members is considered to be
important for facilitating interpersonal processes and collaboration in online teams (Ubon, 2005).
Social presence is considered highest for face-to-face interactions, followed by
videoconferencing, audioconferencing, and text-based media (Bennett, 2009). Successful
communication and team dynamics have also been linked to the experience of social presence in
teams (Thatcher et al., 2003). In contrast, when social context cues are absent, the tone of team
interactions tends to be more negative, and less personal in nature, and reduces information

28
sharing in teams (Ubon, 2005). Not to mention that team members are likely to pursue self-
interests rather than group interests when social cues are reduced (Bennett, 2009).
Social presence and media richness theories were developed to explain the effect of
various types of communication media on distributed work teams as they interact and pursue a
shared goal (Kies, 1997). Therefore, these two theories are relevant with respect to the impact of
communication delay on distributed team interaction. While there have been some studies
investigating communication delays, these studies have approached the problem in terms of the
impact on conversations and the rules of social interaction. Few if any have addressed delays in
terms of the impact on team processes. It is likely that the delays in communication will disrupt
the immediacy of feedback and therefore will have a negative impact on task performance and
team processes. When considering the claims of social presence theory, delayed social context
cues would interfere with the social presence experienced by team members, and could manifest
itself in lower trust scores and lower satisfaction, supporting the hypothesis that trust and
satisfaction scores will be higher in the video condition since there are more cues available, even
when communication is delayed.
2.6 Communication Technologies
Distributed team members interact primarily, if not exclusively, using various
communication technologies such as email, conference calls, instant-messaging (IM), video-
conferencing, online chats, discussion forums, social media tools (e.g., wikis for collaboration
and blogs for knowledge sharing), and various document sharing tools (Gilson, Maynard, Young,
Vartianinen, & Hakonen, 2014; Hinds et al., 2003; Priest, Stagl, Klein, & Salas, 2006; Solomon,
2016). Technology provides teams with the ability to communicate and share information even
though they are remotely located from one another. Communication technologies can be
classified into one of two categories, synchronous, or asynchronous, depending on the type of
interaction they support (i.e. same time or different time). Each type of technology affords
different capabilities and opportunities for communication between team members.
Asynchronous communication technologies such as discussion forums, email, and bulletin
boards are better suited for interactions that occur in a “different time, different place mode
(Wainfan et al., 2004) while synchronous communication technologies such as Twitter, chat,
audio conferencing and video conferencing support real-time collaboration in a “same time,

29
different place” mode (van der Kleij, 2007; Wainfan et al., 2004). In addition, several “hybrid”
team communication platforms, such as Slack and Facebook Messenger have been developed
which provide access to an instant messaging capability, the flexibility of group communication
organized by channels or rooms, as well as document sharing and videoconferencing, and
therefore can support both asynchronous and synchronous interaction (Anders, 2016). Type of
task is also an important consideration for selecting either asynchronous or synchronous
technologies. For example, asynchronous technologies are adequate for less complex tasks,
because there is less of a need for interdependence and mutual exchanges. However, tasks that
are more complex typically require more interdependence and information sharing, and therefore
benefit from synchronous technologies because they maintain information richness, allow tightly
coupled interaction among members, and communication is immediate and reciprocal (Bell et
al., 2002).
Even as advanced communication technologies such as social media tools, document
sharing, Google Hangouts, Zoom, and GoToMeeting continue to expand in popularity, data
seems to suggest that distributed team members perceive more traditional forms of technology to
support their interaction. In a survey-based study, Solomon (2016, pp. 16) showed that 92% of
distributed team respondents considered frequent face-to-face meetings to be the best for
supporting team member interaction, followed by audioconferences (93%), video-conferences
(84%), and group emails (83%). While there are many applications in which asynchronous
communication is warranted, the current research focused on same time, different place
interactions so synchronous audio and video technologies (i.e., audioconference and
videoconference) that support real-time interaction (Table 3) were used in the present research.
Audioconferencing is frequently used for routine meetings so that organizations are not faced
with the additional expense of making sure team members are physically present. Although
distraction risks are high, hands on and hands off cell phone conferencing while driving are not
uncommon. Videoconferencing and video chat applications is also a useful way to reduce travel
time and expenses and is useful for rather than incur the expense of bringing team members
together and can be useful for complex problems in which it is easier to refer to an object or
unique situation rather than describe in verbally (Keebler, Dietz, & Baker, 2015).

30
Table 3. Communication Media Types (adapted from van der Kleij, 2007, pp. 15)
Same time Different times
Same place
Face-to-face collocated group work, supplemented with communication technologies
Asynchronous group work such as bulletin board
Different place
Synchronous distributed group work:
• videoconference • audio conference • instant message
Asynchronous distributed group work:
• email • discussion boards • voice mail
2.6.1 Audio and Video Communication Technology
In their seminal work, Ochsman & Chapanis (1974) evaluated the effectiveness of ten
communication channels on problem-solving in teams, and concluded that a voice channel is the
most critical medium. One caveat to the studies that have affirmed the need for an audio channel
is that audio quality is paramount (Tang & Isaacs, 1993). In fact, a recurring theme in the
literature is that if audio quality is poor, participants will use an alternative approach (Olson &
Olson, 2008). With respect to teamwork processes, audio conferencing permits the transmission
of certain backchannels that help team members achieve a shared understanding. And being able
to hear the tone of a partner’s voice can add meaning to words being said (Olson & Olson, 2014).
However, without visual cues which regulate conversations and allow monitoring of team
member behaviors (i.e., they are paying attention), users find it difficult to interpret the meaning
of silence (Thompson et al., 2006). In addition, some of the teamwork processes mentioned
earlier become difficult to enact with just an audio channel. Specifically, without visual cues
from either face-to-face or video technology, team members lose the ability to observe and
monitor remote team members. Without the capability to monitor team members, it is difficult
to provide timely feedback and backup assistance, and not being able to see remote team
members can make the development and maintenance of trust more challenging (Thompson et
al., 2006).
Video-conferencing provides additional cues not available in audioconferencing. Facial
expressions and body language provide additional information to inform meaning and

31
understand the status of team members (Olson et al., 2014). Being able to maintain eye contact
and expressions, conveys who is paying attention and who is confused (Olson et al., 2014).
There is also a social or emotional aspect as well as many users of video technology report that a
video connection provides an extra sense of “presence”. Similarly, work by Isaacs and Tang
(1994) and Watson (2001) evaluated video-conferencing as compared to audio-conferencing and
concluded that seeing those with whom you interact has significant social meaning. They further
concluded that the users’ desire for video is due to its beneficial effect on the conversational
process rather than from any perceived effect on the outcome. Another benefit is that
videoconference participants not only see their fellow team members, but they are also privy to
the immediate context and significant objects in the environment which helps facilitate
communication and situation awareness (Olson et al., 2014). An emerging technology that takes
videoconferencing even further with respect to the level of richness of the medium is 3D virtual
environments, in which several participants occupy the same 3D virtual space even though in
reality, they are separated geographically. In addition to sharing the same virtual space, 3D
virtual environments allow participants to move around, and interact with one another through
the use of avatars (Gilson et al., 2014)
Research into whether or not to incorporate a video channel has suggested mixed results.
Results of a study conducted by Olson, Olson, & Meader (1995) demonstrated that compared to
teams equipped with audio-only technology, video-mediated teams required less verbal feedback
however, team members verbalized significantly more to achieve a task outcome equivalent to
audio-mediated teams. Boyle, Anderson, & Newlands (1994) found that seeing a partner’s face
benefitted interaction compared to just audio-only interaction, as pairs with a video feed
communicated more efficiently than pairs who could only hear their partner’s voice. Anderson
et al., (1997) found that for remote conversations, low bandwidth video can significantly
interrupt communication flow and subsequent task outcomes. In addition, other work by
O’Malley et al., (1996) and Watson, (2001), suggested that the presence of a video channel may
cause increased cognitive load that can impair the conversational process. More recently,
Koulouri & Macredie (2017) found that visual feedback enhances communication efficiency.
However, having a video may also disrupt task performance because team members incorrectly
assume they possess a level of shared understanding that they do not. Lastly, Keebler et al.,

32
(2015) highly recommended a video channel in long duration space flight (LDSF) to keep all
team members current on a situation as well as for those any unique problems that occur and are
difficult to describe verbally. With respect to team composition, it appears that video is the most
beneficial medium for teams with experience working together, while newly formed teams will
be more susceptible to impression formation and other pitfalls (Thompson et al., 2006). And, for
teams composed of members who do not share the same native language, video is beneficial
(Veinott, Olson, Olson, & Fu, 1999).
The goal of the present research, was to expand the current understanding regarding the
utility of video technology for remote communication when communication between team
members is restricted by delays, as well as to further the existing research by providing
information concerning the impact of video-mediated communication on the development of
trust in remote teams when communication is delayed (Krausman, 2013).
2.7 Distributed Team Communication Challenges
A prominent theme in the literature is that proximity facilitates face-to-face interactions
(Poltrock & Englebeck, 1999) and has been shown to facilitate trust development in team
members (Jarvenpaa et al., 1998). When team members are proximate, they have several
opportunities to connect with one another either formally or informally. This has been shown to
benefit team productivity, as well as strengthen social ties, and increase the frequency of
communication (Poltrock et al., 1999). Unfortunately, these informal interactions are no longer
feasible when team members work remotely and are only accessible by email, phone, or
videoconference (Hinds et al., 2003). For remote teams, both communication frequency and
quality decrease as distance between team member offices increases (Poltrock et al., 1999). In
fact, when colleagues are separated by a distance of only 30 meters, they are less likely to
collaborate (Olson et al., 2003). Distributed arrangements have been shown to negatively impact
team effectiveness, time required to complete tasks, and satisfaction (Krausman, 2017). Also,
the physical distance between team members creates a burden to coordinate efforts and manage
team progress (Hinds et al., 2003). Another challenge is since distributed teams are not
constrained by physical boundaries, they are often composed of members with a variety of
backgrounds, disciplines, and cultures. Diversity within a team is not necessarily bad, as it
provides a broader knowledge base and more perspectives that can help with complex problems
33
(Vessey & Landon, 2017), but it also an inherent uncertainty that team members must overcome
in order to work together successfully (Peters et al., 2007).
Driskell et al., (2003) state that computer-mediated communication reduces the
availability of social contextual cues that help users extract meaning from conversations.
Similarly, mediated communication and a lack of shared work context may have implications for
developing shared understanding of team tasks, situation, and the task environment. This is due
to the fact that team members do not share the same work setting, cannot see each other’s work,
may have never formally met, and their interactions are mediated by technology (Cooke,
Gorman, Pedersen, & Bell, 2006; Hinds et al., 2003). Although communication technologies
enable team members to stay connected and share information, they are not able to provide the
same rich experience as face-to-face communication since social and nonverbal cues are
restricted (Fiore, Salas, Cuevas, & Bowers, 2003; Hinds et al., 2003). Further, the use of
communication technologies introduces yet another challenge that is likely to further complicate
distributed teamwork- communication delays (Dove-Steinkamp, 2012; Salas, Burke, & Samman,
2001). In some instances, delays can actually benefit team members. For example, delays that
occur in asynchronous interactions such as through email, may give users time to consider their
options and think about their decision before responding, even though it becomes more difficult
for team members to consider other options once their response has been recorded (Sharples,
Goodlet, Beck, Wood, Easterbrook & Plowman, 1993). However, delays can be detrimental in
real-time environments where situations are fluid and communication and information sharing is
paramount to team success, such as in air traffic control, space exploration, and military
operations (Salas et al., 2001).
It is important to note that with technological advances and better network management
strategies, the issue of communication delays and how delays are managed have improved, and
with the current pace of advances in network and communication technology, it is possible that
in the future, some delays could even be eliminated. However, until then, the challenge of
communication delays remains (Caldwell & Wang, 2009; Dove-Steinkamp, 2012; Fisher,
Mosier, & Orasanu, 2013; Fischer & Mosier, 2016; Vessey et al., 2017), as does the need for
collaboration among remote team members, and as a result, it is essential to further understand
how these delays impact team member interaction and propose ways to lessen their impact. In

34
the next section, several examples of delays in operational environments will be described,
followed by a review of laboratory based studies on the impacts of communication delays.
2.7.1 Real World Communication Delays
Of particular focus for the present research was how communication delays impact
distributed team member interactions when using synchronous audio and audiovisual
technologies to collaborate. As mentioned earlier, for the purposes of this research,
communication delay is defined as the interval of time between a message being spoken by a
team member and when it is rendered on the other side (Krausman, 2017).
2.7.1.1 Mobile Communications
For the most part, cell phone delays are just annoying, however, the effect of delays depends on
what application is being used. According to the International Telecommunication Union (ITU)
standard G. 114 (2003): “Interactive applications require real-time services. Examples of these
include speech and conversational video. They must have a short transmission delay, preferable
less than 200 to 300 ms; otherwise the delays will annoy the participants. The requirement for a
short delay has a direct impact on performance. The longer the acceptable delay, the longer the
interleaving can be, and a more efficient retransmission scheme can be used as well. Thus,
conversational services will require more capacity than non-real-time services because of the
lower delay requirements.” Table 4 presents the ITU recommendations for delay values and
their effects on voice communication.
So, even with current fourth generation (4G) and 4G Long-Term Evolution (LTE), some
latency still exists. Developers have now shifted attention to fifth generation (5G) which is being
designed to support mission critical services that are extremely sensitive to latency, such as
collision avoidance for connected vehicles and mobile health monitoring. In these safety-critical
application, the goal is to reduce delays to 1 – 2 milliseconds, which will require significant
changes to existing networks (CASA Systems, 2018). It remains to be seen if/when the goals
pertaining to 5G networks will come to fruition, mostly due to the fact that major changes to
current network architectures are required (CASA Systems, 2018). Further, it likely that current
3G and 4G networks will continue to exist and will be used for those applications that best fit the

35
capabilities of the network (CASA Systems, 2018). Taken together, it appears that latency, in
some form, will be a problem for some time to come.
Table 4. ITU Recommendations for one-way transmission time.
Delay Effects on voice communication 50 ms No audible delay
100 ms No audible delay if echo cancellation is provided and the link is of good quality
150 ms Starts to have an effect on voice communication
250 ms Significant disturbance; speaking style must be adapted
400 ms Upper limit to conversational audio 600+ ms No communication possible
(ITU - G.114, 2003)
2.7.1.2 VOIP (Voice over internet protocol)
Voice over internet protocol (VOIP) provides an alternative to a traditional analog telephone line
as users communicate using their high-speed internet connection. VoIP technology converts the
speaker’s voice into a digital signal that is portioned into packets which travel over the internet to
the intended recipient. VOIP call quality depends on several network characteristics such as the
device on which the client is running, the firewall/router configuration, network congestion, and
latency. When latency occurs, it delays packet delivery. From a user perspective, latency is
significant when it is greater than 250 milliseconds (ms) roundtrip. As mentioned previously, the
ITU recommends that latency should remain below 300 ms round-trip. Using VoIP over long
distances can create challenges. For example, a conversation between the U.S. and Asia should
utilize the shortest path circuit and the least number of hops to ensure the call is satisfactory
(Garson, 2017). There will always be some latency and ideally it’s best to minimize latency as
much as possible and keep round trip delays well below 250 ms (Wolfrey, 2019). Therefore the
current research will remain relevant for many years because the issue of latency is multi-faceted
and even with technological advances, it is likely that some latency will remain.
36
2.7.1.3 U.S. Army Operations
Recognizing the critical role that information plays in military operations, the U.S. Army
is investing heavily in advanced network technologies to support the needs of Soldiers who are
distributed across the battlefield. The primary goal is to provide an integrated network that
effectively supports information sharing, situational awareness, and decision making (Office of
Force Transformation, 2005). Some of these network technologies were evaluated in a field test
to evaluate how well they improved timeliness and accuracy of decisions (Krausman, 2013).
During the field test, networks were evaluated for amount of latency and message completion
rate (Krausman, 2013). Average one-way message latency ranged from 0.16 seconds to 1.8
seconds (Bowman & Zimmerman, 2010).
Follow-on email correspondence from the Chief Architect of the Command, Control,
Communications, Computers, Intelligence, Surveillance, and Reconnaissance (C4ISR) &
Network Modernization Office helped shed some light on network communication delays
(Briceno email correspondence, 2013), “For latency, we typically bin the ranges as low, med,
and high to dictate what tier of the architecture is being exercised, note that I said typically.
These are subjective ranges, but a good way to capture the expected latency for the various
locations the hosts are operating and who the end destination is targeted to be. Here are a few
estimates as to how I would characterize the various ranges. low: <500ms, med: 500-1500, high
as >1500”. “Low typically correlates to terrestrial networks where members are within a single
network and the neighbors are within reach within one hop. Delays in this group are typically
low (<100ms), but can scale due to network loading. The medium range is typically observed
under multi-hop conditions, latency across multiple networked systems, or because of network
fragmentation & healing. High latencies can be attributed to satellite communication
(SATCOM) delay and multi-satellite hops. It is important to note that there isn't any single
answer to correlate a latency metric to specific network types. For example, long latencies can
be observed for low data rate systems that are trying to push large amounts of data. Aside from
any latency due to theoretical physics (time it takes for signals to propagate a certain distance),
latency is dependent on the amount of information that is trying to be exchanged, the rate at
which data can be serviced, and the conditions the systems are under” (Briceno email
correspondence, 2013)
37
In an email interview conducted in in 2013, Major Nick Howard illustrated the reality of
communication delays he experienced during his deployment to Afghanistan: “However, the
biggest problem in Afghanistan was the complete LACK of radio communication. Due to the
mountains there were many times where we could only communicate via Blue Force Tracker
(BFT) or Force XXI Battle Command Brigade and Below (FBCB2) text messaging, which would
easily take 10+ minutes for a text to get through. This meant if you were under attack no one
would know for several minutes, and you could not coordinate for any supporting assets,
because by the time the request was seen, the firefight was usually done. There were a few times
when I was doing something like Blackhawk down (i.e. - talking to Battalion Tactical Operations
Center (TOC) via a pilot). These were always very difficult, because pilots do not understand our
perspective and vice versa, so there would be a lot lost in translation between me, the pilot, and
battalion.” In subsequent emails, Major Howard mentioned that the delay in FBCB2 text
messaging was actually due to the message having to travel back to the Continental United States
(CONUS) to be routed by the server and then travel back to Afghanistan. Although the present
work is not specifically addressing text message delays, it still provides a good example of the
types of delays encountered in military operations.
Since military operations rely heavily on data for making critical decisions, there is a
need for information to be both timely and accurate and therefore transmission delays are
problematic. Recent discussions at military conferences (i.e., MilSatCom USA, 2017) have
centered on the use of low-earth-orbit (LEO) and medium-earth-orbit (MEO) satellites that can
relay information more quickly than satellites in high orbit such as geostationary satellites,
located approximately 36,000 km above the equator. These satellites may be an effective way of
handling the ever-increasing data requirements among U.S. forces in Afghanistan and Iraq where
usable terrestrial infrastructure is lacking (Ferster, 2017). A satellite in geostationary orbit, with
a single-hop takes approximately 270 ms, one way, or 540 ms round trip (Berlocher, 2009).
Utilizing LEO and MEO satellites, which are positioned closer to the earth, may provide lower
latency and high capacity. For example, for an MEO satellite, orbiting at an altitude of 8,068 km,
the expected delay is a little more than 100 ms per hop (Berlocher, 2009).
38
2.7.1.4 U.S. Military Air and Missile Defense Networks
With respect to Air Defense, a high-speed data network is the backbone of air and missile
defense, yet the network is also extremely vulnerable to cyber-attacks, which creates an even
greater challenge. To address these challenges, the Army is investing in a complex network
called Integrated Battle Command System (IBCS). In a recent article about the importance of an
advanced network for air defense, Lieutenant Michael Lundy, commander of the Combined
Arms Center at Fort Leavenworth, Kansas, states, “We can allow some degradation when we’re
out there conducting ground maneuver. On the ground, most units move at a walking pace, so a
brief network outage isn’t crippling, and, in the worst case, young officers can break out their
paper maps and march to the sound of the guns. But in air and missile defense, both inbound
threats and outbound interceptors move at hundreds of miles per hour. So success requires
doing rocket science in real time.” Further, according to Colonel William Darne, Training and
Doctrine Command Capabilities Manager, “Getting data that are accurate enough and quickly
enough to hit an incoming missile with another missile requires certain specifications that aren’t
necessarily required for the rest of the network. There’s no doubt we need that network
capability (referring to IBCS), because of the rate of speed at which we process information.
Currently the Army relies on Link-16, the NATO standard datalink, but with Link-16 there are
latency issues that we have that cause problems” (Freedberg, 2017).
2.7.1.5 Air Traffic Control (ATC) Operations
One of the challenges in today’s airspace is well-orchestrated air traffic management with
increasing traffic density of commercial aircraft as well as the increasing prevalence of civilian
Unmanned Aerial Vehicles (UAV’s). Currently, regulations allow small UAVs operating in
visual line of sight, with increasing popularity. However, future integration seeks to extend the
range to include beyond visual line of sight (Cardosi & Lennertz, 2017). One human factors
issue being addressed by researchers at the Federal Aviation Administration (FAA) is
communication delays between Air Traffic Controllers (ATCs) and UAV pilots. In a simulation
study of ATCs coordinating commercial airline traffic concurrently with UAVs, (Comstock,
Ghatas, Consiglio, Vincent, Chamberlain, and Hoffler, 2015) investigated the impact of
communication delays and wind conditions on the execution of ground control station detect-
39
and-avoid and self-separation tasks. ATCs also rated the acceptability of resulting maneuvers.
Four different ATC-pilot voice communication latencies or delays were selected based on what
is expected during operations of UAVs controlled by combinations of ground and satellite links.
The latencies tested were 0, 400, 1200, and 1800 ms (one-way) communication delays. Results
showed that step-ons were found in all of the delay conditions, including 0 ms, and the frequency
and duration did not vary significantly across the delay conditions (Comstock et al., 2015).
Controller comments obtained after the experiment illustrated concerns for the longer delays, as
they increased the need for repeats when transmissions were blocked or interrupted, which
increased workload and irritations (Comstock et al., 2015).
Further, in work by Cardosi & Lennertz (2017), investigating the human factors aspects
of integrating UAVs into the National airspace, the authors observed that some ATC
representatives were not concerned about delayed communication in low-traffic segregated
airspace (i.e., airspace restricted to specific users). However, they did note that delays were even
more problematic in high traffic situations. Controllers also mentioned the need for a back-up
communication plan to be able to reach the UAV pilot if connectivity was lost (Cardosi et al.,
2017). These issues will only be compounded when UAV pilots begin controlling multiple
unmanned systems (Vu, Morales, Chiappe, Strybel, Battiste, & Shively, 2014).
2.7.1.6 Space Exploration
A major issue facing spaceflight teams is the presence of communication delays. As a
result, scientists at NASA Ames Research Center are exploring the issue of communication
delays to determine which parts of the human spaceflight experience are significantly impacted
by communication delays. Even in current space operations, delays are significant due to the
distance the information must travel. Although these distances vary according to the relative
position of the Earth and the destination of the message. According to Dr. Jeremy Frank, NASA
Planning and Scheduling Group lead, Autonomous Systems and Robots, “Communication delays
from Earth to Mars vary between 2 minutes and 22 minutes. Delays of 1.2 seconds, 50 seconds,
and 5 minutes have been used in several studies conducted at/by NASA.” (Email correspondence,
2012). NASA is exploring delayed voice communication in high-fidelity simulations of future
space exploration missions, using different environmental habitats that serve as analogs to the
austere conditions experienced by astronauts during spaceflight. For example, delays of 50

40
seconds have also been used in the desert research and technology studies (D-RATS), which is
equivalent to communication delays that occur between Earth and the International Space Station
(Kintz, Chou, Vessey, Leveton, Palinkas, 2016). Table 5 illustrates distances and expected delay
times.
Table 5. Circuit Distance Delay Time (one-way)
Circuit Distance Delay Time
Geosat Link (US-Aus) ~80,000 km 0.25 s
Earth-Moon 384,000 km 1.3 s
Earth-Mars 55 - 378 million km 3 - 21 minutes
Earth - Jupiter 590 - 970 million km 33 - 53 minutes
Earth - Pluto ~5800 million km 5 hours
Earth - Nearest Star ~40 million km 4 years
http://www.spaceacademy.net.au/spacelink/commdly.htm
There are a number of challenges that communication delays pose in space exploration. Data
from Love and Reagan (2013) provide insight into some of the challenges faced by astronauts
and ground crews when encountering communication delays (Table 6).
Table 6. Communication Delay Challenges
Challenge Description
1 Confusion of sequence of tasks
2 Interrupted calls
3 Wasted time waiting for response
4 Impaired ability to provide relevant information
5 No knowing who heard what
6 Perception of indifference
7 Slow response to events
8 Reduced situational awareness
(Love & Reagan, 2013)
As in any team, safety and success is predicated on the ability to effectively communicate and
collaborate, even with delays. Space crews are no different. With the increasing desire to

41
explore the outer regions of space, space-ground communication will encounter significant
delays, with a round-trip delay of up to 40 minutes for missions to Mars (Fischer et al., 2016).
Even though space crews traveling farther from the Earth will likely operate more autonomously,
there remains a need for crews to communicate and collaborate with mission control. While
future technological solutions that focus on faster transmission may someday provide seamless
communication, the technology does not yet exist. As a result, to address the challenges of
communication delays for today’s space crews, researchers have explored solutions that focus on
alternatives to transmission speed (Fischer et al., 2016). For example, Fischer & Mosier (2015)
examined the feasibility of voice with text-based communication protocols that use
communication templates to keep track of conversational threads and the ordering of messages.
Similarly, Love et al., (2013) demonstrated that using text messaging as a compliment to voice
communication may alleviate some of the challenges of delayed communication. Based on post-
experiment comments from astronauts and ground personnel, Kintz et al., (2016) proposed three
categories of countermeasures; (1) training focused on improving communication skills as well
as task-specific training for both space crews and their ground-based counterparts, (2) increasing
crew autonomy to reduce communication volume, and (3) investing in tools such as voice
recordings and text-based technology so crews had a record of interactions. Further, Dove-
Steinkamp (2012) found that practicing under conditions of delay may benefit skill acquisition
and team performance in novel settings.
2.8. Summary
Even though technology has advanced to the point that delays hase improved, there are still
instances where it can be problematic as demonstrated by the discussion of real-world delays. In
some instances, communication delays may just be annoying, however, in other situations,
delays can be problematic as they can delay access to information that is necessary for timely
decision making. With the push to explore even farther regions of space, it is likely that
communication delays will be an important topic for many years to come. In the following
paragraphs, empirical work documenting the impact of communication delays on distributed
teams is presented.

42
2.9 Empirical Work on Communication Delays
(Summarized in Table 7)
Beginning in the late 1960’s, Krauss et al., (1967) examined the effects of audio
transmission delays of 0, 0.6 seconds, and 1.8 seconds on a two-person communication task.
Same-gender dyads performed a picture identification task where team members assumed the
role of speaker or receiver. Encoding efficiency, measured as the number of words spoken was
similar for the 0 and 0.6 second conditions. However at the 1.8 second delay, communication
was less efficient, and participants tended to rate their partners as less attentive than in the other
two conditions. In Brady (1971), participants did not notice a constant 600 ms or 1200 ms delay
that occurred during a 10-minute simulated conversation over a telephone circuit. Participants
did however notice a level of confusion as well as overlaps in turns. Brady (1971) concluded
that although participants did not specifically notice the delay, they knew there was a problem
and wound up attributing it to their partner. Kitawaki and Itoh (1991) studied the effects of
audio delays ranging from 0 to 4 seconds on speech quality while performing six conversational
tasks requiring various levels of interactivity and conversational tempo. They found that a round
trip delay of 500 ms was the maximum delay length without detrimental effects on
communication.
In casual conversation, overlapped speech can be perceived as annoying (Armstead,
2007). However, in operational environments, speech overlaps may result in dangerous losses of
task-relevant information. For instance, overlapped speech between pilots and air traffic
controllers was determined to be one of the major causes of the collision of two Boeing 747s on
the Spanish island of Tenerife in 1997 that killed 583 people (Armstead, 2007). Nadler,
Mengert, DiSario, Sussman, Grossberg, & Spanier (1993) conducted an ATC simulation study,
investigating delay length and impact on the number of step-ons. Four audio delay conditions
were used 225/0, 169/70, 429/330, 485/260 ms, which corresponded to different ground-to-
air/air to ground delays produced by two types of equipment: voice switching and satellite
equipment, respectively. When communication workload was at its highest, an additional 260 ms
satellite delay yielded a significant increase in step-ons (150%). Step-ons also significantly
increased when satellite delays were added to the 169/70 delay condition. Similarly, Farncombe
(1997) investigated four audio delay conditions: 130, 280, 400, and 550 ms. Controllers reported

43
higher workload and more step-ons at the 400 and 550 delay levels, leading the authors to
conclude that delays in excess of 400 ms are problematic in ATC operations.
Armstead (2007) investigated the impact of longer audio communication delays of 4, 8,
12, and 16 seconds on task accuracy, quantity of communication, and frequency of overlapped
speech. These delay lengths correspond to those experienced between space crews and mission
control. Same and male-female dyads performed two tasks concurrently, one was performed
independently, while the second task required the dyad to collaborate. Results indicated that
longer delays (i.e., 4 & 8 seconds) progressively degraded collaborative task performance but
performance on the individual tasks was not affected. With longer delays of 12 and 16 seconds,
performance degradation began to slow, although performance on the collaborative task
remained poor. With respect to gender composition, female-female dyads experienced greater
decrements in shared task performance at the longer 8 and 16 second delay, than male-male and
male-female teams. Male-male and female-female teams communicated significantly more than
the male-female teams, as did female-female teams compared to male-male teams (Armstead,
2007). Contrary to findings of other studies, the authors found a decrease in overlapped speech
as delays increased, and increases in overlapped speech was an indicator of better task
performance.
With respect to findings from studies using audio coupled with video-based technology,
Krauss, Garlock, Bricker, & McMahon (1977) conducted a follow-on study to their initial
experiment using an audio system (Krauss et al., 1967). They included a visual channel to
determine how the addition of visual backchannels would impact task performance, and
encoding efficiency measured as the number of words used to convey information to a team
member, with a no delay and 1-second delay condition. Results indicated that encoding
efficiency was greater in the no delay condition compared to delay. However, results indicated
that video access resulted in performance equivalent to the no-delay conditions. For dyads in the
no delay conditions, no effect of visual access was found. Further, dyads assigned to the delay
condition reported more difficulty communicating than dyads that communicated without delay.
Work by Tang et al., (1993) compared face-to-face meetings with video-conferencing
and found that a one-way 570 ms delay in the audio portion of the conference clearly disrupted
turn-taking. They also found that users liked having video as part of a conferencing system, but

44
they were less tolerant of an audio delay than a video delay. In response to the audio delay,
meeting participants switched off the audio portion of the conference, preferring instead to use
speakerphones as their audio source. While this alleviated the annoying delay, the audio quality
was poorer, audio arrived before the video signal, and the speakerphone only transmitted one
speaker’s voice at a time (Wainfan et al., 2004). Still, users preferred this arrangement to the
annoying delays, confirming the adverse effect of audio delays in remote activities.
O’Conaill et al., (1993) compared face-to-face conversations with those conducted using
two video conferencing technologies, or Integrated Service Digital Network (ISDN). This is
similar to legacy high speed internet service, which is subject to delays between 410 and 720ms,
and LIVE-NET with nearly instantaneous transmission. In comparison to face-to-face
interaction, communication with ISDN was characterized by longer turns, potentially in an
attempt to reduce overlaps and interruptions. However, with longer turns, there were fewer
back-channels and team members adopted a formal approach when taking turns. LIVE-NET
elicited conversations that were similar, yet not equivalent to those that occur in face-to-face
interactions. O’Conaill et al., (1993) noted that when turn-taking becomes difficult, team
members may increase the length of speaking turns to minimize the number of interruptions and
overlapped speech. Similar findings were reported by Cohen (1982), in which a simultaneous
705 ms delay of audio and video, also created longer conversational turns, with fewer speech
overlaps. While longer turns may reduce the incidence of interruptions and overlapped speech,
team members lose the quick exchanges that help bring clarity. In addition, when back-channels
are absent, speakers may share excessive or even repeat information, creating obstacles for team
success (O’Conaill et al., 1993).
In a study conducted by O’Malley et al., (1996), the authors concluded that
communication delays of 0.5 seconds increased the quantity and frequency of speech overlaps,
and subsequently degraded accuracy on a map drawing task. However, the number of turns,
number of words, and length of turns were not impacted by the delay or having access to visual
cues. During the task, the speaker described the route drawn on the map to the receiver who then
attempted to draw the same route on their map. Dyads performed the map task while either face-
to-face, or using video technology. However, there were almost three times as many
interruptions in the delay condition compared to no delay. Task accuracy was 36% poorer with

45
the delay compared to the no delay condition. No benefit was shown for the video. Dyads using
videophones were 40% less accurate than dyads using just a telephone and almost 50% of
speaker turns were interrupted when using the video, which is contrary to results from Krauss et
al., (1977), who found a beneficial effect of video (O’Malley et al., 1996).
Yet another challenge that communication delays pose for distributed teams is that the
delayed feedback and disrupted conversations may affect the emotional experience of team
members (Krausman, 2013). For instance, in Renfro-Powers, Rauh, Henning, Buck, & West
(2011), unacquainted dyads participated in two 10-minute discussions on political ideology over
a video channel either with no delay (control), or with a 1-second delay (treatment). Delayed
feedback increased cognitive load and partner’s experience of frustration, leading to inaccurate
interpersonal judgments. In Parkinson et al. (2011), dyads participated in two 5-minute
discussions about liked and disliked celebrities using a desktop videoconferencing system, either
with almost instantaneous transmission (low delay) or a delay of 200 ms (high delay). The
authors concluded that, “lacking immediate interpersonal feedback seems to result in greater
disengagement from interaction when you do not share the other’s opinion about a topic, pp.
114.” And, participants felt more connected with their partner when they could maintain a high
conversational tempo (Parkinson et al., 2011).
In a study of the impact of communication delay on the interactions of ethnic groups.
Pearson, West, Dovidio, Renfro-Powers, Buck, & Henning (2008), found that with audiovisual
delays, participants anxiety increased, and their desire for contact with intergroup partners
decreased (Krausman, 2013). Ruhleder et al., (2001) suggested that the negative impact of
technology-generated delays and the subsequent impact on conversations- more interruptions,
overlaps, and repeated phrases, may be partly responsible for the feelings of discomfort, and
uncertainty regarding other’s competence often reported by users of communication
technologies. Findings of the three studies cited here confirm that the temporal dynamics of
interaction are central to their affective consequences. In light of these findings, delays in
temporal feedback may have implications for the development of affective trust and the ability of
team members to accurately evaluate team member emotions, especially when team members are
relatively unacquainted.
46
In summary, communication delays pose challenges for distributed team members,
perhaps even compounding the inherent challenges of using technology-mediated
communication. Existing studies suggested that communication delays interfere with remote
conversations; disrupting the smooth flow of conversations, increasing speech overlaps, creating
confusion among participants, and eliciting negative attitudes and emotions. However, studies
addressing how communication delays may affect team processes, such as trust and shared
understanding, are limited (Krausman, 2013). Further, the literature is sparse with respect to
how delays affect teams with different compositions, like gender-diverse teams or teams with
familiar and unfamiliar members. Understanding the impact of delay is important especially in
light of the fact that distributed teams and communication technologies continue to propagate.
Consequently, the present research, described in the next few chapters, was designed to help fill
this void as the issue of communication delays is addressed, and the subsequent impact on
remote team processes and collaboration is addressed.

47
Table 7. Summary of Audio Communication Delay Studies
Article Title Author(s) Method Measures Technology Results Effects of Transmission Delay and Access Delay on the Efficiency of Verbal Communication (1967) Source: Journal of the Acoustical Society of America
R. Krauss P. Bricker
3 x 10 mixed design. 3 delay levels (0 sec, .6 sec, 1.8 sec), 10 sessions. Pairs performed picture identification task for 30 trials (10 blocks of 3). Each partner played role of the sender who described the picture and the receiver who identified which picture the sender described.
Efficiency measured by: 1. Number of sender words uttered 2. Number of utterances of sender and receiver Questionnaire evaluated the circuit, their own performance and their partner’s.
Audio - microphone and headset
Fewer words in 0 and 0.6 sec delay than 1.8 sec. delay. Number of words decreased across trials. 1.8 sec. delay increased utterance length not frequency. Subjective data: 1.8 sec. delay more difficulty communicating. Pairs in 1.8 sec. delay rated partners as less attentive.
Effects of Transmission Delay on Conversational Behavior on Echo-Free Telephone Circuits (1971) Source: Bell System Technical Journal
P. Brady No delay, 600, and 1200 ms Dyads (mutual friends) talked for 10 minutes on topics of mutual interest in no delay and one delay condition
Talk spurts Periods of silence Simultaneous speech Confusions
Audio channel – simulated telephone circuit
Significant increase in simultaneous speech and silence during delay conditions. Increased confusion with simultaneous speech. No subjects reported anything unusual in the delay condition.
The Role of Audible and Visible Back Channel Responses in Interpersonal Communication (1977) Source: Journal of Personality and Social Psychology
R. Krauss C. Garlock P. Bricker L. McMahon
Same sex dyads performed picture identification task for 30 trials. Each partner played role of sender (described picture) and receiver (identified picture). 2 x 2 x 2 x 10 Mixed design: 2 - Sex (between) 2 - Delay (between) 2 - Technology (between) 10- Block (within)
Encoding efficiency (number of sender words uttered in each of the successive 10 – 3 trial blocks). Questionnaire evaluated the circuit, their own performance and their partner’s.
Audio channel with 1 second access delay (i.e., access to the audio channel was denied when partner was talking. Video channel
Pairs in delayed audio used more words than no delay Video enhances efficiency when audio delay restricts back channels. No effect of video in no delay condition. Pairs in delay condition reported more difficulty communicating with delays.

48
Article Title Author(s) Method Measures Technology Results Speaker Interaction: Video Teleconferences versus Face-to-Face Meetings (1982) Source: Proceedings of Teleconferencing and Electronic Communications
K. Cohen Teams of 6 – 8 employees 2 x 2 Mixed design Type of task (within factor) 1. Consensus task 2. Role playing task Communication medium (between factor) 1. FTF 2. Video conference (delay of 705 ms for audio and video). 20 minute discussions
Speaker behavior: 1. Frequency of speaker exchanges. 2. Simultaneous speech events. Questionnaires: 1. Ease of Comm. 2. Social Dynamics 3. Perceived effectiveness of media
FTF across a conference table. Video conference technology called PICTUREPHONE Meeting Service (PMS)
Twice as many speaker exchanges and SSE for the FTF meetings than PMS • FTF more interactive • PMS more orderly Communication media rated differently in their perceived effectiveness. Video rated more like FTF than telephone interaction.
Pure Delay Effects on Speech Quality in Telecommunications (1991) Source: IEEE Journal on Selected Areas in Telecommunication
N. Kitawaki K. Itoh
Studied effects of pure delay on speech quality while performing 6 conversational tasks. Delays ranged from 0 to 4 seconds.
Detectability threshold Opinion rating Conversational efficiency
Audio (using simulated telephone conversation)
Minimum detectable delay varied from 90 ms to over a second depending on task. Round trip delays of 500 ms ill effects on communication.
Conversations Over Video Conferences: An Evaluation of the Spoken Aspects of Video-Mediated Communication (1993) Source: Human-Computer Interaction
B. O’Conaill S. Whittaker S. Wilbur
20-min conversation during a meeting. Compared face-to-face interaction with two video conferencing technologies.
Conversational characteristics: • Backchannels • Interruptions • Overlaps • Handovers • Turn size • Turn distribution
2 Video-conferencing technologies: 1. LIVE-NET: high-quality video system, full duplex audio, no delays) 2. ISDN: half-duplex audio, delays, poor picture quality.
ISDN: longer conversational turns, fewer interruptions, overlaps, and backchannels, and increased formality when switching speakers. LIVE-NET more similar to FTF meetings, but did not replicate FTF.
Effects of Satellite and Voice-Switching Equipment Transmission Delays on ATC Communications (1993) Source: Int. Journal of Aviation Psychology
E. Nadler P. Mengert R. Disario E. Sussman M. Grossberg G. Spanier
Simulation experiment. Four delay conditions: 225/0, 169/70, 429/330, 485/260 ms. (ground to air/air to ground delays) IVs: delay, communications workload, and sector.
Step-ons: • Pilot-Pilot (P-P) • Controller-Pilot/Pilot-
Controller (CP-CP)
Audio system (headset and push to talk switch)
Increased step-ons when communication workload high. More step-ons at 429/330 and 485/260 ms delay compared to 225/0 and 169/79 ms delay with increase in repeats.

49
Article Title Author(s) Method Measures Technology Results Comparison of Face to Face and Video Mediated Interaction (1996) Source: Interacting with Computers
O’Malley, Doherty-Sneddon, Anderson Langton Bruce
Pairs performed a map task with video using videotunnel and with audio only (videophone – no video). Examined if video would help turn taking for audio delays.
Accuracy in drawing route Task completion time • Number of turns • Number of words • Rate of Interruptions • Backchannels
1.Video tunnels 2. Videophones – behaves like a phone but with video link (when used) causes a delay of 500 ms.
Pairs in audio delay condition 36% less accurate than no delay. 3 times more interruptions and fewer backchannels for delay vs. no delay. Video not helpful for turn taking with delay.
Investigations into the operational effects of the VDL Mode 3 voice throughput delay (1997) Source: Aeronautical Mobile Communications Panel Working Group
D. Farncombe
Simulation experiment. Four delay conditions: 130, 280, 400, 550 ms
Communication task performance Flight path efficiency Workload (NASA TLX)
Audio system (headset and push to talk switch)
Fewer transmissions at 400 and 550 ms delay (used shorter, more complex messages) More variability in flight paths arrival traffic with delay. More step-ons at 400 and 550 ms delay (delays > 400 ms not suitable for ATC).
Co-Constructing Non-Mutual Realities: Delay-Generated Trouble in Distributed Interaction (2001) Source: Journal of Computer Supported Cooperative Work
K. Ruhleder B. Jordan
Analysis of video-mediated meetings over 4 month period. Interaction analysis of a 19 minute audio segment.
Unintended interruptions Rephrasing Misapplied feedback
PictureTel video-conferencing technology with inherent delay of about 1 second.
Implications for learning and technology development
Time Delays in Air Traffic Control Communication Loop: Effect on Controller Performance and Workload (2004) Source: Int. Journal of Aviation Psychology
E. Rantanen J.McCarley X. Xu
Two Experiments: Eight air traffic control specialists performed simplified control tasks under four levels of audio delay (AD): 150, 250, 350, 1000 msec and two levels of pilot delay (PD): no delay and realistic delay
Vector accuracy (Experiment 1) Lateral separation between two aircraft (Experiment 2) Workload (NASA TLX)
Audio technology (headset and push to talk switch)
Experiment 1: PD reduced vector accuracy; resulted in early turn initiation, increased workload ratings. Experiment 2: AD and PD reduced distance between aircraft for longer delays; no impact on workload ratings.
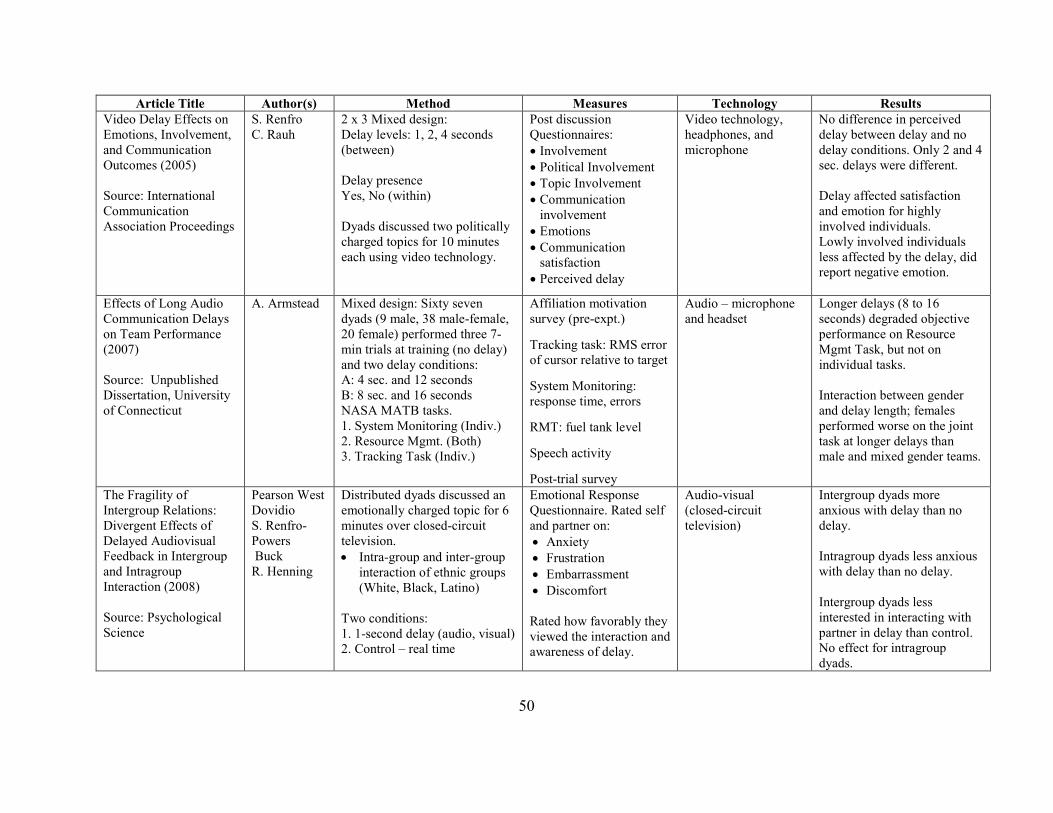
50
Article Title Author(s) Method Measures Technology Results Video Delay Effects on Emotions, Involvement, and Communication Outcomes (2005) Source: International Communication Association Proceedings
S. Renfro C. Rauh
2 x 3 Mixed design: Delay levels: 1, 2, 4 seconds (between) Delay presence Yes, No (within) Dyads discussed two politically charged topics for 10 minutes each using video technology.
Post discussion Questionnaires: • Involvement • Political Involvement • Topic Involvement • Communication
involvement • Emotions • Communication
satisfaction • Perceived delay
Video technology, headphones, and microphone
No difference in perceived delay between delay and no delay conditions. Only 2 and 4 sec. delays were different. Delay affected satisfaction and emotion for highly involved individuals. Lowly involved individuals less affected by the delay, did report negative emotion.
Effects of Long Audio Communication Delays on Team Performance (2007) Source: Unpublished Dissertation, University of Connecticut
A. Armstead Mixed design: Sixty seven dyads (9 male, 38 male-female, 20 female) performed three 7-min trials at training (no delay) and two delay conditions: A: 4 sec. and 12 seconds B: 8 sec. and 16 seconds NASA MATB tasks. 1. System Monitoring (Indiv.) 2. Resource Mgmt. (Both) 3. Tracking Task (Indiv.)
Affiliation motivation survey (pre-expt.) Tracking task: RMS error of cursor relative to target System Monitoring: response time, errors RMT: fuel tank level Speech activity Post-trial survey
Audio – microphone and headset
Longer delays (8 to 16 seconds) degraded objective performance on Resource Mgmt Task, but not on individual tasks. Interaction between gender and delay length; females performed worse on the joint task at longer delays than male and mixed gender teams.
The Fragility of Intergroup Relations: Divergent Effects of Delayed Audiovisual Feedback in Intergroup and Intragroup Interaction (2008) Source: Psychological Science
Pearson West Dovidio S. Renfro-Powers Buck R. Henning
Distributed dyads discussed an emotionally charged topic for 6 minutes over closed-circuit television. • Intra-group and inter-group
interaction of ethnic groups (White, Black, Latino)
Two conditions: 1. 1-second delay (audio, visual) 2. Control – real time
Emotional Response Questionnaire. Rated self and partner on: • Anxiety • Frustration • Embarrassment • Discomfort
Rated how favorably they viewed the interaction and awareness of delay.
Audio-visual (closed-circuit television)
Intergroup dyads more anxious with delay than no delay. Intragroup dyads less anxious with delay than no delay. Intergroup dyads less interested in interacting with partner in delay than control. No effect for intragroup dyads.

51
Article Title Author(s) Method Measures Technology Results Video-linking Emotions (2011) Source: Face to- Face Communication over the Internet
B. Parkinson M. Lea
Dyads conversed in two 5-minute conversations in two delay conditions: • normal transmission delay • minimal transmission delays
Ratings of agreement for various celebrities: liked and disliked.
Video communication High delay: Participants rated the video more negatively in the high delay and had more difficulty communicating. More aware of lack of eye contact in delay conditions. “Lacking immediate interpersonal feedback = greater disengagement when you do not share the other’s opinion about a topic.
The effect of video feedback delay on frustration and emotion communication accuracy (2011) Source: Computers in Human Behavior
S. Renfro-Powers C. Rauh R. Henning R. Buck T. West
One-way within subject design: Amount of Feedback Delay:
1. No delay 2. 1 second
Participants discussed two politically charged topics during two 10-minute sessions (called period 1 and period 2).
Post-discussion questionnaires measured: • Previous acquaintance • Delay perception • Frustration • Assumed similarity • Emotion
communication
Video monitor system Period 1: delay decreased frustration, increased ability to judge a partner’s emotions. Period 2: delay increased frustration, no effect on ability to judge partner’s emotions. Perceived delay used as predictor of frustration but had no interaction with delay.

52
Chapter 3. Methodology
An experimental methodology was designed to determine how audio communication
delays impact task completion time, shared understanding, satisfaction, information exchange,
mental workload and interpersonal trust, trust in technology, and satisfaction among team
members. Additionally, the methodology included audiovisual technology to examine how
additional visual cues provided by a video channel may lessen the effect of communication
delays. Finally, two team composition variables were incorporated to determine how
communication delays impact teams of same and mixed gender, as well as teams with members
who are, or are not, familiar with each other.
3.1 Participants
Sixty participants, (30 dyads) were recruited from the military and civilian population at
Aberdeen Proving Ground (APG). As indicated on the demographic survey (Appendix B), all
participants spoke English as their first language and overall, participants reported they were
“experienced” with telephone, cell phone, videoconference, audioconference, and email
communication technologies. Further, all participants met baseline audio and visual acuity test
criteria as described in the experimental procedures. The mean (SD) age of participants was 34.4
(11.1). Participants were randomly assigned to a dyad based on their availability to participate,
and with the constraint of collecting enough data from same (female-female, male-male) and
mixed gender (male-female) teams, as well as teams with unfamiliar and familiar members, to
address the research questions. In total, there were 21 same-gender and 9 mixed-gender teams;
20 unfamiliar and 10 familiar teams. And with respect to gender and familiarity, there were 13
female - unfamiliar teams, 8 female - familiar teams, 7 male - unfamiliar teams, and 2 male -
familiar teams. To assess member familiarity, dyad members were instructed to consider their
team member in the context of previous work teams, work projects, or social interactions at, or
outside of work and rate their familiarity level using a four-point scale: 1 = I do not know this
team member, 2 = I am an acquaintance of this team member, 3 =I know this team member well,
4 = I know this team member very well (Gruenfeld et al. 1996). Dyad membership remained the
same for the duration of the experiment.
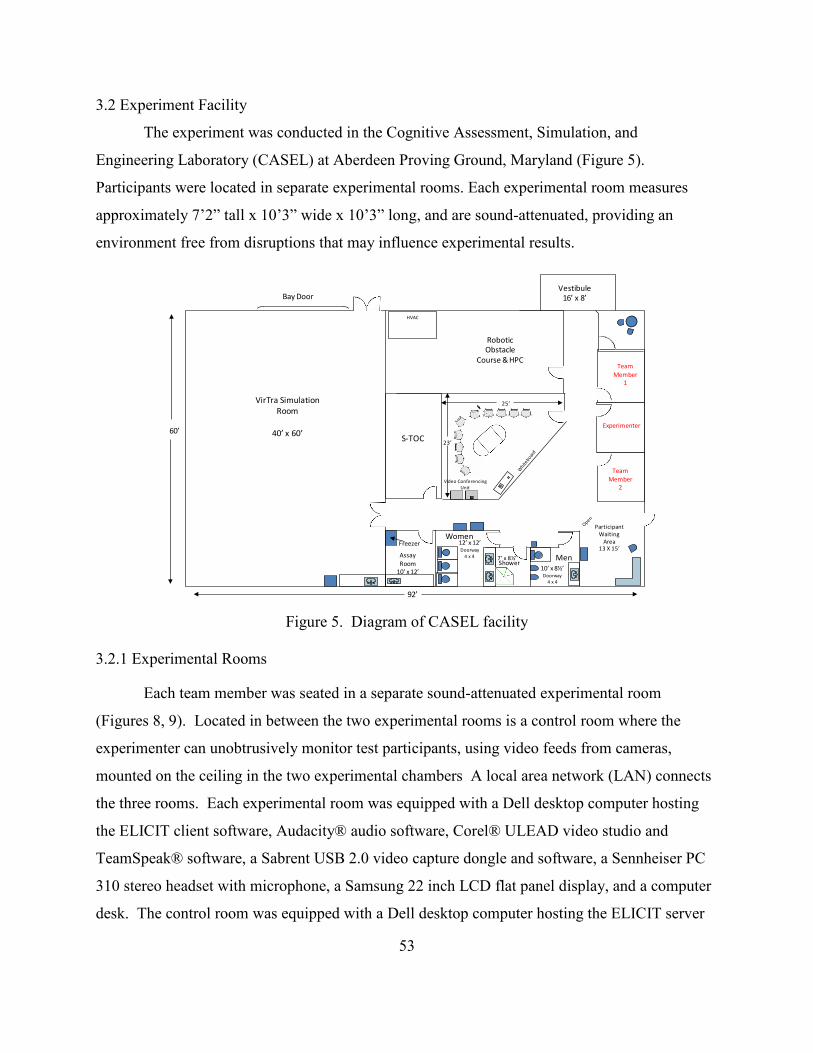
53
3.2 Experiment Facility
The experiment was conducted in the Cognitive Assessment, Simulation, and
Engineering Laboratory (CASEL) at Aberdeen Proving Ground, Maryland (Figure 5).
Participants were located in separate experimental rooms. Each experimental room measures
approximately 7’2” tall x 10’3” wide x 10’3” long, and are sound-attenuated, providing an
environment free from disruptions that may influence experimental results.
Figure 5. Diagram of CASEL facility
3.2.1 Experimental Rooms
Each team member was seated in a separate sound-attenuated experimental room
(Figures 8, 9). Located in between the two experimental rooms is a control room where the
experimenter can unobtrusively monitor test participants, using video feeds from cameras,
mounted on the ceiling in the two experimental chambers A local area network (LAN) connects
the three rooms. Each experimental room was equipped with a Dell desktop computer hosting
the ELICIT client software, Audacity® audio software, Corel® ULEAD video studio and
TeamSpeak® software, a Sabrent USB 2.0 video capture dongle and software, a Sennheiser PC
310 stereo headset with microphone, a Samsung 22 inch LCD flat panel display, and a computer
desk. The control room was equipped with a Dell desktop computer hosting the ELICIT server
VirTra SimulationRoom
40’ x 60’
Robotic Obstacle
Course & HPC
ParticipantWaiting
Area13 X 15’
Bay Door
Experimenter
Team Member
1
TeamMember
2
Assay Room
10’ x 12’
Women
ShowerMen
Freezer
10’ x 8½’Doorway
4 x 4
12’ x 12’Doorway
4 x 4 7’ x 8½’
Vestibule16’ x 8’
HVAC
92’
60’S-TOC
Video Conferencing Unit
25’
23’

54
software, Audacity audio software, Corel® ULEAD video studio, TeamSpeak® software, a
Sennheiser PC 310 stereo headset with microphone, two Samsung 22-inch LCD flat panel
displays, a computer desk, a JVC video monitor and Sima® SFX-10 Video Effects Mixer to
monitor both team members, a Presonus® audio mixer and Adobe® Audition software used to
record team member conversations for each experimental condition. To ensure consistency
across trials, participants were seated in a chair approximately 16 inches away from the computer
monitor (Figure 6).
Figure 6. Experimental Room Layout
3.2.2 Equipment: Audio Condition
In the audio condition, team members communicated with one another using a
Sennheiser PC 310 stereo headset with microphone over a full duplex audio channel. Participants
in the audio condition did not see the video image of their partner (Krausman, 2013).
Communication between the team members was supported through Audacity® and the
experimenter utilized TeamSpeak© (TeamSpeak Systems GmbH) software to communicate with
team members. Team member conversation were recorded throughout the duration of the
experiment using Adobe Audition® software and the Presonus® Audio Mixer.
3.2.3 Equipment: Audiovisual Condition
In addition to the equipment used in the audio condition, the audiovisual condition
consisted of two Canon Vixia HF R11 digital camcorders along with Corel® Ulead Video Studio
software that captured and displayed video images of each team member on the LCD monitor

55
(Figure 8). Similar to the audio only condition, team member conversations were recorded using
Adobe Audition® and the Presonus® audio mixer. Video recordings of team conversations were
made using the Sabrent USB 2.0 video capture dongle and software. Back-up recordings were
made using the Canon digital camcorders. Video frame rate was set at 30 fps, which is the
National Television Standards Committee (NTSC) standard for television broadcasts in the
United States and Japan (Kies, 1997). The approximate size of the video image displayed on the
monitor using ULEAD video studio was 4.5 inches x 5 inches at a resolution of 1680 x 1050,
which is consistent with work by Monk & Watts (1995) who found that conversations were more
fluent with a larger video (4 inches x 5.5 inches) than a small video (1.5 inches x 2.5 inches).
Video images of dyad members consisted of head and shoulder views which have been shown to
be preferred to head only views to produce more efficient discourse (Frowein, Smoorenburg,
Pyters, & Schinkel, 1991; O’Malley et al., 1996). In the present study, head and shoulders views
were maintained by adjusting the height of the video camera, and having participants sit at a
distance of 30 inches from the video camera (Figure 7). No video camera zoom functions were
used.
NOTE: Hardwired connections were used for all hardware supporting the Audio and Audiovisual conditions, no network was used.
Figure 7. Participants performing ELICIT task in audio-visual condition
3.2.4 Equipment: Delay technology
The DelayLine Video and Audio Delay System (Allen Avionics, Inc.), Model 3.2, a
commercially available product was used to delay the audio and video being exchanged between
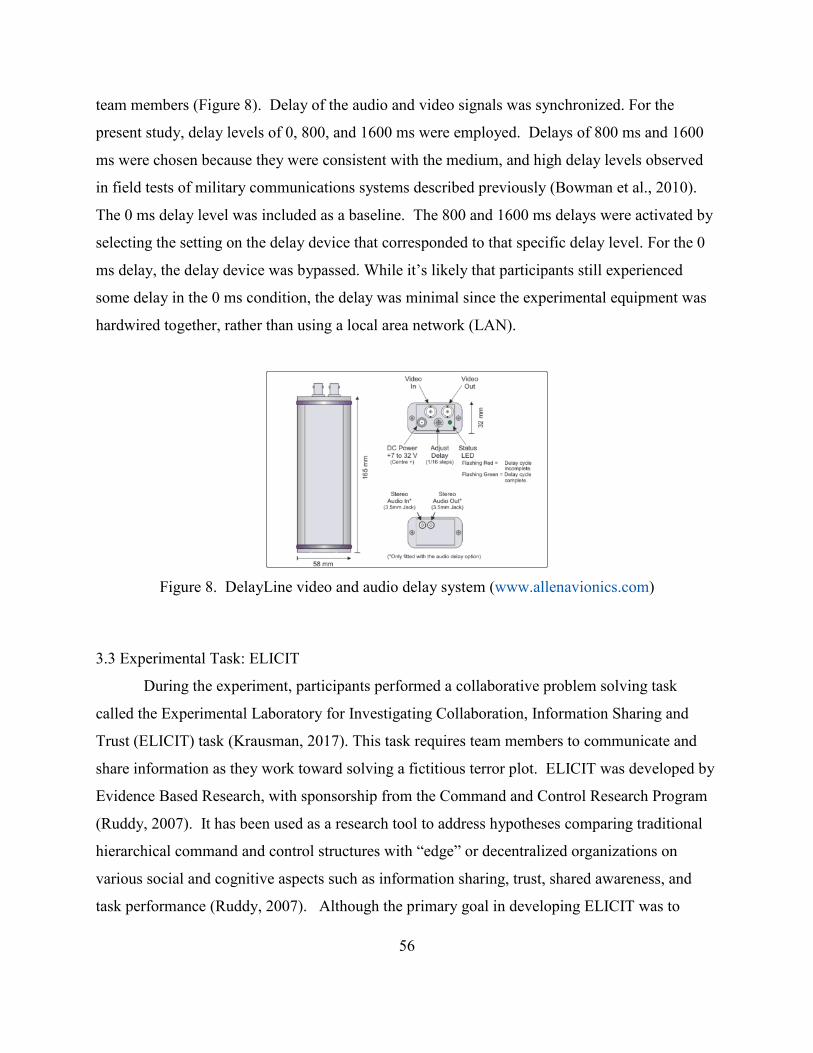
56
team members (Figure 8). Delay of the audio and video signals was synchronized. For the
present study, delay levels of 0, 800, and 1600 ms were employed. Delays of 800 ms and 1600
ms were chosen because they were consistent with the medium, and high delay levels observed
in field tests of military communications systems described previously (Bowman et al., 2010).
The 0 ms delay level was included as a baseline. The 800 and 1600 ms delays were activated by
selecting the setting on the delay device that corresponded to that specific delay level. For the 0
ms delay, the delay device was bypassed. While it’s likely that participants still experienced
some delay in the 0 ms condition, the delay was minimal since the experimental equipment was
hardwired together, rather than using a local area network (LAN).
Figure 8. DelayLine video and audio delay system (www.allenavionics.com)
3.3 Experimental Task: ELICIT
During the experiment, participants performed a collaborative problem solving task
called the Experimental Laboratory for Investigating Collaboration, Information Sharing and
Trust (ELICIT) task (Krausman, 2017). This task requires team members to communicate and
share information as they work toward solving a fictitious terror plot. ELICIT was developed by
Evidence Based Research, with sponsorship from the Command and Control Research Program
(Ruddy, 2007). It has been used as a research tool to address hypotheses comparing traditional
hierarchical command and control structures with “edge” or decentralized organizations on
various social and cognitive aspects such as information sharing, trust, shared awareness, and
task performance (Ruddy, 2007). Although the primary goal in developing ELICIT was to

57
examine different organizational structures, it is also able to support a variety of research
hypotheses related to information sharing in collaborative teams. Other tasks used in the
literature on communication delays used tasks that were not very conversational in nature (e.g.
the multiple attribute task battery, MATB), requiring only short utterances to communicate with
another team member. For this experiment, ELICIT was used because both team members
assumed equivalent roles as intelligence analysts and both had substantial communication
requirements. For the purposes of this experiment, all communication between team members
was verbal so the post and share functions that are part of the ELICIT platform were not used. In
pilot testing, participants indicated that the task was rather engaging and challenging which
naturally creates a sense of urgency in finding a solution.
ELICIT is a computer-based multiplayer intelligence game in which participants assume
the role of distributed intelligence analysts whose goal is to uncover a fictitious terrorist plot. In
order to successfully solve the plot and win the game, team members must collaborate and share
pieces of information called “factoids” that pertain to a fictitious terror plot. There are four types
of factoids: who factoids provide information about the likely actors involved, what factoids
describe the target, where factoids describe the place of attack (i.e. a country), and when factoids
describe the month, day and time of the attack (Table 8). Some of the factoids provide key
information; some provide supporting information and some provide non-relevant information or
“noise”. Six factoid sets were used in this study, each with a unique solution. Each factoid set
contained 68 factoids (Ruddy, 2007). Factoid sets used in this study were similar with respect to
difficulty level.
Table 8. Sample ELICIT factoids
Who Factoid: The Chartreuse group is not involved
What Factoid: A new train station is being built in the capital of the country of Tauland
When Factoid: The attack will be at 11:00
Where Factoid: The Azur, Brown, Coral, and Violet groups have the capacity to operate in Tau, Epsilon, Chi, Psi, and Omega lands.
In each experimental session, each team member received different factoids so neither
team member had enough information to solve the problem on her/his own. A total of 34
factoids, in text form, were distributed to each team member’s computer display via the ELICIT

58
interface (Figure 9). Factoids were distributed in two waves, seventeen factoids at the start of a
session, and the remaining 17 factoids after 5 minutes elapsed. This was to simulate new
intelligence information being distributed to team members. Task success (i.e. arriving at a
correct solution) required team members to communicate and verbally discuss the factoids using
the audio and audiovisual technology. Audio and audiovisual communication for each team
member was delayed by 0 ms, 800 ms, or 1600 ms. After discussing the factoids, team members
entered their proposed solution in the ELICIT software (Figure 10). All teams reached
consensus with their solution. Once the solution was entered, the session ended. Participants
were given 20 minutes to complete each ELICIT session to create a sense of time pressure. The
experimenter kept track of time and provided reminders when 5 minutes remained, and if
necessary, a final reminder when 2 minutes remained. If after twenty minutes, participants had
not entered a solution, they were asked to enter their best guess and the session ended. Solution
accuracy was assessed using the standard ELICIT scoring procedure (Ruddy, 2007). Scoring
procedure details are provided in section 3.4.1.2.
Figure 9. ELICIT user interface

59
Figure 10. ELICIT interface for identifying a solution.
3.4 Experimental Design
A 2 (technology) x 3 (delay) within-subject design was used in the experiment.
Independent variables were communication technology (audio, video) and delay length (0 ms,
800 ms, 1600 ms). Treatment conditions were counterbalanced using a Balanced Latin Square in
order to control for any potential order effects. Factoid sets were presented randomly. Both
objective and dependent variables were measured. Objective measures were task completion
time, shared understanding (measured as task accuracy), and percentage of factoids shared.
Subjective measures were mental workload, interpersonal trust, trust in technology, and team
member satisfaction. Each dependent measure is described in the paragraphs below.
3.4.1 Objective measures
3.4.1.1 Task Completion Time
Task completion time was measured as the time elapsed between team members
receiving the factoids at the start of the ELICIT session and when they finished entering their
solution. A complete solution consisted of all aspects of the fictitious plot: who, what, when, and

60
where. Task completion time for each team was calculated based on the session start and end
times recorded in the ELICIT software.
3.4.1.2 Shared Understanding
Shared understanding was considered a precursor to accuracy of the solution to the
fictitious terrorist plot. Therefore, the construct will be referred to as task accuracy for the
remainder of the manuscript. There was one correct solution for each factoid set in ELICIT.
Solutions to the terror plot were scored using the standard ELICIT scoring procedure. For the
Who, What, and Where elements, each correct element received a score of 1. Since the When
element consists of three components (i.e., month, day, and time), each When component was
scored with a value of 1/3. Then, the sum for all four elements was computed and divided by 4
to arrive at a total score. For instance, if a team correctly identifies the Who, What, and Where
aspects, but was correct on the day but not the month or time components of the When aspect,
their accuracy score was calculated as, accuracy = (1 + 1 + 1 + 1/3)/4 = 0.83. These values were
then multiplied by 100 to arrive at a percentage.
3.4.1.3 Percentage of Shared Factoids
The percentage of factoids shared by each team member during each ELICIT trial was
calculated by listening to team voice recordings and dividing the number shared by the total
number of factoids given and multiplying by 100.
3.4.2 Subjective measures
(Note: the Demographics and Computer Experience Questionnaire was completed by each team member a single time, prior to beginning the experiment. The remaining measures were completed by each team member following each experimental session and are listed in the order in which they were completed.
3.4.2.1 Demographics and Computer Experience Questionnaire
A questionnaire was used to obtain participant gender, age, first language, team member
familiarity, and participant’s level of experience with various communication technologies
(Appendix B).

61
3.4.2.2 Mental Workload
The NASA Task Load Index (TLX) workload rating scale (Hart & Staveland, 1988) was
used to assess the mental workload of each team participant after each ELICIT trial. (Appendix
C). The NASA-TLX is a multi-dimensional rating scale that elicits an overall workload score
from the weighted average of ratings from the six subscales that represent those characteristics
that contribute to overall mental workload: mental demand, physical demand, temporal demand,
performance, effort, and frustration. After an ELICIT trial was completed, each participant
assigned a weight to each subscales based on their perception of the relative contribution of each
of the six subscales using a procedure that included 15 pairwise comparisons. Then, they rated
their perceived workload for each of the six subscales. Subscale weights for each subscale were
then multiplied by the ratings for the same subscale to arrive at a total for each subscale. Then,
each subscale total was summed together and divided by the total number of weights, fifteen, to
arrive at a measure of overall mental workload from 0 to 100. In the study, overall mental
workload ratings for each team member were computed and analyzed. In addition, weighted
ratings for each of the six subscales were analyzed to identify any differences in workload
components across treatment conditions. Although there are other approaches for measuring
mental workload, the NASA TLX is easily administered and is recognized as a valid and reliable
instrument with a Cronbach’s Alpha value of greater than .80 (Hart, 2007).
3.4.2.3 Interpersonal Trust
Interpersonal trust, consisting of cognitive-based trust (CBT) and affective-based trust
(ABT), was measured using a trust scale developed by McAllister (1995) for use with dyads
(Appendix D). Each team member rated their level of agreement or disagreement on eleven
statements about their partner using a scale from 1 (strongly disagree) to 7 (strongly agree). Five
items referred to ABT and six items referred to CBT. Statement number eleven, relating to CBT
was reverse scored (McAllister, 1995). Scores for the five ABT items for each team member
were summed and averaged to arrive at an overall ABT score. Similarly, scores on the six CBT
items for each member were summed and averaged to arrive at an average CBT score.
Cronbach’s alphas of .91 and .89 have been reported for CBT and ABT respectively, showing
high internal reliability (Shanahan, Finch, Best, & Sutton, 2007).

62
3.4.2.4 Trust in Technology
Trust in the communication technologies used in the experiment was measured using the
Checklist for Trust Between People and Automation (Appendix E) developed by Jian, Bisantz, &
Drury (2000). The scale developed by Jian et al., 2000 was selected because it is empirically
based and is well-accepted in the literature. Each team member rated twelve items related to
their trust and their overall impression of the communication technology they used after each
condition using a rating scale of 1 (not at all) to 7 (extremely). For each team member, scores on
the twelve items were summed and averaged to arrive at an overall trust in technology score.
Fallon, Bustamante, Ely, & Bliss (2005) reported that this scale has high internal reliability
(Cronbach’s alpha = 0.93).
3.4.2.5 Satisfaction
To better understand how delays and technology impact the level of team member
satisfaction, a satisfaction questionnaire, used in similar research investigating information
exchange in distributed teams was used in the experiment (Dennis, 1996; van der Kleij et al.,
2009). The questionnaire (Appendix F) contained five statements regarding satisfaction with
performance on the task, and interactions with their team member. All items were measured on a
seven point Likert scale from 1 (strongly disagree) to 7 (strongly agree). For each team member,
scores for the five satisfaction items were summed and averaged to arrive at a total satisfaction
score. Dennis (1996) reported a Cronbach’s alpha of .95.
3.5 Experimental procedures
Two volunteers arrived at the CASEL facility and were introduced to each other. They
were seated in either experimental Room 1 or 2 (Figure 3) and read and signed the Research
Participant Consent Form indicating their consent to participate in the study (Appendix A).
After providing consent, participants completed a hearing and vision screening to ensure they
had a minimum of 20/40 vision as determined by a Titmus vision tester and normal hearing in
both ears as determined by a Madsen Orbiter 220 audiometer and TDH-50 headphones. Normal
hearing was based on pure-tone air conduction hearing thresholds that are better than 20 dB HL
for audiometric frequencies from 250 to 8000 Hz, inclusively (ANSI S3.6, 2010).

63
Upon successful completion of the screenings, participants completed an orientation
session to familiarize them with the ELICIT task and the communication technology. During the
orientation session, participants read the ELICIT task instructions (Appendix G), and worked
together to complete a live session of ELICIT to become familiar with experimental procedures,
the ELICIT interface, the communication technology and to reduce learning or practice effects.
No delays were presented during the familiarization trial. When the team members entered their
proposed solution, the ELICIT session ended and the correct solution was given. Afterwards,
teams were given feedback about their solution, and which elements were correct. If a team did
not reach 100% accuracy, their solution was discussed in light of the correct solution to
determine what went wrong. After questions were answered, and participants felt comfortable
with the task, they took a break. During the break, each team member remained in separate areas
of the facility to minimize their level of interaction between trials.
For the experimental trials, 34 different factoids related to a fictitious terror plot were
distributed to each team member’s computer and shown on their computer display. Half of the
factoids were distributed to team members as they began the session and the remaining half after
5 minutes had elapsed. Teams shared and discussed the factoids using audio and/or audiovisual
technology. When the team was ready to solve, they entered their proposed solution in the
ELICIT software and the session ended. Feedback regarding solution accuracy was withheld
until all six sessions were completed to reduce the potential influence of accuracy on the
subjective ratings. Teams were given 20 minutes to solve the task to create a sense of time
pressure. Time was monitored by the experimenter and teams were told when 5 minutes
remained, and if necessary, when 2 minutes remained. If after 20 minutes the team had not
entered their solution, they were asked to enter their best guess and the session ended. After
completing a session, participants completed the NASA TLX, Interpersonal Trust, Technology
Trust, and Satisfaction questionnaires and were given a 5-minute stretch break, during which
team members remained in separate areas to minimize their interaction between sessions. Teams
completed a total of six sessions of ELICIT, all on the same day, to avoid scheduling issues and
participants failing to return on another day to complete the experiment. After the experiment
was complete, both team members participated in an informal interview to describe the purpose
of the experiment and obtain participant feedback regarding their experience during the

64
experiment. During the interview, both team members answered questions pertaining to their
how the technology and communication delays impacted their interactions as they worked
together on the ELICIT task, followed by any additional comments or input. Total time to
complete the experiment was approximately 3 hours.
3.6. Data Analysis
Objective measures were task completion time, task accuracy, and percentage of factoids
shared. Task completion time and task accuracy were measured at the team level (i.e., one data
point per team per treatment condition). Consequently, both task completion time and task
accuracy each had a total of 180 data points available for data analysis. Team scores were
calculated using the scoring procedures described in the methods section.
Percentage of factoids shared and the subjective measures were measured at the
participant level, so there were two data points per treatment condition, one for each team
member. Rather than average the two team member scores to arrive at a team score, participant
scores were calculated and nested within their respective team for the analysis. Therefore,
percentage of factoids shared, and the subjective measures, each had a total of 360 data points
available for analysis. Participant scores were calculated using the scoring procedures described
earlier in the methods section.
Descriptive statistics were computed for each dependent measure (Appendix H). Data
were analyzed with separate linear mixed models using the mixed procedure in SPSS 22 (SPSS,
Inc; Chicago, IL). Three separate analyses were performed. First, the objective and subjective
measures were analyzed in a 2 (Technology) x 3 (Delay) linear mixed model, with Delay and
Technology as fixed effects. Then, to investigate the effects of team composition, a 2
(Technology) x 3 (Delay) x 2 (Gender) linear mixed analysis was performed with Delay,
Technology, and Gender included as fixed effects. Lastly, a 2 (Technology) x 3 (Delay) x 2
(Familiar) mixed linear analysis was conducted with Delay, Technology, and Familiarity as fixed
effects. In all three analyses, random effects of team, and where possible, participant, were
included, using a variance components (VC) variance/covariance structure and restricted
maximum likelihood (REML) estimation. Residual variance was accounted for using a diagonal
variance-covariance structure. To test for order effects, in all analyses, treatment condition order
was included as a fixed effect and was removed from the analysis if not significant. P-values <

65
.05 were considered significant. Significant main effects were further analyzed using post-hoc
comparisons with a Sidak-Bonferroni correction. Simple effects tests were conducted for
significant interactions followed by pairwise comparisons with a Sidak-Bonferroni correction.
Data were checked for outliers by computing standardized residuals. Residuals were inspected
for normality by assessing symmetry in histograms and by visually inspecting Q-Q plots.
Constant variance was verified by plotting the residuals against the fitted data. One subject was
identified as an outlier in the NASA TLX Physical Demand data. By examining the data, it was
clear that there was no data entry or measurement error, so the analysis was performed with and
without the outlier and results were compared. A rank transformation was performed on the
Task Accuracy data (Conover & Iman, 1981) and the NASA TLX Frustration subscale and
Performance subscale data were log transformed as residuals for these measures were not
approximately normal.
In the next chapter, results of the demographic questionnaire will be presented followed
by results of the analysis investigating hypotheses 1 – 4. Results of the analysis of the team
composition data associated with Hypotheses 5 and 6 will be described in Chapter 5.

66
Chapter 4. Results
4.1 Demographic Questionnaire Descriptive Statistics
Results from the demographic questionnaire indicated that participants ranged in age from 18 to
64 years of age (mean = 34.4, sd = 11.09). All participants spoke English as their first language.
Overall, participants were “experienced” with communication technologies (mean = 3.34, sd =
0.56). Figure 11 illustrates participant’s level of experience with five types of communication
technologies, and Figure 12 illustrates participant’s experience level by age group. Of the 30
dyads that participated, twenty-one were same-gender and nine mixed-gender teams. Twenty
teams were comprised of unfamiliar members and ten with familiar members.
With the speed with which technology advances, it is helpful to give an idea of the
communication technologies available in 2016, when these data were collected. Specifically,
data for the most popular cell phones and audio and video conferencing technologies are
described, since these technologies are pertinent to the demographic data and the experiment.
In 2016, the top 5 cell phones were the Samsung Galaxy S7, Motorola Moto G4, OnePlus 3,
Google Nexus 6P, and iPhone 6S (“Best phones,” 2016)
With respect to commercial off-the-shelf (COTS) audio/videoconferencing systems, Polycom
RealPresencePro, Logitech Group, Tely 200 were the top 3 systems on the market (“Top 3
Videoconferencing Solutions,” 2016). In addition, there were several free video conferencing
tools available: UberConference, Cisco Webex, Skype, Fuze, and Join Me (“Top 5 Free Video
Conferencing Tools,” 2016). Military videoconferencing is quite popular and typically uses
COTS products that have been modified to provide the additional encryption and security
required (Scarpati, 2016).

67
Figure 11. Mean (SEM) Ratings of Experience with Communication Technology
Figure 12. Mean (SEM) Ratings of Experience with Communication Technology by age group.
0
1
2
3
4
Email Telephone Cell Phone AudioConference
VideoConference
Mea
n Ex
perie
nce
Leve
l(1
= n
ot e
xper
ienc
ed, 4
= v
ery
expe
rienc
ed)
Communication Technology Type
1
2
3
4
5
Email Telephone Cell phone Audioconference
Videoconference
Mea
n Ex
peri
ence
Lev
el(1
= n
ot e
xper
ienc
ed, 4
= v
ery
expe
rien
ced)
Communication Technology Type
18-34 yrs (n = 36)
35-49 yrs (n= 18)
50-64 yrs (n = 7)

68
4.2 Objective Results
Summary tables of means and standard deviations for the objective measures is shown in
Appendix H.
4.2.1 Task completion time
Results of the analysis of task completion time showed no significant Delay x Technology
interaction (p = .190), and no main effect of Technology (p = .140). However, the main effect of
Delay was significant, F(2, 120) = 3.33, p = .039 (Figure 13). As indicated by post-hoc tests,
teams took significantly longer to complete the ELICIT task at the 800 ms Delay than in the 0 ms
Delay (mean difference = 1.22, p = .046), with no significant differences between the 1600 ms
and 0 ms delay (mean difference = .260, p = .938) or the 800 and 1600 ms delays (mean
difference = .964, p = .159). No other main effects or interactions were found.
Figure 13. Mean (SEM) Task Completion Time as a function of Delay Length. Means with the same letter are not significantly different.
A
B
AB
0
5
10
15
20
0 800 1600
Mea
n Ta
sk C
ompl
etio
n Ti
me
(min
)
Delay Length (msec)

69
4.2.2 Task Accuracy
Analysis of the rank transformed Task Accuracy data showed no significant interaction of Delay
and Technology (p = .883) and no significant main effects of Delay (p = .749), or Technology (p
= .442).
4.2.3 Percentage of Factoids Shared
Analysis of the effect of Delay and Technology on the Percentage of Factoids shared showed no
significant interaction of Delay and Technology (p = .665), and no significant main effect of
Technology (p = .321). However, Delay significantly affected the Percentage of Factoids
Shared, F(2, 270) = 4.13, p = .017 (Figure 14). Post-hoc comparisons showed that fewer
factoids were shared at the 1600 ms Delay compared to 800 ms (mean difference = 3.87, p =
.027), with no significant differences between the 0 ms and 1600 ms Delays (mean difference =
3.40, p = .063), or 0 and 800 ms (mean difference = .474, p = .984).
Figure 14. Mean (SEM) Percentage of Factoids Shared as a function of Delay Length.
Means with the same letter are not significantly different.
AB AB
0
20
40
60
80
100
0 800 1600
Mea
n Pe
rcen
tage
of F
acto
ids S
hare
d
Delay Length (ms)

70
4.3 Subjective Results
Summary tables of means and standard deviations for the subjective measures are shown in
Appendix H.
4.3.1 NASA TLX Overall Workload
Analysis to determine the effect of Delay and Technology on Overall Workload revealed
a significant interaction of Delay and Technology, F(2, 204.52) = 3.19, p = .043 (Figure 15).
Simple effects analyses showed that Delay significantly influenced Overall Workload ratings for
Audiovisual Technology, F(2, 149.12) = 3.18, p = .045, with significantly higher Overall
Workload ratings for the 800 ms than the 0 ms delay (mean difference = 4.51, p = .015). In
addition, simple effects tests showed significant effects of Technology, but only for the 0 ms
delay, F(1, 102.3) = 8.93, p = .004, as Overall Workload ratings at the 0 ms delay were
significantly higher for Audio-only compared to Audiovisual technology (mean difference =
5.83, p = .003). No significant effects of Delay (p =.495) or Technology were found (p = .064).
Figure 15. Mean (SEM) Overall Workload ratings as a function of Delay Length and
Technology. Means with the same letter not significantly different.
B AB AB
AB AB
0
20
40
60
80
100
0 800 1600
Mea
n O
vera
ll W
orkl
oad
Delay Length (ms)
Audio
Audiovisual
71
4.3.2 NASA TLX Subscales
In addition to the analysis of Overall Workload, each of the six NASA TLX subscales were
analyzed using separate linear mixed analyses.
4.3.2.1 Mental Demand
Analysis of the Delay and Technology data showed no significant interaction of Delay and
Technology (p = .064), and no significant main effects of Delay (p = .509), or Technology (p =
.167) on Mental Demand ratings.
4.3.2.2 Physical Demand
For Physical Demand, one participant was identified as an outlier, so the data were analyzed with
and without the outlier. The analysis performed with the outlier showed no significant
interaction of Delay and Technology (p = .169), and Technology did not affect Physical Demand
ratings (p = .361), however the analysis did show a significant main effect Delay, F(2, 176.31) =
3.41, p = .035 (Figure 16). Pairwise comparison tests did not reach significance, but suggested
that Physical Demand ratings were higher at 800 ms compared to both 0 ms (mean difference =
1.42, p = .06) and 1600 ms (mean difference = 1.50, p = .06).
For the analysis with the outlier removed, results showed no significant Delay x Technology
interaction (p = .169), and no main effects of Delay (p = .144), or Technology (p = .274) on
Physical Demand ratings. These results suggest that the presence of the outlier did significantly
affect the outcome of the analysis as shown in Figure 16. It is difficult to comment on why this
result occurred since ELICIT is a computer-based task, and the only physical aspects were to
read and discuss factoids using communication technology and enter the solution using a mouse
and keyboard. No data entry errors were found. A closer look at Physical Demand data showed
that Physical Demand remained low for the first two trials of ELICIT, but increased for the last
four. When examining the TLX weights, Physical Demand was selected over Frustration and
Temporal Demand, suggesting that this individual genuinely experienced a higher level of
Physical Demand. Perhaps the urgency of the task coupled with the quantity of information that
needed to be shared with their partner, resulted in the higher Physical Demand ratings.

72
Figure 16. Mean (SEM) Physical Demand ratings as a function of Delay Length. Means with the same letter not significantly different.
4.3.2.3 Temporal Demand
Analysis of the Temporal Demand data showed no significant Delay x Technology interaction (p
= .720), and no main effects of either Delay (p = .585), or Technology, (p = .081).
4.3.2.4 Performance
For the analysis of Log transformed Performance data, no significant interaction of Delay and
Technology was found (p = .494), and neither Delay (p = .761) nor Technology (p = .761)
affected Performance ratings.
0
1
2
3
4
5
6
0 800 1600
Mea
n Ph
ysic
al D
eman
d
Delay Length (ms)

73
4.3.2.5 Effort
For the Effort subscale analysis, results showed a significant Delay x Technology interaction,
F(2, 236) = 3.39, p = .035 (Figure 17). Simple effects tests for Delay did not reach significance,
however, the simple effect of Technology approached significance, F(1, 223.98) = 3.24, p =
.073, with higher effort ratings at 800 ms for Audiovisual than Audio-alone, suggesting that at
the 800 ms delay, participants expended more effort with Audiovisual technology than Audio-
alone (mean difference = 21.75, p = .07). No significant effects of Delay (p = .927) or
Technology (p = .792) were found.
Figure 17. Mean (SEM) Effort Ratings as a function of Delay Length and Technology.
4.3.2.6 Frustration
Analysis of the Log-transformed Frustration data showed that neither the interaction of Delay
and Technology (p = .596), nor Technology (p = .308) affected participant ratings of Frustration.
However, Frustration ratings were significantly affected by Delay F(2, 270) = 4.65, p = .010
0
50
100
150
200
250
0 800 1600
Mea
n Ef
fort
Rat
ing
Delay Length (ms)
Audio
Audiovisual

74
(Figure 18). Frustration ratings were significantly higher at 1600 ms Delay than 0 ms Delay
(mean difference = 14.80, p = .003), with no significant differences between 800 ms and 1600
ms (mean difference = 1.80, p = .053) or 0 ms and 800 ms (mean difference = 13.00, p = .287).
Figure 18. Mean (SEM) Frustration Ratings as a function of Delay Length. Means with the same letter not significantly different.
4.3.3 Interpersonal Trust: Affective
With respect to Affective Trust, there was no significant interaction of Delay and Technology (p
= .458) and no significant main effects of Delay, (p = .849) or Technology (p = 1.00).
4.3.4 Interpersonal Trust: Cognitive
Similarly, the Cognitive Trust data showed no significant interactive effect of Delay and
Technology (p = .071) and no significant main effects of Delay (p = .285) or Technology (p =
.838).
A
AB B
0
20
40
60
80
100
0 ms 800 ms 1600 ms
Mea
n Fr
ustr
atio
n Ra
ting
Delay Length (ms)
75
4.3.5 Trust in Technology
As indicated by the linear mixed analysis, Trust in Technology was not significantly affected by
the interaction of Delay and Technology (p = .672), and no significant main effect of Delay (p =
.467) or Technology (p = .272) was found.
4.3.6 Satisfaction Data
Team member satisfaction, ratings were fairly consistent across delay and technology. Results
of the analysis showed that neither the interaction of Delay and Technology (p = .227), nor Delay
(p = .502) nor Technology (p = .507) significantly affected Satisfaction ratings.
4.4 Discussion
As mentioned previously, the main objective of this work was to better understand the
effects of communication delays on team processes and performance in order to enable
organizations to utilize the advantages/flexibility that distributed work arrangements provide,
and propose solutions to enhance communication in teams that work remotely. Findings from
the present study will be discussed in light of the study hypotheses and previous work.
Based on previous work on communication delays in distributed interaction, we
hypothesized that communication delays would disrupt information sharing between team
members and subsequently, they would choose to solve the task prematurely without considering
all of the information, leading to less information shared, a reduction in task accuracy, faster task
completion times, and lower ratings of trust and satisfaction. Results from the present study
partially support Hypothesis 1, as fewer factoids were shared at 1600 ms compared to the 800 ms
delay. Specifically, 8.3% fewer factoids were shared at the 1600 ms than 800 ms delay,
potentially because the longer 1600 ms delay interfered with or deterred team members from
sharing the factoids. Although the difference in the quantity of factoids shared was not that
large, and teams were still able to solve the task accurately at the 1600 ms delay, the reduction in
information shared could have significant implications for team performance and decision
making in more complex environments where the situation is constantly changing. In these
settings, if less information is shared, team members may possess different information and not
be aware of it, and/or may not have enough information to make a good decision.

76
Another interesting aspect to consider is that in some instances, delays many not always
be detrimental, and may depend on the context or task being performed. For example, during a
conversation between a driver and a passenger in the same vehicle, a delay could enhance
situational awareness and safety as the driver pauses to consider the unfolding situation and/or
take corrective action. With respect to the present study, the 1600 ms delay may actually have
enabled teams to be more efficient in performing both their task work and teamwork functions,
which may help explain how teams could maintain a high level of task accuracy even though less
information was shared. In other contexts, such as air traffic control and space exploration,
described earlier, even short delays in communication between members may increase risk and
compromise crew safety and mission success.
Previous work in distributed interaction has shown that communication delays not only
disrupt information sharing, but can actually lead participants to terminate conversations/tasks
sooner than when no delays are present, with possible decrements in decision quality (Dennis &
Taylor, 2004; Olson et al., 2007; Taylor, Dennis, & Cummings, 2013). As a result, we expected
to observe a similar outcome in the present work: as delay length increased, teams would choose
to solve the task more quickly, with reduced task accuracy. However, results were contrary to
the hypothesis. Teams actually took longer to solve the ELICIT task with the 800 ms delay
compared to 0 ms delay, with no significant reduction in task accuracy. Not surprisingly, we
observed that the longer task completion time at the 800 ms delay is most likely due to the
disruption caused by the delays, since the quantity of information shared at the 0 ms and 800 ms
delay conditions were equivalent (Figure 14). In Figure 13, there was a slight decrease in task
completion time at 1600 ms, which is likely due to the fact that less information was shared at
1600 ms (Figure 14). Although the reduction in task completion time at 1600 ms was not
statistically significant from the other delay levels, longer delay lengths, such as those described
in the literature review or real-world environments, may exhibit a similar pattern of faster task
completion time as delay lengths increase. Just as important, is the significant reduction in
information shared at the longer 1600 ms delay, which is an important consideration in settings
such as emergency management or military communication networks as described earlier
(Bowman et al., 2010), where immediate access to information is critical and decisions are time-

77
sensitive. In these contexts, delays could potentially impact both decision timeliness and
accuracy.
In Hypothesis 2, we expected that team members would experience an increase in mental
workload when their communication was delayed. As Caldwell et al., (1998) stated, the benefits
of using teams can be lost when operational tempo/urgency is high and communication is
stressed or restricted. Specifically, as information flow is restricted by communication medium
constraints, team interactions necessarily change as they try to convey the same information with
only a limited set of cues, or in the case of the present study, a delay in communicating task-
related information. As a result, we expected that the increased effort to maintain a conversation
in the presence of delays would be reflected in higher workload scores. Hypothesis 2 was
partially supported. Whereas, overall workload was not significantly affected by delay, two
components of workload, physical demand and frustration, showed significant effects (Figures
16 and 18). It is unclear why team members rated their experience of physical demand higher at
the 800 ms compared to 0 and 1600 ms delay lengths. As shown in Appendix H, the physical
demand scores were very small compared with other subscale data, which is not surprising since
there was no actual physical component of the ELICIT task other than typing the solution in the
ELICIT interface. Perhaps the disruptions in conversations at the 800 ms delay, coupled with the
longer task completion time created a sense of working harder which equated to an increase in
physical demand.
It is not surprising that participants experienced significantly higher levels of frustration
at the 1600 ms delay, as delays make it difficult to manage conversations, and users experience
interruptions, overlaps, and may need to repeat messages, which may contribute, in part, to these
feelings of discomfort frequently expressed by users of communication technologies (Ruhleder
et al., 2001). However, given that participants considered themselves relatively experienced with
communication technology, it is somewhat surprising that they still found the delays to be
frustrating (Figure 17). In fact, the data suggest that frustration ratings were approximately 40%
higher at 1600 ms compared to the 0 ms delay. This suggests that even experienced users are not
immune to frustration when system performance is degraded. Even though the increased
frustration ratings did not translate into lower satisfaction, team trust, or trust in technology
scores in the present study, under more dynamic or operational conditions, such as military

78
operations, disaster relief, or emergency management, increased frustration as a result of delays
may have important implications. Some of the implications have been documented in the
literature (Parkinson et al., 2011; Renfro- Powers et al., 2011; Pearson et al., 2008; Tang et al.,
1992). For instance, in a study by Tang & Isaacs (1992), participants actually modified their
interactions by substituting a less rich media due to the level of frustration they experienced
when communications among team members was delayed. And Pearson et al., (2008), found
that feedback delays resulted in higher anxiety levels and decreased interest in interacting with
team members compared to interacting in real-time. Both the objective data, and interview
feedback from the present study indicated that team members noticed the delay. However, team
members sought to collaborate in spite of the delay rather than blaming their partner for the
disrupted communication as seen in work by Brady (1971), which is an encouraging finding.
Perhaps team members were confident enough in their solutions and in their partner that trust,
satisfaction, and accuracy were not influenced by the delays (Krausman, 2017). There are a few
potential explanations for these results.
First, since participants were recruited from the same laboratory, there may have been an
existing level of trust based on their affiliation with the same organization. Even though the
delays disrupted their interactions and increased their level of frustration and physical demand,
their common affiliation may have served to reduce the ambiguity and uncertainty in team
member interactions (Dirks & Ferrin, 2001; Gump, Brooks, Kulik, & James, 1997), enabling
teams to cooperate and solve the ELICIT attack even with the added difficulty of managing the
delays. Work by Feng, Lazar, & Preece (2004) suggested that team members who possess shared
experiences or similarity with respect to backgrounds, occupation, or demographics are more
empathetic toward one another, which, in the present study, may have helped facilitate team
member interactions, even when communication was delayed. Although affiliation and empathy
were not measured in the current experiment, they may have been reflected in their interpersonal
trust, both affective and cognitive and satisfaction scores (Appendix H). In future work, perhaps
implementing a form of verbal protocol as team members interact may provide insight regarding
the presence of empathy. Team member empathy and affiliation/similarity may be especially
important in or temporary, or ad hoc distributed teams, where there is little or no affiliation or

79
connection between team members, and a limited time for those connections to develop
(Krausman, 2017).
Second, it may have been the interdependent nature of the ELICIT task itself that
influenced team members to collaborate in spite of the disruptions and frustration caused by the
delay. In other words, instead of trust governing the decision to share information, the way the
ELICIT task was structured was highly interdependent as each team member had different
information and therefore couldn’t solve the task on their own. In other related team research
(Evans & Revelle, 2008; Staples & Webster, 2008), participants who reported high task
interdependence frequently shared information with their team member regardless of any beliefs
in the trustworthiness of their partner, so in the present work, it could have been the
interdependent nature of the task, rather than a personal judgement of trustworthiness that
influenced information sharing (Krausman, 2017).
Another potential explanation is that participants rated themselves as relatively
experienced with communication technology (Figures 11 and 12) on the demographic survey.
This suggests they may have encountered delays in the past (e.g.,, cell phone delays), so it is
possible that they considered delays a normal part of working remotely, and sought to establish a
strategy to maintain their interaction and accomplish their goal in spite of the level of frustration
they experienced. Previous research in the area of remote communication has also shown that
once users encounter a delay, they temper their manner of speaking, and with repeated use over
time, may find it easier to adapt their communication to the medium (O’Conaill et al. 1993).
Several authors refer to this as a “technological adaptation effect” (Qureshi & Vogel, 2001;
Olson et al., 2000; van der Kleij, Paashuis, & Schraagen, 2005). Technological adaptation refers
to the process through which users learn to use technology to achieve a goal (i.e., sharing
information and solving the ELICIT task), even in the face of technological limitations, such as
restrictions in bandwidth or delays. In the present study, it is likely that participants were able to
adjust their strategy based on previous experience with other technologies in order to maintain
progress toward their goal. Post-experiment interview comments help shed some light on the
strategies used. Some teams opted to have one team member share all of their factoids first (i.e.,
took longer conversational turns), followed by their partner, rather than use quick exchanges of
factoids back and forth. Other team members consolidated information before sharing it with

80
their team member. Perhaps the various strategies team members employed helped reduce the
impact of delay, and subsequently did not increase mental demand as expected in Hypothesis 2.
It is interesting to consider that the additional cognitive work of synthesizing information prior to
sharing did not translate into higher mental demand. This can potentially be due to the fact that
teams performed a single task during the experiment, so they were able to focus their attention
on solving the ELICIT task, and were able to maintain a rather high degree of accuracy, without
increasing workload and decreasing the subjective experience of trust and satisfaction. Results
may have been different if teams performed multiple tasks concurrently (Armstead, 2007), or if
there was more time pressure applied. In the present study, teams were given twenty-minutes to
solve the task, which was based on results from pilot work and created a sense of urgency while
still providing enough time for teams to solve the task.
In any case, the fact that teams possibly adapted their communication, and were still able
to successfully accomplish their goal, is an encouraging finding. However, there are
circumstances that should be considered when integrating teams, technology, and organizations.
For example, organizations should consider how to manage the challenge of novice and/or
sporadic users who have not been exposed to different technologies, and subsequently may not
have developed effective delay compensating practices (Ruhleder et al., 2001). As a result, we
cannot assume teams will adapt and ignore the complexities of remote communication described
earlier in this paper, and well-documented in the team and human-computer interaction literature.
Rather, further research should be performed to better understand the mechanisms that underpin
adaptation, and identify those aspects of remote communication that can be reduced with practice
(Dove-Steinkamp, 2012), or by experience with communications technology. Teams may
respond differently depending on the circumstances surrounding their interaction such as the type
of tasks being performed, the task environment, and the team structure.
Compared to audio technology, video is more adept at conveying social context cues,
especially affective cues, such as being able to see team members on a screen, which can confirm
the presence and status of other team members (Watson, 2001). In Hypotheses 3, we expected
that the addition of a video channel and associated rich social context cues may lessen the effects
of delays, such that task accuracy would be higher, more information would be exchanged, and
team member satisfaction and trust scores would be higher than with audio-alone. Based on the

81
findings of the present study, Hypothesis 3 was not supported. Results showed no significant
interactive effects of delay and technology for the performance measures, trust, or satisfaction
ratings. Research of previous work on the effects of video to lessen the effects of delays in
distributed teams have been mixed. While Krauss et al., (1977), found a beneficial effect of
video in delay conditions, O’Malley et al., 1996, found no effect of video on the number of
words, number of turns, or turn length. Even so, Keebler et al., (2015) suggested that a video
feed is critical for communication between space crews and mission control in long duration
space flight missions (LDSF), where long delays (e.g., up to several minutes) make it difficult
for operators to verbally share information about their immediate environment, or unusual
occurrences, and suggest this type of information is more easily shared visually.
In Hypothesis 4, we expected that mental workload would be lower with the addition of a
video channel. Hypothesis 4 was partially supported, as overall workload was 11.6% lower with
audiovisual technology compared to audio-only at the 0 ms delay. However, overall workload
actually increased, albeit only by 4%, as delay length increased from 0 ms to 800 ms in the
audiovisual condition (Figure 15), which was contrary to what we expected. Further, participant
effort ratings were higher in the audiovisual condition compared to audio-only for the 800 ms
delay, again, contrary to what we anticipated (Figure 17). Taken together, these results seem to
indicate that the increase in effort and overall workload at the 800 ms delay with audiovisual
technology may be that team members found it difficult to attend to both the ELICIT factoids
and the video of their partner. Interview comments suggested that participants used the video,
but mostly to assess the status of their partner, so it’s possible that the 0 ms delay was short
enough that participants received feedback rather quickly and therefore did not feel the need to
check the status of their partner. However, at the 800 ms delay, it became difficult to maintain
conversational flow and participants relied on the video to see what their partner was doing (e.g.,
speaking, reading, or waiting for a response). So, it seems likely that the 800 ms delay was long
enough to disrupt team member dialogue but short enough that it was difficult for teams to
switch attention from the ELICIT factoids to the video of their partner, with a subsequent
increase in overall workload and effort. It follows that the1600 ms delay may have been long
enough that participants could maintain their conversation and attend to both the factoids and the
video without subsequent increases in their overall workload or effort ratings.

82
Results of previous studies on the impact of video on team member interactions when
communication is delayed or stressed have also shown mixed results (Krauss et al., 1977; Olson
& Olson, 2007; O’Malley et al., 1996; Veinott et al., 1999). In the present study, it was clear that
team members used the video, so, it appears that the audiovisual channel may have benefitted the
process of team member interactions (Tang et al., 1993, Olson, Olson, & Meader, 1995), as team
members could look at the video to assess if their partner was ready to begin or was still looking
at their factoids, as well as not letting delays impact affect, even though this was not fully
captured in the empirical data. Other work also suggests that the main value of video technology
is the sense of presence it provides, rather than provide any direct benefits to performance
(Watson, 2001). In the next few paragraphs, we offer some insights as to why the video channel
did not have the desired effect in the present study.
First, the existing literature suggests that the benefit of visual cues may depend on the
type of task performed (Koulouri et al., 2017; Olson et al., 2007). For example, audio-only is
sufficient for tasks such as brainstorming and exchanging information but for negotiation tasks
(Short et al., 1976), but tasks where seeing task-related physical objects or viewing a shared
workspace, good quality video is important (Gergle, 2006; Tang et al., 1993). With respect to the
task used in the present study, the ELICIT task was selected for several reasons: it required
minimal training of participants, participants assumed equivalent roles, and because the ELICIT
task required a substantial amount of two-way communication to solve the problem. However,
the information exchanged by team members was rather scripted in nature (Table 8). It also
pertained to a specific problem, and since there was a sense of urgency in solving the task,
communication was likely more task-oriented than social (Walther, 2002). Therefore teams may
have benefitted less from visual feedback than if they performed a task that allowed more free-
flowing conversation and more socially oriented interchanges among participants (Andres, 2002;
Gale, 1990; Olson et al., 2007). In addition, since the heart of the ELICIT task is the sharing of
factoids, team members may have focused more attention on the critical information provided by
the factoids, and less on the video of their partner. This is because many of the non-verbal
signals available via video were conveyed using just the audio channel (i.e., saying “uh huh” or
“ok” rather than a head nod). Partners may have glanced at the video every now and then to

83
assess their partner’s status or availability, especially when there were long pauses between
responses or turns.
In addition to considering the type of task, the type of visual information that is most
beneficial for a type of task is also important. For example, in the present study, team members
may have benefitted from having a shared visual workspace rather than being able to see the
video of their partner. A shared workspace that contained all of the factoids, would have enabled
teams to identify important patterns in the factoids, and engage in more focused conversations
about the solution, instead of spending a portion of time and effort sharing factoids with their
partner. Not to mention that the shared workspace would help minimize the quantity of
communication between team members (e.g., information flowing over the network), and could
therefore, reduce the impact of the delays.
Another potential reason for the limited findings in the audiovisual conditions was that,
as described earlier, participants were recruited from the same organization and spoke the same
language (i.e. English as first language), and as a result, there was a degree of similarity and
potentially a sense of connection or affiliation among team members. Several authors suggest
that individuals are attracted to others who are similar in some respect (Bowers, Pharmer, &
Salas, 2000), and when teams share demographic characteristics, common beliefs, attitudes
and/or values it facilitates communication, cooperation, and conflict management among team
members (Jackson, Joshi, & Erhardt, 2003; Bowers et al., 2000; Hinds & Weisband, 2003).
Therefore, it is possible that the similar affiliation created a sense of connection between team
members and served to reduce the uncertainty and perceived risk in their interaction and
therefore, the video did not influence their interaction as it may have with teams that are more
diverse and lack similarity or affiliation. In fact, Veinott et al. (1999) showed that video can
benefit task performance when team members are diverse and do not share the same native
language. While similarity may have some benefits, it is not always feasible or productive to put
too much emphasis on similarity within teams, as doing so may hinder team performance. For
example in product development teams, having expertise that spans multiple disciplines helps
encourage innovative solutions to problems (Hinds et al., 2003). These results suggest that team
diversity as well as team history and maturity are important considerations when integrating
teams and technology in organizations. With respect to the studies on communication delay

84
shown in Table 7, very few have included gender diversity as a factor of interest. Further, the
issue of team member familiarity has not been well addressed. In the next chapter, results of the
analysis addressing the team composition variables gender diversity and team member
familiarity are described.
85
Chapter 5. Results for Gender and Team Member Familiarity
Based on Hypothesis 5 and 6, results of the linear mixed analysis to determine the effects of team
gender composition and team member familiarity on distributed team interaction when
communication is delayed, are presented and discussed. To review, Hypotheses 5 and 6 are
restated here:
Hypothesis 5: When communication is delayed, male-female teams will: exhibit longer task completion times, have lower task accuracy, exchange less information, have lower satisfaction and trust scores, and higher mental workload than same-gender teams.
Hypothesis 6: When communication is delayed, teams with familiar members will have higher task accuracy, complete the task faster, share more information, have higher levels of trust, be more satisfied, and have lower workload than unfamiliar teams.
5.1 Objective Results
Summary tables of means and standard deviations for the objective measures is shown in
Appendix H.
5.1.1 Task completion time
With respect to the analysis of Gender data, results showed that Task Completion Time was not
significantly affected by the interactions of Delay and Technology (p = .324), Delay and Gender
(p = .487), Technology and Gender (p = .597) or Delay, Technology, and Gender (p = .831).
Further, no significant main effects of Delay (p = .155), Technology (p = .123) or Gender (p =
.123) were found.
For the analysis of the Familiarity data, results showed a significant Delay x Technology x
Familiarity interaction, F(2, 115) = 3.81, p = .025 (Figure 19). Simple effects tests for
Familiarity did not reach significance. However, a significant simple effect of Delay was found,
but only for Unfamiliar teams using Audiovisual Technology, F(2, 115) = 6.37, p = .002.
Pairwise comparisons showed that when using Audiovisual Technology, Unfamiliar teams took
significantly longer to solve the ELICIT task at the 800 ms delay, compared to the 0 ms delay
(mean difference = 3.34, p = .002, with no significant differences between 800 ms and 1600 ms
(p = .094), or 0 ms and 1600 ms delays (p = .434). Further, simple effects tests for Technology

86
showed significant effects of Technology on Task Completion Time, but only for Unfamiliar
teams at the 0 ms delay, F(1, 115) = 6.37, p = .013, as Unfamiliar teams took longer to complete
the task with Audio-only than Audiovisual Technology (mean difference = 2.38, p = .013), with
no significant differences between Audio and Audiovisual Technology at 800 ms or 1600 ms.
No other significant main effects or interactions were found.
Figure 19. Mean (SEM) Task Completion Time as a function of Delay Length, Technology, and Familiarity.
Means with the same letter not significantly different.
5.1.2 Task Accuracy
With respect to the analysis including Gender, results showed no significant interaction of Delay
x Technology x Gender (p = .653), however Accuracy on the ELICIT task was significantly
affected by the interaction of Gender and Technology, F(1, 115) = 11.53, p = .001 (Figure 20).
Simple effects tests for Gender showed no significant differences. However, with respect to
Technology, simple effects tests showed that Technology significantly affected Accuracy for
A AB AB
B
A
AB
0
5
10
15
20
0 800 1600
Mea
n Ta
sk C
ompl
etio
n Ti
me
(min
)
Delay Length (ms)
Unfamiliar
Audio Audiovisual
AA
AAA
A
0
5
10
15
20
0 800 1600
Mea
n Ta
sk C
ompl
etio
n Ti
me
(min
)
Delay Length(ms)
Familiar
Audio Audiovisual

87
male-female teams only, F(1, 115) = 10.97, p = .001. Specifically, male-female teams were
more accurate when using Audiovisual Technology than Audio-alone (mean difference = 26.06,
p = .001). There was also a significant main effect of Technology, F(1, 115) = 4.65, p = .033.
However, the main effect of Technology, and the two-way interaction can be interpreted only in
the context of the Technology x Gender interaction.
Figure 20. Mean (SEM) Task Accuracy as a function of Gender and Technology. Means with the same letter not significantly different.
For the analysis of the Team Familiarity data, results indicated no significant effects of Delay (p
= .733), Technology (p = .498) or Team Familiarity (p = .215) on Task Accuracy, and no
significant interactive effects of Delay and Technology (p =.786), Delay and Team Familiarity (p
= .680), Technology and Team Familiarity (p =.966), or Delay, Technology and Team
Familiarity (p = .275) on Task Accuracy.
0
20
40
60
80
100
120
Male-Male/Female-Female Male-Female
Mea
n Pe
rcen
t Acc
urac
y
Team Gender Composition
Audio Audiovisual

88
5.1.3 Percentage of Factoids Shared
Results of the analysis including Gender showed no significant interactions of Gender and Delay
(p = .428), of Gender and Technology (p = .170), Delay and Technology (p = .923), or Gender,
Delay and Technology (p = .605). Also, there were no significant effects of Gender (p = .757),
Delay (p = .121), or Technology (p =.140) on the Percentage of Factoids Shared.
Similarly, results from the analysis including Team Familiarity showed no significant
interactions of Familiarity and Delay (p = .444), Familiarity and Technology (p = .612), Delay
and Technology (p = .684), or Familiarity, Delay and Technology (p = .879). No significant
main effects of Familiarity (p = .738), Delay (p = .116) or Technology (p = .491) were found.
5.2 Subjective Results
Summary tables of means and standard deviations for the subjective measures are shown in
Appendix H.
5.2.1 NASA TLX Overall Workload
Results of the analysis of the effect of Gender, Delay, and Technology on ratings of Overall
Workload showed no significant interactive effects of Gender and Delay (p = .274), Gender and
Technology (p = .283), Delay and Technology (p = .132), or Gender, Delay and Technology (p =
.362). With respect to main effects, there was a significant main effect of Technology F(1, 23) =
5.24, p = .032. Pairwise comparisons showed Overall Workload ratings were lower when team
members used Audiovisual Technology compared to Audio-only (mean difference = 3.29, p =
.002). However, there were no significant effects of Delay (p = .328) or Gender (p = .786).
Analysis of the effect of Familiarity, Delay, and Technology on Overall Workload indicated no
significant interactions of Familiarity and Delay (p = .063), Familiarity and Technology (p =
.961), Delay and Technology (p = .130), or Familiarity, Delay and Technology (p = .313). In
addition, there were no significant main effects of Familiarity (p = .292), Delay (p = .195), or
Technology (p = .082).

89
5.2.2 NASA TLX Subscales
In addition to the analysis of Overall Workload, each of the six NASA TLX subscales were
analyzed using separate linear mixed analyses.
5.2.2.1 Mental Demand
When considering the effect of Gender, Delay, and Technology on Mental Demand, the analysis
showed no significant interactions of Gender and Delay (p = .136), Gender and Technology (p =
.710), Delay and Technology (p = .123), or Gender, Delay and Technology (p = .966) and no
significant main effects of Gender (p = .536), Delay (p = .699), or Technology (p = .162).
Similarly, Mental Demand ratings were not affected by Team Familiarity, Delay, and/or
Technology as no significant interactions of Familiarity and Delay (p = .525), Familiarity and
Technology (p = .933), Delay and Technology, (p = .173), or Familiarity, Delay and Technology
(p = .198), and no significant main effects of Familiarity (p = .141), Delay (p = .344), or
Technology (p = .206) were found.
5.2.2.2 Physical Demand
As mentioned previously, an outlier was detected for the Physical Demand data so these data
were analyzed with and without the outlier. Results of the analysis of Gender, Delay, and
Technology data including the outlier showed no significant interactions of Gender and Delay (p
= .620), Gender and Technology (p = .728), Delay and Technology (p = .432), or Gender, Delay,
and Technology (p = .442) on Physical Demand ratings. Further, no significant main effects of
Gender (p = .147), Delay (p = .142), or Technology (p = .487) were found.
When the outlier was eliminated, similar results were found, as there was no significant
interactions of Gender and Delay (p = .967), Gender and Technology (p = .800), Delay and
Technology (p = .748), or Gender, Delay, and Technology (p = .496) on Physical Demand
ratings. Further, no significant main effects of Gender (p = .089), Delay (p = .178), or
Technology (p = .369) were found.
Analysis of the effects of Familiarity, Delay, and Technology on Physical Demand, including the
outlier, showed no significant interactive effects of Familiarity and Delay (p = .864), Familiarity

90
and Technology (p = .099), Delay and Technology (p = .310), or Familiarity, Delay, and
Technology (p = .567). However, the analysis showed a significant main effect of Delay F(2,
173.08) = 3.40, p = .036. Pairwise comparisons showed participants rated their physical
workload higher at 800 ms than both 0 ms (mean difference = 1.53, p = .018) and 1600 ms
(mean difference = 1.56, p = .022), with no significant differences between 0 ms and 1600 ms
(mean difference = .03, p =.957). No significant main effects of Familiarity (p = .704), or
Technology (p = .159) were found.
When the outlier was removed from the analysis, results showed no significant interactive effects
of Familiarity and Delay (p = .550), Familiarity and Technology (p = .081), Delay and
Technology (p = .839), or Familiarity, Delay, and Technology (p = .607). Further no significant
main effects of Delay (p = .129), Familiarity (p = .895), or Technology (p = .108) were found.
5.2.2.3 Temporal Demand
Analysis of the data including Gender, Delay, and Technology revealed no significant
interactions of Gender and Delay (p = .337), Gender and Technology (p = .125), Delay and
Technology (p = .278), or Gender, Delay, and Technology (p = .092). A significant main effect
of Technology, F(1, 234) = 5.01, p = .026 (Figure 23), was found for Temporal Demand ratings.
Audiovisual Technology ratings were lower, than Audio-alone (mean difference = 17.78, p =
.026). There were no significant main effects of Gender (p = .525), or Delay (p = .488).
Ratings of Temporal Demand were not significantly affected by the interaction of Familiarity
and Delay (p = .052), Familiarity and Technology (p = .772), Delay and Technology (p = .580),
or Familiarity, Delay, and Technology (p = .428), No significant main effects of Familiarity (p =
.071), Delay (p = .429), or Technology (p = .082) were found.
5.2.2.4 Performance
Results of the analysis for the Log transformed Performance ratings showed no significant
interactions of Gender and Delay (p = .446), Gender and Technology (p = .387), Delay and
Technology (p = .273), or Gender, Delay, and Technology (p = .348). Further, the analysis
indicated that neither Gender (p = .498), Delay (p = .543), nor Technology (p = .532)
significantly affected ratings of Performance.
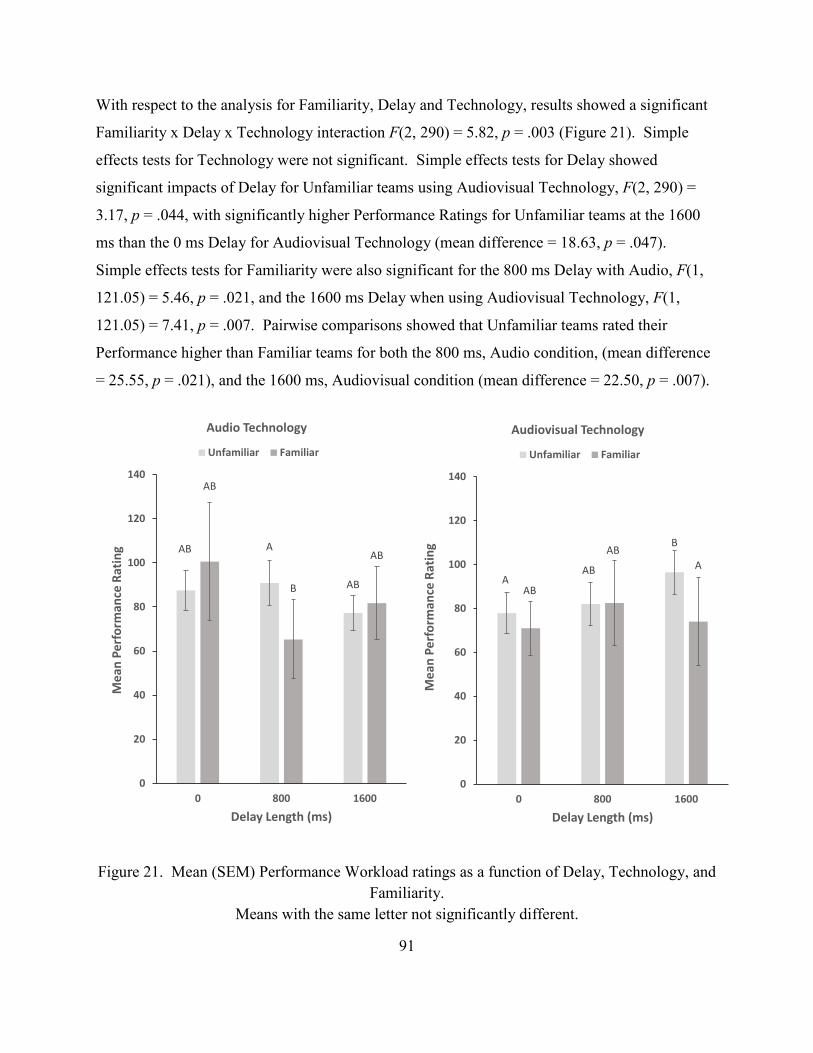
91
With respect to the analysis for Familiarity, Delay and Technology, results showed a significant
Familiarity x Delay x Technology interaction F(2, 290) = 5.82, p = .003 (Figure 21). Simple
effects tests for Technology were not significant. Simple effects tests for Delay showed
significant impacts of Delay for Unfamiliar teams using Audiovisual Technology, F(2, 290) =
3.17, p = .044, with significantly higher Performance Ratings for Unfamiliar teams at the 1600
ms than the 0 ms Delay for Audiovisual Technology (mean difference = 18.63, p = .047).
Simple effects tests for Familiarity were also significant for the 800 ms Delay with Audio, F(1,
121.05) = 5.46, p = .021, and the 1600 ms Delay when using Audiovisual Technology, F(1,
121.05) = 7.41, p = .007. Pairwise comparisons showed that Unfamiliar teams rated their
Performance higher than Familiar teams for both the 800 ms, Audio condition, (mean difference
= 25.55, p = .021), and the 1600 ms, Audiovisual condition (mean difference = 22.50, p = .007).
Figure 21. Mean (SEM) Performance Workload ratings as a function of Delay, Technology, and Familiarity.
Means with the same letter not significantly different.
AB A
AB
AB
B
AB
0
20
40
60
80
100
120
140
0 800 1600
Mea
n Pe
rfor
man
ce R
atin
g
Delay Length (ms)
Audio Technology
Unfamiliar Familiar
AAB
B
AB
ABA
0
20
40
60
80
100
120
140
0 800 1600
Mea
n Pe
rfor
man
ce R
atin
g
Delay Length (ms)
Audiovisual Technology
Unfamiliar Familiar

92
5.2.2.5 Effort
Results of the analysis for the effects of Gender, Delay, and Technology on Effort ratings
showed no significant interactions of Gender and Delay (p = .785), Gender and Technology (p =
.119), Delay and Technology (p = .063), or Gender, Delay, and Technology (p = .768). Further,
no significant main effects of Gender (p = .267), Delay (p = .868), or Technology (p = .365)
were found.
Similarly, there were no significant interactive effects of Familiarity and Delay (p = .173),
Familiarity and Technology (p = .356), Delay and Technology (p = .172), or Familiarity, Delay,
and Technology (p = .342) on ratings of Effort, and no significant main effects of Familiarity (p
= .876), Delay (p = .881), or Technology (p = .986).
5.2.2.6 Frustration
Analysis of the effect of Gender, Delay, and Technology on the Log Frustration data showed no
significant interactions of Gender and Delay (p = .762), Gender and Technology (p = .570),
Delay and Technology (p = .786), or Gender, Delay, and Technology (p = .595). Significant
main effects of both Delay, F(2, 265) = 3.27, p = .039 and Gender F(1, 53) = 4.22, p = .045 were
found. With respect to Delay, pairwise comparison tests showed higher Frustration ratings for
the 1600 ms delay compared to the 0 ms delay (mean difference = .158, p = .041). For Gender,
male-female teams rated their frustration significantly higher than male-male or female-female
teams (mean difference = .370, p = .045). No significant main effect of Technology (p = .247)
was found.
Analysis of the Log Frustration data including Familiarity, Delay, and Technology data showed a
significant Delay x Technology x Familiarity interaction, F(2, 265) = 3.95, p = .020 (Figure 22).
Simple effects tests for Familiarity were not significant. Analysis of simple effects showed a
significant effect of Delay on Frustration ratings for Unfamiliar teams using Audiovisual
Technology, F(2, 265) = 3.78, p = .024, and Familiar teams using Audio Technology, F(2, 265)
= 3.82, p = .023. Pairwise comparison tests for Unfamiliar teams using Audiovisual Technology
failed to reach significance. Pairwise comparison tests for Familiar teams showed higher
frustration ratings at the 1600 ms delay compared to 0 ms delay for Audio Technology (mean

93
difference = 27.50, p = .029). For the simple effects of Technology, results showed that
Technology significantly influenced Frustration ratings, for Familiar teams at the 1600 ms delay,
F(1, 265) = 6.18, p = .014, with no other significant effects. At the 1600 ms delay, teams with
Familiar members, rated their frustration significantly higher with Audio Technology compared
to Audiovisual Technology (mean difference = 15.5, p = .014). No significant interaction of
Familiarity and Delay (p = .984), Familiarity and Technology (p = .874), or Delay and
Technology (p = .263) were found. Results of the analysis also indicated a significant main
effect of Delay, F(2, 265) = 3.69, p = .026), however the main effect can be interpreted only in
light of the Delay x Technology x Familiar interaction.
Figure 22. Mean (SEM) Frustration ratings as a function of Delay, Technology, and Familiarity. Means with the same letter not significantly different.
5.2.3 Interpersonal Trust - Affective
With respect to Affective Trust ratings, no significant interactions of Gender and Delay (p =
.927), Gender and Technology (p = .686), Delay and Technology (p = .432), or Gender, Delay,
AA
A
A
A
A
0
20
40
60
80
100
120
0 800 1600
Mea
n Fr
ustr
atio
n Ra
ting
Delay Length (ms)
Unfamiliar
Audio Audiovisual
A
A
B
AA
A
0
20
40
60
80
100
120
0 800 1600
Mea
n Fr
ustr
atio
n Ra
ting
Delay Length (ms)
Familiar
Audio Audiovisual

94
and Technology (p = .445) were found. Neither Gender (p = .647), Delay (p = .814), nor
Technology (p = .865) affected ratings of Affective Trust.
No significant interactions of Familiarity and Delay (p = .943), Familiarity and Technology (p =
.355), Delay and Technology (p = .343), or Familiarity, Delay and Technology (p = .086) were
found. However, there was a main effect of Familiarity, F(1, 28.50) = 12.41, p = .001 (Figure
23). Post-hoc tests showed higher Affective Trust ratings for teams with Familiar members as
opposed to teams with Unfamiliar members (mean difference = .933, p = .001). No significant
effects of Delay (p = .880), or Technology (p = .748) on Affective Trust were found.
Figure 23. Mean (SEM) Affective Trust ratings as a function of Familiarity. Means with the same letter not significantly different.
5.2.4 Interpersonal Trust - Cognitive
Similarly, with respect to Cognitive Trust, no significant interaction of Gender and Delay (p =
.722), Gender and Technology (p = .293), Delay and Technology (p = .178), or Gender, Delay,
A
B
1
2
3
4
5
6
7
Unfamiliar Familiar
Mea
n Af
fect
ive
Trus
t (1
= st
rong
ly d
isagr
ee, 7
= st
rong
ly a
gree
)
Team Familiarity

95
and Technology (p = .860) were found. Also, there were no significant effects of Gender (p =
.342), Delay (p = .465), nor Technology (p = .531) on ratings of Affective Trust.
Results of the analysis of the Cognitive Trust data showed a significant Delay x Technology x
Familiarity interaction, F(2, 155.18) = 3.99, p = .021 (Figures 24 and 25). Simple effects tests
for Familiarity showed that Familiarity had a significant influence on Cognitive Trust ratings
across all Delay levels and Technology types. Pairwise comparisons showed that Familiar teams
showed consistently higher Cognitive Trust than Unfamiliar teams across all three Delay levels
and both Technologies (Table 9). Simple effects for Delay showed a significant influence of
Delay on Cognitive Trust ratings for Unfamiliar teams using Audiovisual Technology, with
higher Cognitive Trust ratings for 0 ms delay compared to 800 ms (mean difference = .128, p =
.033) and 1600 ms (mean difference = .206, p = .008). Results of simple effects tests for
Technology showed significant effects on Cognitive Trust for Unfamiliar Teams at the 0 ms and
1600 ms Delays. Specifically, at the 0 ms Delay, Unfamiliar teams had higher Cognitive Trust
ratings when using Audiovisual Technology compared to Audio-only (mean difference = .081, p
= .015). However, at the longer 1600 ms Delay, Unfamiliar teams rated their Cognitive trust
higher with Audio-only than Audiovisual Technology. Results of the analysis also revealed a
significant Technology x Familiar Interaction, F(1, 198. 10) = 5.50, p = .020, and a significant
main effect of Familiarity, F(1, 53. 83) = 12.95, p = .001. However, these effects can be
interpreted only in the context of the Delay x Technology x Familiarity interaction.
Table 9. Familiarity Simple Effects Summary for Cognitive Trust
Delay Tech F Unfamiliar
Mean
Familiar
Mean
Mean Difference
Sig.
0 ms Audio F(1, 55.35) = 11.42 p = .001
5.24 6.14 .904 .001
Audiovisual F(1, 54.46) = 10.92 p = .002
5.32 6.19 .879 .002
800 ms Audio F(1, 70.21) = 11.19, p = .001
5.22 6.18 .958 .001
Audiovisual F(1, 63.50) = 14.64, p = .000
5.19 6.25 1.063 .000

96
1600 ms Audio F(1, 61.82) = 7.35, p = .009
5.32 6.06 .746 .009
Audiovisual F(1, 74.05) = 16.36, p = .000
5.11 6.29 1.179 .000
Figure 24. Mean (SEM) Cognitive Trust ratings as a function of Delay, Technology and Familiarity.
Means with the same letter are not significantly different.
A AB ABC
B ABC ABCD
1
2
3
4
5
6
7
0 800 1600
Mea
n Co
gniti
ve T
rust
(1 =
stro
ngly
disa
gree
, 7 =
stro
ngly
agr
ee)
Delay Length (ms)
Audio
Unfamiliar Familiar
A AB ABC
B ABC ABCD
1
2
3
4
5
6
7
0 800 1600
Mea
n Co
gniti
ve T
rust
(1
= st
rong
ly d
isagr
ee, 7
= st
rong
ly a
gree
)
Delay Length (ms)
Audiovisual
Unfamiliar Familiar

97
Figure 25. Mean Cognitive Trust as a function of Delay, Technology, and Familiarity. Means with the same letter are not significantly different.
5.2.5 Trust in Technology
For the Technology Trust analysis, no significant interaction of Gender and Delay (p = .420),
Gender and Technology (p = .323), Delay and Technology (p = .834), or Gender, Delay, and
Technology (p = .987) were found. Also, there were no significant effects of Gender (p = .887),
Delay (p = .736), nor Technology (p = .244) on Technology Trust.
Results of the effect of Familiarity, Delay, and Technology on Technology Trust showed no
significant interactions of Familiarity and Technology (p = .203), Delay and Technology (p =
.811), Delay and Familiar (p = .087) or Familiarity, Delay, and Technology (p = .344) on
Technology Trust ratings. No significant main effects of Familiarity (p = .163), Delay (p =
.234), or Technology (p = .708) were found.
A AB ABBAB ABC
1
2
3
4
5
6
7
0 800 1600
Mea
n Co
gniti
ve T
rust
(1 =
stro
ngly
disa
gree
, 7 =
stro
ngly
agr
ee)
Delay Length (ms)
Unfamiliar
Audio Audiovisual
AA
AA AA
1
2
3
4
5
6
7
0 800 1600M
ean
Cogn
itive
Tru
st(1
= st
rong
ly d
isagr
ee, 7
= st
rong
ly a
gree
)
Delay Length (ms)
Familiar
Audio Audiovisual

98
5.2.6 Satisfaction
With respect to the effect of Gender, Delay, and Technology on Satisfaction, no significant
interaction of Gender and Delay (p = .938), Gender and Technology (p = .282), Delay and
Technology (p = .553), or Gender, Delay, and Technology (p = .389) were found. Also, there
were no significant effects of Gender (p = .820), Delay (p = .492), nor Technology (p = .282) on
Satisfaction.
For the effect of Familiarity, Delay, and Technology on Technology Trust, the analysis showed
no significant interaction of Familiarity and Delay (p = .769), Familiarity and Technology (p =
.768), Delay and Technology (p = .185), or Familiarity, Delay, and Technology (p = .048) were
found. Also, there were no significant effects of Familiarity (p = .144), Delay (p = .517), nor
Technology (p = .567) on Satisfaction.
5.3 Discussion
With respect to team gender diversity and the impact on distributed team interaction, it
was hypothesized that when communication between team members is delayed, gender diverse
teams will exhibit longer task completion times, lower task accuracy, share less information with
each other, feel less satisfied with their interactions, exhibit lower trust ratings, lower
satisfaction, and higher workload than same gender teams. Hypothesis 5 was not supported,
which is interesting in light of other findings in the literature. For example, work by Pearson et
al., (2008), looked at the effects of delayed feedback on intragroup and intergroup dyadic
conversations in ethnic groups (i.e., White, Black, and Latino) either in real-time, or with a 1-
second delay, and found that intergroup dyads experienced greater levels of anxiety and a
decreased desire for interaction with a partner following a delayed conversation, rather than
following a conversation in real-time (no delay). The intragroup dyads experienced less anxiety
with the delayed feedback than when conversing in real-time. Even though Pearson et al. (2008)
focused on ethnic diversity and perceived anxiety, results from their work illustrate the potential
costs for teams with diverse group membership when communication is delayed. However, in
the present study, delay did not have the anticipated effect, as the interaction effect of delay and
team gender composition did not emerge for the objective or subjective measures. Although
results of the present work were different than what was hypothesized, the results are
99
encouraging, and may suggest that in certain situations, the gender composition of distributed
teams may not affect member interaction as much as other team characteristics when
communication is delayed or restricted.
Given that only a few studies looking into the impact of communication delays have
specifically addressed team gender composition, there is a need for more work to be done.
Results documented in the organizational literature also provide mixed results regarding the
effects of demographic diversity (i.e. age, gender) on work team performance (Balliet et al.,
2011; Baron et al., 2010; Herring, 2010; van Knippenberg & Schippers, 2007). Studies have
reported that diversity can be beneficial, detrimental, or have minimal effects on team
performance, and depends on the circumstances surrounding team member interaction, such as
the team size, operational context, tasks being performed, team member personality and attitudes
(Kozlowski & Bell, 2004; Wood, 1986). With respect to the present work there are several
potential reasons why we did not observe the anticipated effects of gender diversity when
communication was delayed.
First, participants were recruited from within the same team-based organization, meaning
they had experience working on teams and may have possessed a “team orientation.” Team
orientation refers to a “general tendency to be comfortable working in team settings, to exhibit
interest in learning from others, and to have confidence in the productivity of the team”
(Mohammed & Angell, 2004, pp. 1018). This could have helped reduce some of the effects we
anticipated between same and mixed-gender teams. In the literature on teamwork in extreme
environments, research supports recruiting members with requisite skills as well as those with a
team orientation as a strategy to mitigate potential conflict in diverse teams, and enhancing team
performance (Vessey & Landon, 2017). Another factor may be the fact that the organization
from which participants were recruited encourages collaboration across organizational and team
boundaries (Rico et al., 2012). Therefore, participants were adept at collaborating in teams with
different levels of diversity.
Another consideration is the type of task performed. In the present study, the ELICIT
task was essentially a consensus-based task in which team members cooperated in order to solve
the task. With a more competitive task or a task in which there is conflicting information, results
of the study may have been different, as the literature has shown that in general, female

100
participants tend to prefer cooperative rather than competitive settings. Therefore, having a male
partner, who is considered to be competitive, coupled with delays in communication, may have
created less positive interactions in mixed-gender teams (Balliet et al., 2011, Kuhn & Villeval,
2015) and results may have aligned better with those expected in Hypothesis 5. Further, another
aspect of the task is the level of stress the task elicited. In the Pearson et al., 2011 study, team
members discussed an emotionally charged topic with feedback delays which may have
contributed to the increased anxiety among intergroup members. In the present study, the
ELICIT task itself was mildly stressful since the goal of the task was to solve a fictitious terror
plot within the allotted time, coupled with the stress of communication delays. Even though
results showed that male-female teams experienced more frustration than male-male and female-
female same-gender teams, there was no interactive effects of gender composition and delay.
Results may have been different if there was more stress, urgency, or uncertainty introduced,
which is relevant for those distributed teams performing in extreme or dynamic environments.
In addition to more research into diverse gender composition, further work should be
done to determine whether there are differences within same-gender teams. In other words, for
the analysis described above, same-gender teams were compared with mixed-gender teams, but
there may be differences associated with male-male and female-female interaction that were not
captured in the analysis. For example, Armstead (2007) proposed that there could be more
drastic differences for female-female teams due to the fact that women are more socially-
oriented than men, and therefore communication is more relational; disruptions in
communications such as those created by delays may result in more negative effects for all-
female teams compared to male-male teams.
One notable finding in the present study was the Gender x Technology interaction for
Task Accuracy, with male-female teams scoring higher accuracy on the ELICIT task when using
Audiovisual Technology compared to Audio-alone. In fact, a closer look at the means for task
accuracy showed that when using audiovisual technology, male-female teams scored 100%
accuracy in all three delay conditions, whereas task accuracy with audio-alone ranged from 91%
to 94%. Although not hypothesized, these results are consistent with findings of other work that
showed that audiovisual technology benefits diverse teams (Veinott et al., 1997) and suggest that
further research should be conducted to help further the literature with respect to the potential

101
benefit of technology in distributed teams that are diverse with respect to gender, culture, or
other demographic variables, as well as to determine how interactions in diverse teams differ
with audio compared to audiovisual technology.
Another important factor that may influence team collaboration is the level of familiarity
among team members. In Hypothesis 6, we anticipated that team member familiarity would
lessen the effect of communication delays, such that teams with members who are familiar with
each other would complete the task faster, be more accurate, share more information, have
higher levels of trust, be more satisfied, and have lower levels of workload, than teams
comprised of members that are not familiar with one another. Hypothesis 6 was also not
supported as no interactive effect of Delay and Familiarity was found for any of the objective or
subjective measures. Again, this is potentially an encouraging finding, however, further work
should be done to provide more insight into how team member familiarity may influence
distributed team interaction with delays, especially when considering the longer delay lengths
associated with missions to the International Space Station (ISS) (e.g., 50 minutes) and Mars
(e.g., up to 20 minutes). Research suggests that individuals prefer to work with others with
whom they are most familiar as the level of comfort within the team facilitates trust and
commitment (Rink, Kane, Ellemers, and van der Vegt, 2017), so it is important understand how
member familiarity benefits or influences interactions in distributed teams when communication
is delayed. Further, as documented in Tiferes & Bizantz (2108) there is a need to better
understand how team member familiarity and team characteristics such as geographic distributed
affect team communication. There are a few reasons why the anticipated effects of team familiarity and delays didn’t
emerge as hypothesized. In the literature, it is held that members of familiar teams possess
unique interpersonal knowledge about other’s skills, values, and perspectives, not held by
unfamiliar teams and this provides some advantages when working together. For example,
member familiarity is considered to help facilitate coordination and sharing of information
between team members, and may even lessen the anxiety experienced in group interaction
(Gruenfeld et al., 1997) because team members who are familiar have an established level of
knowledge and rapport with one another and therefore, aren’t as concerned about being accepted
by their team as are unfamiliar members (Goodman & Leyden, 1997). Given that in the present

102
study, participants were recruited from the same organization, there was likely a degree of
similarity and potentially a sense of connection or affiliation among team members. Perhaps the
common affiliation then helped facilitate team collaboration (Jackson et al., 2003; Bowers et al.,
2000; Hinds & Weisband, 2003) and reduced the uncertainty and anxiety in their interactions,
even with delays, and therefore we didn’t see the anticipated benefit of team familiarity.
Several other effects were indicated by the analysis and even though they are beyond the
scope of the research hypotheses, they still provide useful information and may be areas for
further inquiry. For example, an interesting finding, although not hypothesized, was the
interaction effect of delay, technology, and familiarity on task completion time shown in Figure
19. It does appear that audiovisual technology benefitted unfamiliar teams more than familiar
teams in the 0 ms delay condition as task completion time was 11.7% lower with audiovisual
technology than audio. It is also interesting to note that in the audiovisual conditions, teams took
14.5% longer to complete the task with the 800 ms delay compared to 0 ms. Further, although
the analysis indicated no significant differences for familiar teams, it does appear there is a trend
toward faster task completion time with audiovisual technology and would be interesting to
investigate in future work.
In addition, results showed that familiarity influenced both components of Interpersonal
trust: Affective-based and Cognitive-based Trust. Results showed that Affective trust was
higher for familiar teams than unfamiliar teams as demonstrated by the main effect of
Familiarity, although Affective Trust was not affected by the Delay x Familiarity interaction as
anticipated in Hypothesis 6. Affective trust is based on the emotional connection between team
members and the belief that team members mutually care for each other, and is built as team
members openly share ideas and concerns (Krausman, 2017). This is likely why, in the present
study, familiar team members rated their affective trust higher than teams with unfamiliar
members, as familiar team members, through prior interactions with their partner, had already
established that confidence and rapport with one another. Other researchers suggest a link
between the level of team member familiarity and the development of trust between team
members (Rocco et al., 2001; Webber, 2008), as previous contact can facilitate initial trust and
boost performance, even in face-to-face teams (Wilson et al., 2006). Without prior knowledge or
some degree of familiarity, team members would lack the information necessary to decide

103
whether, or not, to trust a team member (McAllister, 1995; Webber, 2008; Wilson et al., 2006).
McAllister (1995) suggests that of the two types of trust, affective trust takes longer to establish,
but once it is established, it is more difficult to break, and is more stable over time and situations.
Perhaps this is why, overall, ratings of Affective Trust were not affected by Delay and/or
Technology.
Cognitive trust, on the other hand, was affected by Familiarity, Delay, and Technology.
Results indicated that Cognitive Trust was consistently higher for familiar teams compared to
unfamiliar teams at each level of Delay and Technology (Table 8). In addition, unfamiliar teams
had higher levels of Cognitive Trust at the 0 ms delay than 800 ms and 1600 ms, and higher
levels of Cognitive Trust when using Audiovisual Technology; however this was only seen for
the 0 ms delay. Even though this result is beyond the scope of the experimental hypotheses, it
provides some important considerations for Cognitive Trust development in distributed teams.
Unlike affective trust, cognitive trust is more superficial and is characterized by beliefs about the
competence and reliability of other team members to consistently perform and keep their word
with respect to deadlines (Rocco et al., 2001). In other words, team members who reliably
perform their tasks in a timely fashion and according to expectations, will possess more
cognitive trust. However, if the team encounters a problem completing a task on time, cognitive
trust will suffer (Webber, 2008).
In the present study, it appears that familiar teams who have interacted previously and
which possessed prior knowledge regarding their partner, would have had opportunities to
demonstrate their level of competence and reliability, and assess that of their partner. Therefore,
as the results indicated, they had a fairly stable level of cognitive trust that was not affected by
the difficulties posed by the communication technology or delays. Without prior team member
interaction, teams operate with a degree of uncertainty about the reliability and competence of
their partner, and must continually look for evidence to decide whether, or not, to trust their
partner. It is likely that the uncertainty regarding their partner’s level of competence, as well as
the challenge posed by the communication technology and delays, degraded the Cognitive Trust
for Unfamiliar teams. Taken together, these results suggest that in distributed teams, even though
affective trust may be unaffected by delay and technology, there may be negative effects on
cognitive trust when team members are unfamiliar with one another. McAllister (1995) suggests

104
that cognitive trust can be more difficult to maintain compared to affective trust, which indicates
that further work should be done to better understand the process of trust development in
distributed teams with familiar and unfamiliar members. Perhaps the benefit of team member
familiarity with respect to cognitive trust would start to degrade with longer delays or in high-
risk environments as mentioned earlier.
Future work should also investigate the possible interaction effect of gender diversity and
level of team familiarity, as this is not well addressed in the literature and wasn’t addressed in the
supplemental analysis due to a limited sample size for each of the levels of gender and
familiarity. In addition, age diversity is another variable that could potentially impact
communication between team members with delays and different communication technologies,
and would be interesting to explore in future work.
In summary, results described above have implications for integrating technology and
distributed teams with diverse gender composition, as well as teams with members with different
levels of familiarity, as difficulties in communicating caused by communication delays and/or
technology may negatively impact team member interaction and create reluctance to work with
team members. By understanding the challenges encountered by diverse distributed teams,
organizations can identify strategies and tools (e.g., training, technology) that promote team
success and ultimately enhance team performance. When considering that the current level of
technology likely will not be able to completely eliminate the negative effects of delay
documented in the literature (Dove-Steincamp, 2012; Fisher et al., 2016), research should be
focused on strategies that enable team members to manage their interactions with delays, while
maintaining task and team performance.
In the next section, study limitations are described, followed by conclusions and
recommendations.
5.4 Study Limitations
Results of the present study and supplemental analysis help shed more light on the effects
of communication delays and technologies on distributed team collaboration. However, there are
some limitations that should be recognized that may limit the generalizability to other settings
and populations. First, as mentioned earlier, participants were recruited from the same

105
organization and as a result, likely possessed a common vocabulary and/or style of working
(Olson & Olson, 2014), so it is unclear whether our results would apply to teams that are
dissimilar or who may not have much in common and must work to establish a shared language.
In addition, teams who regularly or exclusively work remotely, may in fact, acquire specific
feelings, thoughts, strategies, and behaviors that are distinct from teams in the present study,
who, although experienced with communication technology, work primarily in collocated project
teams that meet primarily face to face, and on occasion use audio or videoconferencing to
connect with team members that are geographically dispersed. Existing research has shown that
experience working together online can lessen the effects of remote collaboration (Hollingshead
et al., 1993; Thompson et al., 2006; Walther, 2002) therefore, it is unclear whether the current
findings extend to teams who collaborate and interact primarily, if not exclusively, through
remote communication technology.
In order to fully assess the impact of communication technology on team process and
performance, several authors strongly advocate for a longitudinal research approach
(Hollingshead et al., 1993; Kozlowski et al., 2004; Walther, 2002). However, longitudinal
research is not without difficulties and expense, and was not possible in the present study due to
a limited population from which to draw and constraints on both participant time and budget.
Also, all participants were recruited from a work environment where technology is pervasive and
is necessary to perform their job so results may not apply well to those who are inexperienced
with various communication technologies or have never used communication technologies such
as video and audio conferencing technologies. Although technology, to include mobile
technologies, such as Facetime, Twitter, and Facebook Messenger, are ubiquitous, they may not
be as familiar to some people and therefore, results for these less-experienced participants may
be different.
Third, since the study was conducted in a laboratory, we were not able to adequately
capture all of the complexities and stressors present in an operational environment and their
subsequent effects on team interaction. So, when applying the results, it is necessary to consider
the potential for additional effects on performance. Similarly, even though the ELICIT task itself
was rather engaging with inherent time pressure, the task environment remained consistent
throughout the experiment, with no unexpected events that would change task tempo or the task
106
situation as described by the factoids, so it is likely that team members may have managed their
interactions differently if performing multiple tasks, or if the situation was more dynamic than in
the present study, or if there was more time pressure applied These changes may have made the
delays more salient, perhaps increasing the cognitive load experienced by team members, and in
turn may have had a greater impact on task performance and subjective measures, especially
trust and satisfaction. Further research should extend these findings to include more dynamic
environments, more time pressure, and even diverse team composition, to further understanding
of how team members manage their interactions when delays are present (Krausman, 2017).
Lastly, teams consisted of only two members due to the limited population from which to
recruit participants. Dynamics of conversations as well as overall team experiences and social
presence (Thompson et al., 2006) may be dramatically different in larger teams so care should be
taken when applying results of the present work to larger teams. For larger teams (i.e., three or
more members) managing conversations and coordination becomes more important (van der
Kleij et al., 2004; Thompson et al., 2006) and subsequently, result from the present study may be
more extreme in larger teams. Future research should explore this issue especially for larger
teams that are diverse in terms of gender composition, discipline, ethnicity etc., as interpersonal
relations within diverse teams necessarily becomes more complex (Gillespie, Chaboyer,
Longbottom, & Wallis, 2010).
5.5 Recommendations and Future Work
Advances in information communication technologies have vastly increased the
opportunities for communicating within and between teams involved in distributed operations.
These new technologies can significantly enhance information sharing by lower barriers between
team members and improving access to required information. However, as discussed earlier in
this paper, just merely introducing technologies doesn’t guarantee that users will embrace it, or
that it will be useful to the team or organization (van den Heuvel, van Ettinger, & Grant, 2009).
Instead, successful integration of technology within teams or organizations depends on jointly
optimizing the personnel and technological subsystems. In the present study we investigated how
delays in technology-mediated communication alter team member interactions to better
understand how delays affect team performance and team processes as well as to provide
recommendations to enhance team member interaction in distributed teams. Based on the results
107
of this study, we offer the following recommendations for enhancing distributed team interaction
when communication is delayed.
First, although it was hypothesized that adding a video channel could lessen the effects of
delay, the data suggest mixed results, so while it is not possible to make an overall
recommendation for including audiovisual technology, it is recommended that organizations
consider the type of team using the technology, as results indicated that being able to see a video
image of one’s partner increased task accuracy for gender diverse teams (male-female). Even
though this effect was independent of delays, it is an important finding with respect to
understanding how the audiovisual technology changed the interactions of the male-female
teams so that they were more accurate on the task. An interesting next step would be to examine
the recorded conversations of the gender diverse teams to better understand the different
conversational strategies when using audio and audiovisual technology. Further, results of the
present work could be expanded to include other types of team diversity to understand the
circumstances in which seeing a partner is advantageous, or if there are other ways to elicit the
same results without using audiovisual technology (avatar, photo, profile). Results also showed a
beneficial effect of being able to see one’s partner when delays were present, as there was a
reduction in overall workload at shorter delays, and frustration ratings at longer delays for
familiar teams, when using audiovisual technology, which is an additional consideration when
equipping teams with various technologies.
With respect to providing visual cues that may lessen the effects of delays, other types of
visual technologies such as a shared or smart workspace may have provided better support for
team members, as both team members could view the same workspace with all of the
information pertaining to the problem, which would in turn, potentially reduce the amount of
communication that takes place between team members and subsequently, lessen the effect of the
delays. This type of arrangement would be especially important in situations with longer delays
(Keebler et al., 2015). Further, using a pull vs. push strategy (i.e., a data repository or cloud-
based technology) for task-related information would enable team members to focus their efforts
on identifying patterns in the data and solving the task, rather than having to share the
information with their partner and arrive at a solution. Another advantage to this approach is that
team members would both be aware of any updates in information, without the need to
108
communicate the new information to their team member. Or potentially utilizing a type of
decision aid to help consolidate information and identify important patterns in the data may
reduce the quantity of communication between team members and therefore reduce the impact of
delays, as well as assisting team members with allocating attention in periods of high workload.
Another recommendation is that where possible, organizations provide mechanisms for
newly formed distributed teams to get to know each other at the outset of a project, especially in
instance where trust among team members is critical, such as in highly interdependent
operations, or in dynamic operational environments where information is changing and decisions
must be made in a timely fashion. This is based on the finding that familiar teams possessed
higher affective and cognitive trust than teams with unfamiliar members. What is particularly
interesting is that in familiar teams, cognitive trust was unaffected by delays and technology, as
shown by the consistently high ratings across all of the treatment conditions. Therefore, either
enabling newly formed teams members to meet face-to-face, or conducting remote social
exchanges, perhaps one-on-one, aimed specifically at establishing familiarity among members
may facilitate the development of trust and enhance collaboration in distributed teams.
In addition to building familiarity about fellow team members, it may be useful to also
build an understanding of the tasks and responsibilities, of fellow team members, through what is
called cross-training. The overall goal of cross-training is to provide a “big picture” perspective
of team functions and how the varied tasks and functions of each team member are interrelated
(Wilson, Burke, Priest, & Salas, 2005). By training on the roles, duties, and responsibilities of
one’s team members, it enables each member to anticipate the needs of fellow members, thus
enhancing coordination and reducing the quantity of communication required (Wilson et al.,
2005). So, in situations where communication delays are problematic, cross-training may be a
useful technique to increase knowledge about fellow team members as well as lessen the effects
of communication delays. Cross-training is considered to be most useful for highly
interdependent teams (Salas, Cannon-Bowers, & Weaver, 2017), such as those used in the
present study, so the feasibility of cross-training as a mitigation strategy for delays, could be
investigated in future work.
Yet another avenue to lessen the effect of communication delays may be training team
members to recognize delays, and ways to manage delayed conversations, such as introducing

109
certain communication protocols, for example, work by Fischer et al., (2015), and Love et al.,
(2013) has shown that if team members indicate when their partner can expect a response it may
alleviate some of the frustration of waiting, although this may be best suited for periods of low
workload.
5.6 Contribution
Given that communication delays are a salient problem faced by distributed teams, this
research sought to expand the existing literature with respect to how delays impact team
processes and performance, how technology, specifically audiovisual technology, may lessen the
impact of delays, and how delays affect teams with different compositions. These research
questions are important in light of the fact that even with technological advances, teams still
experience delays in operational settings such as air traffic control, military operations, and space
exploration as described earlier, and these delays will likely exist for many years to come.
Prior work has shown that communication delays interfere with conversational
mechanisms such as turn-taking and feedback. This research builds on prior work by
demonstrating that longer communication delays affect some team processes such as information
sharing between team members, which, depending on the task and work context, may have
implications for team decision making, especially in dynamic environments where situations are
fluid and operational tempo is high. Further, delays may not interfere with team members’
perception of the reliability of their partners (i.e., trust) or their level of satisfaction with their
interactions, which is a promising finding and may indicate that team members with experience
using technology are able to manage or adapt their interactions with their partners in the presence
of delays. It would be interesting to explore longer delays, such as those that occur during space
exploration to see if these findings hold. When delays were coupled with audiovisual
technology, results showed that workload was reduced with very short delays, whereas effort
increased for the medium delay lengths, which suggests that the type of task and type of team
should be considered when implementing audiovisual technology, so as not to increase demands
or distract the operator with too many visual cues.
In addition, the present study was designed to provide insight as to the effects of
communication delays on diverse team composition, since few studies have addressed this topic,
specifically by investigating gender diversity and team member familiarity, both of which are

110
prevalent in both collocated and distributed teams, and in the operational contexts mentioned
previously. Surprisingly, gender-diverse teams performed equally as well as same-gender teams
with delays, although other interesting findings emerged. For example, male-female teams
experienced a higher level of frustration than same-gender teams. Although this effect was
exclusive of the delays, this finding helps shed some light on the experience of same and mixed-
gender distributed teams. Further, when considering technology, male-female teams scored
higher accuracy with audiovisual compared to audio-alone, specifically, male-female teams
scored 100% accuracy when using audiovisual technology, although independent of the delays,
suggests a benefit of audiovisual technology for gender-diverse teams, which may also translate
to other types of diverse teams. With respect to familiarity, familiar teams experienced higher
levels of affective and cognitive trust than unfamiliar teams, across all experimental conditions,
indicating that trust remained stable in familiar teams even when communication is restricted or
delayed and may suggest that, where possible, to keep teams or crews with a history intact,
depending on the task and the larger organizational/operational context.
5.7 Conclusion
As distributed teams continue to expand, researchers must continue to address the
sociotechnical factors that facilitate distributed team productivity, so the full potential of
distributed teams can be realized. As documented in the literature and field tests of networked
communication systems, communication delays are a real problem in operational environments
and have been shown to have implications for team member interaction and performance. While
several studies have examined the impact of delays on communication processes such as number
of turns, number of utterances, and interruptions, there is still much to learn with respect to how
communication delays affect team processes and the experience of team members in remote
environments. Since it is likely that teams will respond differently depending on the
circumstances surrounding their interaction, further research should extend these findings to
include more complex situations, diverse team composition, and possibly more time pressure. By
better understanding how communication delays affect team interaction, we can continue to
identify ways to minimize the negative impact of these delays on teams in order to maximize
team performance.

111
Since the goal of the research is to better understand the impact of communication delays
as well as to propose possible strategies to lessen the effects of communication delays, a
supplemental analysis was performed using a subset of data collected during the communication
delay experiment described above to determine if pre-task team familiarity could help minimize
the negative effects of communication delays. Information pertaining to the supplemental
analysis is described in the next chapter.

112
Chapter 6. Impacts of team member familiarity on distributed team communication efficiency with coordination complexity: A post hoc analysis
“A few years ago one of us met an orthopedic surgeon with a reputation as the Henry Ford of knee replacements. Most surgeons take one to two hours to replace a knee, but this doctor routinely completes the procedure in 20 minutes. In a typical year he performs more than 550 knee replacements, 2.5 times as many as the second-most productive surgeon at the hospital, and has better outcomes and fewer complications than many colleagues. During his 30 year career he has implemented dozens of techniques to improve his efficiency. For instance, he uses one brand of prosthetic knee, and he opts for epidurals rather than general anesthesia. But another factor contributes to his speed: although most surgeons work with an ever-changing case of nurses and anesthesiologists, he has arranged to have two dedicated teams, one in each of two adjoining operating rooms; they include nurses who have worked alongside him for 18 years. He says that few of the methods he has pioneered would be practical if not for the easy familiarity of working with the same people every day.”(Huckman & Staats, 2013, pp.27).
6.1 Introduction
In the literature, the team context is portrayed as inherently complex, due to the
challenges of communicating and coordinating efforts, which becomes even more challenges in
distributed teams as members are not physically co-present with one another and rely on
technology to communicate (Driskell et al., 2003; Cuevas et al., 2004; Gilson et al., 2014).
These challenges are only compounded by delayed feedback that in some instances accompanies
mediated communication (Salas et al., 2001; Dove-Steinkamp, 2012; Fischer et al., 2014). As
mentioned previously, the overarching goal of this research was to further understand the
impacts of communication delays on distributed team interaction and offer potential solutions to
mitigate or lessen the effects of delays. While it is possible to reduce some delays through
technological advances (Delaney, Ward, McLoone, 2003; Renfro-Powers et al., 2011), the
increasing demand for bandwidth, coupled with the desire to explore at greater and greater
distances from Earth, suggests that it may not be possible to eliminate delays in all distributed
situations (Armstead, 2007; Caldwell et al., 2009; Fischer et al., 2013; Gutwin et al., 2004).
Thus far, research has identified some potential countermeasures for delayed
communication such as developing communication protocols that govern exchanges of
information between team members (Fischer et al., 2013), training as a team/crew resource
management (Kintz, Chou, Vessey, Leveton, & Palinkas, 2016), as well as some methods that
have used team member familiarity as a way to build resilience in teams (Neubauer, Wooley,
Khooshabeh, & Scherer, 2016). In this chapter, the intent is to build on findings of the dyadic
113
communication study documented in previous chapters, as well as extend the literature with
investigate whether the team composition variable of team familiarity might enable more
efficient communication and offset the coordination complexity that occurs in remote
communication.
6.2 Background
Teams are a fundamental work unit in today’s economy. They are particularly adept at
performing large, complex tasks that exceed the capacity of a single individual. (Salas et al.,
2008). Team success however, is more than just assembling the right people with the right skills.
Rather, team success is built on effective coordination of task work and teamwork activities
(McIntyre et al., 1995). Task work describes operational or technical skills of team members
necessary to perform task independently, without interaction or input from other members (Salas
et al., 2008). Teamwork processes refer to what team members do in order to attain their goal.
For example, teamwork occurs when members monitor each other’s performance, share
feedback and ideas with one another, check information with others, back each other up when
necessary, consider the team goals as more important than their own, and encourage positive
team attitudes (McIntyre et al., 1995). Team performance, therefore, is considered a complex,
multi-faceted process that emerges as team members manage and coordinate their task work and
teamwork processes (Salas et al., 2008).
When considering task work, the simpler or more routine the task, the easier it is to
identify and understand the different components of the task and how those components relate to
one another. However, as the number and relatedness of tasks increase, “task complexity”
necessarily increases as it becomes difficult for individuals to manage the different aspects of the
task and the relationships between task components (Espinosa, Slaughter, Kraut, & Herbsleb,
2007). As task complexity increases, it increases demands on the knowledge, skills, and abilities
of individuals to manage task contingencies as well as the proper task sequence. For example,
Wood (1986) described the complexity of a radio assembly task, as the actions performed at one
stage are contingent upon actions performed at other stages, with some actions occurring
simultaneously. As can be expected, when complex tasks are performed in a collaborative
fashion, the task actions of each individual also need to be coordinated, which then further
increases the level of complexity. While it seems that larger teams would be more suited for
114
increasingly complex tasks, as they have broader and deeper resources from which to draw, this
potentially increases the number of interdependencies that must be coordinated. This is
especially true if team members are geographically separated from one another (Espinosa et al.,
2007). In distributed teams, the challenges to effectively manage task work and teamwork
become even more salient when teams encounter difficulties communicating and coordinating
their efforts. Espinosa et al., 2007 refer to this as “team coordination complexity.” Collocated
and distributed teams alike encounter instances of coordination complexity, however, in
distributed teams, the lack of physical proximity, lack of shared work context, and the heavy
reliance on mediated communication (Hinds et al., 2003), add to the complexity and create
obstacles for team member communication and coordination of activities, which are vital for
successful performance (Driskell et al., 2003).
Espinosa et al. (2007) suggested that familiarity may help teams cope with complexity
more effectively. Familiarity has been defined as “the specific knowledge workers have of their
jobs, co-workers, and work environment” (Goodman & Leyden, 1991, p. 578), “knowledge
about one another’s skills, perspectives and interpersonal styles” (Gruenfeld et al., 1996, p. 2),
and “team members’ shared prior work experience” (Staats, 2011, p. 619). Although there are a
variety of definitions, researchers agree that high degrees of member familiarity should facilitate
job performance and minimize process losses (Goodman et al., 1991). These authors make a
distinction between familiarity and other team concepts, such as cohesiveness. While high
degrees of familiarity may increase team cohesion, they are two distinct concepts. Also,
familiarity is not the same as friendship; rather familiarity results from the knowledge an
individual has about team members and their work activities, rather than the degree to which
someone likes a team member (Goodman et al., 1991). An important parallel is drawn in the
team performance literature between familiarity and Tuckman’s stages of group development:
forming, storming, norming, and performing (Adams et al., 2005; Janssen, Erkens, Kirschner, &
Kanselaar, 2009), suggesting that when group members are familiar with one another, they will
spend less time in the early “forming” stage, will more easily establish group norms, will be
more able to handle conflict that occurs, and subsequently will reach the performing stage more
quickly.

115
Several studies have reported the benefits of team member familiarity on team
performance. For example, familiarity among team members has been associated with reduced
conflict regarding roles and responsibilities in the team (Espinosa et al., 2007), and Goodman et
al., (1991) found that a lack of familiarity with team member work habits increased coordination
problems, which is likely due to team members focusing efforts on both social acceptance and
task performance. However, members of familiar teams possess unique interpersonal knowledge
about other’s skills, values, and perspectives, not held by unfamiliar teams, which then facilitates
coordination and sharing of information between team members, reduces process loss, improves
recognition of expertise within the team, and may even lessen the anxiety experienced in group
interaction (Gruenfeld et al., 1997). In addition, ‘‘prior group experience should facilitate group
problem solving through the development of cognitive structures which allow group members to
understand the ways in which other members might be able to contribute to the task.’’ Littlepage
et al., (1997, pp 134). However, results also suggest that the benefit of knowing the location of
expertise within a team is limited to the degree that knowledge transfers across tasks, otherwise,
team members must hazard a guess based on prior experience with a team member and their
perception of expertise or level of knowledge (Littlepage et al., 1997; Espinosa et al., 2007).
Existing research supports the idea that interpersonal knowledge held by familiar team
members does influence team performance, such as increasing the safety of mining crews
(Goodman & Garber, 1988), facilitating team coordination (Goodman et al., 1991), and can help
team members anticipate each other’s actions. However, results of some studies have been
inconclusive, and some have even shown a negative influence including, lowering performance
when using formal interventions in problem solving teams and reduced decision making
(Okhuysen, 2001). Overall, researchers acknowledge that these inconclusive results may be due
to several factors: types of task studied, similarity or dissimilarity between tasks, and the type of
information (similar or diverse) being used to perform the task (Gruenfeld et al., 1997), and
indicate that more research should be done to resolve these effects (Espinosa et al., 2007).
Just as team member familiarity is thought to enable effective team interactions (Espinosa
et al., 2007), task familiarity is thought to benefit individual task performance. Work by
Goodman et al., (1991) suggests that teams are more effective when individual members possess
specific familiarity with the task and the work environment (i.e., tools, procedures, machinery),

116
which has a positive influence on team productivity. Although Goodman et al.’s (1991) research
was in the context of coal mining, other research has documented similar results in the medical
arena, problem-solving tasks, and in software development teams (Espinosa et al., 2007).
However, there is a caveat to the impact of task familiarity as it has been shown to benefit simple
tasks as opposed to more complex tasks (Argote Insko, Yovetich, & Shah, 1995). In the present
analysis, task familiarity was held constant, meaning none of the team members had any prior
experience with the ELICIT task. However, task familiarity is a related concept and may be a
productive area for more research.
Of particular focus in the current analysis, is the finding of Harrison et al., (2003) that
familiarity may prove to be more of an advantage for performance in geographically distributed
teams who encounter difficulty communicating and coordinating their efforts, and find it difficult
to manage task activities and teamwork. Further, as team familiarity increases, some researchers
argue that team communication efficiency should follow suit. This parallels the idea of relational
development in teams. As relationships develop, communication efficiency should result (Adams
et al., 2005), and may in turn reduce the amount of time necessary for familiar teams to make
decisions. (Gruenfeld et al., 1996). And finally, as mentioned previously, Neubauer et al.,
(2017) investigated the impact of team member familiarity on stress resilience in collocated
teams, and found that familiar members were better able to regulate their emotions during a
stressful task and exhibited more positive facial expressions, and insightful speech than
unfamiliar members. Although Neubauer et al., (2017) used face-to-face teams, their results
along with others, support the benefits of team member familiarity for task performance.
Based on the discussion of the benefits of team familiarity in team performance, and the
proposition that team familiarity may help teams as they encounter coordination complexity, we
anticipate that member familiarity will benefit from distributed team communication when team
members face the coordination complexity associated with distributed team communication time
pressure, and delays. A secondary goal of this work was to help partially fill the gap with respect
to the influence of team familiarity on team member communication under the stress of
communication delay and time pressure, specifically, whether distributed teams with familiar
members communicate more efficiently than teams with unfamiliar members in situations of
coordination complexity, time pressure, and delays. In addition, few studies have investigated

117
the influence of team member familiarity for distributed teams whose communication is
mediated by technology (Tiferes & Bisantz, 2018). Therefore the role of technology in
communication among familiar and unfamiliar teams was analyzed.
6.2.1 Post-hoc Analysis Questions
1. Do distributed teams with familiar members communicate more efficiently than teams with unfamiliar members when coordination complexity is high, than when it is low?
2. Do richer communication technologies such as an audiovisual channel make a difference in communication efficiency in teams that collaborate remotely with high coordination complexity?
6.2.2 Hypotheses
1. Familiar teams, who have an established connection with one another, will communicate more efficiently than unfamiliar teams when coordination complexity is high compared to conditions when coordination complexity is low.
2. Unfamiliar teams will communicate more efficiently when using audiovisual technology than audio technology alone when coordination complexity is high than when it is low.
6.3 Methods
6.3.1 Data set
For this analysis, a subset of data collected in the distributed communication study described in
previous chapters was used. As part of that study, distributed dyads performed a problem
solving task called the Experimental Laboratory for Investigating Collaboration, Information
Sharing, and Trust (ELICIT) in which they verbally shared and discussed pieces of information
related to a fictitious terror plot using audio and audiovisual technology. Teams were required to
solve the task in 20 minutes, which created a sense of urgency in the teams, but still allowed
them enough time to solve the task. All communication between team members for both the
audio and audiovisual technology was delayed at 0 ms, 800 ms, and 1600 ms. The next section
provides definitions for the terminology and/or variables used in this analysis.

118
6.3.2 Definitions
6.3.2.1 Communication efficiency
Communication efficiency was selected based on prior work suggesting a link with team
familiarity (Adams et al., 2005). It was anticipated that team members who are familiar with one
another will have achieved a level of shared knowledge and comfort, and as a result, will be
more efficient in their communication than teams where members are unfamiliar with each other.
A rationale was that if familiar teams communicate more efficiently, it may be an indicator that,
where possible, organizations should strive to have teams composed of familiar members when
coordination complexity is high.
For the analysis, communication is defined as, “the process by which information is clearly and
accurately exchanged between two or more team members in the prescribed manner and with
proper terminology and the ability to clarify and acknowledge the receipt of information” (Salas
et al., 2000, p. 343). However, the effort to exchange information clearly and accurately, does
not always guarantee that the goal of understanding is reached, suggesting that communication
has different degrees of effectiveness and efficiency (Wiedemann & Kittler, 2006).
Communication is considered effective if it achieves its intended purpose or minimizes
misunderstandings (i.e., congruence between intended and perceived meaning). Whereas
complete congruence suggests highly effective communication, divergences between intended
and perceived meaning indicates that interference occurred (Wiedemann et al., 2006). However,
even though a verbal message may reach complete congruence, it may not be efficient.
Efficiency in communication “refers to the extent to which skills are used to achieve some
outcome with a minimum of effort, time, complexity, and investment of resources” (Spitzberg &
Cupach, 2002). So, teams that achieved effective understanding (i.e. accuracy on the ELICIT
task), in the least amount of time were considered more efficient. A more general way to
conceptualize efficiency is the ratio of useful output to total input. So, we calculated
communication efficiency as
CE = 𝑇𝑇𝑇𝑇𝑇𝑇𝑇𝑇 𝐴𝐴𝐴𝐴𝐴𝐴𝐴𝐴𝐴𝐴𝑇𝑇𝐴𝐴𝐴𝐴
𝑇𝑇𝑇𝑇𝑇𝑇𝑇𝑇 𝐶𝐶𝐶𝐶𝐶𝐶𝐶𝐶𝐶𝐶𝐶𝐶𝐶𝐶𝐶𝐶𝐶𝐶𝐶𝐶 𝑇𝑇𝐶𝐶𝐶𝐶𝐶𝐶
with task accuracy as our useful output, and task completion time as our total input, as it captures
all of the team member communication used to solve the task in a given period of time.

119
6.3.2.2 Coordination Complexity
A definition of coordination complexity was developed based on the discussion above and the
aspects of the task performed during the dyadic communication experiment. The ELICIT task
was highly interdependent as team members received different information, and were dependent
upon one another to share and discuss information to solve the task. So, team members were
responsible to manage the information they received as well as communicate the information to
their partner, while both partners coordinated their efforts toward a task solution. ELICIT also
required a substantial amount of information sharing and team communication between team
members, which was made more difficult due to team members being distributed. All of the
collaboration was limited to 20 minutes, adding an aspect of time pressure. In addition, all of
their communication was mediated by technology, and communication was subjected to delays
making it even more difficult to communicate and coordinate their efforts. As a result, two
categories of coordination complexity were created: low complexity corresponded to
communications subject to a 0 ms delay, and high complexity corresponded to delays of 800 and
1600 ms.
6.3.2.3 Team Familiarity
To assess team member familiarity, each participant self-reported their level of familiarity with
their partner in the context of current and previous work teams, work projects, or social
interactions at or outside of work, using a four point scale developed by (Gruenfeld et al. 1996)
where 1 = I do not know this team member, 2 = This team member is an acquaintance of mine, 3
= I know this team member well, and, 4 = I know this team member very well. Members who
rated their partner as a 1 or 2 were categorized as having low familiarity or being “unfamiliar”
with their teammate. Those rating their partner as 3 or 4 were considered to have high
familiarity and were categorized as “familiar”. If member ratings for partners in the same team
conflicted, the scores were averaged and placed in the appropriate category. For example, if one
team member provided a rating of 2 and the other a 3, these numbers were summed and averaged
to a 2.5 and placed in the “familiar” category. It is worth noting that of the 30 teams
participating only 3 teams had conflicting ratings of familiarity with their partner. In all three
cases, one partner rated familiarity as a “2” and the other a “3”. Therefore, ratings for these

120
partners were averaged and since the result was 2.5 for each team, they were placed in the
“familiar” category. Partners remained the same for the duration of the experiment and were
only asked to provide their rating of familiarity prior to the start of the experiment to indicate
their level of pre-task familiarity.
6.4 Data Analysis
Data from 30 dyads was collected during the original experiment. Of those, 20 dyads
were considered Unfamiliar and 10 were considered Familiar. Even though the present analysis
was focused on the communication efficiency of teams, as described earlier, communication
effectiveness is also important, therefore, only teams that scored at least 90% accuracy on the
ELICIT task in each experimental condition were included in the analysis. A breakdown of data
included in the analysis is provided in Table 10.
Table 10. Data included in the Analysis
Condition Unfamiliar Teams
Familiar Teams
Total
Low complexity, Audio Technology 18 7 25
Low complexity, Audiovisual Technology 20 7 27
High complexity, Audio Technology 20 7 27
High complexity, Audiovisual Technology 20 10 30
Communication efficiency was analyzed with a linear, mixed-model using the mixed
procedure in SPSS 22 (SPSS, Inc; Chicago, IL). A 2 (Technology) x 2 (Coordination
Complexity) x 2 (Familiarity) mixed linear analysis was conducted with Technology,
Complexity and Familiarity as fixed effects. A random intercept for team was included to
account for the within-subjects nature of the data using a variance components (VC)
variance/covariance structure and restricted maximum likelihood (REML) estimation. Residual
variance was accounted for using a diagonal variance-covariance structure. To test for order
effects, in all analyses, treatment condition order was included as a fixed effect and was removed
from the analysis if not significant. P-values < .05 were considered significant. Significant main
effects were further analyzed using post-hoc comparisons with a Sidak-Bonferroni correction.

121
Simple effects tests were conducted for significant interactions followed by pairwise
comparisons with a Sidak-Bonferroni correction. Data were checked for outliers, and residuals
were inspected for normality by assessing symmetry in histograms and by visually inspecting Q-
Q plots. Constant variance was verified by plotting the residuals against the fitted data. No
outliers were identified.
6.5 Results
Results of the analysis of the Communication Efficiency data showed that the interaction
of Familiarity, Delay, and Technology significantly affected Communication Efficiency, F(1,
111.24) = 5.12, p = .026 (Figure 31). Simple effects tests for Familiarity did not show
significance. However, there was a significant simple effect of Technology, but only for the low
complexity/stress condition for Unfamiliar teams, F(1, 102.63 = 6.86), p = .010. This indicates
that teams with Unfamiliar members were more efficient when using Audiovisual Technology
than Audio-alone when coordination complexity was low (mean difference = 1.65, p = .010).
Further, a simple effect of Coordination Complexity for Unfamiliar teams using Audiovisual
Technology F(1, 104.51) = 5.72, p = .019 was found. Pairwise comparisons tests showed that
Unfamiliar Teams communicated more efficiently using Audiovisual Technology when
coordination complexity was low, compared to when coordination complexity was high (mean
difference = 1.23, p = .019). No significant interactions of Familiarity and Coordination
Complexity (p = .824), Familiarity and Technology (p = .519), or Coordination Complexity and
Technology (p = .757) were found, and there were no significant main effects of Familiarity (p =
.925), Coordination Complexity (p = .135), or Technology (p = .090) on Communication
Efficiency.
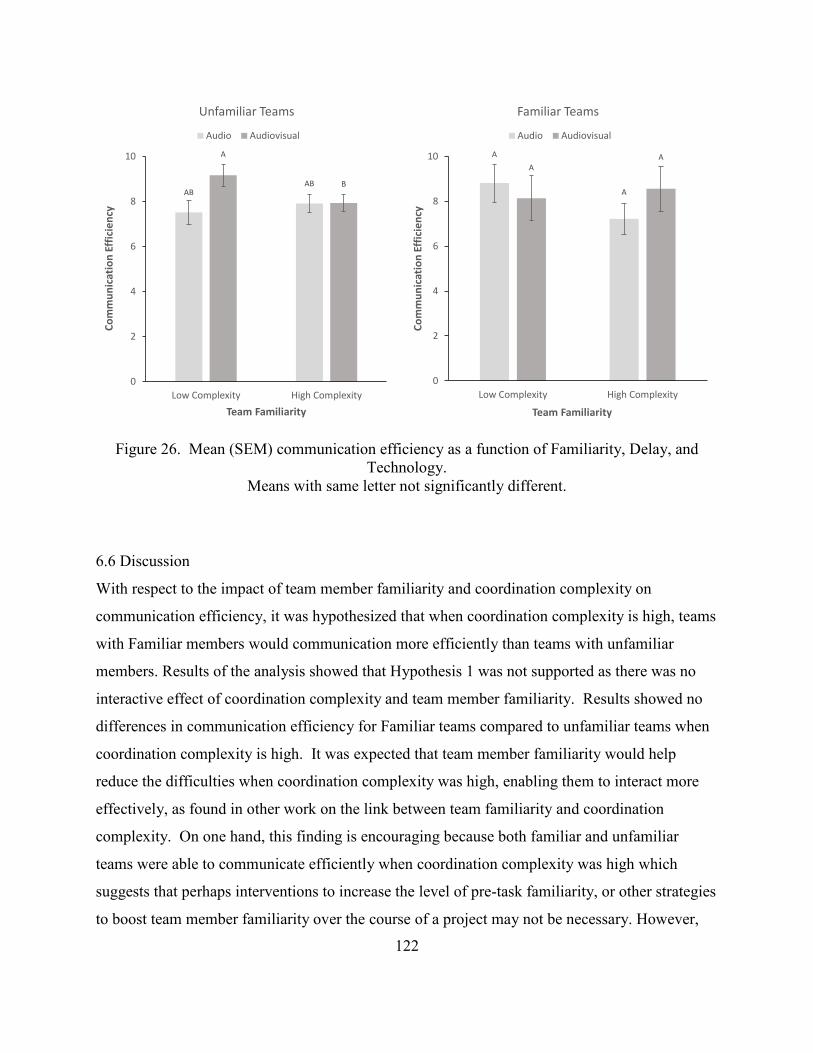
122
Figure 26. Mean (SEM) communication efficiency as a function of Familiarity, Delay, and
Technology. Means with same letter not significantly different.
6.6 Discussion
With respect to the impact of team member familiarity and coordination complexity on
communication efficiency, it was hypothesized that when coordination complexity is high, teams
with Familiar members would communication more efficiently than teams with unfamiliar
members. Results of the analysis showed that Hypothesis 1 was not supported as there was no
interactive effect of coordination complexity and team member familiarity. Results showed no
differences in communication efficiency for Familiar teams compared to unfamiliar teams when
coordination complexity is high. It was expected that team member familiarity would help
reduce the difficulties when coordination complexity was high, enabling them to interact more
effectively, as found in other work on the link between team familiarity and coordination
complexity. On one hand, this finding is encouraging because both familiar and unfamiliar
teams were able to communicate efficiently when coordination complexity was high which
suggests that perhaps interventions to increase the level of pre-task familiarity, or other strategies
to boost team member familiarity over the course of a project may not be necessary. However,
ABAB
A
B
0
2
4
6
8
10
Low Complexity High Complexity
Com
mun
icat
ion
Effic
ienc
y
Team Familiarity
Unfamiliar Teams
Audio Audiovisual
A
A
AA
0
2
4
6
8
10
Low Complexity High Complexity
Com
mun
icat
ion
Effic
ienc
yTeam Familiarity
Familiar Teams
Audio Audiovisual

123
there are a couple of reasons why, in the present analysis, team member familiarity did not affect
communication efficiency when complexity was high.
First, perhaps the level of coordination complexity was not high enough that familiarity
actually benefitted interactions. In some respects there was a certain level of coordination
complexity in the dyad interactions because they were distributed from one another, only used
technology to communicate, and their communication was delayed. However, the ELICIT task
may not have provided a high enough level of complexity so teams would benefit from
familiarity. For example, when considering accuracy on the ELICIT task, approximately 80% of
teams scored at least 90% accuracy on the ELICIT task, which suggests that ELICIT may not
have been difficult enough to increase team coordination complexity to a level where teams
would benefit from being familiar with one another, and may also suggest a ceiling effect was
present. ELICIT was selected as the experimental task because it did not require a lot of time for
participants to become familiar with how to perform the task. However, it seems a more
complex task or performing ELICIT concurrently with another task may have increased the level
of coordination complexity. Further, although the ELICIT task was compelling and urgent, all of
the information was scripted and the information pertaining to the terror plot remained the same.
In other words, there were no updates to the information and no conflicting information that
required team members to sort through. Goodman et al., 1997 found that familiar members, who
have a level of interpersonal knowledge, are more likely to offer alternative perspectives than
members of unfamiliar teams, who are highly concerned about social acceptance by group
members. So, with the ELICIT task, there may have been a stronger effect of familiarity and
coordination complexity with conflicting information, as Unfamiliar teams would have been less
likely to share pieces of conflicting information for fear of being rejected by their team member.
Also, Espinosa et al., 2007, stated that smaller teams may not benefit as much from team
member familiarity as larger teams, because as team size increases, so does team coordination
among all of the members. This may explain the findings in the present study. Even though
distributed team coordination is considered to be difficult for reasons described earlier, the level
of coordination did not reach a high enough degree of complexity with just two team members
communicating, but may have been different as team size increases. Espinosa et al. (2007) stated
that small teams may not need as much familiarity because it can more easily be built in teams of
124
two or three. On the other hand, larger teams will have more difficulty acquiring knowledge,
making team member familiarity more important.
With respect to the communication efficiency measure, by limiting the data used to
compute the communication efficiency measure to teams that only scored 90% or better on the
ELICIT task, variability was reduced, which may also have affected the outcome. Additionally,
the measure of team member familiarity was effective in that it allowed us to establish categories
of Unfamiliar and Familiar team members, however, providing a secondary question with respect
to “how long” team members knew each other, or questions asking how frequently they
interacted in the various contexts would have given us a better idea of their relationship in social
settings, work settings etc. In fact, this is one of the issues described in Tiferes et al. (2018), as
they recommended that researchers consider reporting both familiarity and experience levels of
teams, regardless of correlation.
In Hypothesis 2, it was expected that unfamiliar teams would communicate more
efficiently when using Audiovisual Technology, than Audio-only when coordination complexity
was high, compared to low complexity conditions. Hypothesis 2 was not supported. In fact, the
results showed the opposite of what was expected: unfamiliar teams were roughly 13.4% more
efficient with audiovisual technology than audio, but only in the low complexity condition.
When coordination complexity was high, unfamiliar teams were just as efficient with
Audiovisual Technology as Audio alone. This finding is consistent with literature on the
beneficial effect of a video channel for diverse teams that do not speak the same native language
(Veinott, et al., 1997). Although in their study, Veinott et al. (1997), were interested in ethnic
diversity, and did not specifically address coordination complexity, it is likely that unfamiliar
teams in the present analysis would have a similar experience, as they lacked common ground.
An interesting finding was that it appears that when coordination complexity was high
(Figure 1), Familiar teams were more efficient with Audiovisual compared to Audio-only.
Although not statistically significant, this finding does suggest that technology may have played
a beneficial role communicating with a high level of coordination complexity. One would think
that for the Familiar teams, video would have less of an effect on communication efficiency due
to the fact that the flow of communication in familiar teams is more coordinated, (Harrison et al.,
2003). Overall, this finding is interesting and may help extend the literature with respect to

125
where audiovisual technology makes the most impact: for low complexity, unfamiliar teams
communicate more efficiently with audiovisual technology, however, when coordination
complexity is high, familiar teams benefit from video. Others have found a similar benefit of
video for familiar teams, as video has been shown to enable familiar teams to take advantage of
momentum and are less susceptible to impression formation than teams that were newly formed
(Thompson et al., 2006).
We understand from the literature, that both task and team familiarity associate positively
with team performance (Harrison et al., 2003). Although none of the participants had prior
experience with the ELICIT task, their level of task familiarity increased during each session as
they performed the task together, and both Familiar and Unfamiliar teams were given time to
further familiarity with their partner. Harrison et al. (2003), has shown a threshold in which team
member familiarity affects performance after which it ceases to be important, so it is also
possible that Unfamiliar teams were able to reach a level of familiarity with one another that
supported their interactions, even with increased complexity. In effect, being able to assess the
level of familiarity among team members initially, and then tracking its development over time
would have provided more evidence for why this result occurred.
Overall, it is unclear why the effects were the opposite of what was anticipated. It is
interesting to see that in the high coordination complexity condition, communication efficiency
remained the same regardless of the type of technology being used. As mentioned earlier, had
there been conflicting information in the ELICIT task, there may have been a larger difference
for Unfamiliar teams across the board. Or if information about the terror plot was the same from
both team members as opposed to unique in the present analysis. This may have changed the
dynamics of Unfamiliar and Familiar team interaction (Gruenfeld et al., 1996), with unfamiliar
teams being resistant to mention multiple or competing perspectives. Clearly more research is
required in order to better understand how team familiarity can benefit teams when they
encounter coordination complexity.
6.7 Limitations and Future Work
Data used in the analysis was from dyads. As described by Espinosa et al., (2007), larger
teams may experience more coordination complexity, and therefore may benefit more from

126
having members who are familiar with each other. Future work could explore this idea, within
the limits prescribed by ELICIT.
Further, the sample size included in the analysis was unbalanced. There is a desire to
take a closer look at Familiarity with a more equivalent data set in future work.
6.8 Conclusions
Although results of the analysis were not consistent with our hypotheses, there were some
interesting findings. Further work is needed to see how the results presented here would have
translated to other tasks and other contexts. Since the literature has provided some evidence of
the benefits of having members who are familiar with one another, it is important to realize that
using familiar team members is not a cure-all for the challenges faced by distributed teams. In
addition, it is not always desirable or practical to compose teams with a history working together.
However, where possible, organizations can, and perhaps, should continue to utilize experienced
teams and explore some of additional interactions of team familiarity and diverse team
composition. From an organizational perspective, one must weigh the potential costs and
benefits of composing teams of complete strangers and occasionally bringing them together in
the same physical space to promote familiarity, rather than using people who already know each
other. Stability is good, but not in every situation (Harrison et al., 2003).
Finally, the question remains as to whether organizations should spend valuable resources
to boost familiarity among team members, such as through face-to-face meetings prior to project
inception, composing teams of members who have worked together in the past, and creating
opportunities for team members to travel in order to establish and maintain connections with
other team members (Espinosa et al., 2007).

127
References
Adler, N.J. (1991). International Dimensions of Organizational Behavior. Boston, MA: PWS-KENT Publishing Company. pp. 63-91.
Adler, N.J. (2003). ’Communication across Cultural Barriers’, in J. Bolten and C. Ehrhardt, (eds.), Interkulturelle Kommunikation: Texte und Übungen zum interkulturellen Handeln. Sternenfels: Wissenschaft & Praxis.
Anders, A. (2016). Team communication platforms and emergent social collaboration practices. International Journal of Business Communication, 52 (2), 224 – 261.
Anderson, A., O'Malley, C; Doherty-Sneddon, G., Langton, S., Newlands, A., Mullin, J., Fleming, A.M., van der Velden, J. (1997). The impact of VMC on collaborative problem solving: An analysis of task performance, communicative process, and user satisfaction. In K.E. Finn, A. Sellen, & S. Wilbur (Eds.). Video-Mediated Communication. Mahwah, NJ: Lawrence Erlbaum Associates.
Andre, T. S., Kleiner, B.M., & Williges, R.C. (1998). A conceptual model for understanding computer-augmented distributed team communication and decision-making. Paper presented at the NATO Research and Technology Organization Human Factors and Medicine Proceedings on Collaborative Crew Performance in Complex Operational Systems, Edinburgh, UK.
Andres, H.P. (2002). A comparison of face-to-face and virtual software development teams. Team Performance Management: An International Journal, 8(1/2), 39-48.
Argote, L., C. A. Insko, N. Yovetich, A. A. Romero. 1995. Group learning curves: The effects of turnover and task complexity on group performance. Journal of Applied Social Psychology 25(6) 512–529.
Armstead, A. G. (2007). Effects of long audio communication delays on team performance. Unpublished Master Thesis. University of Connecticut, Storrs.
Atkins, A. (2006). Mixed media richness and computer-mediated communications. Unpublished Master thesis. Virginia Polytechnic Institute and State University, Blacksburg.
Baker, D. P., Day, R., & Salas, E. (2006). Teamwork as an essential component of high- reliability organizations. Health Services Research, 41(4).
Balliet, D., Li, N. P., Macfarlan, S. J., & Van Vugt, M. (2011). Sex differences in cooperation: A meta-analytic review of social dilemmas. Psychological bulletin, 137(6), 881.
Baltes, B. B., Dickson, M. W., Sherman, M. P., Bauer, C. C., & LaGanke, J. (2002). Computer-mediated communication and group decision making: A meta-analysis. Organizational Behavior and Human Decision Processes, 87(1), 156-179.
Baron, N., & Campbell, E. M. (2010). Talking takes too long: Gender and cultural patterns in mobile telephony. In conference of Association of Internet Researchers, Göteborg, Sweden. Retrieved from: https://www. american. edu/cas/lfs/faculty-docs/upload/Talking-Takes-Too-Long. pdf.
Bell, B. S., & Kozlowski, S.W.J. (2002). A typology of virtual teams: Implications for effective
128
leadership. Group & Organization Management, 27(1), 14-49. Bennett, T. M. (2009). Development and performance of distributed teams: examining
differences between asynchronous and synchronous communication in planning task execution. Unpublished doctoral dissertation, Capella University.
Berlocher, G. (2009). Minimizing latency in satellite networks. Via Satellite: https://www.satellitetoday.com/telecom/2009/09/01/minimizing-latency-in-satellite-networks/.
“Best Phones of 2016.” CNET, https://www.cnet.com/pictures/best-phones-of-2016/ Bowden, M. (1999). Black hawk down: a story of modern war. New York, NY: Grove Press. Bowers, C. A., Jentsch, F., Salas, E., & Braun, C.C. (1998). Analyzing communication
sequences for team training needs assessment. Human Factors, 40, 672-679. Bowers, C. A., Pharmer, J., & Salas, E. (2000). When member homogeneity is needed in work
teams: A meta-analysis. Small Group Research, 31, 305-327 Bowman, E.K., & Zimmerman, R. (2010). Measuring Human Performance in a Mobile Ad Hoc
Networks (MANETs). ITEA Journal, 31, 217–231. Boyle, E.A., Anderson, A.H., & Newlands, A. (1994). The effects of visibility on dialogue and
performance in a cooperative problem solving task. Language and Speech, 37 (1), 1 – 20.
Brady, P.T. Effects of transmission delay on conversational behavior on echo-free telephone circuits. The Bell System Technical Journal, January 1971.
Caldwell, B. S., & Everhart, N.C. (1998). Information flow and development of coordination in distributed supervisory control teams. International Journal of Human-Computer Interaction, 10(1), 51-70.
Caldwell, B.S., & Wang., E. (2009). Delays and user performance in human-computer network interaction tasks. Human Factors, 51 (6), 813-830.
Cannon-Bowers, J. A., Tannenbaum, S.I., Salas, E., & Volpe, C.E. (1995). Defining team competencies and establishing team training requirements. In R. Guzzo & E. Salas (Eds.), Team Effectiveness and Decision Making in Organizations. San Francisco, CA: Jossey-Bass.
Cannon-Bowers, J. A., & Salas, E. (1998). Individual and team decision making under stress: theoretical underpinnings. In J. A. Cannon-Bowers & E. Salas (Eds.), Making Decisions Under Stress: Implications for Individual and Team Training. (pp. 17-38). Washington, DC: APA Press.
Cano, A. (1997). Effects of technological support on decision making performance of distributed groups. Unpublished Master thesis. Virginia Polytechnic Institute and State University, Blacksburg.
Cardosi, K. & Lennertz, T. (2017). Human factors considerations for the integration of unmanned aerial vehicles in the national airspace system: An analysis of reports submitted to the aviation safety reporting system (ASRS). Final report DOT/FAA/TC‐

129
17/25. CASA Systems (2018). Things you can do today to build a “5G ready network”: Building the
mobile edge. CASA Systems, https://www.casa-systems.com/assets/Casa-Opinion-Paper-5G-Ready-Network.pdf
“CEO Perspective: Top 3 Huddle Room Video Conferencing Solutions from Enterprise Connect 2016.” Applied Global, https://www.appliedglobal.com/top-3-huddle-room-vc-solutions-enterprise-connect-2016/.
Cohen, S.G. & Gibson, C.B. (2003). In the Beginning: Introduction and Framework. In C. B. Gibson, & S.G. Cohen (Eds.), Virtual teams that work: Creating conditions for virtual team effectiveness (pp. 1-13). San Francisco, CA: Jossey-Bass.
Cohen, K. M. (1982). Speaker interaction: Video teleconferences versus face-to-face meetings. Proceedings of Teleconferencing and Electronic Communications, 189- 199. Madison: University of Wisconsin.
Comstock, J.R., Ghatas, R.W., Consiglio, M.C., Chamberlain, J.P., Hoffler, K.D. (2018). UAS air traffic controller acceptability study 2: Effects of communications delays and winds in simulation. Final report: NASA/TM–2015-218989.
Conover, W., & Iman, R. (1981). Rank Transformations as a Bridge Between Parametric and Nonparametric Statistics. The American Statistician, 35(3), 124-129.
Cooke, N. J., & Gorman, J.C., Pedersen, M., & Bell, B. (2007). Distributed mission environments: Effects of geographic distribution on team cognition, process, and performance. In S. Fiore & E. Salas (Eds.), Towards a science of distributed learning and training. Washington, DC: American Psychological Association.
Cramton, C. D. & Orvis, K. L. (2003). Overcoming barriers to information sharing in virtual teams. In C. B. Gibson & S. G. Cohen (Ed.), Virtual teams that work: Creating conditions for virtual team effectiveness (pp. 214-230). San Francisco: Jossey-Bass.
Cuevas, H. M., Fiore, S.M., Salas, E., & Bowers, C.A. (2004). Virtual teams as sociotechnical systems. In S. H. Godar & S. P. Ferris (Eds.), Virtual and Collaborative Teams: Process, Technologies, and Practice. (pp. 1-19). Hershey, PA: Idea Group Publishing.
Daft, R. L., & Lengel, R. H. (1984). Information richness: A new approach to managerial behavior and organization design. Research in Organizational Behavior, 6, 191-233.
Daft, R.L., & Lengel, R.H. (1986). Organizational information requirements, media richness and structural design. Management Science, 32(5), 554-571.
Daft, R.L., Lengel, R.H., & Trevino, L.K. (1987). Message equivocality, media selection, and manager performance: Implications for information systems. MIS Quarterly, 11(3), 355-366.
Delaney, D., Ward, T., & McLoone, S. (2003) On network latency in distributed interactive applications. In: National University of Ireland, Maynooth Postgraduate Colloquium, NUI Maynooth, Co. Kildare, Ireland.

130
Dennis, A.R. & Kinney, S.T. (1998). Testing media richness theory in the new media: The effects of cues, feedback, and task equivocality. Information Systems Research, 9(3), 256-274.
Dennis, A. R. (1996). Information exchange and use in small group decision making. Small Group Research, 27, 532-550.
Dickinson, T. L., & McIntyre, R.M. (1997). A conceptual framework for teamwork measurement. Mahwah, NJ: Erlbaum.
Dirks, K.T., & Ferrin, D. L. (2001). The Role of Trust in Organizational Settings. Organization Science. 12, (4), 450-467.
Dove-Steinkamp, M. L. (2012). Effects of Practice with Imposed Communication Delay on the Coordination and Effectiveness of Distributed Teams. Unpublished Master Thesis, University of Connecticut.
Driskell, J. E., Radtke, P.H., & Salas, E. (2003). Virtual teams: Effects of technological mediation on team performance. Group Dynamics: Theory, Research, and Practice, 7(4), 297-323.
Driskell, J. E., & Salas, E. (2006). Groupware, Group Dynamics, and Team Performance. In C. Bowers, E. Salas, & F. Jentsch (Ed.), Creating High-Tech Teams. Washington, DC: American Psychological Association.
Dul, J., Bruder, R., Buckle, P., Carayon, P., Falzon, P., Marras, W.S., Wilson, J.R., & van der Doelen, B. (2012). A strategy for human factors/ergonomics: developing the discipline and profession. Ergonomics, 55(1), 1-27.
Espinosa, J.A., Slaughter, S.A., Kraut, R.E. & Herbsleb, J.D. (2007). Familiarity, Complexity, and Team Performance. Organization Science 18(4), pp. 613–630.
Evans, A. M., & Revelle, W. R. (2008). Survey and behavioral measurements of interpersonal trust. Journal of Research in Personality, 42(6), 1585-1593.
Fallon, C. K., Bustamante, E. A., Ely, K. M., Bliss, J. P. (2005). Improving user trust with a likelihood alarm display. In Proceedings of the 11th International Conference on Human-Computer Interaction. Las Vegas, NV.
Farncombe, D. (1997). Investigations into the operational effects of the VDL Mode 3 voice throughput delay (AMCP WG D/7 WP 53). Madrid, Spain: Aeronautical Mobile Communications Panel Working Group D.
Feng, J., Lazar, J. and Preece, J. (2004) Empathy and Online Interpersonal Trust: A Fragile Relationship. Behavior & Information Technology, 23, 97-106.
Ferster, W. (2017). Low-latency satellite systems grow on U.S. military. The Government Satellite Report. https://ses-gs.com/govsat/defense-intelligence/low-latency-satellite-systems-grow-u-s-military/.
Fiore, S.M, Salas, E., Cuevas, H.M, & Bowers, C. (2003). Distributed coordination space: toward a theory of distributed team process and performance. Theoretical Issues in Ergonomic Science, 4(3-4), 340-364.

131
Fischer, U., Mosier, K., & Orasanu, J. (2013). The impact of transmission delays on Mission Control – Space Crew communication. In Proceedings of the Human Factors and Ergonomics Society 57th Annual Meeting (pp. 1372-1376). Santa Monica, CA: HFES.
Fischer, U. & Mosier, K. (2016). Protocols for asynchronous communication in space operations: communication analyses and experimental studies. NASA Grant NNX12AR19G Final Report.
Fischer, U., Mosier, K., & Orasanu, J. (2015). Communication protocols to support collaboration in distributed teams under asynchronous conditions. In Proceedings of the Human Factors and Ergonomics Society 59th Annual Meeting. Santa Monica, CA: HFES.
Foushee, H.C. (1984). Dyads and triads at 35,000 feet: Factors affecting group processes and aircrew performance. American Psychologist, 39 (8), 885 – 893.
Freedberg, S.J. (2017). Achilles heel of army air & missile defense: The network. Breaking Defense: https://breakingdefense.com/2017/02/achilles-heel-of-army-air-missile-defense-the-network/.
Frowein, H.W., Smoorenburg, G.F., Pyters, L., & Schinkel, D. (1991). Improved speech recognition through videotelephony: Experiments with the hard of hearing. IEEE Journal on Selected Areas in Communications, 9 (4), 611 – 616.
Gale, S. (1989). Adding audio and video to an office environment. Hewlett-Packard Laboratories Memo HPL-ISC-TM-89-114.
Garson, S. (2017). The four metrics for VoIP and wide area networking. https://www.sd-wan-experts.com/blog/important-facts-pertaining-to-voip-and-wide-area-networking/.
Gergle, D.R (2006). The value of shared visual information for task-oriented collaboration. Unpublished Thesis, Carnegie Mellon University.
Gibson, C. B., & Manuel, J.A. (2003). Building trust: Effective multicultural communication processes in virtual teams. In C. G. S. G. Cohen (Ed.), Virtual teams that work: creating conditions for virtual team effectiveness (pp. 59-86). San Francisco, CA: Jossey-Bass.
Gillespie, B.M., Chaboyer, W., Longbottom, P., & Wallis, M. (2010). The impact of organizational and individual factors on team communication in surgery: A qualitative study. International Journal of Nursing Studies, 47, 732-741.
Gilson, L.L., Maynard, M.T., Young, N.C.J., Vartiainen, M., & Hakonen, M. (2014). Virtual teams research: 10 years, 10 themes, and 10 opportunities. Journal of Management, 41 (5), 1313-1337.
Goodman, P. S. & Garber, S. (1988). Absenteeism and accidents in a dangerous environment: Empirical analysis of underground coal mines. Journal of Applied Psychology, 73(1) 81–86.
Goodman, P. S., & Leyden, D. P. (1991). Familiarity and group productivity. Journal of Applied Psychology, 76(4), 578.

132
Gorman, J.C., Cooke, N.J., & Salas, E. (2010). Preface to the special issue on collaboration, coordination, and adaptation in complex sociotechnical settings. Human Factors, 52(2), 143-146.
Gruenfeld, D. H., Mannix, E. A., Williams, K. Y., & Neale, M. A. (1996). Group composition and decision making: How member familiarity and information distribution affect process and performance. Organizational behavior and human decision processes, 67(1), 1-15.
Grugle, N., & Kleiner (2007). Effects of chemical protective equipment on team process performance in small unit rescue operations. Applied Ergonomics, (38), 591-600
Gump, B. B., & Kulik, J. A. (1997). Stress, affiliation, and emotional contagion. Journal of Personality and Social Psychology, 72(2), 305-319.
Gunawardena, C. (1995). Social presence theory and implications for interaction and collaborative learning in computer conferencing. International Journal of Educational Telecommunications, 1(2-3), 147 – 166.
Guthrie, J. W., Rosen, M.A., Salas, E., Nelson, W.T., & Bolia, R.S. (2007). The effects of collaborative technologies on individual and team performance in network centric warfare (NCW) environment: U.S. Air Force Research Laboratory.
Gutwin, C. (2001). The effects of network delays on group work in real-time groupware. Paper presented at the Proceedings of the seventh annual conference on computer supported collaborative work, Bonn, Germany.
Gutwin, C., Benford, S., Dyck, J., Fraser, M., Vaghi, I., and Greenhalgh, C. (2004). Revealing delay in collaborative environments. In Proceedings of ACM Conference on Computer Human Interaction (CHI 2004), 503-510. NY: ACM Press.
Guzzo, R.A., & Dickson, M.W. (1996). Teams in Organizations: Recent research on performance and effectiveness. Annual Review of Psychology, 47, 307-338.
Hammond, J., Koubek, R.J., & Harvey, C.M. (2001). Distributed collaboration for engineering design: a review and reappraisal. Human Factors and Ergonomics in Manufacturing, 11(1), 35-52.
Hammond, Harvey, Koubek, Compton, & Darisipudi (2005). Distributed Collaborative Design Teams: Media Effects on Design Processes. International Journal of Human Computer Interaction, 18(2), 145-165.
Handy, C. (1995). Trust and the virtual organization. Harvard Business Review, 73(3), 40-50. Harrison, D.A., Mohammed, S., McGrath, J.E., Florey, A.T., & Vanderstoep, S.W. (2003). Time
matters in team performance: effects of member familiarity, entrainment, and task discontinuity on speed and quality. Personnel Psychology, 56, 633-669.
Hart, S.G. & Staveland, L.E. (1988). Development of NASA-TLX (Task Load Index): Results of empirical and theoretical research. In P.A. Hancock & N. Meshkati (Eds.), Human Mental Workload (pp 139-183), Amsterdam: Elsevier.
Hendrick, H. W. (2002). An overview of macroergonomics. In H.W. Hendrick & B. M. Kleiner

133
(Eds.), Macroergonomics Theory, Methods, & Applications. Mahwah, NJ: Lawrence Erlbaum.
Hendrick, H. W. (2001). Sociotechnical systems theory: The sociotechnical systems model of work systems. In W. Karwowski (Ed.), International Encyclopedia of Ergonomics and Human Factors (Vol. 3, Second edition). Boca Raton, FL: Taylor & Francis.
Hendrick, H.W. (2007).Macroergonomics: The analysis and design of work systems. In D. A. Boehm-Davis (Ed.), Reviews of Human Factors and Ergonomics, 3, 44–78. Santa Monica, CA: Human Factors and Ergonomics Society.
Hendrick, H.W., & Kleiner, B.M. (2001). Macroergonomics: An introduction to work system design. Santa Monica, CA: Human Factors and Ergonomics Society.
Herring, S. C. (2010). Who's got the floor in computer-mediated conversation? Edelsky's gender patterns revisited. Language at Internet, 7(8).
Hinds, P. J. & Bailey, D. (2003). Out of sight, out of sync: understanding conflict in distributed teams. Organization Science, 14(6), 615-632.
Hinds, P. J. & Weisband, S.P. (2003). Knowledge sharing and shared understanding in virtual teams. In C. Gibson & S. Cohen (Ed.), Virtual teams that work: Creating conditions for virtual team effectiveness. San Francisco, CA: John Wiley & Sons, Inc.
Hoff, K.A., & Bashir, M. (2015). Trust in automation: Integrating empirical evidence on factors that influence trust. Human Factors, 57(3), 407-434.
Horvath, L. & Tobin, T.J. (2001). Twenty-first century teamwork: Defining competencies for virtual teams. Quality Progress, 30 (5), 108-109.
Huckman, R. & Staats, B. (2013). The hidden benefits of keeping teams intact. Harvard Business Review, 91(12), 27-29.
Isaacs, E. A., & Tang, J.C. (1994). What video can and cannot do for collaboration: A case study. Multimedia systems, 2, 63-73.
International Telecommunication Union. Series G: Transmission systems and media, digital systems, and networks. International telephone connections and circuits – General Recommendations on the transmission quality for an entire international telephone connection, May 2013.
James, D., & Drakich, J. (1993). Understanding gender differences in amount of talk: A critical review of research. Gender and conversational interaction, 281-312.
Jarvenpaa, S. L., Knoll, K., & Leidner, D.E. (1998). Is anybody out there? Antecedents of trust in global virtual teams. Journal of Management Information Systems, 14(4), 29-64.
Jian, J. Y., Bisantz, A. M., & Drury, C. G. (2000). Foundations for an empirically determined scale of trust in automated systems. International Journal of Cognitive Ergonomics, 4(1), 53-71.
Jackson, S.E., Joshi, A., & Erhardt (2003). Recent research on team and organizational diversity: SWOT analysis and implications. Journal of Management, 29 (6), 801-830.

134
Janssen, J.J.H.M., Erkens, G., Kirschner, P.A., Kanselaar, G. (2009). Computers in Human Behavior, 29 (1), pp. 161 – 170.
Kanas, N. (2005). Interpersonal Issues in Space: Shuttle/Mir and Beyond. Aviation, Space, and Environmental Medicine, 76(6), 126-134.
Kanas, N. & Caldwell, B.S. (2000). Summary of research issues in personal, interpersonal, and group dynamics. Aviation, Space, and Environmental Medicine, 71 (9 Suppl): A26-28.
Kanki, B.G. & Foushee, H.C. (1989). Communication as group process mediator of aircrew performance. Aviation, Space, and Environmental Medicine, 60 (5), 402-410.
Keebler, J.R., Dietz, A.S., & Baker, A. (2015). Effects of communication lag in long duration space flight missions: Potential mitigation strategies. Proceedings of the Human Factors and Ergonomics Society Annual Meeting, 59 (1), 6 – 10.
Kies, J.K. (1997). Empirical methods for evaluating video-mediated collaborative work. Unpublished dissertation, Virginia Tech.
Kies, J. K., Williges, R. C., and Williges, B. H. (1997). “Desktop video conferencing: a system approach,” In M.G. Helander, T.K. Landauer, & P.V. Prabhu (eds.), Handbook of Human-Computer Interaction, 979–1002, Amsterdam: Elsevier Science.
Kiesler, S., & Cummings, J. (2002). What do we know about proximity in work groups? A legacy of research on physical distance. In P. Hinds. S. Kiesler (Ed.), Distributed work (pp. 57-80). Cambridge, MA: MIT Press.
Kintz, N.M., Chou, C.P., Vessey, W.B., Leveton, L.B., Palinkas, L.A., (2016). Impact of communication delays to and from the international space station on self-reported individual and team behavior and performance: A mixed-methods study. Acta Astronautica, 129, 193 - 200.
Kitawaki, N. and Itoh, K. (1991). Pure delay effects on speech quality in telecommunications. IEEE Journal on Selected Areas in Telecommunication, 9(4), 586-593.
Kleiner, B.M (2008). Macroergonomics: Work system analysis and design. Ergonomics, 50(3), 461-467.
Koulouri, T. Lauria, S. & Macredie, R.D. (2017). The influence of visual feedback and gender dynamics on performance, perception, and communication strategies in CSCW. International Journal of Human-Computer Studies, 97, 162-181.
Kozlowski, S. W. J. & Bell, B.S. (2004). Work teams. In C. Spielberger (Ed.), Encyclopedia of applied psychology (Volume 1, pp. 725-732). New York: Academic Press.
Krausman. A.S. (2013). Understanding the effect of audio communication delay on distributed team interaction. Proceedings of the 18th International Command and Control Research and Technology Symposium (ICCRTS), pp. 1 – 18.
Krausman, A.S. (2017). Understanding audio communication delay in distributed team interaction: Impact on trust, shared understanding, and workload. Proceedings of the IEEE COGSIMA Conference, pp. 1-3.

135
Krauss, R.M. and Bricker, P.D. (1967). Effects of transmission delay and access delay on the efficiency of verbal communication, Journal of the Acoustic Society of America, 41, 286-292.
Krauss, R. M., Garlock, C. M., Bricker, P. D., & McMahon, L. E. (1977). The role of audible and visible back channel responses in interpersonal communication. Journal of Personality and Social Psychology, 35, 523-529
Kring, J. P. (2004). Communication modality and after action review performance in a distributed immersive virtual environment. (Unpublished doctoral dissertation), University of Central Florida.
Krokos, K. J., Baker, D.P., Alonso, A., & Day, R. (2008). Assessing team process in complex environments: challenges in transitioning research to practice. In E. Salas, G.F. Goodwin, &C.S. Burke (Eds.), Team Effectiveness in Complex Organizations. New York: Taylor & Francis.
Lassiter, D., Vaughn, J., Smaltz, V., Morgan, B., & Salas, E. (1990). A comparison of two types of training interventions on team communication performance. Proceedings of the Human Factors Society 34th Annual Meeting, Santa Monica, CA.
Lee. J.D., & See, K.A. (2004). Trust in automation: Designing for appropriate reliance. Human Factors, 46 (1), 50-80.
Littlepage, G., W. Robison, K. Reddington. 1997. Effects of task experience and group experience on group performance, member ability, and recognition of expertise. Organizational Behavior Human Decision Processes 69(2) 133–147.
Love, S.G., & Reagan, M.L. (2013). Delayed voice communication. Acta Astronautica, 91, 89-95.
Koulouri, T., Lauria, S., Macredie, R.D. (2017). The influence of visual feedback and gender dynamics on performance, perception and communication strategies in CSCW. International Journal of Human Computer Studies. Vol. 97. pp. 162–181.
Kuhn, P. & Villeval, M.C. (2015). Are women more attracted to cooperation than men? The Economic Journal, 125 (582), 115-140.
Marks, M. A., Zaccaro, S. J., & Mathieu, J. E. (2000). Performance implications of leader briefings and team-interaction training for team adaptation to novel environments. Journal of Applied Psychology, 85(6), 971-986.
Mayer, R.C., Davis, J.H. & Schoorman, F.D. (1995). An integrative model of organizational trust. Academy of Management Review, 20(3), 709-734.
Martins, L.L., Gilson, L.L, & Maynard, M.T. (2004). Virtual Teams: What do we know and where do we go from here? Journal of Management, 30 (6); 805 – 835.
McAllister, D.J. (1995). Affect and cognition-based trust as foundations for interpersonal cooperation in organizations. Academy of Management Journal, 38(1), 24-59.
McIntyre, R. M. & Salas, E. (1995). Measuring and managing for team performance: Lessons from complex environments. In R. Guzzo & E. Salas (Eds.), Team effectiveness and
136
decision making in organizations. San Francisco, CA: Jossey-Bass. Merritt, S.M., & Ilgen, D.R. (2008). Not all trust is created equal: Dispositional and history-
based trust in human-automation interactions. Human Factors, 50 (2), 194 – 210. Mohammed, S. & Angell, L. (2004). Surface- and Deep-Level Diversity in Workgroups:
Examining the Moderating Effects of Team Orientation and Team Process on Relationship Conflict. Journal of Organizational Behavior, 25, 1015 - 1039.
Montague, E.N.H., Kleiner, B.M., & Winchester, W. (2009). Empirically understanding trust in medical technology. International Journal of Industrial Ergonomics, 39, 628-634.
Morgan, B. B., Salas, E., & Glickman, A.S. (1993). An analysis of team evolution and maturation. Journal of General Psychology, 120(3), 277-292.
Nadler, E., Mengert, P., DiSario, R., Sussman, D. D., Grossberg, M., & Spanier, G. (1993). Effects of satellite- and voice-switching equipment transmission delays on Air Traffic Control communications. International Journal of Aviation Psychology, 5(4), 315-325.
Neale, D. C., Carroll, J.M., & Rosson, M.B. (2004). Evaluating computer-supported cooperative work: models and frameworks. Paper presented at the CSCW, Chicago, Illinois.
Neubauer, C. Wooley, J., Khooshabeh, P. & Scherer, S. Getting to know you: a multimodal investigation of team behavior and resilience to stress. In Proceedings of the 18th ACM International Conference on Multimodal Interaction (ICMI 2016). ACM, New York, NY, USA, 193-200.
Ochsman, R.B. & Chapanis, A. (1974). The effects of 10 communication modes on the behavior of teams during cooperative problem solving. International Journal of Man-Machine Studies, 6, 579-619.
O'Conaill, B., Whittaker, S., & Wilbur, S. (1993). Conversations over video conferences: An evaluation of the spoken aspects of video-mediated communication. Human Computer Interaction, 8, 389-428.
Office of Force Transformation. 2005. The Implementation of Network-Centric Warfare. Washington, D.C.: Office of the Secretary of Defense.
Olson, G. M., & Olson, J. S. (1997). Making sense of the findings: Common vocabulary leads to synthesis necessary for theory building. In K. E. Finn, A. J. Sellen, & S.
B. Wilbur (Eds.), Video-mediated Communication (pp. 75-91). Mahwah, NJ: Lawrence Erlbaum Associates.
Okhuysen, G.A. (2001). Structuring change: Familiarity and formal interventions in problem-solving groups. Academy of Management Journal, 44 (4), 794-808.
Olson, G. M., & Olson, J.S. (2000). Distance matters. Human Computer Interaction, 15, 139-178.
Olson, G.M., and J.S. Olson (2003) “Mitigating the Effects of Distance on Collaborative Intellectual Work,” Economics of Innovation and New Technology, Vol. 12(1), pp. 27-42.
Olson, G. M. & Olson, J. S. (2008). Groupware and computer-supported cooperative work. The Human-Computer Interaction Handbook: Fundamentals, Evolving

137
Technologies and Emerging Applications. (pp. 545-554). Hillsdale, NJ.: L. Erlbaum. Olson, G. M. & Olson, J. S. (2014). Working Together Apart: Collaboration over the Internet.
Synthesis Lectures on Human-Centered Informatics, Morgan & Claypool. Olson, J. S., Olson, G. M., & Meader, D. K. (1995). What mix of video and audio is useful for
remote real-time work? Proceedings of the CHI’95 Conference on Human Factors in Computing Systems, 362–368. Denver, CO: ACM.
O’Malley, C., Langton, S., Anderson, A., Dougherty-Sneddon, G., & Bruce, V. (1996). Comparison of face-to-face and video-mediated interaction. Interacting With Computers, 8(2), 177-192.
Pantelli, N. (2003). Situating trust in within virtual teams. In S. Reddy (Ed.), Virtual Teams: Contemporary Insights: 20-40, ICFAI University Press, Hyderabad, India.
Parasuraman, R. & Riley, V. (1997). Humans and automation: use, misuse, and abuse. Human Factors, 39 (2), 230-253.
Parkinson, B. & Lea, M. (2011). Video-linking emotions. In A. Kappas (Ed.). Face to- Face Communication over the Internet. Cambridge: Cambridge University Press.
Pearson, A. R., West, T. V., Dovidio, J. F., Buck, R., Henning, R., & Powers, S. R. (2008). The fragility of intergroup relations: Divergent effects of temporal delay in audio-visual feedback in intergroup and intragroup interaction. Psychological Science, 19, 1272-1279.
Peters, L.M., & Manz, C.C. (2007). Identifying antecedents of virtual team collaboration. Team Performance Management, 13(3/4), 117-129.
Piccoli, G., Powell, A., & Ives, B. (2004). Virtual teams: Team control structure, work processes, and team effectiveness. Information Technology & People, 17(4) 359-379.
Poltrock, S.E., & Engelbeck, G. (1999). Requirements for a virtual collocation environment. Information and Software Technology, 41, 331-339.
Powell, A., Piccoli, G. & Ives, B. (2004). Virtual teams: A review of current literature and directions for future research. The DATA BASE for Advances in Information Systems, 35(1).
Priest, H. A., Stagl, K.C., Klein, C., & Salas, E. (2006). Virtual teams: Creating context for distributed teamwork. In E. S. Clint Bowers, & F. Jentsch (Ed.), Creating High-Tech Teams. Washington, DC: American Psychological Association.
Rantanen, E., McCarley, J., & Xu, X. Rantanen, E. M.,McCarley, J. S., & Xu, X. (2004). Time delays in air traffic control communication loop: Effect on controller performance and workload. International Journal of Aviation Psychology, 14, 369–394.
Renfro-Powers, S., Rauh, C., Henning, R.A., Buck, R.W., & West, T.V. (2011). The effect of video feedback delay on frustration and emotion communication accuracy. Computers in Human Behavior, 27, 1651-1657.
Rico, R., Alcover, C.M, Sanchez-Manzanares, M., & Gil, F. (2009). The joint relationships of communication behaviors and task interdependence on trust building and change in virtual project teams. Social science information, 48(2), 229-255.

138
Rink, F. Kane, A.A., Ellemers, N., & van der Vegt, G. (2017). Change in organizational work teams. In E. Salas, R. Rico, & J. Passmore (Eds.) The Wiley Blackwell Handbook of the Psychology of Team Working and Collaborative Processes. Hoboken: Wiley-Blackwell.
Rocco, E., Finholt, T.A., Hofer, E.C., & Herbsleb, J.D. (2001). Out of sight, short of trust. Paper presented at the Presented at the founding conference of the European academy of management, Barcelona, Spain.
Ruddy, M. (2007). ELICIT – The experimental laboratory for investigating collaboration, information–sharing and trust. Paper presented at the 12th ICCRTS, June 2007.
Ruhleder, K. & Jordan, B. (2001). Co-constructing non-mutual realities: Delay-generated trouble in distributed interaction. Journal of Computer Supported Cooperative Work, 10(1), 113-138.
Salas, E., Burke, C.S., & Cannon-Bowers, J.A. (2000). Teamwork: emerging principles. International Journal of Management Reviews, 2(4), 339-356.
Salas, E., Burke, C.S., & Samman, S.N. (2001). Understanding command and control teams operating in complex environments. Information-Knowledge-Systems Management, 2(4), 311 - 323.
Salas, E., Cannon-Bowers, J.A., Payne, S., & Smith-Jentsch, K.A. (1998). Teams and teamwork in the military. In C. Cronin (Ed.), Military psychology: An introduction. Needham Heights, MA: Simon & Schuster.
Salas, E. Cannon-Bowers, J.A., & Weaver, J. (2017). Command and control teams: Principles for training and assessment. In R. Flin and K. Arbuthnot (Eds.), In Incident Command: Tales from the Hot Seat (pp. 239-257). New York: Routledge.
Salas, E., Cooke, N.J., & Rosen, M.A. (2008). On teams, teamwork, and team performance: Discoveries and developments. Human Factors, 50(3), 540-547.
Salas, E., Dickinson, T.L., Converse, S.A., & Tannenbaum, S.I. (1992). Toward an understanding of team performance and training. In R. Guzzo & E. Salas (Eds.), Teams: Their training and performance (pp. 3-29). Norwood, NJ: Ablex.
Salas, E., Rosen, M.A., Burke, C.S., & Goodwin, G.F. (2008). The wisdom of collectives in organizations: An update of the teamwork competencies. In E. Salas, G. F. Goodwin, & C.S. Burke (Eds.), Team effectiveness in complex organizations: Cross-disciplinary perspectives and approaches (pp. 39-79). New York: Routledge.
Salas, E., Sims, D.E., & Burke, C.S. (2005). Is there a big five in teamwork? Small Group Research, 36(5), 555-599.
Salas, E., Sims, D.E., & Klein, C. (2004). Cooperation at work. In C. Spielberger (Ed.), Encyclopedia of applied psychology (Volume 1, pp. 497-505). New York: Academic Press.
Salmon, P., Stanton, N., Houghton, R., Rafferty, L., Walker, G., & Jenkins. D. (2008). Developing guidelines for distributed teamwork: Review of the literature. West London, UK: Human Factors Integration Defense Technology Center.

139
Scarpati, Jessica. “Video conferencing systems help NATO keep the peace.” Search Unified Communications, April 2016, https://searchunifiedcommunications.techtarget.com/feature/Video-conferencing-systems-help-NATO-keep-the-peace.
Schaefer, K.E., Chen, J.Y.C., Szalma, J.L., & Hancock, P.A. (2016). A meta-analysis of factors influencing the development of trust in automation. Implications for understanding autonomy in future systems. Human Factors, 58(3), 377-400.
Sessa, V. I., Hansen, M.C., Prestridge, S., & Kossler, M.E. (1999). Geographically dispersed teams: an annotated bibliography. Greensboro, NC: Center for Creative Leadership.
Sexton, J. B., Thomas, E. J., & Helmreich, R. L. (2000). Error, stress, and teamwork in medicine and aviation: cross sectional surveys. BMJ (Clinical research ed.), 320(7237), 745-9.
Shanahan, C., Best, C., Finch, M., & Sutton, C. (2007). Measurement of the behavioural, cognitive, and motivational factors underlying team performance. DSTO Report DSTO-RR-0328 Air Operations Division, Fishermans Bend, Victoria, Australia.
Shannon, C., & Weaver, W. (1949). The mathematical theory of communication. Urbana, IL: University of Illinois Press.
Sharples, M., Goodlet, J.S., Beck, E.E., Wood, C.C., Easterbrook, S.M., & Plowman, L. (1993). Research issues in the study of computer supported collaborative writing. In M. Sharples (Ed.), Computer Supported Collaborative Writing. London: Springer-Verlag.
Sheridan, T. B. (2002). Humans and automation: Systems design and research issues. Santa Monica/New York: Human Factors and Ergonomics Society/Wiley.
Short, J., Williams, E., & Christie, B. (1976). The social psychology of telecommunications. London: Wiley.
Solomon, C. (2016). Trends in Global Virtual Teams (Virtual Teams Survey Report). RW3 CultureWizard. Retrieved from http://cdn.culturewizard.com/PDF/Trends_in_VT_Report_4-17-2016.pdf.
Spitzberg, B.H. & Cupach, W.R. (2002). Interpersonal skills. In M.L. Knapp & J.R. Daly (Eds.), Handbook of interpersonal communication (pp. 564-611). Newbury Park, CA: Sage.
Staats, B.R. (2011). Unpacking team familiarity: the effects of geographic location and hierarchical role. Production and Operations Management, 21(3), 619 – 635.
Tang, J. C., & Isaacs, E.A. (1993). Why do users like video? Studies of multimedia-supported collaboration. CSCW: An International Journal, 1, 163-196.
Taylor, N.J., Dennis, A.R., & Cummings, J.W. (2013). Situation Normality and the Shape of Search: The Effects of Time Delays and Information Presentation on Search Behavior. Journal of the American Society for Information Science and Technology, 64(5):909–928, 2013.
Thatcher, A., & De LaCour, A. (2003). Small group decision-making in face-to-face and computer mediated environments: the role of personality. Behaviour & Information Technology, 22, 203–218.

140
Thompson, L. F., & Coovert, M.D. (2006). Understanding and developing virtual computer-supported cooperative work teams. In C. Bowers, E. Salas, & F. Jentsch (Ed.), Creating High-Tech Teams. Washington, DC: American Psychological Association.
Tiferes, J. & Bizantz, A.M. (2018). The impact of team characteristics and context on team communication: An integrative literature review. Applied Ergonomics, 68, 146-159.
“Top 5 Free Video Conferencing Tools 2016-2017: Pros and Cons.” Prialto blog, December 6, 2016, https://blog.prialto.com/top-5-free-video-conferencing-tools-for-2017-pros-and-cons.
Ubon, A.N. (2005). Social presence in text-based online learning communities: A longitudinal case study using content analysis. Unpublished doctoral dissertation, York University, Heslington.
van den Heuvel, G, Van Ettinger, F. & Grant, T.J. (2009). Identifying Cultural Determinants of Information Sharing via C2 Information and Communication Technologies: The I3I model. In Alberts, D.S. (ed.), Proceedings, 14th International Command & Control Research & Technology Symposium, Washington DC, USA, paper I044.
van der Kleij, R. (2007). Overcoming distance in virtual teams: Effects of communication media, experience, and time pressure on distributed teamwork. Unpublished Doctoral dissertation, University of Amsterdam.
van der Kleij, R., Schraagen, J.M., Werkhoven, P., & De Dreu, C.K.W. (2009). How conversations change over time in face to face and video mediated interactions. Small Group Research, 40 (4), 355-381.
van der Kleij, R., Paashuis, R.M., Schraagen, J.M. (2005). On the passage of time: Temporal differences in video-mediated and face-to-face interaction. International Journal of Human-Computer Studies, 62, 521-542.
van der Vegt, G., Emans, B., & Van De Vliert, E. (2000). Team members' affective responses to patterns of intragroup interdependence and job complexity. Journal of Management, 26(4), 633-655.
van Knippenberg, D. & Schippers, M.C. (2007). Work group diversity. Annual Review of Psychology, 58(1), 515-541.
Veinott, E. S., Olson, J., Olson, G., & Fu, X. (1999). Video helps remote work: Speakers who need to negotiate common ground benefit from seeing each other. Paper presented at the Proceedings of the CHI'95 conference on human factors in computing systems.
Vessey, W.B., & Landon, L.B. (2017). Team performance in extreme environments. In E. Salas, R. Rico, & J. Passmore (Eds.) The Wiley Blackwell Handbook of the Psychology of Team Working and Collaborative Processes. Hoboken: Wiley-Blackwell.
Vu, K. P. L., Morales, G., Chiappe, D., Strybel, T.Z., Battiste, V., & Shively, R.J., (2014). Measured response for multiple UAS in a simulated NAS environment. Proceedings of the Human Factors and Ergonomics Society 58th Annual Meeting. Santa Monica: Human Factors and Ergonomics Society.
Wainfan, L., & Davis, P. (2004). Challenges in virtual collaboration. Santa Monica, CA: Rand

141
Corporation. Walther, J. B. (2002). Time effects in computer-mediated groups: Past, present, and future. In P.
Hinds & S. Kiesler (Eds.), Distributed work (pp. 235-257). Cambridge, MA, US: MIT Press
Watson, A. (2001). Assessing the quality of audio and video components in desktop multimedia conferencing. Unpublished Doctoral dissertation. University of London.
Watson, W., Michaelsen, L. K., & Sharp, W. (1991). Member competence, group interaction, and group decision making: A longitudinal study. Journal of Applied Psychology, 76, 803–809.
Webber, S.S. (2008). Development of cognitive and affective trust in teams: A longitudinal study. Small Group Research, 39 (6), 746-769.
Wiedemann, K. & Kittler, M.G. (2006). Women and Communication: Measuring Effectiveness and Efficiency in Intra- and Intergender Communication. Proceedings of the UK Postgraduate Conference in Gender Studies, University of Leeds, UK.
Weisband, S. (2002). Maintaining awareness in distributed team collaboration: Implications for leadership and performance. In P. H. S. Kiesler (Ed.), Distributed work (pp. 312-333). Cambridge, MA: MIT Press.
Whitaker, L. A., Fox, S. L., and Peters, L. J. (1993). Communication between crews: The effects of speech intelligibility on team performance. In Proceedings of the Human Factors and Ergonomics Society (pp. 630-634). Seattle, WA.
Wilson, K.A., Burke, C.S., Priest, H.A., & Salas, E. (2005). Promoting health care safety through training high reliability teams. Quality, Safety, and Health Care, 14, 303-309.
Wilson, K. A., Salas, E., Priest, H.A., & Andrews, D. (2007). Errors in the heat of battle: Taking a closer look at shared cognition breakdowns through teamwork. Human Factors, 49(2), 249 -256.
Wilson, J. M., Straus, S.G., & McEvily. (2006). All in due time: the development of trust in computer-mediated and face-to-face teams. Organizational behavior and human decision processes, 99(1), 16-33.
Wolfrey, T. (2018). Network latency, jitter, & packet loss. SingleComm. https://help.singlecomm.com/hc/en-us/articles/115003427168-Network-Latency-Jitter-Packet-Loss
Wood, R. E. 1986. Task complexity: Definition of the construct. Organizational Behavior Human Decision Processes 37(1) 60–82.
Yates, D. (2003). The creation of a multimedia tutorial based on the traditional model of communication. Unpublished master thesis, Seton Hall University, South Orange.
Zheng, J., Veinott, E., Bos, N., Olson, J., & Olson, G. (2002). Trust without touch: Jumpstarting long distance trust with initial social activities. Proceedings of CHI 2002, 141-146. New York: ACM.
142
APPENDIX A – Consent Form
Si te of Research: Bui ld ing 517 , APG, MD
RESEARCH PARTICIPANT CONSENT FORM ARMY RESEARCH LABORATORY
Project Title: Understanding the Impacts of Communication Delays on Distributed Team Interaction
Sponsor: Department of Defense Principal Investigator: Andrea S. Krausman, APG, MD, 410-278-5933 [email protected] Date: February 21, 2014
You are being asked to join a research study. This consent form explains the research study and your part in it. Please read this form carefully before you decide to take part. You can take as much time as you need. Please ask questions at any time about anything you do not understand. You are a volunteer. If you join the study, you can change your mind later. You can decide not to take part right now or you can quit at any time later on.
Why is this research being done?
This study involves research and the purpose is to understand how audio and audiovisual communication technologies influence task performance when teams are distributed (i.e. in different locations).
What will happen if you join this study?
You are being asked to participate in a study to investigate the effect of communication technologies on distributed team performance. You will play the role of an “Intelligence Analyst: and perform a collaborative problem solving task called ELICIT which is similar to the game “Clue”. The goal of ELICIT is to identify the “who”, “what”, “where”, and “when” of a fictitious terror plot. You will work with another intelligence analyst (your team member) who will remain the same throughout the experiment. This study will examine how different communication technologies impact task performance. This study will take place in the Cognitive Assessment, Simulation, and Engineering Laboratory (CASEL) at Aberdeen Proving Ground, Maryland.
You will complete one training session and six experimental sessions. When you arrive at the CASEL facility you will be seated behind a computer desk in an experiment room. You will receive information describing the purpose of the experiment and what is expected of you. Any
143
questions you have will be answered. When all questions have been fully answered, you will fill out a demographic questionnaire to obtain information about yourself as well as experience with different communication technologies. Following the demographic questionnaire, you will complete a training session to learn how to play the ELICIT game and how you will use the communication technology, either audio or video, to communicate with your team member. During the training session, you will complete a training version of the ELICIT game in which you will receive information called “factoids” that pertain to a fictitious terror plot. You will discuss the factoids with your teammate using audio or audiovisual technology, and when you think you are ready to solve, you will enter your proposed solution in the ELICIT software. After completing the training session, you will be given a short break. For the break, we ask that you do not venture out of the experimental room without requesting permission to do so.
At the beginning of the experiment, you and your teammate will receive “factoids” related to another fictitious terror plot. Since the factoids your teammate receives will be different from yours, you must communicate and discuss the factoids with your team member in order to arrive at a solution. You will receive two groups of factoids; the first group at the start of an ELICIT session, and the last group after 5 minutes have elapsed. When you are ready to solve the problem, you will enter your proposed solution in the ELICIT “Identify” window and click OK. Total time to complete a session of the ELICIT task is approximately 20 minutes. After completing the first session, you will be given a 5 minute break and will be asked to fill out questionnaires. The questionnaires will ask you to rate your performance and your partner’s performance during the experiment. Then, you follow the same procedures and complete the second session. You will complete 6 ELICIT sessions during the experiment. Upon completion of the experiment, you and your team member will participate in an information interview with the experimenter to obtain feedback about what your experiences during the study.
How much time will the study take?
Your participation in the study will take approximately 3 hours.
What are the risks or discomforts of the study?
The risks associated with this experiment are similar to those you would experience working on a computer in an enclosed office. Since you will be seated in an experimental chamber with the door closed you may experience slight feelings of claustrophobia. The experimental chambers are fairly generous in size measuring approximately 7'2" Tall x 10'3" Wide x 10'3" Long, but if you do begin to experience feelings of claustrophobia, please inform the experimenter immediately.
Are there benefits to being in the study?

144
There are no direct benefits to you for your participation in this study. Your participation in this study will help characterize how different technologies impact team members’ ability to communicate with each other and perform tasks. The results of this study will help us propose solutions that will enhance team communication in distributed environments.
Will you be paid if you join this study?
You will not be paid for participating in this study.
How will your privacy be protected?
Your participation in this research is confidential. The data will be stored and secured at Building 459 in a (locked/password protected) file. In the event of a publication or presentation resulting from the research, no personally identifiable information will be shared, unless you give permission below in the section requesting consent for us to (photograph, videotape, and audio tape) you. Publication of the results of this study in a journal or technical report or presentation at a meeting will not reveal personally identifiable information; unless you give your permission below in the section requesting consent for us to photograph, videotape, and audio tape you. After transfer of the data to a computer file, the paper copies of the data will be shredded. This consent form will be retained by the principal investigator for a minimum of three years. Data sheets, computer files containing data, or video or audio tapes or digital or photographic images will eventually be destroyed.
The research staff will protect your data from disclosure to people not connected with the study. However, complete confidentiality cannot be guaranteed because officials of the U. S. Army Human Research Protections Office and the Army Research Laboratory’s Institutional Review Board are permitted by law to inspect the records obtained in this study to insure compliance with laws and regulations covering experiments using human subjects.
We would like your permission to take pictures/videotape/audio record during the experimental session. Only the experimenter or research associates will have access to the recordings. The pictures and recordings will be used for data analysis purposes and possibly for presentations and publications. Although we will photograph and record your activities during the experiment, we will blur your face and any other identifying information to protect your identity. If you prefer NOT to be recorded, you will NOT be able to participate in the study. Please indicate below if you will agree to allow us to record you.
I give consent to be audio taped during this study: ___Yes ___No please initial:____
I give consent to be videotaped during this study: ___Yes ___No please initial:____
I give consent to be photographed during this study: ___Yes ___No please initial:____

145
Where can I get more information?
You have the right to obtain answers to any questions you might have about this research both while you take part in the study and after you leave the research site. Please contact anyone listed at the top of the first page of this consent form for more information about this study. You may also contact the chairperson of the Human Research & Engineering Directorate, Institution Review Board, at (410) 278-5992 with questions, complaints, or concerns about this research, or if you feel this study has harmed you. The chairperson can also answer questions about your rights as a research participant. You may also call the chairperson’s number if you cannot reach the research team or wish to talk to someone who is not a member of the research team.
Voluntary Participation
Your decision to be in this research is voluntary. You can stop at any time. You do not have to answer any questions you do not want to answer. Refusal to take part in or withdrawal from this study will involve no penalty or loss of benefits you would receive by staying in it.
If you are using civilian employees or contractors as subjects, add the following statement: Civilian or contractor personnel cannot receive administrative sanctions for choosing not to participate in or withdrawing from this study.
Once your questions about the study have been answered, and if you want to continue your participation in this study, please sign below.
WE WILL GIVE YOU A COPY OF THIS CONSENT FORM
Signature of Participant Printed Name Date
Signature of Person Obtaining Consent Printed Name Date
146
APPENDIX A-1. VIRGINIA TECH IRB APPROVAL LETTER

147
APPENDIX B. DEMOGRAPHIC QUESTIONNAIRE
DEMOGRAPHIC INFORMATION
1. What is your age? ______
2. What is your gender? Male Female
3. Is English your first language? Yes No
4. Please circle the letter of the statements below that best reflects your level of familiarity with your team member in the context of current and previous work teams, work projects, or social interactions at or outside of work.
a. I do not know this team member b. This team member is an acquaintance of mine c. I know this team member well d. I know this team member very well
COMPUTER AND TECHNOLOGY EXPERIENCE
5. Please rate your level of experience with computer systems. (Check One):
Very Experienced Experienced Slightly Experienced Not Experienced
6. Please rate your perceived level of experience with the following communication technologies:
Very Slightly Not Experienced Experienced Experienced Experienced
Telephone
Cell Phone
Video conference (Skype, Desktop) Audio conference (Teleconferencing)
Other:_________

148
APPENDIX C. NASA TLX WORKLOAD INSTRUCTIONS AND SCALE
Throughout this study rating scales will be used to assess your experiences in different task conditions. The evaluation you are about to perform is a technique that has been developed by NASA to assess the relative importance of six factors in determining how much workload you experienced. The procedure is performed in two steps:
First, you will be presented with a series of pairs of rating scale titles (for example Effort vs. Mental Demands) and asked to choose which of the items was more important to your experience of workload in the session you just performed. Circle the Scale Title that represents the more important contributor the workload for the specific task(s) you performed in this study. Please read the descriptions of the scales carefully. If you have a question about any of the scales, feel free to ask about it. It is extremely important that they be clear to you.
Example:
Effort or Performance
Temporal Demand or Effort
Performance or Frustration
Second, you will see six rating scales displayed on the paper in front of you. Each scale has two endpoint descriptors that describe the scale from low to high (Note: For the Performance rating scale the endpoints are reversed, so be careful when using this scale). You will evaluate the session you just completed on each of the six subscales by putting an “X” at the point that matches your experience during the session you just performed.
Example:
Good Poor

149
NASA TLX Workload Comparisons
Please circle the member of each pair that contributed more to your experience of
workload in the session you just completed.
Effort or Performance
Temporal Demand or Effort
Performance or Frustration
Physical Demand or Performance
Frustration or Effort
Performance or Temporal Demand
Mental Demand or Physical Demand
Frustration or Mental Demand
Temporal Demand or Frustration
Physical Demand or Frustration
Physical Demand or Temporal Demand
Temporal Demand or Mental Demand
Performance or Mental Demand
Mental Demand or Effort
Effort or Physical Demand

150
NASA-TLX Mental Workload Rating Scale
Please place an “X” along each scale at the point that best indicates your experience with the
session you just completed.
Low High
Mental Demand: How much mental and perceptual activity was required (e.g., thinking, deciding, calculating, remembering, looking, searching, etc)? Was the mission easy or demanding, simple or complex, exacting or forgiving?
Low High
Physical Demand: How much physical activity was required (e.g., pushing, pulling, turning, controlling, activating, etc.)? Was the mission easy or demanding, slow or brisk, slack or strenuous, restful or laborious?
Low High
Temporal Demand: How much time pressure did you feel due to the rate or pace at which the mission occurred? Was the pace slow and leisurely or rapid and frantic?
HighLow
Performance: How successful do you think you were in accomplishing the goals of the mission? How satisfied were you with your performance in accomplishing these goals?
Low High
Effort: How hard did you have to work (mentally and physically) to accomplish your level of performance?
Low High
Frustration: How discouraged, stressed, irritated, and annoyed versus gratified, relaxed, content, and complacent did you feel during your mission?
Good Poor

151
APPENDIX D. INTERPERSONAL TRUST SCALE
Please read the statements below and indicate the appropriate response for each statement for the session you just completed.
1. We have a sharing relationship. We can both freely share our ideas, feelings, and hopes. Strongly
disagree Disagree Somewhat Disagree
Neither agree nor disagree
Somewhat Agree Agree Strongly Agree
2. I can talk freely to my team member about difficulties I am having at work at know that (s)he will want to listen. Strongly
disagree Disagree Somewhat Disagree
Neither agree nor disagree
Somewhat Agree Agree Strongly Agree
3. We would both feel a sense of loss if one of us was transferred and we could no longer work together. Strongly
disagree Disagree Somewhat Disagree
Neither agree nor disagree
Somewhat Agree Agree Strongly Agree
4. If I shared my problems with my team member, I know s(he) would respond constructively and caringly. Strongly
disagree Disagree Somewhat Disagree
Neither agree nor disagree
Somewhat Agree Agree Strongly Agree
5. I would have to say that we have made considerable emotional investments in our working relationship. Strongly
disagree Disagree Somewhat Disagree
Neither agree nor disagree
Somewhat Agree Agree Strongly Agree
6. My team member approaches his/her job with professionalism and dedication. Strongly
disagree Disagree Somewhat Disagree
Neither agree nor disagree
Somewhat Agree Agree Strongly Agree
7. Given my team member’s track record, I see no reason to doubt his/her competence and preparation for the job. Strongly
disagree Disagree Somewhat Disagree
Neither agree nor disagree
Somewhat Agree Agree Strongly Agree
Continued on next page…..

152
8. I can rely on my team member not to make my job more difficult by careless work. Strongly
disagree Disagree Somewhat Disagree
Neither agree nor disagree
Somewhat Agree Agree Strongly Agree
9. Most people, even those who aren't close friends of my team member, trust and respect him/her as a coworker. Strongly
disagree Disagree Somewhat Disagree
Neither agree nor disagree
Somewhat Agree Agree Strongly Agree
10. Other work associates of mine who must interact with my team member consider him/her to be trustworthy. Strongly
disagree Disagree Somewhat Disagree
Neither agree nor disagree
Somewhat Agree Agree Strongly Agree
11. If people knew more about this individual and his/her background, they would be more concerned and would monitor his/her performance closely.
Strongly disagree Disagree
Somewhat Disagree
Neither agree nor disagree
Somewhat Agree Agree Strongly Agree

153
APPENDIX E. TRUST IN TECHNOLOGY QUESTIONNAIRE
(Jian, Bisantz, & Drury, 2000)
Please read the statements below and indicate the appropriate response for each statement for the session you just completed.
1. The system is deceptive. Not at all Extremely
2. The system behaves in an underhanded manner. Not at all Extremely
3. I am suspicious of the system's intent, action, and outputs. Not at all Extremely
4. I am wary of the system. Not at all Extremely
5. The system's actions will have a harmful or injurious outcome. Not at all Extremely
6. I am confident in the system. Not at all Extremely
7. The system provides security. Not at all Extremely
8. The system has integrity. Not at all Extremely
9. The system is dependable. Not at all Extremely

154
10. The system is reliable. Not at all Extremely
11. I can trust the system. Not at all Extremely
12. I am familiar with the system. Not at all Extremely
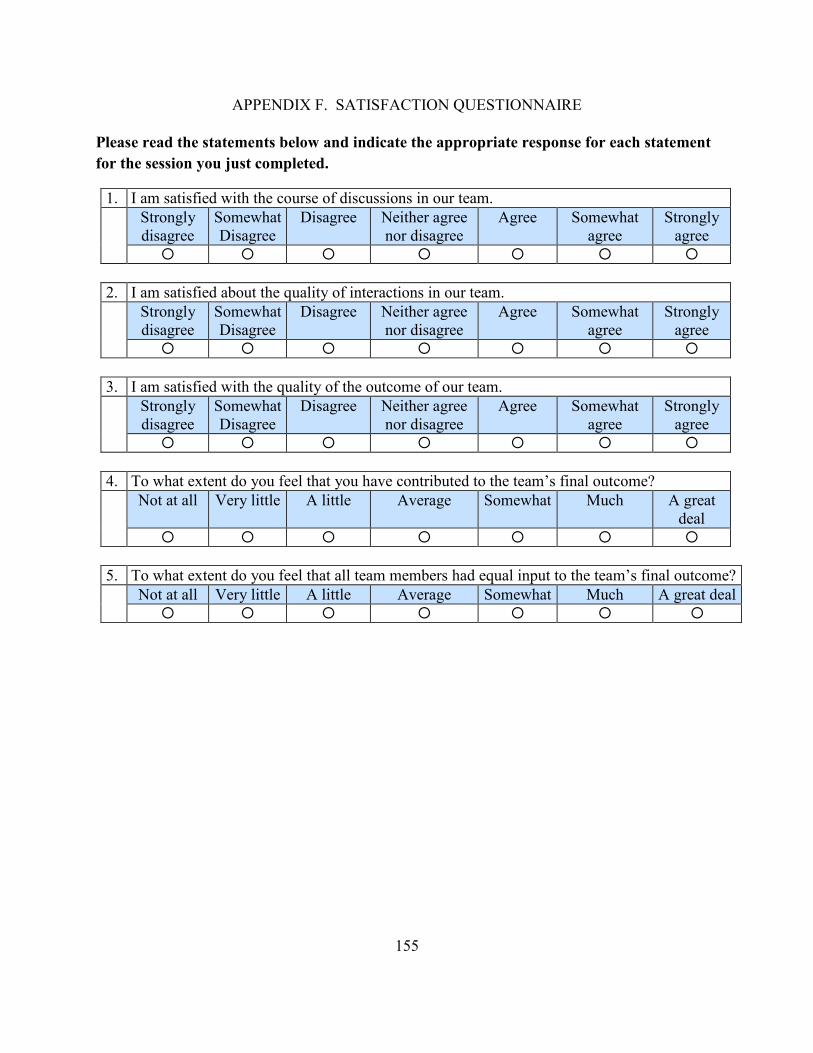
155
APPENDIX F. SATISFACTION QUESTIONNAIRE
Please read the statements below and indicate the appropriate response for each statement for the session you just completed.
1. I am satisfied with the course of discussions in our team. Strongly
disagree Somewhat Disagree
Disagree Neither agree nor disagree
Agree Somewhat agree
Strongly agree
2. I am satisfied about the quality of interactions in our team. Strongly
disagree Somewhat Disagree
Disagree Neither agree nor disagree
Agree Somewhat agree
Strongly agree
3. I am satisfied with the quality of the outcome of our team. Strongly
disagree Somewhat Disagree
Disagree Neither agree nor disagree
Agree Somewhat agree
Strongly agree
4. To what extent do you feel that you have contributed to the team’s final outcome? Not at all Very little A little Average Somewhat Much A great
deal
5. To what extent do you feel that all team members had equal input to the team’s final outcome? Not at all Very little A little Average Somewhat Much A great deal
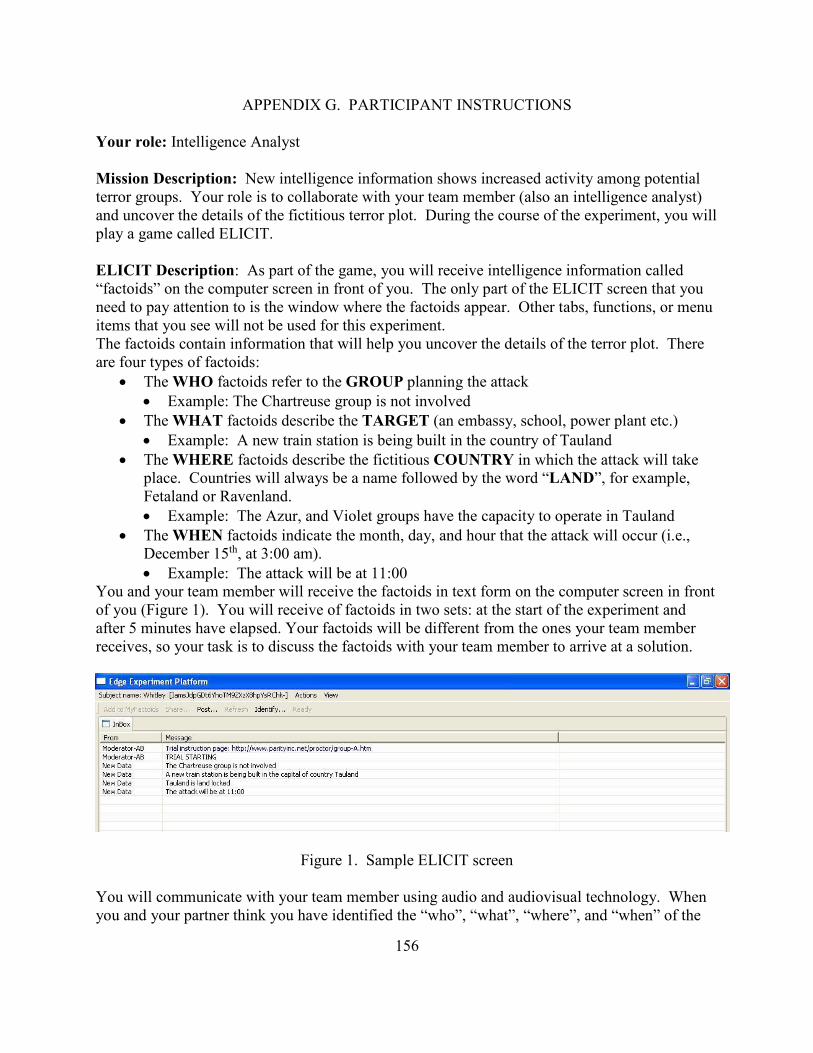
156
APPENDIX G. PARTICIPANT INSTRUCTIONS
Your role: Intelligence Analyst Mission Description: New intelligence information shows increased activity among potential terror groups. Your role is to collaborate with your team member (also an intelligence analyst) and uncover the details of the fictitious terror plot. During the course of the experiment, you will play a game called ELICIT. ELICIT Description: As part of the game, you will receive intelligence information called “factoids” on the computer screen in front of you. The only part of the ELICIT screen that you need to pay attention to is the window where the factoids appear. Other tabs, functions, or menu items that you see will not be used for this experiment. The factoids contain information that will help you uncover the details of the terror plot. There are four types of factoids:
• The WHO factoids refer to the GROUP planning the attack • Example: The Chartreuse group is not involved
• The WHAT factoids describe the TARGET (an embassy, school, power plant etc.) • Example: A new train station is being built in the country of Tauland
• The WHERE factoids describe the fictitious COUNTRY in which the attack will take place. Countries will always be a name followed by the word “LAND”, for example, Fetaland or Ravenland. • Example: The Azur, and Violet groups have the capacity to operate in Tauland
• The WHEN factoids indicate the month, day, and hour that the attack will occur (i.e., December 15th, at 3:00 am). • Example: The attack will be at 11:00
You and your team member will receive the factoids in text form on the computer screen in front of you (Figure 1). You will receive of factoids in two sets: at the start of the experiment and after 5 minutes have elapsed. Your factoids will be different from the ones your team member receives, so your task is to discuss the factoids with your team member to arrive at a solution.
Figure 1. Sample ELICIT screen You will communicate with your team member using audio and audiovisual technology. When you and your partner think you have identified the “who”, “what”, “where”, and “when” of the
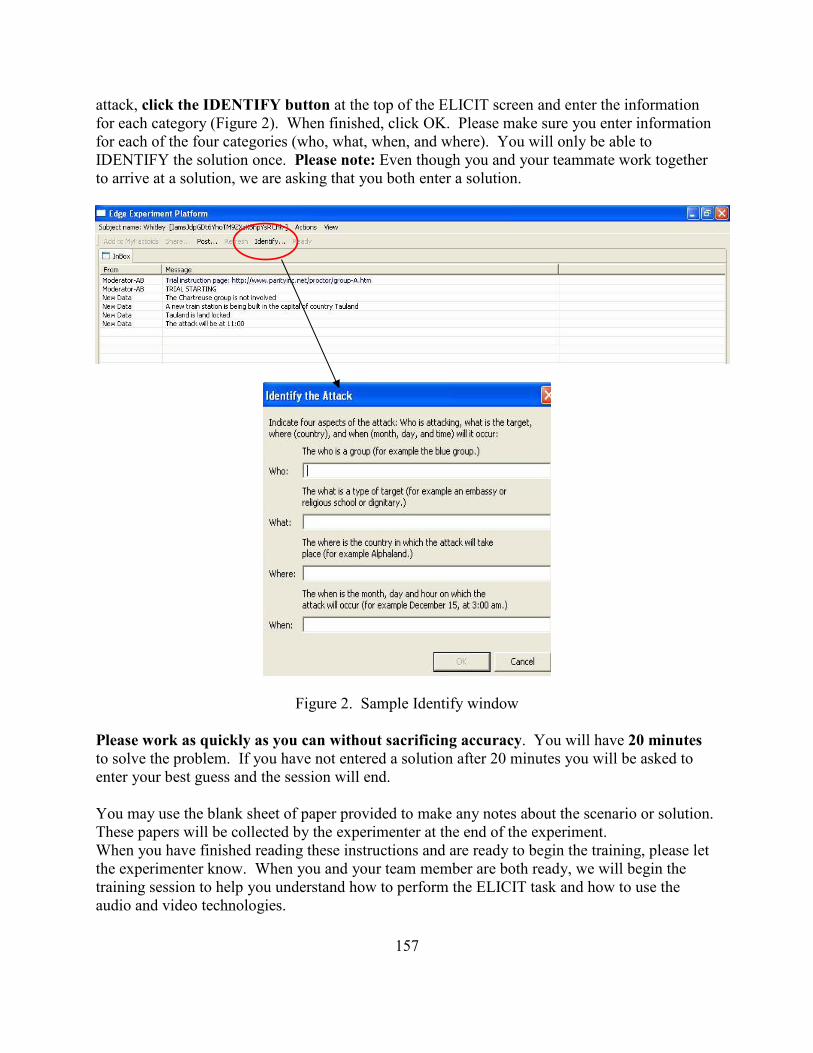
157
attack, click the IDENTIFY button at the top of the ELICIT screen and enter the information for each category (Figure 2). When finished, click OK. Please make sure you enter information for each of the four categories (who, what, when, and where). You will only be able to IDENTIFY the solution once. Please note: Even though you and your teammate work together to arrive at a solution, we are asking that you both enter a solution.
Figure 2. Sample Identify window
Please work as quickly as you can without sacrificing accuracy. You will have 20 minutes to solve the problem. If you have not entered a solution after 20 minutes you will be asked to enter your best guess and the session will end. You may use the blank sheet of paper provided to make any notes about the scenario or solution. These papers will be collected by the experimenter at the end of the experiment. When you have finished reading these instructions and are ready to begin the training, please let the experimenter know. When you and your team member are both ready, we will begin the training session to help you understand how to perform the ELICIT task and how to use the audio and video technologies.

158
APPENDIX H – DESCRIPTIVE STATISTICS
Objective Measures
Means for Delay and Technology (sd)
0 ms delay 800 ms delay 1600 ms delay
Measures Audio Audiovisual Audio Audiovisual Audio Audiovisual
Task Completion Time
13.38 (3.25)
12.38 (3.68)
13.88 (3.26)
14.32 (3.40)
13.77 (3.47)
12.51 (3.45)
Task Accuracy 95.83 (9.48)
97.50 (7.63)
92.78 (17.61)
93.90 (15.11)
95.58 (10.82)
96.67 (11.50)
Percent Factoids Shared
50.61 (21.61)
49.36 (17.90)
50.38 (19.48)
50.54 (19.71)
47.83 (18.70)
45.34 (18.54)
Means (sd) for Task Completion Time with Gender
0 ms delay 800 ms delay 1600 ms delay
Task
Completion
Time
Audio Audiovisual Audio Audiovisual Audio Audiovisual
Same-gender 13.55 (3.49)
13.22 (3.88)
14.58 (3.23)
15.32 (3.18)
14.02 (3.18)
12.77 (3.28)
Male-Female 12.97 (2.77)
10.41 (2.28)
12.26 (2.89)
11.99 (2.80)
13.19 (4.23)
11.89 (3.96)
Means (sd) for Task Accuracy with Gender
0 ms delay 800 ms delay 1600 ms delay
Task Accuracy Audio Audiovisual Audio Audiovisual Audio Audiovisual
Same-gender 97.62 (7.52)
96.43 (8.96)
92.06 (18.35)
91.29 (17.53)
96.84 (9.98)
95.24 (13.58)
Male-Female 91.67 (12.5)
100.00 (0.00)
94.44 (16.67)
100.00 (0.00)
92.63 (12.72)
100.00 (0.00)

159
Means (sd) for Percent Factoids Shared with Gender
0 ms delay 800 ms delay 1600 ms delay
Percent Factoids Shared
Audio Audiovisual Audio Audiovisual Audio Audiovisual
Same-gender 51.09 (22.88)
51.32 (19.66)
50.96 (19.30)
53.44 (20.51)
47.82 (18.99)
45.38 (18.69)
Male-Female 49.52 (18.87)
44.77 (12.16)
49.04 (20.38)
43.79 (16.26)
47.86 (18.57)
45.26 (18.71)
Means (sd) for Task Completion Time with Familiarity
0 ms delay 800 ms delay 1600 ms delay
Task Completion Time
Audio Audiovisual Audio Audiovisual Audio Audiovisual
Unfamiliar 13.54 (3.49)
11.96 (3.28)
13.42 (3.47)
14.56 (3.60)
13.48 (3.48)
12.69 (3.24)
Familiar 13.06 (2.88)
13.23 (4.42)
14.81 (2.74)
13.86 (3.08)
14.35 (3.56)
12.15 (4.00)
Means (sd) for Task Accuracy with Familiarity
0 ms delay 800 ms delay 1600 ms delay
Task Accuracy Audio Audiovisual Audio Audiovisual Audio Audiovisual Unfamiliar 97.50
(7.70) 100.00 (0.00)
97.50 (7.70)
96.25 (9.16)
98.33 (5.80)
96.25 (13.01)
Familiar 92.50 (12.08)
92.50 (12.08)
83.33 (26.93)
89.20 (22.85)
90.07 (15.99)
97.50 (7.91)
Means (sd) for Percent Factoids Shared with Familiarity
0 ms delay 800 ms delay 1600 ms delay
Percent Factoids Shared
Audio Audiovisual Audio Audiovisual Audio Audiovisual
Unfamiliar 50.60 (22.25)
50.49 (17.73)
49.61 (19.82)
49.78 (19.76)
47.58 (18.35)
44.41 (16.77)
Familiar 50.64 (20.82)
47.10 (18.47)
51.92 (19.17)
52.06 (20.01)
48.35 (19.87)
47.21 (22.02)

160
Subjective Measures – NASA TLX Overall Means (sd)
0 ms delay 800 ms delay 1600 ms delay
NASA TLX Data
Audio Audiovisual Audio Audiovisual Audio Audiovisual
Overall Workload
50.07 (18.54)
44.24 (18.08)
48.48 (19.04)
48.75 (16.86)
49.70 (17.32)
47.39 (19.14)
Mental Demand 277.67 (124.23)
244.0 (123.46)
265.08 (112.90)
271.08 (116.14)
263.83 (120.13)
253.58 (127.21)
Physical Demand
2.25 (5.78)
1.25 (3.00)
3.75 (9.94)
2.58 (7.67)
1.25 (4.08)
2.08 (6.97)
Temporal Demand
145.17 (106.66
130.42 (93.90)
146.67 (120.38)
141.83 (107.60)
157.50 (117.72)
138.42 (104.63)
Performance 91.83 (82.77)
75.58 (57.81)
82.33 (69.88)
82.17 (70.40)
78.75 (58.73)
89.00 (73.14)
Effort 188.17 (101.26)
174.75 (93.6)
167.5 (79.90)
189.25 (83.87)
187.0 (90.91)
172.42 (88.35)
Frustration 42.00 (74.22)
32.75 (49.97)
58.33 (90.16)
42.42 (77.44)
53.92 (77.90)
50.42 (73.72)
Means (sd) for Overall Workload with Gender
0 ms delay 800 ms delay 1600 ms delay
Overall Workload
Audio Audiovisual Audio Audiovisual Audio Audiovisual
Same-gender 50.03 (21.34)
45.37 (18.64)
49.41 (21.11)
50.24 (17.43)
47.99 (17.96)
48.16 (20.49)
Male-Female 50.17 (9.76)
41.60 (16.94)
46.33 (13.30)
45.28 (15.38)
53.67 (15.47)
45.59 (15.93)
Means (sd) for Mental Demand with Gender
0 ms delay 800 ms delay 1600 ms delay
Mental Demand
Audio Audiovisual Audio Audiovisual Audio Audiovisual
Same-gender 272.98 (133.99)
242.50 (122.46)
259.88 (120.24)
268.69 (110.25)
250.17 (124.77)
243.57 (130.68)
Male-Female 288.61 (100.38)
247.50 (129.29)
277.22 (95.64)
276.67 (132.11)
294.44 (105.48)
276.94 (118.94)

161
Means (sd) for Temporal Demand with Gender
0 ms delay 800 ms delay 1600 ms delay
Temporal
Demand
Audio Audiovisual Audio Audiovisual Audio Audiovisual
Same-gender 147.38 (115.58)
138.10 (99.35)
160.24 (126.09)
150.95 (112.51)
148.93 (108.19)
150.83 (114.06)
Male-Female 140.00 (85.03)
112.50 (79.41)
115.00 (102.24)
120.56 (94.69)
177.50 (138.78)
109.44 (73.14)
Means (sd) for Physical Demand with Gender
0 ms delay 800 ms delay 1600 ms delay
Physical Demand
Audio Audiovisual Audio Audiovisual Audio Audiovisual
Same-gender 3.10 (6.71)
1.55 (3.40)
4.76 (11.63)
3.45 (9.01)
1.67 (4.77)
2.86 (8.20)
Male-Female 0.28 (1.18)
.56 (1.62)
1.39 (2.87)
.56 (1.62)
.28 (1.18)
.28 (1.18)
Means (sd) for Performance with Gender
0 ms delay 800 ms delay 1600 ms delay
Performance Audio Audiovisual Audio Audiovisual Audio Audiovisual
Same-gender 97.74 (94.43)
81.79 (64.13)
91.31 (78.44)
89.05 (79.80)
80.36 (63.59)
95.12 (81.24)
Male-Female 78.06 (44.53)
61.11 (36.88)
61.39 (38.03)
66.11 (38.02)
75.00 (46.90)
74.72 (48.40)
Means (sd) for Effort with Gender
0 ms delay 800 ms delay 1600 ms delay
Effort Audio Audiovisual Audio Audiovisual Audio Audiovisual
Same-gender 187.14 (99.28)
185.12 (98.71)
170.83 (83.78)
198.33 (91.98)
193.57 (100.08)
182.74 (95.52)
Male-Female 190.56 (108.65)
150.56 (77.57)
159.72 (71.65)
168.06 (57.71)
171.67 (64.60)
148.33 (64.85)

162
Means (sd) for Frustration with Gender
0 ms delay 800 ms delay 1600 ms delay
Frustration Audio Audiovisual Audio Audiovisual Audio Audiovisual
Same-gender 37.74 (74.66)
28.45 (37.36)
51.55 (89.58)
41.67 (80.88)
42.38 (65.24)
42.74 (63.83)
Male-Female 51.94 (74.32)
42.78 (71.75)
74.17 (92.09)
44.17 (70.90)
80.83 (98.49)
68.33 (92.45)
Means (sd) for Overall Workload with Familiarity
0 ms delay 800 ms delay 1600 ms delay
Overall
Workload
Audio Audiovisual Audio Audiovisual Audio Audiovisual
Unfamiliar 49.04 (18.16)
42.66 (17.58)
45.55 (17.05)
46.01 (16.61)
47.62 (17.05)
46.51 (18.70)
Familiar 52.14 (19.61)
47.40 (19.11)
54.35 (21.79)
54.23 (16.40)
53.85 (17.54)
49.15 (20.38)
Means (sd) for Mental Demand with Familiarity
0 ms delay 800 ms delay 1600 ms delay
Mental
Demand
Audio Audiovisual Audio Audiovisual Audio Audiovisual
Unfamiliar 266.13 (124.05)
224.13 (124.29)
246.62 (109.24)
253.25 (110.71)
245.50 (117.78)
246.25 (130.73)
Familiar 300.75 (124.48)
283.75 (114.59)
302.00 (113.72)
306.75 (121.32)
300.50 (119.23)
268.25 (121.78)
Means (sd) for Temporal Demand with Familiarity
0 ms delay 800 ms delay 1600 ms delay
Temporal
Demand
Audio Audiovisual Audio Audiovisual Audio Audiovisual
Unfamiliar 125.12 (98.58)
121.13 (87.15)
121.63 (103.02)
111.38 (87.76)
145.88 (114.37)
126.00 (93.54)
Familiar 185.25 (113.33)
149.00 (106.04)
196.75 (138.75)
202.75 (119.51)
180.75 (123.82)
163.25 (122.74)

163
Means (sd) for Physical Demand with Familiarity
0 ms delay 800 ms delay 1600 ms delay
Physical
Demand
Audio Audiovisual Audio Audiovisual Audio Audiovisual
Unfamiliar 2.50 (6.30)
1.63 (3.47)
3.50 (9.95)
3.00 (8.97)
1.00 (3.04)
2.75 (8.39)
Familiar 1.75 (4.67)
0.50 (1.54)
4.25 (10.17)
1.75 (4.06)
1.75 (5.68)
0.75 (1.83)
Means (sd) for Performance with Familiarity
0 ms delay 800 ms delay 1600 ms delay
Performance Audio Audiovisual Audio Audiovisual Audio Audiovisual
Unfamiliar 87.50 (57.35)
77.88 (59.88)
90.88 (63.61)
82.00 (61.32)
77.25 (50.05)
96.50 (63.27)
Familiar 100.50 (120.02)
71.00 (54.62)
65.25 (79.99)
82.50 (87.56)
81.75 (74.54)
74.00 (89.67)
Means (sd) for Effort with Familiarity
0 ms delay 800 ms delay 1600 ms delay
Effort Audio Audiovisual Audio Audiovisual Audio Audiovisual
Unfamiliar 200.37 (101.58)
175.75 (91.52)
165.63 (84.56)
192.63 (80.22)
186.25 (91.65)
164.37 (79.33)
Familiar 163.75 (98.58)
172.75 (100.03)
171.25 (71.58)
182.50 (92.54)
188.50 (91.77)
188.50 (104.47)
Means (sd) for Frustration with Familiarity
0 ms delay 800 ms delay 1600 ms delay
Frustration Audio Audiovisual Audio Audiovisual Audio Audiovisual
Unfamiliar 50.75 (87.68)
33.50 (55.67)
50.00 (76.12)
46.50 (91.77)
54.88 (84.06)
57.37 (81.04)
Familiar 24.50 (28.97)
31.25 (37.27)
75.00 (113.61)
34.25 (35.03)
52.00 (65.84)
36.50 (55.59)
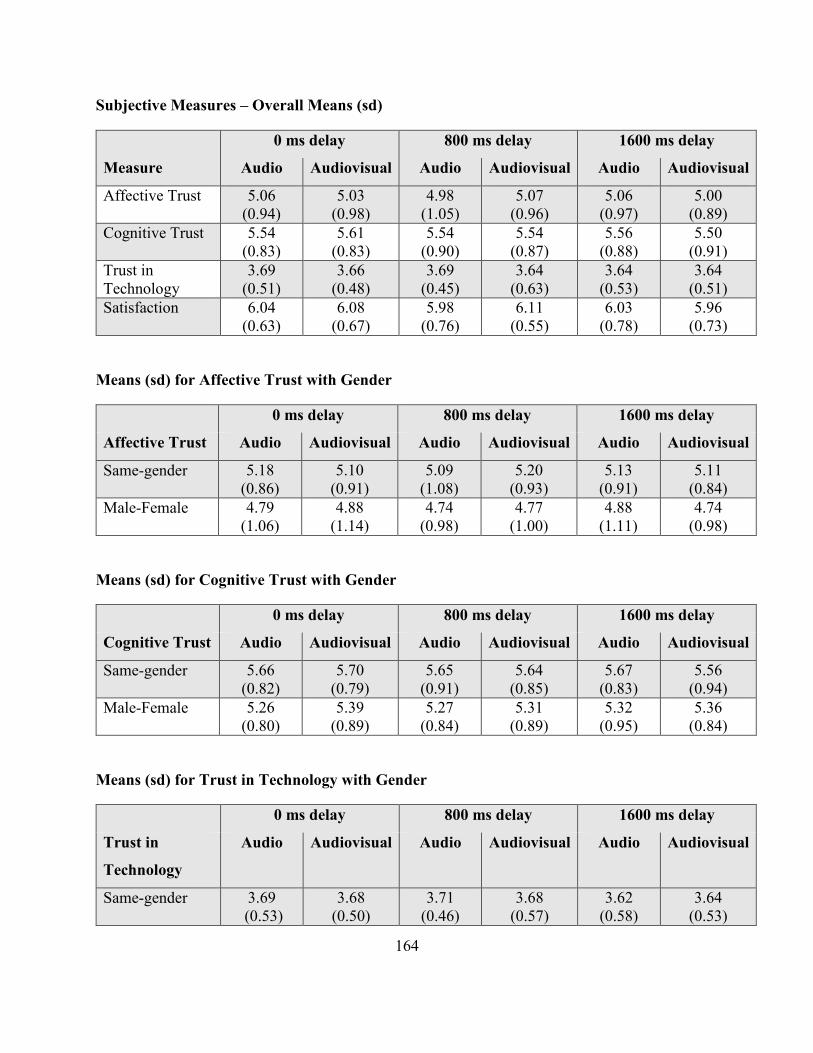
164
Subjective Measures – Overall Means (sd)
0 ms delay 800 ms delay 1600 ms delay
Measure Audio Audiovisual Audio Audiovisual Audio Audiovisual
Affective Trust 5.06 (0.94)
5.03 (0.98)
4.98 (1.05)
5.07 (0.96)
5.06 (0.97)
5.00 (0.89)
Cognitive Trust 5.54 (0.83)
5.61 (0.83)
5.54 (0.90)
5.54 (0.87)
5.56 (0.88)
5.50 (0.91)
Trust in Technology
3.69 (0.51)
3.66 (0.48)
3.69 (0.45)
3.64 (0.63)
3.64 (0.53)
3.64 (0.51)
Satisfaction 6.04 (0.63)
6.08 (0.67)
5.98 (0.76)
6.11 (0.55)
6.03 (0.78)
5.96 (0.73)
Means (sd) for Affective Trust with Gender
0 ms delay 800 ms delay 1600 ms delay
Affective Trust Audio Audiovisual Audio Audiovisual Audio Audiovisual
Same-gender 5.18 (0.86)
5.10 (0.91)
5.09 (1.08)
5.20 (0.93)
5.13 (0.91)
5.11 (0.84)
Male-Female 4.79 (1.06)
4.88 (1.14)
4.74 (0.98)
4.77 (1.00)
4.88 (1.11)
4.74 (0.98)
Means (sd) for Cognitive Trust with Gender
0 ms delay 800 ms delay 1600 ms delay
Cognitive Trust Audio Audiovisual Audio Audiovisual Audio Audiovisual
Same-gender 5.66 (0.82)
5.70 (0.79)
5.65 (0.91)
5.64 (0.85)
5.67 (0.83)
5.56 (0.94)
Male-Female 5.26 (0.80)
5.39 (0.89)
5.27 (0.84)
5.31 (0.89)
5.32 (0.95)
5.36 (0.84)
Means (sd) for Trust in Technology with Gender
0 ms delay 800 ms delay 1600 ms delay
Trust in
Technology
Audio Audiovisual Audio Audiovisual Audio Audiovisual
Same-gender 3.69 (0.53)
3.68 (0.50)
3.71 (0.46)
3.68 (0.57)
3.62 (0.58)
3.64 (0.53)

165
Male-Female 3.70 (0.49)
3.62 (0.46)
3.66 (0.44)
3.56 (0.74)
3.68 (0.42)
3.64 (0.48)
Means (sd) for Satisfaction with Gender
0 ms delay 800 ms delay 1600 ms delay
Satisfaction Audio Audiovisual Audio Audiovisual Audio Audiovisual
Same-gender 6.08 (0.59)
6.06 (0.69)
5.98 (0.83)
6.13 (0.55)
6.08 (0.80)
5.94 (0.78)
Male-Female 5.96 (0.71)
6.12 (0.63)
6.00 (0.60)
6.07 (0.55)
5.91 (0.74)
6.00 (0.61)
Means (sd) for Affective Trust with Familiarity
0 ms delay 800 ms delay 1600 ms delay
Affective Trust Audio Audiovisual Audio Audiovisual Audio Audiovisual
Unfamiliar 4.73 (0.78)
4.77 (0.85)
4.68 (0.83)
4.74 (0.84)
4.79 (0.80)
4.65 (0.71)
Familiar 5.73 (0.87)
5.57 (1.02)
5.59 (1.20)
5.73 (0.84)
5.60 (1.07)
5.72 (0.78)
Means (sd) for Cognitive Trust with Familiarity
0 ms delay 800 ms delay 1600 ms delay
Cognitive Trust Audio Audiovisual Audio Audiovisual Audio Audiovisual Unfamiliar 5.23
(0.72) 5.34
(0.76) 5.24
(0.83) 5.22
(0.80) 5.31
(0.81) 5.20
(0.85) Familiar 6.14
(0.70) 6.15
(0.69) 6.13
(0.73) 6.09
(0.61) 6.07
(0.79) 6.12
(0.68)
Means (sd) for Trust in Technology with Familiarity
0 ms delay 800 ms delay 1600 ms delay
Trust in
Technology
Audio Audiovisual Audio Audiovisual Audio Audiovisual
Unfamiliar 3.62 (0.49)
3.60 (0.47)
3.63 (0.44)
3.52 (0.63)
3.63 (0.50)
3.59 (0.49)
Familiar 3.84 (0.54)
3.79 (0.51)
3.82 (0.47)
3.89 (0.55)
3.67 (0.60)
3.73 (0.54)

166
Means (sd) for Satisfaction with Familiarity
0 ms delay 800 ms delay 1600 ms delay
Satisfaction Audio Audiovisual Audio Audiovisual Audio Audiovisual Unfamiliar 6.05
(0.67) 6.20
(0.51) 6.10
(0.54) 6.18
(0.55) 6.13
(0.64) 6.01
(0.65) Familiar 6.04
(0.53) 5.83
(0.86) 5.75
(1.05) 5.98
(0.53) 5.84
(1.01) 5.86
(0.88)