Understanding the Efficiency and Effectiveness of … as amended in 1979, introduced the concept of...
88
Understanding the Efficiency and Effectiveness of the Dispute Resolution System in South Africa: An Analysis of CCMA Data Haroon Bhorat Kalie Pauw Liberty Mncube [email protected] Development Policy Research Unit DPRU Working Paper 09/137 May 2009 ISBN Number: 978-1-920055-73-8
Transcript of Understanding the Efficiency and Effectiveness of … as amended in 1979, introduced the concept of...
Understanding the Efficiency and Effectiveness of the Dispute Resolution System in South Africa:
An Analysis of CCMA Data
Haroon BhoratKalie Pauw
Liberty [email protected]
Development Policy Research UnitDPRU Working Paper 09/137
May 2009ISBN Number: 978-1-920055-73-8
Abstract
This paper, while broadly located within reforming the labour market policy debate,
is specifically focused on one aspect of the labour regulatory regime, namely the dispute
resolution system. Hence, we attempt to understand the efficiency and effectiveness
of the country’s institutionalised dispute resolution body, the Commission for Conciliation,
Mediation and Arbitration (CCMA). A better and more informed understanding of the nature
of dispute resolution and its determinants, it would seem, remains central to any detailed
debate regarding labour market institutions in particular and labour market regulation in
general. Ultimately then, the study intends to empirically verify the patterns of dispute referral,
settlement and determination regionally, sectorally and historically. It should be noted at the
outset that this paper, possibly for the first time for South Africa, provides a detailed economic
and econometric analysis and interpretation of dispute resolution in the post-apartheid period.
Acknowledgement
This Working Paper is one in a series eminating from the Critical Research Projects funded
by the Department of Labour. This project was commissioned to the Development Policy
Research Unit (headed by Prof. Haroon Bhorat at the University of Cape Town) and the
Sociology of Work Unit (led by Prof. Eddie Webster at the University of the Witwatersrand)
under the auspices of the Human Sciences Research Council (let by Andre Kraak).
We would like to thank the Commission for Conciliation, Mediation and Arbitration (CCMA) for
access to their data. We are grateful to Nersan Govender abd Anthea Edwards for technical
support in accessing the data. We learnt a great deal from Nerine Kahn, Jeremy Daphne,
Afzul Soobedaar, Nersan Govender, Sabata Nakanyane and Kagiso Moleme who took part in
a roundtable discussion of an earlier draft. Thanks to Martin Wittenberg, Halton Cheadle and
Paul Benjamin for their helpful comments. We have also benefited from a SALDRU seminar
presentation at the University of Cape Town.
Development Policy Research Unit Tel: +27 21 650 5705Fax: +27 21 650 5711
Information about our Working Papers and other published titles are available on our website at:http://www.dpru.uct.ac.za/
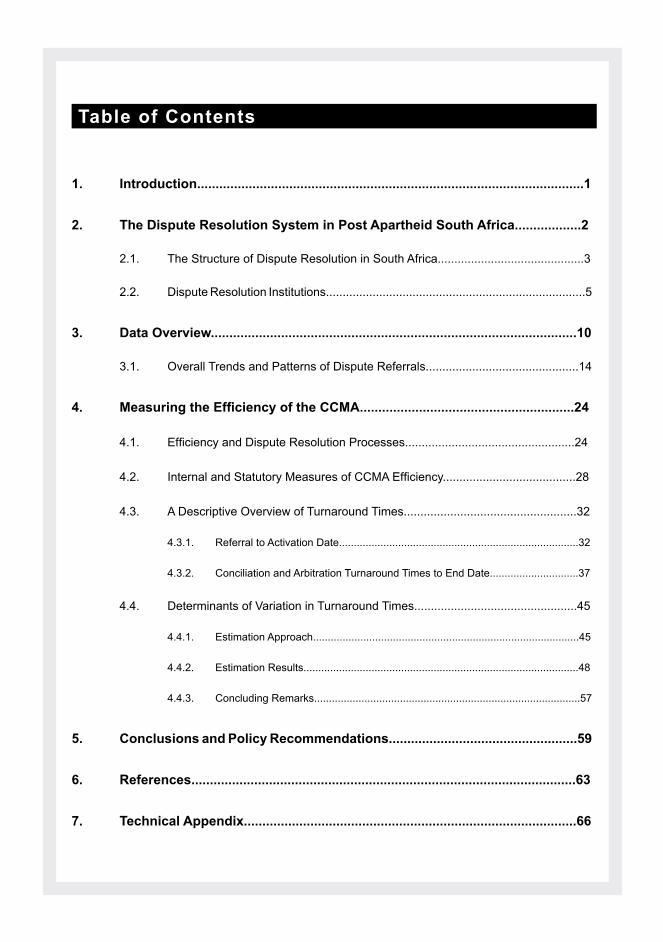
Table of Contents
1. Introduction.........................................................................................................1
2. The Dispute Resolution System in Post Apartheid South Africa..................2
2.1. The Structure of Dispute Resolution in South Africa............................................3
2.2. Dispute Resolution Institutions..............................................................................5
3. Data Overview...................................................................................................10
3.1. Overall Trends and Patterns of Dispute Referrals..............................................14
4. MeasuringtheEfficiencyoftheCCMA..........................................................24
4.1. Efficiency and Dispute Resolution Processes...................................................24
4.2. Internal and Statutory Measures of CCMA Efficiency........................................28
4.3. A Descriptive Overview of Turnaround Times....................................................32
4.3.1. Referral to Activation Date.................................................................................32
4.3.2. Conciliation and Arbitration Turnaround Times to End Date..............................37
4.4. Determinants of Variation in Turnaround Times.................................................45
4.4.1. Estimation Approach..........................................................................................45
4.4.2. Estimation Results.............................................................................................48
4.4.3. Concluding Remarks..........................................................................................57
5. Conclusions and Policy Recommendations...................................................59
6. References........................................................................................................63
7. Technical Appendix..........................................................................................66
Understanding the Efficiency and Effectiveness of the Dispute Resolution System in South Africa: An Analysis of CCMA Data
1
1. Introduction
While the economic growth performance in the first decade of democracy continues to be
justifiably lauded, severe and seemingly intractable welfare challenges remain. Nowhere is this
welfare need more acute than within the area of labour markets. An economy characterised
by one of the highest unemployment rates in the world – officially at 22.7 per cent and 35.6
per cent when discouraged workers are included – is a stark reminder of the post-apartheid
economy’s challenge going forward. In turn, however, the difficulties noted above within the
labour market, have placed the idea of labour market reform – in particular labour regulatory
reform – high on the agenda of pertinent policy issues in South Africa. A combination of the
intrinsic nature of these issues and the fact that the society is characterised by a strong, vocal
trade union movement – has meant that reforming the labour market has become a highly
contested policy issue in South Africa.
This paper, while broadly located within this policy debate, is specifically focused on one
aspect of the labour regulatory regime, namely the dispute resolution system. Hence, we
attempt to understand the efficiency and effectiveness of the country’s institutionalised dispute
resolution body, the Commission for Conciliation, Mediation and Arbitration (CCMA). A better
and more informed understanding of the nature of dispute resolution remains central to any
detailed debate regarding labour market institutions in particular and labour market regulation
in general. Ultimately then, the study intends to empirically verify the patterns of dispute
referral, settlement and determination regionally, sectorally and historically. It should be noted
at the outset that this paper reflects, very overtly, on economic analysis and interpretation of
dispute resolution in South Africa.
The paper begins with a non-legalistic overview of the dispute resolution system in place for
labour market disputes (Section 2). Section 3 introduces the data and briefly discusses the
overall trends of CCMA dispute resolution. Section 4 provides a detailed empirical analysis of
the patterns of dispute resolution with the aim of understanding the main drivers of efficiency
of the dispute resolution system in South Africa, followed by a multivariate analysis of dispute
resolution. Section 5 draws general conclusions. A Technical Appendix with additional data
descriptions, tables and figures is also attached.
DPRU WP 09/137 Haroon Bhorat, Kalie Pauw & Liberty Mncube
2
2. The Dispute Resolution System in Post Apartheid South Africa
The first legislation in South Africa to comprehensively establish mechanisms for dispute
resolution was the Industrial Conciliation Act of 1924. This Act excluded African employees,
and was established primarily to resolve disputes of interest. Interest disputes are disputes
about the creation of new rights, for example, wage increases and new conditions of
employment. Such disputes emerge out of a failure in collective bargaining. These disputes
of interest were referred to industrial councils or conciliation boards for conciliation. Disputes
of rights had to be referred to ordinary courts. Rights disputes are disputes concerning the
violation of or interpretation of an existing right, for example, a dispute over underpayment
under a contract or an industrial council agreement or an interdict flowing from an unprotected
strike or lockout. The Industrial Conciliation Act of 1924 was amended in 1937 and again in
1956. The 1956 Industrial Conciliation Act created an industrial tribunal to arbitrate disputes
although it was limited to job reservation disputes and not all labour disputes.
In the early 1970s under increasing suppression at the workplace, almost as a subset of
broader political oppression, urbanised African workers in Durban expressed their opposition in
the form of wildcat strikes. One consequence of the strikes among others was the appointment
of the Wiehahn Commission in 1977. The commission’s brief was to revisit the country’s
labour legislation. Many of the Commission’s recommendations were accepted and as a
consequence the Industrial Conciliation Act of 1956 was amended and renamed the Labour
Relations Act (LRA). The exclusion of Africans from the LRA of 1956 was removed. The
LRA as amended in 1979, introduced the concept of ‘unfair labour practice’ and charged the
Industrial court with adjudicating unfair labour practices.1
The adoption of the 1956 LRA resulted in a narrowly focused labour relations system, limited
to a competition between management and labour. The system was not only procedurally
complex but also administratively burdensome.2 Within the spirit of South Africa’s negotiated
political settlement, the LRA of 1995 replaced the 1956 LRA. Among the intended purposes
of the new LRA was the promotion of an effective and efficient labour dispute resolution
system in order to overcome the lengthy delays, to save on costs and to reduce the incidence
1 See Van Niekerk (2005) and Cheadle (2006) for the dubious heritage of the concept of unfair labour practice which was introduced as a necessary protective mechanism for White workers.
2 The merits of a dispute where often lost in procedural and legal technicalities. See also the discussion on Labour Law available at http://www.legalcitator.co.za accessed on 25/11/2006.
Understanding the Efficiency and Effectiveness of the Dispute Resolution System in South Africa: An Analysis of CCMA Data
3
of industrial action which characterised the apartheid dispensation. This marked a new era
for South Africa as the labour relations system moved ostensibly from confrontation to co-
operation.3
2.1. The Structure of Dispute Resolution in South Africa
The 1995 LRA regulates individual and collective employment relations. It created the
institutions and processes for dispute resolution. These institutions include the Commission
for Conciliation, Mediation and Arbitration (the CCMA) and the Labour Courts (the Labour
Court and the Labour Appeal Court). The CCMA has the power to licence Private Agencies
and Bargaining Councils to perform any or all of its functions. This allows parties in dispute
the choice of which institutions to assist them although the Bargaining Council where it
exists for parties is always the first institution of engagement and if there is no Bargaining
Council then the CCMA has jurisdiction. Figure 1 shows the structure of the dispute resolution
system.4 If there is a deadlock in a dispute at the firm level, the parties to a dispute must
refer their dispute to conciliation. The procedure of processing disputes takes into account the
different kinds of labour disputes. The process makes a specific distinction between disputes
of interests and disputes of rights. This classification of labour disputes is important because
it determines which resolution technique to use in resolving the dispute. The use of industrial
action in relation to interest disputes is considered appropriate as a method of last resort (see
Figure 1).
3 However, as noted by Cheadle (2006) and others, the adversarilsm inherited from the pre-1994 industrial relations era continues to be a strong feature of the labour regulatory environment in South Africa.
4 The structure of dispute settlement systems is normally designed to promote collective bargaining, for example by requiring the parties to exhaust all the possibilities of reaching a negotiated solution or to exhaust the dispute settlement procedures provided for by their collective agreement before having access to State provided procedures ( ILO 2001).

Understanding the Efficiency and Effectiveness of the Dispute Resolution System in South Africa: An Analysis of CCMA Data
4
Figure 1: The Structure of Dispute Resolution System in South Africa5
Intra-Firm Dispute Resolution Process
Deadlock
Mediation/Conciliation
• CCMA
• Bargaining Councils
• Private Agencies
Rights Disputes (Existing Rights)
• CCMA
• Bargaining Councils
• Private Agencies
Arbitration
Industrial Action Adjudication
Interests Disputes (New Rights)
• Labour Court
• Labour Appeal Court
If essential service
As shown in Figure 1, the LRA provides for the determination of disputes of right through
adjudication by the Labour Courts or arbitration either by the CCMA, private dispute resolution
institutions or Bargaining Councils. In all cases, disputes have to be conciliated before they
can proceed to arbitration or adjudication.6 Conciliation involves the use of a neutral or
acceptable third party to assist parties to arrive at a mutually acceptable, enforceable and
binding solution (Bosch et al, 2004). Disputes of interest, as is clear in Figure 1, if not resolved
at the conciliation phase are then prone (unless an essential service activity) to strike action
or lock outs although they seldom occur. If disputes of rights are not resolved at conciliation,
they are referred to either arbitration or adjudication. The reason for why some disputes go
to arbitration and others go to adjudication in the Labour Courts is the public policy aspect of
certain kinds of disputes (for example, retrenchments). Hence, issues which could affect public
policy fall under the jurisdiction of the Labour Court.
5 This is a simplified structure of the dispute resolution system in South Africa.
6 After conciliation disputes of rights are normally referred to arbitration on the request of the referring party, only in certain cases, such as unfair discrimination and automatically unfair disputes will a dispute be referred to the Labour Court.

DPRU WP 09/137 Haroon Bhorat, Kalie Pauw & Liberty Mncube
5
Arbitration refers to a process of settling disputes through the use of an impartial third party.
However, unlike conciliation, in which the neutral third party facilitates the settling of a dispute
by helping parties to find common ground, an arbitrator settles the disputes by making a final
and binding decision. The LRA allows under certain strict conditions that the decision can be
reviewed at the Labour Court.7 Adjudication on the other hand refers to the legal process of
settling a dispute. In what follows we briefly discuss the dispute resolution institutions, currently
prevalent in South Africa.
2.2. Dispute Resolution Institutions
a) CCMA
The LRA establishes the CCMA as a statutory but independent body, although it is funded
by the state. The primary function of the CCMA is to conciliate and arbitrate disputes. These
are disputes referred to the CCMA in terms of the LRA and other labour statutes such as the
Basic Conditions of Employment Act of 1997 (BCEA), Employment Equity Act of 1998 (EEA),
the Skills Development Act of 1998 and the Unemployment Insurance Act of 2001 (UIF).8 The
CCMA is also required to compile and publish information and statistics about its work.9
As shown in Figure 1, not all disputes go to the CCMA. For example, cases where an
independent contractor is involved;10 cases that do not deal with an issue in the LRA or
Employment Equity Act; where a bargaining council exists for that sector; where a private
agreement exists for resolving disputes, and so on, would do not go to the CCMA.11 Initially
the LRA limited access to the CCMA to individuals employed under a common law contract
of employment. The 2002 amendments of the LRA extended labour law protection to more
7 This has been effectively undermined recently. The Labour Court’s power to review the CCMA awards is now the same as any other administrative review.
8 See Du Toit et al.(2003).9 If requested, the CCMA may advise a party to a dispute about the procedures to follow, or assist a party to a dispute to obtain
legal advice or representation and may provide advice and training on establishing collective bargaining institutions. 10 If the ‘employee’ is an independent contractor then the reason why it goes to the other courts is because it is not a labour matter
like all other non-labour matters. If however there is a dispute over whether or not the employee is an independent contractor or not, then it will be heard by the CCMA – to determine just that.
11 CCMA available at http://www.ccma.org.za accessed on the 12/01/2007. The amendment, however, only applied to the following disputes: dismissal and unfair labour practice disputes relating to probation; dismissal disputes relating to conduct and capacity (excluding dismissal arising from participation in an unprotected strike); constructive dismissal; dismissal where the employee does not know the reason for the dismissal and unfair labour practices.
Understanding the Efficiency and Effectiveness of the Dispute Resolution System in South Africa: An Analysis of CCMA Data
6
vulnerable workers. The first step in all disputes is referral to conciliation. If a dispute has
been properly referred, the CCMA will appoint a commissioner to attempt to resolve it.12
The commissioner is required to resolve the dispute within 30 days of its referral date.
The commissioner determines the process to attempt to resolve the dispute. No legal
representation is allowed in conciliation proceedings.13 At the end of the conciliation
proceedings, the commissioner issues a certificate stating whether or not the dispute has been
resolved.
Arbitration proceedings are more formal than conciliation. If there is a request for arbitration,
the CCMA will appoint a commissioner. The commissioner hearing the dispute makes a
decision which in most cases is final, binding and may be made an order of the Labour Court.
The drafters of the LRA of 1995 made the conscious decision that there should be no right
of appeal against arbitration awards issued by CCMA commissioners (see Young, 2004).
They did agree, however, that a party to arbitration proceedings who was dissatisfied with the
outcome of these proceedings could approach the Labour Courts to review the award.
The 2002 amendments of the LRA place the matter of representation in arbitration in the
hands of the CCMA. It is sometimes argued that the CCMA has not created proper rules
relating to the right of representation as was intended by the enabling legislation and this
has created a loophole allowing an unrestricted right to representation before the CCMA
(see Collier, 2003). However, the CCMA rejects this interpretation stating that representation
at the CCMA remains as it was prior to the 2002 amendments. The 2002 amendments of
the LRA institutionalised the process of con-arb as another means of dispute resolution.14
The con-arb process is intended to be a “one sitting” process that has “two steps”, that
is, conciliation followed by arbitration, if conciliation is not successful (CCMA, 2007). The
con-arb is governed by the same rules as conciliation and arbitration. Legal representation
is not allowed in the conciliation stage of the con-arb process but may be permitted at the
arbitration stage. The legislation allows for parties to object to the same commissioner who
conducted the conciliation phase to arbitrate the matter if the dispute is not resolved at the
12 For example, a dispute concerning unfair dismissals must be referred within 30 days of the date of dismissal, while an unfair labour practice dispute must be referred within 90 days of the date of the alleged unfair labour practice. With discrimination cases, a period of six months is permitted.
13 Rule 25 (1) of the rules of conduct of Proceedings before the CCMA deals with representation at conciliation hearings.14 In 2002, section 191(5A) of the 1995 LRA was amended and the con-arb (conciliation-arbitration) process was formally introduced
into the LRA.

DPRU WP 09/137 Haroon Bhorat, Kalie Pauw & Liberty Mncube
7
conciliation stage.15 The purpose of the con-arb is to avoid the delay between the conciliation
and arbitration hearings and thus, reduce the costs of these processes.
Molahlehi (2005) points out that there is a consensus between academic writers and
practitioners that the success of the new dispensation and the CCMA lies in the fact that
workplace justice has now been made more accessible and less costly for unskilled workers.16
The absence of a requirement for formal pleadings and complicated referral procedures are
one of the successful features that make the CCMA more accessible. This simplicity of the
processes is often cited as an important factor in making the CCMA accessible to a large
number of workers. For example, it has ensured that literacy, lack of skills and resources are
not hindrances preventing entry to the system. However, the ease of access to the CCMA has
also meant that the private cost of formalising a dispute, irrespective of the issue, is at the
conciliation stage, zero. In this respect then, many observers have argued that the rapid rise in
cases before the CCMA may reflect these zero entry costs.
In spite of these achievements, the CCMA faces several challenges. For example, as
Ngcukaitobi (2004) argues, the CCMA has not been able to resolve disputes as expeditiously
as had been hoped at the time of its establishment. Brand (2000) suggests that the difficulties
experienced by the CCMA are due to financial and human resource constraints.17 Resource
constraints also impact on the quality of the administrative service provided by the CCMA.
Furthermore, as indicated by Molahlehi (2005) the CCMA commissioners in the process
of narrowing issues, are under immense case load pressure and the need to meet case
efficiencies. The daily efficiencies for commissioners are: two con-arbs per day, three
conciliations per day, two arbitrations per day, four in limines per day or four rescissions per
day.18 Based on these efficiency parameters, some have argued that this may, in some cases
lead to hasty settling of disputes and possibly also in superficial settlements which fail to
address the underlying causes of conflict or the real needs of the parties.
15 Different commissioners can conciliate and arbitrate at con-arb, and this is in fact encouraged. According to Molahlehi (2005) the number of objections to the con arb process has become a major challenge to the CCMA because a party may object to the con arb for no apparent reason if not only to frustrate the other party attempt at a speedy resolution of the dispute
16 This is supported by Brand (2000) who reports that the CCMA has proved to be cheap and accessible to workers at the point of entry.
17 A lack of resources leads to limited opportunities for training. Brand (2000) further indicates that caseload pressure has now forced less experienced and qualified commissioners to arbitrate. See also Roskam (2006), Cheadle (2006) and Benjamin (2006).
18 See Molahlehi (2005). A in Iimine hearing is a hearing on a specific legal point, which takes place before the actual case refered, can be heard. It is meant to address technical legal points, which are raised prior to getting into the merits of the case and relates to matters of jurisdiction (see http://www.ccma.org.za accessed on the 20/01/2007).
Understanding the Efficiency and Effectiveness of the Dispute Resolution System in South Africa: An Analysis of CCMA Data
8
b) Bargaining Councils
Bargaining Councils are joint employer and union bargaining institutions whose functions
and powers are set out in the LRA. One of the LRA’s main objectives is to promote collective
bargaining as a means of regulating relations between management and labour and as a
means of settling disputes between them. A Bargaining Council has the responsibility to
resolve disputes between parties that arise from the collective agreements concluded in the
council and other statutory instruments. Bargaining Council agreements deal with issues such
as minimum wages, hours of work, overtime, leave pay, notice periods, and retrenchment
pay. A bargaining council does not need to be accredited with the CCMA to perform dispute
resolution services regarding parties to that council. According to Brand (2002) if a bargaining
council applies to the CCMA for accreditation the CCMA may, as a term of accreditation,
give council conciliators similar powers to CCMA conciliators. There are currently about 55
Bargaining Councils in South Africa. Their jurisdiction may be sectoral, regional or industry-
wide and hence they vary in size and quality of dispute resolution. One of the main criticisms
aimed at bargaining councils is that they are fragmented in nature and poorly resourced.19
c) Private Dispute Resolution Agencies
The Independent Mediation Service of South Africa (IMSSA) was the first private dispute
resolution agency that specialised in labour disputes of importance. It was formed in 1984
and set out to provide mediation arbitration services that were more expeditious, informal
and less adversarial in nature than the courts (see Bosch et al 2004). In 2000 IMSSA closed
down and Tokiso Dispute Settlement was formed to fill the gap. Since then, Tokiso has grown
to be the largest and most active private dispute resolution service in South Africa. The
CCMA has however, not accredited private agencies, despite the demand for private dispute
resolution services by agencies such as Tokiso. There is an urgent need therefore, to accredit
private dispute resolution agencies in order to afford parties to a dispute the choice of which
institutions to assist them.
d) Labour Courts
The LRA establishes the Labour Court as a court of law and equity. It has jurisdiction in all
provinces. The Labour Court can hear contractual or BCEA or EEA disputes without going
through conciliation first. It can interdict strikes and lockouts without prior conciliation. If there
19 However, this is a generalisation may not apply to all Bargaining Councils, for example the Motor, Metal and Public Sector Bargaining Councils would not necessarily fit this description.
DPRU WP 09/137 Haroon Bhorat, Kalie Pauw & Liberty Mncube
9
is perfect conciliation, then not many cases will actually be referred to the Labour Court.20
The Labour Appeal Court is the court of final appeal in respect of labour disputes. The LRA
created the Labour Courts to deal with complex labour issues. The Labour Courts have found
it difficult to attract sufficient judges of high calibre in the field of labour law. This has resulted in
the over-reliance on acting judges, some of whom have little experience in labour law (see the
discussion by Roskam (2006), Cheadle (2006) and Benjamin (2006) for the nature and extent
of this challenge). In addition, Benjamin (2006) points out that, it was thought that the Labour
Courts would exercise a supervisory authority over the CCMA. However, this has not occurred
given that both the CCMA and Labour Courts have had huge case loads and that the Labour
Courts suffer from significant levels of inefficiency due to their human resource constraints.21
We should note that there is an ongoing judicial review process which is examining the role
and responsibilities of specialist courts, such as the Labour Courts and the Labour Appeals
Courts.
20 The Labour Court’s primary tasks are to: adjudicate disputes relating to freedom of association (union- and employer- organisation membership); adjudicate automatically unfair dismissals including dismissals arising out of operation requirements (that is, redundancy/retrenchment matters) as well as strike disputes; review CCMA arbitration awards (Bhoola, 2002).
21 For a thorough review of the Labour Courts and the Labour Appeal Court see Benjamin (2006).

Understanding the Efficiency and Effectiveness of the Dispute Resolution System in South Africa: An Analysis of CCMA Data
10
3. Data Overview
The current labour legislation and dispute resolution processes in South Africa have recently
become the focus on an intense national policy debate on labour market policy. An analysis
of the effectiveness and efficiency of the dispute resolution system is therefore important. It is
estimated that some 72 per cent of the employed in South Africa fall under jurisdiction of the
CCMA (Van Niekerk, 2006). Hence, this institution also manages the majority of disputes that
arise in the labour market. It is therefore appropriate to use the CCMA’s Case Management
System (CMS) database as the main data source for the analysis, as this database represents
a large majority of disputes that are formally heard in South Africa.
The CMS is a national database that has been in use since the establishment of the CCMA
in 1996/97.22 It is a live database capturing case details for every case referred to the CCMA,
whether the case falls within jurisdiction of the CCMA or not. For all cases, general information
about the case is captured, which is mostly administrative in nature. This includes the types of
disputes, the regional CCMA office to which the dispute was referred, as well as the processes
followed to reach an agreement (for example, pre-conciliation, conciliation, arbitration and so
on). Limited information about the parties involved is also included, for example, the sector of
employment and names of parties.23
Throughout the dispute resolution process, various target dates are captured. These dates
are used to calculate various turnaround times24 for dispute resolution. Dates captured include
the date on which the dispute arose, the date on which it was referred to the CCMA, and
the date on which the case was activated by the CCMA. If a case is unresolved after the
conciliation phase, the arbitration referral date is also captured. The date on which conciliation
and arbitration cases are concluded is also captured, while in the case of arbitration awards
being made at a later stage, an arbitration award date is captured. At various stages along the
22 The CCMA’s financial year stretches from 1 April to 31 March of every year. The periods of analysis correspond to the financial years rather than calendar years.
23 Unfortunately the CMS data does not capture skills or occupation types of workers in much detail. The sector of employment is known, while some specific occupation types such as security personnel, domestic workers and agricultural workers are captured. Beyond that it is impossible to determine the skills level or income level of parties to a dispute.
24 The CCMA uses the notion of ‘turnaround time’ in very specific contexts. In particular, two types of ‘operational’ turnaround times are calculated and reported regularly as an internal measure of efficiency, namely conciliation turnaround times and arbitration turnaround times. Later in this study we also calculate various turnaround times associated with specific types of processes (that is, conciliation and arbitration), but these may differ slightly from the CCMA’s internal estimates. See further discussions in Section 4.4.

DPRU WP 09/137 Haroon Bhorat, Kalie Pauw & Liberty Mncube
11
process information is added, for example the number of hearings that have taken place up
to that point, the current process at which the dispute was resolved, and so on. In the case of
arbitration cases there is information on whether the award was in favour of the employer or
employee, and, if applicable, an award amount.
The analysis by Benjamin and Gruen (2006) included CMS data for the periods 2001/02,
2003/04 and 2004/05, since, as they argue, these years span important events in the history
of dispute resolution and the labour market. These events include amendments to the Labour
Relations Act which came into effect on 1 August 2002, altering the operation of the CCMA and
introducing a new set of CCMA rules. Also important are the various sectoral determinations
introduced in 2002 under the Basic Condition of Employment Act. These determined minimum
wages for domestic and farm workers. The Unemployment Insurance Act of 2001 came into
effect on 1 April 2002. These events, it was argued, may have impacted on the labour market
and on the prevalence and nature of labour market disputes, hence it is important to analyse
the ‘before’ and ‘after’ data.
Since the publication of Benjamin and Gruen’s (2006) paper, the CMS data for 2005/06
had also become available and is included in the analysis for this project. In order to allow
analyses using a pooled dataset spanning the entire period from 2001/02 to 2005/6, we also
include the 2002/03 CMS data. The CCMA also publishes an Annual Report that is used as
an additional data source in this study. An internal document called the Review of Operations
is also produced annually. The latter is not usually available to the general public, but was
obtained for the purpose of this study. The Review of Operations is very useful for gaining an
understanding of the internal and statutory operational efficiency measures that are in place
at the CCMA. Essentially the Review of Operations is a twelve-month summary of the CCMA
internal and statutory measures of efficiencies that are produced on a monthly basis.
As noted, roughly 72 per cent of the formal workforce (including agricultural and domestic
workers) fall under jurisdiction of the CCMA. The remainder fall under jurisdiction of Bargaining
Councils. By examining only the CMS datasets we are therefore, in reality, working with a
restricted sample of disputes. Hence, it is important not to make too strong conclusions about
the dispute resolution system in general based solely on this data.25 Preliminary estimates
25 An analysis of Bargaining Council data falls beyond the scope of this study, but may add value if included in follow-up studies. At the time of this research being conducted we were unable to obtain fully comparable datasets for all the Bargaining Councils.

Understanding the Efficiency and Effectiveness of the Dispute Resolution System in South Africa: An Analysis of CCMA Data
12
by the DPRU26 of Bargaining Council ‘coverage’ suggest that 40 per cent of craft and trade
workers and 35 per cent of operators and assemblers (see Table 1, as well as the more
detailed Figure 8 in the Appendix) fall under jurisdiction of Bargaining Councils. Given that, on
average, about 28 per cent of workers fall under jurisdiction of Bargaining Councils it is evident
that a disproportionate share of blue-collar workers fall under the Bargaining Council system.
The CCMA, on the other hand, is the only dispute resolution institution that covers domestic
workers and agricultural workers27, both of which are occupation types that often have very
unique characteristics, particularly due to seasonal employment trends and the informal nature
of contracts. At the other end of the internal labour market ladder, the CCMA covers a higher
share of skilled, formal sector employees. Again, on the basis of Table 1 it should be clear that
the CCMA coverage is relatively higher at the two extremes of the skills spectrum.28 Hence, it
is evident that while we are not overly concerned about the ‘representativity’ of the CCMA data,
it remains important to bear in mind that skills and sectoral differences between the CCMA
and Bargaining Councils may render the representativity of our conclusions on the dispute
resolution system for South Africa imperfect.
26 This forthcoming DPRU study (Van der Westhuizen and Goga, 2007) from which estimates of Bargaining Council coverage is obtained investigates wage differentials between Bargaining Council and non-Bargaining Council workers.
27 The ten per cent Bargaining Council coverage for ‘agricultural, forestry and fisheries workers’ presumably include mainly forestry and fisheries workers, although it may also include respondents defining themselves as agricultural workers but are perhaps employed in economic sectors covered by Bargaining Councils.
28 The high Bargaining Council coverage for professional workers is interesting. This is presumably because this category includes ‘technical’ workers, many of who are employed in manufacturing industries that also have a high Bargaining Council coverage rate (see Figure 8 in the Appendix).

DPRU WP 09/137 Haroon Bhorat, Kalie Pauw & Liberty Mncube
13
Table 1: CCMA and Bargaining Council Coverage by Main Occupation Groups
CCMA Share BC Share TotalManagerial 743,458 99% 4,774 1% 748,232Professional 904,133 55% 747,177 45% 1,651,311Clerical 883,944 77% 263,842 23% 1,147,786Service 791,684 67% 393,334 33% 1,185,018Craft & Trade 706,043 60% 463,908 40% 1,169,951Operators & Assembler 650,499 65% 344,820 35% 995,319Elementary 1,200,867 75% 390,212 25% 1,591,078Agriculture & Fishing 68,093 90% 7,769 10% 75,862Domestic Workers 858,219 100% 1,042 0% 859,261Total “formal” employment (*)
6,806,939 72% 2,616,878 28% 9,423,817
Note: This table includes selected items from the more comprehensive Figure 8 in the Appendix. The assumption here is that those workers that do not fall under jurisdiction of Bargaining Councils (as mapped by Van der Westhuizen and Goga, 2007), fall under jurisdiction of the CCMA. The estimate for total ‘formal’ employment includes agricultural and domestic workers also in non-formal employment contracts.
A further important issue to take note of is the type of labour market disputes referred to the
CCMA. Table 2 shows the distribution of all referrals across different types of disputes as
reported in the CMS database between 2001/02 and 2005/06. There are four main types of
disputes or “genuine disputes” as Benjamin and Gruen (2006:10) refer to them:
• Unfair dismissal disputes: These include termination of contracts without notice,
dismissals relating to incapacity, misconduct, pregnancy or operational requirements
(mainly redundancies), and constructive dismissals. The latter occurs when an
employer deliberately makes the work environment unbearable for an employee, thus
forcing her to resign.
• Unfair labour practice disputes: This includes a variety of ‘general’ discrimination
disputes, as well as unfair suspension or discipline and unfair conduct relating to
promotion, demotion or training.
• Mutual interest: Disputes arising when employers and employees have mutual interests.
• Severance pay: This includes instances where a dismissal is deemed fair (for example,
operational requirements) but employees feel that they have been treated unfairly with
respect to severance pay packages offered.
Understanding the Efficiency and Effectiveness of the Dispute Resolution System in South Africa: An Analysis of CCMA Data
14
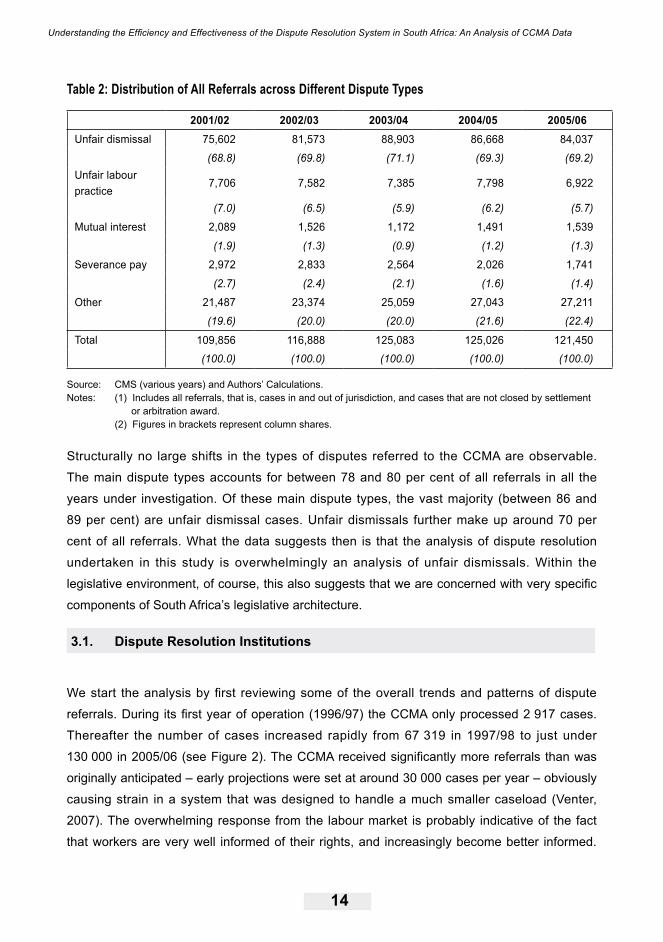
Table 2: Distribution of All Referrals across Different Dispute Types
2001/02 2002/03 2003/04 2004/05 2005/06Unfair dismissal 75,602 81,573 88,903 86,668 84,037
(68.8) (69.8) (71.1) (69.3) (69.2)Unfair labour practice
7,706 7,582 7,385 7,798 6,922
(7.0) (6.5) (5.9) (6.2) (5.7)
Mutual interest 2,089 1,526 1,172 1,491 1,539
(1.9) (1.3) (0.9) (1.2) (1.3)
Severance pay 2,972 2,833 2,564 2,026 1,741
(2.7) (2.4) (2.1) (1.6) (1.4)
Other 21,487 23,374 25,059 27,043 27,211
(19.6) (20.0) (20.0) (21.6) (22.4)
Total 109,856 116,888 125,083 125,026 121,450 (100.0) (100.0) (100.0) (100.0) (100.0)
Source: CMS (various years) and Authors’ Calculations.Notes: (1) Includes all referrals, that is, cases in and out of jurisdiction, and cases that are not closed by settlement or arbitration award. (2) Figures in brackets represent column shares.
Structurally no large shifts in the types of disputes referred to the CCMA are observable.
The main dispute types accounts for between 78 and 80 per cent of all referrals in all the
years under investigation. Of these main dispute types, the vast majority (between 86 and
89 per cent) are unfair dismissal cases. Unfair dismissals further make up around 70 per
cent of all referrals. What the data suggests then is that the analysis of dispute resolution
undertaken in this study is overwhelmingly an analysis of unfair dismissals. Within the
legislative environment, of course, this also suggests that we are concerned with very specific
components of South Africa’s legislative architecture.
3.1. Dispute Resolution Institutions
We start the analysis by first reviewing some of the overall trends and patterns of dispute
referrals. During its first year of operation (1996/97) the CCMA only processed 2 917 cases.
Thereafter the number of cases increased rapidly from 67 319 in 1997/98 to just under
130 000 in 2005/06 (see Figure 2). The CCMA received significantly more referrals than was
originally anticipated – early projections were set at around 30 000 cases per year – obviously
causing strain in a system that was designed to handle a much smaller caseload (Venter,
2007). The overwhelming response from the labour market is probably indicative of the fact
that workers are very well informed of their rights, and increasingly become better informed.
DPRU WP 09/137 Haroon Bhorat, Kalie Pauw & Liberty Mncube
15
Since about 2002/03 the caseload has remained between about 120 000 and 130 000 cases
per year. The number of cases even declined marginally between 2004/05 and 2005/06.
Whether the caseload will remain stable at these levels, remains to be seen.
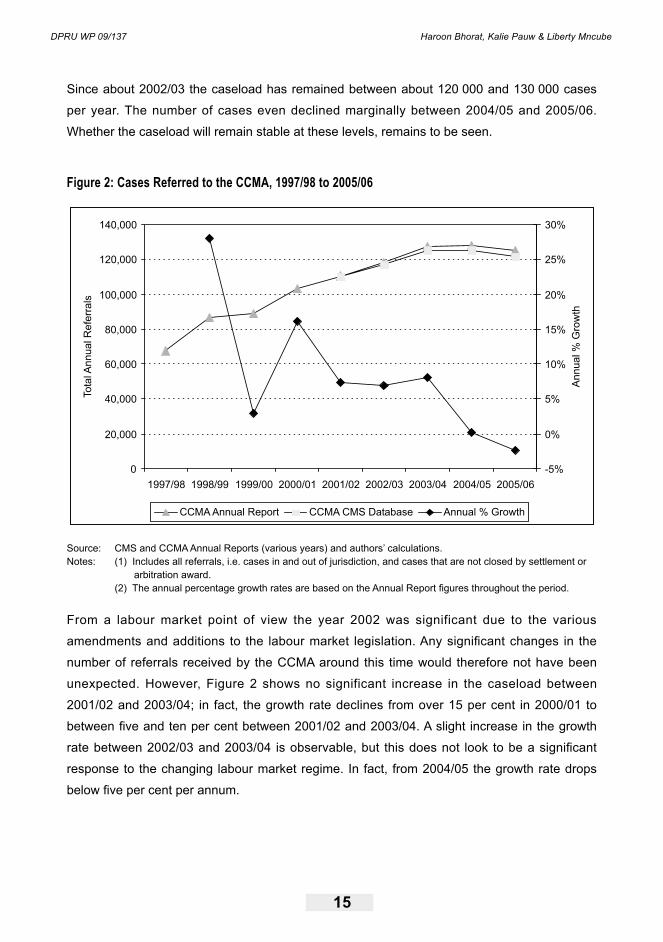
Figure 2: Cases Referred to the CCMA, 1997/98 to 2005/06
0
20,000
40,000
60,000
80,000
100,000
120,000
140,000
1997/98 1998/99 1999/00 2000/01 2001/02 2002/03 2003/04 2004/05 2005/06
To
talA
nn
ua
lR
efe
rra
ls
-5%
0%
5%
10%
15%
20%
25%
30%
An
nu
al%
Gro
wth
CCMA Annual Report CCMA CMS Database Annual % Growth
Source: CMS and CCMA Annual Reports (various years) and authors’ calculations. Notes: (1) Includes all referrals, i.e. cases in and out of jurisdiction, and cases that are not closed by settlement or arbitration award. (2) The annual percentage growth rates are based on the Annual Report figures throughout the period.
From a labour market point of view the year 2002 was significant due to the various
amendments and additions to the labour market legislation. Any significant changes in the
number of referrals received by the CCMA around this time would therefore not have been
unexpected. However, Figure 2 shows no significant increase in the caseload between
2001/02 and 2003/04; in fact, the growth rate declines from over 15 per cent in 2000/01 to
between five and ten per cent between 2001/02 and 2003/04. A slight increase in the growth
rate between 2002/03 and 2003/04 is observable, but this does not look to be a significant
response to the changing labour market regime. In fact, from 2004/05 the growth rate drops
below five per cent per annum.
Understanding the Efficiency and Effectiveness of the Dispute Resolution System in South Africa: An Analysis of CCMA Data
16
It can therefore be argued that the high growth rate in the first years of operation was a
natural growth path of this newly formed institution. Labour market participants became better
informed and more aware of the CCMA, resulting in a high growth in the caseload initially.
Since then, the growth in the caseload has declined significantly, currently varying at levels
more comparable with the labour force growth rate during the latter years (Figure 7 in the
appendix compares the CCMA referral growth rate with the labour force growth rate over the
period). Indeed, although this is only indicative evidence over a fairly short period of time, it
is possible that the CCMA may be able to use labour force growth rates as a predictor for its
future caseloads and hence their required future resources. At the same time, however, it also
has to be said that a variety of other factors may influence or determine the caseload of the
CCMA, including trends in unemployment rates, legislative changes, increased awareness
among labour market participants, and an expansion in the CCMA network (for example,
opening up of a new regional office). Hence, forecasting of referral rates should be done taking
all of these factors into account.
Figure 3 shows the distribution of referrals across provinces. Most provinces only have a
single regional office, except for Gauteng and Eastern Cape (two offices each) and KwaZulu-
Natal (three offices). Each province’s share of the national referrals has remained fairly
constant over time. According to the CCMA’s Annual Report for 2005/06, this has been the
case since the inception of the CCMA. Figure 3 also shows the provincial shares of formal and
domestic workers across the provinces, which are derived from the Labour Force Survey for
September 2005.
As noted above, there is some variation in CCMA coverage by occupation types. This is also
the case for regions and economic sectors, as is shown in Figure 8 in the appendix. Thus, in
Figure 3 (and also in Figure 4 and Figure 5 to follow) ‘re-weighted’ shares are also calculated.
These re-weighted shares use the CCMA coverage rates for each region, occupation and type
of sector of employment to calculate the number of workers in these various cohorts that fall
under jurisdiction of the CCMA (as opposed to all workers). A comparison of these re-weighted
shares with the distribution of referrals gives a better indication of whether referrals originating
from within specific cohorts are under- or overrepresented. In the case of the regional shares
shown in Figure 3 the re-weighted shares match the original shares closely, probably due to
the fact that the CCMA coverage rates do not vary significantly across provinces.29
29 These coverage rates range from about 77 per cent in Gauteng to 66 per cent in KwaZulu-Natal (Figure 8 in the Appendix).

DPRU WP 09/137 Haroon Bhorat, Kalie Pauw & Liberty Mncube
17
Figure 3: Distribution of Referrals by Province
0%
10%
20%
30%
40%
50%
60%
70%
80%
90%
100%
2001/02 2002/03 2003/04 2004/05 2005/06 Formal
sector &
domestic
workers
Formal
sector &
domestic
workers
(re-
weighted)
CCMA Referrals LFS 2005
Sha
res
(%)
Northern Cape
Limpopo
Mpumalanga
Eastern Cape
Free State
North West
Western Cape
KwaZulu-Natal
Gauteng
Source: CMS (various years) and LFS September 2005 (Statistics South Africa) and Authors’ Calculations.Note: Includes all referrals, that is, cases in and out of jurisdiction, and cases that are not closed by settlement or arbitration award.
Also evident from Figure 3 is the fact that the majority of cases – almost 70 per cent – are
handled in three of South Africa’s provinces, namely Gauteng (36 per cent), KwaZulu-Natal
(17 per cent) and the Western Cape (15 per cent) (2005/06 figures). Gauteng’s Pretoria
office was only established in 2004/05 and currently handles about 26 per cent of the region’s
cases, up significantly from only 8 per cent in its first year. KwaZulu-Natal has three offices
based in Durban, Pietermaritzburg and Richard’s Bay, with 75 per cent of the cased referred
to the Durban office. The only other province with more than one office is the Eastern Cape,
with offices in East London and Port Elizabeth. This is despite the fact that the province as a
whole only handles six per cent of the referrals nationwide. These two regional offices share
roughly the same caseload. The Northern Cape office is by far the smallest in terms of its
share of referrals. This is unsurprising given the small population of this region. However,
when compared to the re-weighted LFS shares it is evident that referrals in this regions are
underrepresented. Presumably many disputes are never referred to this regional office given
the long distances people would have to travel to attend hearings.
Understanding the Efficiency and Effectiveness of the Dispute Resolution System in South Africa: An Analysis of CCMA Data
18
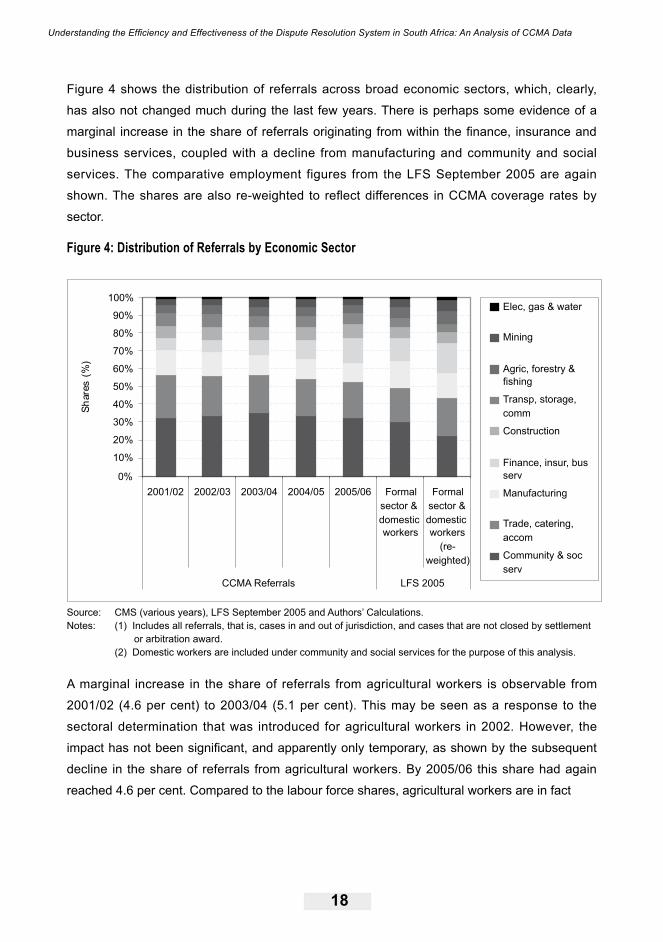
Figure 4 shows the distribution of referrals across broad economic sectors, which, clearly,
has also not changed much during the last few years. There is perhaps some evidence of a
marginal increase in the share of referrals originating from within the finance, insurance and
business services, coupled with a decline from manufacturing and community and social
services. The comparative employment figures from the LFS September 2005 are again
shown. The shares are also re-weighted to reflect differences in CCMA coverage rates by
sector.
Figure 4: Distribution of Referrals by Economic Sector
0%
10%
20%
30%
40%
50%
60%
70%
80%
90%
100%
2001/02 2002/03 2003/04 2004/05 2005/06 Formal
sector &
domestic
workers
Formal
sector &
domestic
workers
(re-
weighted)
CCMA Referrals LFS 2005
Sh
are
s(%
)
Elec, gas & water
Mining
Agric, forestry &
fishing
Transp, storage,
comm
Construction
Finance, insur, bus
serv
Manufacturing
Trade, catering,
accom
Community & soc
serv
Source: CMS (various years), LFS September 2005 and Authors’ Calculations.Notes: (1) Includes all referrals, that is, cases in and out of jurisdiction, and cases that are not closed by settlement or arbitration award. (2) Domestic workers are included under community and social services for the purpose of this analysis.
A marginal increase in the share of referrals from agricultural workers is observable from
2001/02 (4.6 per cent) to 2003/04 (5.1 per cent). This may be seen as a response to the
sectoral determination that was introduced for agricultural workers in 2002. However, the
impact has not been significant, and apparently only temporary, as shown by the subsequent
decline in the share of referrals from agricultural workers. By 2005/06 this share had again
reached 4.6 per cent. Compared to the labour force shares, agricultural workers are in fact

DPRU WP 09/137 Haroon Bhorat, Kalie Pauw & Liberty Mncube
19
underrepresented in the CMS database, which probably reflects the fact that many farm
workers reside in rural areas and have difficulty travelling to the urban centres where the
CCMA offices are located.30
The community and social services sector in Figure 4 includes domestic workers who are also
protected by a minimum wage. At first glance it appears as if referrals from this sector are
overrepresented, especially when comparing the 2005/06 referral share (32 per cent) to the
re-weighted LFS share (23 per cent). Approximately 40 per cent of referrals in the community
and social service sector are from domestic workers. Hence it would appear as if referrals
from domestic workers are to blame for the disproportionate share of referrals coming from the
community and social service sector. This, however, as we argue below, is a misinterpretation.
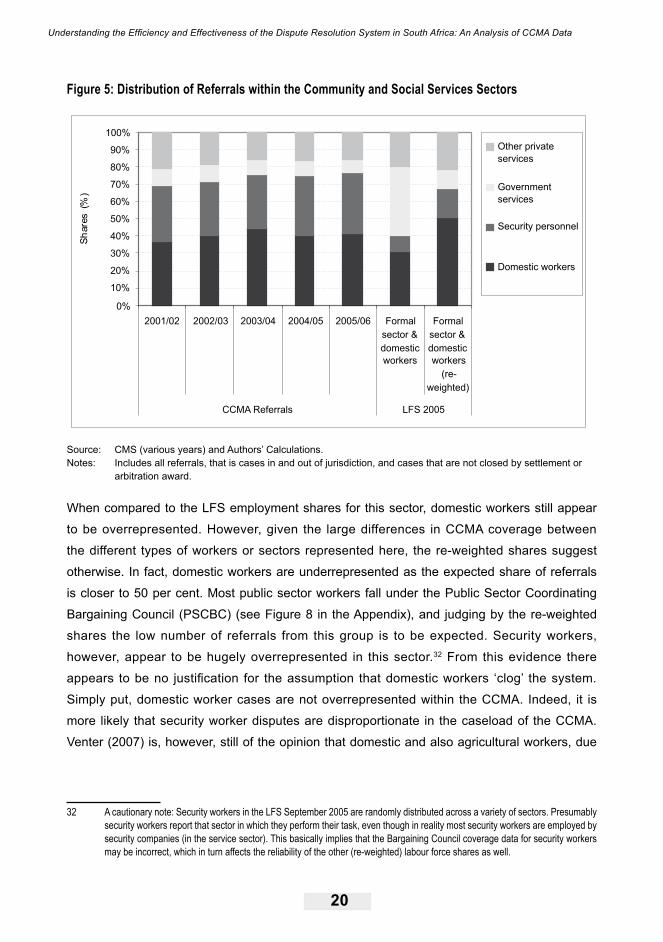
Figure 5 breaks the referrals originating from within the community and social services sector
down into its various components, namely (1) domestic workers, cleaning and laundry staff,
(2) private safety and security personnel, (3) public sector services, (4) other private sector
services and (5) other.31 As noted, over 40 per cent of referrals in 2005/06 in this sector are
from domestic workers. Security guards make up around 35 per cent of this group, while most
of the remainder is made up of government and other services. Judging by Figure 5 the overall
composition of referrals from this sector has not shifted much over time, although there is
evidence of a relative rise in the number of referrals from domestic workers. In fact, in 2001/02
about 35 per cent of referrals were from domestic workers. This share increased to 39 per cent
the following year and to 43 per cent in 2003/04. By 2005/06 the share had dropped back to
around 40 per cent.
30 The CCMA is doing a great deal to overcome this problem by having multiple CCMA offices in regions such as KwaZulu-Natal and the Eastern Cape that have large and dispersed rural populations. The use of ‘mobile courts’ has also made the CCMA accessible.
31 Some of which include referrals from the informal sector.
Understanding the Efficiency and Effectiveness of the Dispute Resolution System in South Africa: An Analysis of CCMA Data
20
Figure 5: Distribution of Referrals within the Community and Social Services Sectors
0%
10%
20%
30%
40%
50%
60%
70%
80%
90%
100%
2001/02 2002/03 2003/04 2004/05 2005/06 Formal
sector &
domestic
workers
Formal
sector &
domestic
workers
(re-
weighted)
CCMA Referrals LFS 2005
Sh
are
s(%
)
Other private
services
Government
services
Security personnel
Domestic workers
Source: CMS (various years) and Authors’ Calculations.Notes: Includes all referrals, that is cases in and out of jurisdiction, and cases that are not closed by settlement or arbitration award.
When compared to the LFS employment shares for this sector, domestic workers still appear
to be overrepresented. However, given the large differences in CCMA coverage between
the different types of workers or sectors represented here, the re-weighted shares suggest
otherwise. In fact, domestic workers are underrepresented as the expected share of referrals
is closer to 50 per cent. Most public sector workers fall under the Public Sector Coordinating
Bargaining Council (PSCBC) (see Figure 8 in the Appendix), and judging by the re-weighted
shares the low number of referrals from this group is to be expected. Security workers,
however, appear to be hugely overrepresented in this sector.32 From this evidence there
appears to be no justification for the assumption that domestic workers ‘clog’ the system.
Simply put, domestic worker cases are not overrepresented within the CCMA. Indeed, it is
more likely that security worker disputes are disproportionate in the caseload of the CCMA.
Venter (2007) is, however, still of the opinion that domestic and also agricultural workers, due
32 A cautionary note: Security workers in the LFS September 2005 are randomly distributed across a variety of sectors. Presumably security workers report that sector in which they perform their task, even though in reality most security workers are employed by security companies (in the service sector). This basically implies that the Bargaining Council coverage data for security workers may be incorrect, which in turn affects the reliability of the other (re-weighted) labour force shares as well.
DPRU WP 09/137 Haroon Bhorat, Kalie Pauw & Liberty Mncube
21
to the nature of their employment contracts, really require an alternative system to handle their
disputes. She does not argue that these workers should have their own Bargaining Councils,
but rather that the CCMA should perhaps have a special division dealing with cases from
these sectors. As for the security sector, Venter feels that disputes from this sector should still
be dealt with by the CCMA despite the disproportionate share of referrals coming from this
sector. This sector, she argues, is well organised and most workers are employed on formal
work contracts. This allows the dispute resolution process to be more straightforward than is
typically the case for domestic and agricultural workers. The reason for the disproportionate
share of referrals originating from this industry probably has more to do with unfavourable
working conditions (leading to unfair labour practice disputes) and the high incidence of
strikes (as was seen in 2006), which possibly impact on the relative share of dismissals in this
industry.
The CCMA (2007) disagrees about the need to treat agricultural, domestic or security worker
disputes separately, arguing that this would be impractical and unnecessary, while impacting
adversely on resources and the budget. They acknowledge that in the past cases involving
domestic or agricultural workers were characterised by longer turnaround times, various
simple measures have been introduced to rectify this problem.33 A typical example would be
that a default award is made in favour of the plaintiff due to non-attendance. Upon hearing this
news the employer would challenge the outcome, leading to the case being rescinded and the
process starting over again. Recently a system was introduced whereby parties involved in a
dispute receive notification of hearings via cellular phone messenger services. There is also
now the option of Saturday or Sunday hearings. These innovations have, according to the
CCMA, greatly reduced turnaround times.
From this cursory overview of the CCMA dispute referral trends a number of preliminary
conclusions can be drawn. Firstly, it was argued that the growth in the number of referrals
received by the CCMA, while initially high, appears to have stabilised. In recent years,
therefore, a decline in the measured efficiency of a particular CCMA office, for example, should
not be viewed as a function of high or unexpected growth in referrals. It is also important
to note that the growth in referrals appears to be converging with the labour force growth
33 This report looks at turnaround times in more detail in Sections 4.3 (see Table 6 in particular) and 4.4. While estimates of mean turnaround times for conciliation and arbitration cases shown in Table 6 suggest that turnaround times for domestic workers, for example, are generally above the average across all sectors, we show in the econometric models in Section 4.4 that, when controlling for other factors, domestic workers actually have lower than average turnaround times. See related discussions for clarity.
Understanding the Efficiency and Effectiveness of the Dispute Resolution System in South Africa: An Analysis of CCMA Data
22
rate, which should make future planning easier for the CCMA. Secondly, it is evident that no
significant structural changes in dispute patterns (types of disputes) or the share of referrals
across regions and economic sectors have occurred since the inception of the CCMA. While
we observed slight compositional shifts for agricultural and domestic workers shortly after the
2002 sectoral determinations were enacted, none of these were lasting in nature. A deduction
from the above evidence therefore is that significant structural or compositional shifts are
unlikely to explain any large variations in efficiency of the CCMA.
The above conclusions are, however, preliminary, and in an effort to provide a more
exhaustive empirical analysis, we conduct a series of statistical tests to determine whether
our hypotheses are in fact correct. Hence in what follows below the CCMA’s statutory and
internal efficiency parameters and turnaround times are estimated, before moving on to a
discussion of the econometric model developed to analyse these issues further. Thus far the
analysis has focused on all referrals received by the CCMA, that is, both those referrals that
fall under jurisdiction of the CCMA and the ‘out of jurisdiction’ or non-jurisdictional cases.
Generally, non-jurisdictional cases are screened out during an initial screening stage. If at this
stage it is ruled that a case falls under the jurisdiction of, say, the Labour Court or one of the
Bargaining Councils, the case is dismissed immediately. These cases are excluded from all
further analysis in this report (and by the CCMA). In some instances non-jurisdictional cases
are only detected during conciliation or arbitration hearings. These cases are also terminated
with immediate effect, but since at least one hearing has already taken place some time has
lapsed since the activation of the case and the scheduling of the hearing, these cases are
included in the CCMA’s internal analyses of efficiency and the calculation of turnaround times.
In our own analyses to follow we also generally include these non-jurisdictional cases, unless
otherwise indicated.
Two further points of interest: Firstly, it can of course be argued that non-jurisdictional cases
screened out prior to a conciliation hearing taking place may in fact impact on efficiency in an
indirect way as these represent cases that should not have been referred to the CCMA in the
first place. Although not central to the analysis of efficiency, we do look at out of jurisdiction
trends in the Appendix (Section 7.2) in more detail. Secondly, an analysis based solely on
CMS data may draw criticism. As explained, this is not a perfect representation of dispute
resolution in South Africa in general, and further research should ideally include an analysis
also of data from various Bargaining Councils. We argue further (Section 4.4) that disputes
that make it to the CCMA are already subject to so-called sample bias given that these
represent disputes that could not be resolved at the firm level. We attempt to correct for this

DPRU WP 09/137 Haroon Bhorat, Kalie Pauw & Liberty Mncube
23
sample bias in the econometric models employed. Something that cannot be controlled for but
has been raised by researchers working with the CMS data is the concern about the quality of
the data (Benjamin and Gruen, 2006 and Venter, 2007). This has implications for the accuracy
of results and the policy conclusions drawn. Some of these data problems are discussed in
Section 7.3 in the Appendix and some suggestions for improvements are made.
Understanding the Efficiency and Effectiveness of the Dispute Resolution System in South Africa: An Analysis of CCMA Data
24
4. MeasuringtheEfficiencyoftheCCMA
4.1. EfficiencyandDisputeResolutionProcesses
In this section we analyse the efficiency of the CCMA. The CCMA uses various internal and
statutory efficiency parameters to measure its efficiency as well as the variation of efficiency
across regions. Most of these efficiency measures, which are discussed in section 4.2, are
defined for specific processes (mainly conciliation and arbitration) that form part of the dispute
resolution system. In CCMA jargon, the ‘determinative process’ of a dispute is defined as the
process at which a case is closed or resolved. For example, if closure is reached at the end of
the conciliation phase then conciliation would be the determinative process.
Table 3 shows the determinative processes for all dispute types between 2001/02 and
2005/06. These include pre-conciliation, conciliation, con-arb (broken down into conciliation
and arbitration), arbitration, in limine, rescission and other. Pre-conciliation basically involves
CCMA officials phoning the parties involved in dispute prior to a hearing being scheduled,
with the aim of resolving the dispute prior to a formal conciliation hearing take place. The
conciliation and arbitration processes are as described previously in Section 2. The con-arb
process was introduced as an efficiency-enhancing measure as it makes provision for a
conciliation and arbitration hearing to run back to back in a single sitting or hearing.34 This
significantly reduces the turnaround times of the traditional conciliation and arbitration
processes combined, although the conciliation and arbitration processes that form part of
a con-arb are legally speaking no different from ‘pure’ conciliation and arbitration hearings.
Finally, in limine refers to cases that are dismissed on technical grounds, while rescinded
cases are those withdrawn or repealed after an arbitration ruling was made. These are the
processes that were current at the time the case was closed. Of course the natural path of a
case would be to go through conciliation (either a pure conciliation hearing or as part of the
con-arb process), and, if unresolved, to go through arbitration.
As shown in Table 3, the share of cases resolved at the pre-conciliation phase remained close
to five per cent during the entire period. As a general rule of thumb the CCMA aims to conduct
pre-conciliations for ten per cent of cases (see efficiency targets discussed further below).
34 This is of course subject to considerations of the legislation providing for objection to con-arb, objection to the same commissioner arbitrating both processes, and attendance of parties.

DPRU WP 09/137 Haroon Bhorat, Kalie Pauw & Liberty Mncube
25
At present the average is closer to 15 per cent (Review of Operations, 2005/06). In previous
years the related efficiency measure was defined differently, stating that five per cent of cases
had to be resolved at the pre-conciliation phase. Clearly in terms of this measure they have
been fairly efficient. The CCMA (2007) notes that the intention is for only certain types of cases
to be subjected to the pre-conciliation process, hence, the reason for changing the definition
of the efficiency target. Pre-conciliation “is not intended as a screening mechanism, nor as
a process to be applied to most cases”, while “there are important natural justice issues and
other factors that need to be taken into account when applying the pre-conciliation provision,
pointing towards pre-conciliation only being used under specific circumstances”. (CCMA,
2007) In short, all people have a right to a fair and formal conciliation hearing, and hence
only clear-cut cases are dealt with in this manner. Increases in successful pre-conciliations,
although drastically reducing turnaround times, is not in the interest of the parties involved in a
dispute.
Table 3: Determinative Processes
2001/02 2002/03 2003/04 2004/05 2005/06 Pre-conciliation 3,607 4,988 3,733 2,800 5,655
(5.1) (6.6) (4.6) (3.5) (6.5) Conciliation 37,108 31,964 23,432 19,466 19,354
(52.5) (42.3) (28.7) (24.6) (22.4) Con/Arb - Conciliation 1 1,959 13,208 18,287 17,969
(0.0) (2.6) (16.2) (23.1) (20.8) Con/Arb - Arbitration 2 464 2,968 6,485 6,737
(0.0) (0.6) (3.6) (8.2) (7.8) Arbitration 25,257 27,614 28,901 22,652 26,899
(35.8) (36.5) (35.4) (28.6) (31.1) In limine 3,490 6,248 6,108 7,200 7,056
(4.9) (8.3) (7.5) (9.1) (8.2) Rescinded 1,094 2,193 2,898 1,997 2,554
(1.6) (2.9) (3.6) (2.5) (3.0) Other 76 155 304 229 277
(0.1) (0.2) (0.4) (0.3) (0.3)
Total 70,635 75,585 81,552 79,113 86,501 (100.0) (100.0) (100.0) (100.0) (100.0)
Source: CMS (various years) and Authors’ Calculations.Note: (1) Includes only closed cases, that is, cases that have either been settled, dismissed or ruled out of jurisdiction during conciliation or arbitration, or those for which an arbitration award was made. The numbers exclude those cases that were ruled out of jurisdiction during the initial screening stage. Roughly two-thirds of in limine cases are out of jurisdiction. (2) Con-arb cases are disaggregated into those settled or closed during conciliation and those that continue to arbitration, eventually resulting in an arbitration award. The case outcome detail in the CMS database is used for this breakdown. Con-arb cases that are ruled out of jurisdiction (see Note 1 above), dismissed, settled or withdrawn are all allocated to conciliation. Only con-arb cases resulting in arbitration awards (default or ‘normal’) are allocated to the arbitration row. (3) Figures in brackets represent column shares in percentages.
Understanding the Efficiency and Effectiveness of the Dispute Resolution System in South Africa: An Analysis of CCMA Data
26
Turning to conciliation, we note that this was by far the most common determinative process
in the first two years analysed here. The share of ‘pure’ conciliation as the determinative
process has dropped from 53 per cent in 2001/02 to 22 per cent in 2005/06. This fall coincides
with a rapid rise in cases resolved through con-arb. Con-arb was introduced in 2001/02 and
increased from close to zero per cent (three cases) to around 29 per cent in 2005/06 (as a joint
process). This rapid rise in the share of con-arb cases is to be expected. Under the provisions
in the LRA, con-arb should be conducted for all dismissal and unfair labour practice disputes
relating to probation, dismissal disputes relating to conduct and capacity (excluding dismissal
arising from participation in an unprotected strike), constructive dismissal, dismissal where the
employee does not know the reason for the dismissal and unfair labour practices, subject to
objection by the parties. Clearly, these disputes make up the majority of disputes (see Table
2). The only disputes that cannot be handled using the con-arb process are disputes relating
to organisational rights, interpretation and application of collective agreements, workplace
forums, non-renewal of contracts or renewal on terms less favourable, automatically unfair
dismissals, operational requirement dismissals and entitlement to severance pay.
Of course, cases settled during the conciliation process of a con-arb should also be included
as conciliation settlements, as should (theoretically) cases settled during pre-conciliation, as
these processes do not differ from a legal context. The sum of these shares initially stood
at 58 per cent in 2001/02, but thereafter dropped to about 51 to 52 per cent and remained
stable at this level. Thus, although the con-arb has replaced the conciliation process, it has not
detracted much from the share of cases resolved through conciliation; in fact, the share seems
to have remained constant in the last four years.
Con-arb was introduced fairly recently and showed rapid growth. It is perhaps too soon to
try and analyse trends in the share of con-arb cases resolved at the conciliation phase.
Nevertheless, in the last two years (2004/05 and 2005/06) about three-quarters of con-arb
cases were resolved at the conciliation stage. In this regard the CCMA have found that the
settlement rate (at conciliation) of con-arb is “significantly higher” than the settlement rate of
conciliations conducted separately (CCMA, 2007). While there are no clear reasons why this
should be the case, it does allude to increased efficiency of con-arb over pure conciliation,
given that arbitration cases generally have much longer turnaround times (see Section 4.3).
The CCMA conclude that “con-arb benefits all role players, and the more extensive use of
con-arb needs to be facilitated” (CCMA, 2007).

DPRU WP 09/137 Haroon Bhorat, Kalie Pauw & Liberty Mncube
27
The share of cases concluded at the arbitration stage declined from 36 to 31 per cent during
the period of analysis. This drop has coincided with an increase in the share of cases resolved
at the arbitration process of con-arb, from zero per cent in 2001/02 to about eight per cent in
2005/06. The joint share of cases resolved through ‘pure’ arbitration or the arbitration process
of a con-arb remained stable, at between 36 per cent in 2001/02 and 29 per cent in 2005/06.
The shares of in limine and rescinded cases remains fairly stable from 2002/03 onwards. It
is unclear whether the initial rise in rescinded or in limine should be regarded as a concern.
Benjamin and Gruen (2006), whose study covers the period up until 2004/05, attributes
the rise to the changing nature of employment relationships. They cite a study by the
International Labour Organisation (ILO) that suggests that employers increasingly aim to
disguise employment contracts through ‘outsourcing’ or ‘contracting out’ certain services,
or by continuously rolling over short-term contracts. If employers can prove that a standard
employment relationship did not exist, any case brought against them can be rescinded or
dismissed on technical grounds. This effectively means that employers can sidestep any
regulations when it comes to dismissals or other labour market disputes.
In response to this notion, the CCMA (2007) notes that in limine cases are not a strong
predictor of atypical forms of employment: “the in limine process typically deals with various
issues such as jurisdiction35, referral defects and condonation; our statistics reflect that atypical
employment accounts for 0.1 per cent of the issues identified in limine cases at present”.
However, the rise in atypical employment contracts is a global phenomenon. South Africa
follows this trend, with various research on the subject finding evidence that firms are relying
more on subcontracting in order to meet skills needs and to reduce the costs associated with
recruitment and training of permanent staff members (see Lundall et al, 2004 for a review
of the literature). Also in this regard Bhorat and Hinks (2005) find that the labour regulatory
environment has resulted in firms hiring fewer workers and substituting permanent workers for
casual or contract workers. The key issue arising here is that if atypical forms of employment
may significantly alter the nature of dispute resolution, and it is crucial to either regulate such
labour market changes if they are deemed undesirable, or to adapt the relevant legislation
to these altering labour market conditions. Ultimately the CCMA should be responsible for
monitoring the impact of atypical forms of employment on the incidence and nature of labour
35 Our estimates show that, on average, about 72 per cent of cases with determinative process stated as in limine are classified as out of jurisdiction.
Understanding the Efficiency and Effectiveness of the Dispute Resolution System in South Africa: An Analysis of CCMA Data
28
market disputes, and also on the way in which such disputes can be handled within the
legislative context.
4.2. InternalandStatutoryMeasuresofCCMAEfficiency
The CCMA has an extensive list of internal and statutory measures of efficiency. Outcomes are
compared against targets on a monthly basis to measure the efficiency of each of the regional
offices. The results and ranking of regional offices or provinces are published annually in the
Review of Operations. The efficiency parameters are not necessarily comparable over time as
dispute resolution processes adapt and evolve, which leads to new measures being introduced
periodically, sometimes replacing older or obsolete measures. Efficiency targets are also
revised regularly as information becomes available that are grounds for efficiency targets to
be revised. A comprehensive list of efficiency parameters with descriptions, target levels and
actual outcomes appears in Table 11 in the Appendix.
Below we highlight what we consider as five of the most important efficiency parameters and
outcomes over the last three years:
• Conciliations conducted outside 30 days: This statutory requirement (as noted in the
LRA) provides that that no conciliation may be conducted outside the 30-day statutory
period unless agreed upon by both parties. The related efficiency measure is purely a
count of cases that were conducted outside the 30 days; hence, it differs fundamentally
from the internal efficiency measure that calculates the turnaround time for conciliations
(see below). The target of zero per cent has never been reached, and actually
increased from three per cent in 2003/04 to seven per cent in 2005/06.
• Settlement rate: At least 70 per cent of cases referred to the CCMA have to be ‘settled’,
that is, resolved during the conciliation or arbitration process or withdrawn by the
plaintiff. This target has also not been reached in any of the last three financial years,
with outcomes ranging from 56 to 62 per cent between 2003/04 and 2005/06.
• Postponements: A trend that has emerged at the CCMA in recent years is a seemingly
increasing tendency for part-time commissioners to postpone cases. While concrete
evidence is lacking, there is a concern that this is being done for financial reasons
given that they work on a contract/hourly basis. In order to reduce the occurrence of
DPRU WP 09/137 Haroon Bhorat, Kalie Pauw & Liberty Mncube
29
postponements, the CCMA (as an internal measure36) limits the number of cases that
any commissioner may postpone. In 2003/04 the target was one per cent, but this was
increased to three and five per cent in the following two years. The target was never
reached, with postponements reaching eight per cent in each of the last three years.
Of course, the postponements by part-time commissioners have to be viewed
against the number of cases handled by them. The use of part-time commissioners
has increased from around 62 per cent in 2003/04 to 73 per cent in 2005/06. In all
three years under investigation part-time commissioners were more likely to issue
postponements. While this is understandably a worrying trend, the CCMA should
perhaps consider the overall efficiency of part-time commissioners relative to full-time
commissioners. In KwaZulu-Natal, for example, 69 per cent of commissioners were
part-time in 2003/04, the highest of any province. Yet, this province consistently
ranks as one of the most efficient provinces when taking into account all the
efficiency parameters (see below). It remains true, however, that the significant rise in
postponements within the CCMA may be a key marker for the perverse incentives that
potentially operate amongst the cohort of commissioners.
• Turnaround times for conciliations: This is an internal efficiency measure which states
that conciliation cases must be finalised within 30 days of activating the case. The
efficiency measure therefore calculates the time taken from activation to the end date
of the case, that is, when an outcome has been reached. The target was missed in both
2004/05 and 2005/06, with the outcome actually increasing from 33 days to 45 days. In
2005/06 not a single regional office met the target.37
• Turnaround times for arbitrations: This is an internal efficiency measure that states that
arbitration cases must be finalised within 60 days of the arbitration referral date. As with
the conciliation turnaround time the measure is calculated as the time lapsed between
these two dates. The target was missed in both 2004/05 and 2005/06, although an
improvement is observable (88 days to 79 days). In 2005/06 not a single regional office
met the target.38
36 Commissioner usage was listed as a formal but non-statutory (internal) efficiency target in 2003/04. See Table 11 in the Appendix.37 Our own estimates of turnaround times for conciliation cases (all jurisdictional cases) are 40 days in 2004/05 and 33 days in
2005/06. Benjamin and Gruen (2006) also note that it is sometimes difficult to replicate figures and estimates reported in the Reviews of Operations or Annual Reports. Of course, the CMS is a live database, which may explain differences depending on the time at which a calculation is done. Furthermore, the measure is sensitive to the inclusion or exclusion of cases, for example pre-conciliation cases, conciliation cases and con-arb cases settled at conciliation, or jurisdictional and non-jurisdictional cases.
38 As was the case with conciliation cases our own estimates fail to replicate the CCMA’s estimates exactly.

Understanding the Efficiency and Effectiveness of the Dispute Resolution System in South Africa: An Analysis of CCMA Data
30
Clearly the CCMA has not been highly successful at reaching their efficiency targets. This
either suggests that they are aiming too high or that, by their own standards, they are not
performing as well as they should be. The outcomes of all efficiency parameters (Table 11)
show that in 2003/04 only six out of 14 measures were achieved (43 per cent). In 2004/05 the
success rate declined to three out of 15 (20 per cent). This picked up again with five out of
13 targets achieved in 2005/06 (38 per cent). In all the years (where applicable) none of the
efficiency parameters that we consider as the most important were, in fact, achieved.
A more detailed examination of Table 11 indicates in turn, that it is often the same offices that
perform badly. Each year the CCMA ranks offices and/or provinces according to their overall
efficiency using a weighted ranking process. Table 4 shows the results as published in the
annual Review of Operations in the last three years. We use this information to construct a
simple index to determine which provinces, on average, performed the best over the years.
This index is shown in Figure 6, with a lower number indicating better performance,that is,
higher average placing in the annual ranking.
Table 4: Efficiency Ranking of Regions or Provinces, 2003/04 to 2005/06
Rank 2003/04 Rank 2004/05 Rank 2005/06
1
KwaZulu-Natal (KZN) - classified as single region in 2003/04. 1
KwaZulu-Natal Durban (KZNDB) 1 Northern Cape (NC)
2 Northern Cape (NC) 2 KwaZulu-Natal Richard's Bay (KZNRB) 2 Gauteng Pretoria (GAPT)
3 North West (NW) 3 KwaZulu-Natal Pietermaritzburg (KZNPM) 3
KwaZulu-Natal (KZN) - classified as single region in 2005/06.
4 Limpopo (LP) 4 Northern Cape (NC) 4 Western Cape (WE) 5 Mpumalanga (MP) 5 Limpopo (LP) 5 North West (NW)
6 Western Cape (WE) 6 Eastern Cape - Port Elizabeth (ECPE) 5 Free State (FS)
7Gauteng (GA) - classified as a single region in 2003/04 7 Mpumalanga (MP) 7 Limpopo (LP)
8 Free State (FS) 8 North West (NW) 8 Mpumalanga (MP)
9Eastern Cape - Port Elizabeth (ECPE) 9 Western Cape (WE) 9
Eastern Cape (EC) - classified as a single region in 2005/06
10Eastern Cape - East London (ECEL) 10
Eastern Cape - East London (ECEL) 10
Gauteng Johannesburg (GAJB)
10 Free State (FS)
12 Gauteng (GA) - classified as a single region in 2004/05.
Source: CCMA Review of Operations, 2003/04 to 2005/06
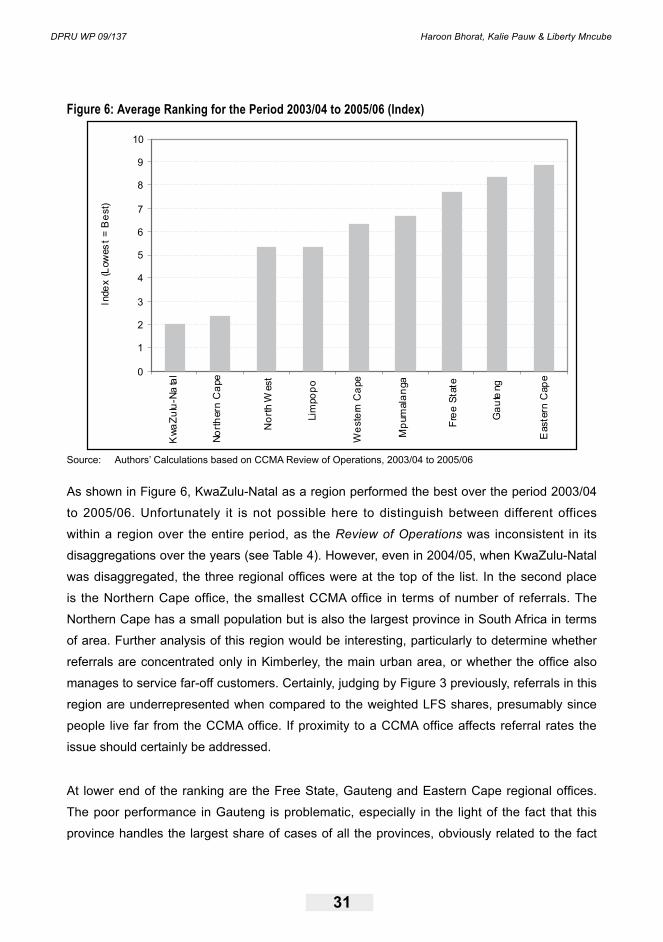
DPRU WP 09/137 Haroon Bhorat, Kalie Pauw & Liberty Mncube
31
Figure 6: Average Ranking for the Period 2003/04 to 2005/06 (Index)
0
1
2
3
4
5
6
7
8
9
10
Kw
aZ
ulu
-Na
tal
No
rth
ern
Ca
pe
No
rth
West
Lim
po
po
We
ste
rnC
ape
Mp
um
ala
nga
Fre
eS
tate
Ga
ute
ng
Easte
rnC
ap
e
Inde
x(L
ow
es
t=
Be
st)
Source: Authors’ Calculations based on CCMA Review of Operations, 2003/04 to 2005/06
As shown in Figure 6, KwaZulu-Natal as a region performed the best over the period 2003/04
to 2005/06. Unfortunately it is not possible here to distinguish between different offices
within a region over the entire period, as the Review of Operations was inconsistent in its
disaggregations over the years (see Table 4). However, even in 2004/05, when KwaZulu-Natal
was disaggregated, the three regional offices were at the top of the list. In the second place
is the Northern Cape office, the smallest CCMA office in terms of number of referrals. The
Northern Cape has a small population but is also the largest province in South Africa in terms
of area. Further analysis of this region would be interesting, particularly to determine whether
referrals are concentrated only in Kimberley, the main urban area, or whether the office also
manages to service far-off customers. Certainly, judging by Figure 3 previously, referrals in this
region are underrepresented when compared to the weighted LFS shares, presumably since
people live far from the CCMA office. If proximity to a CCMA office affects referral rates the
issue should certainly be addressed.
At lower end of the ranking are the Free State, Gauteng and Eastern Cape regional offices.
The poor performance in Gauteng is problematic, especially in the light of the fact that this
province handles the largest share of cases of all the provinces, obviously related to the fact
Understanding the Efficiency and Effectiveness of the Dispute Resolution System in South Africa: An Analysis of CCMA Data
32
that Gauteng also has the largest working population. However, poor performance in Gauteng
affects the overall performance of the CCMA. The Eastern Cape is also consistently a poor
performer, perhaps justifying closer investigations into processes in this province. A mitigating
circumstance, perhaps, is the fact that large parts of the Eastern Cape have poor infrastructure
and are situated in deep rural areas. It is unclear, however, what share of referrals would
necessarily originate from these isolated areas. It may well be that the mobile courts used in
those provinces that serve rural areas (see footnote 30) adds to the efficiency rating of such
provinces. However, the Northern Cape and KwaZulu-Natal, for example, would then stand out
as exceptions – these provinces also serve large rural areas through mobile courts, but they
are consistently the most efficient provinces.
Clearly, a better understanding of the management, referrals received and other unique
circumstances that exist in each province is needed to fully explain differences in efficiency
across provinces. The CCMA itself is perhaps best placed to investigate this further. In the
following sections (Sextions 4.3 and 4.4), however, we do investigate variation in turnaround
times in more detail in order to better understand efficiency levels. In particular we are
concerned about explaining variations in efficiency across dispute types, economic sectors
and regions for various determinative processes.
4.3 A Descriptive Overview of Turnaround Times
The CMS dataset records various dates during the conciliation and arbitration processes. An
analysis of the variation in time lapsed between the various steps in the process is useful for
gauging the efficiency of the CCMA. The CCMA sets itself various efficiency targets in terms
of turnaround times against which they can measure performance. Below we analyse trends
in three key turnaround times, namely the referral-to-activation date turnaround time, the
activation-to-end date turnaround time for conciliation cases and the arbitration referral-to-
end date turnaround time for arbitration cases. These estimates are not necessarily entirely
comparable with the conciliation and arbitration turnaround times calculated internally by the
CCMA.
4.3.1. Referral to Activation Date
When a case is referred to the CCMA a case number is assigned. As soon as the required
information (case details, party details and so on) is captured, the case is activated. In
about two-thirds of the cases the activation date is the same as the referral date, that is, the
turnaround time from referral to activation is zero. However, if there is any missing information
DPRU WP 09/137 Haroon Bhorat, Kalie Pauw & Liberty Mncube
33
in the referral, the applicant is requested to produce the required information, thus resulting
in delays. These delays are analysed in detail in Benjamin and Gruen (2006). Long delays in
referral to activation times are not necessarily a reflection of poor performance by the CCMA
office, as the client is responsible for supplying information.
Using the pooled dataset (2001/02 to 2005/06 data inclusive) we compare some referral to
activation date turnaround times for across dispute types, sectors, regions and determinative
processes across various years. Observations included in the calculation of turnaround times
include all dispute types but only for pre-conciliation, conciliation, arbitration and con-arb as
determinative processes.39 This means that only cases that are not ruled as out of jurisdiction
cases at the initial screening stage are included. Only valid (positive and non-missing)
turnaround times are included in the calculation. In order to control for outliers we exclude any
observations with turnaround times exceeding 365 days (one year). Negative turnaround times
are probably due to incorrect dates being captured, while ‘missing’ values (in the statistical
context) appear in the dataset when the date format is incorrect and hence calculations cannot
be done with that specific date.
Table 5 shows the average referral to activation turnaround times. A brief discussion follows.
The national average referral to activation date turnaround time is 6.3 days, which is fairly high
considering that about 60 per cent of the observations record a turnaround time of zero. The
yearly data shows that relatively speaking 2003/04 was the least efficient year as measured by
referral to activation turnaround times. Since then a significant improvement can be observed.
Variation across dispute type appears to be quite high, but as shown in the previous section,
the majority of cases are unfair dismissal cases; hence the national average is driven largely
by the turnaround time for unfair dismissal cases.
There is also substantial variation in turnaround times across economic sectors.
One sector that stands out with its high turnaround time is the public service
sector. This suggests that public sector cases are disproportionate contributors to
the CCMA inefficiency, at least as far as referral to activation is concerned. This
may be attributed to a number of things; for example, it may be that government
officials referring disputes to the CCMA take a very long time to submit all the
39 It was found that in limine cases had referral to activation turnaround times of between 20 and 35 days over the period of analysis. In contrast the average among the other determinative processes ranged between five and eight days. As a result the in limine cases were excluded from the calculations since they bias mean estimates upwards. Most in limine cases are out of jurisdiction cases (see footnote 35).
Understanding the Efficiency and Effectiveness of the Dispute Resolution System in South Africa: An Analysis of CCMA Data
34
relevant data before a case can be activated. It may also relate to the fact that most
public sector cases do not fall under jurisdiction of the CCMA and, hence, perhaps
more time is needed to determine the jurisdictional status of such cases before they are
activated.
The turnaround times vary significantly across regions. A recurring result is that
the KwaZulu-Natal offices are by far the best performers, also in terms of the referral to
activation turnaround times. This result also holds for individual years. The Eastern Cape (in
particular the East London office) has a very poor performance, with the highest referral to
activation date turnaround time on average. In theory referral to activation dates for different
determinative processes should not differ. For example, at the referral stage it is unknown
to the parties involved whether a case will be settled at conciliation or whether it will be
referred for arbitration. However, as shown here, there are some substantial differences in
turnaround times across determinative processes, with arbitration cases typically taking longer
to activate.40
40 This difference in average turnaround time can be shown to be statistically significant at a one per cent level of confidence.
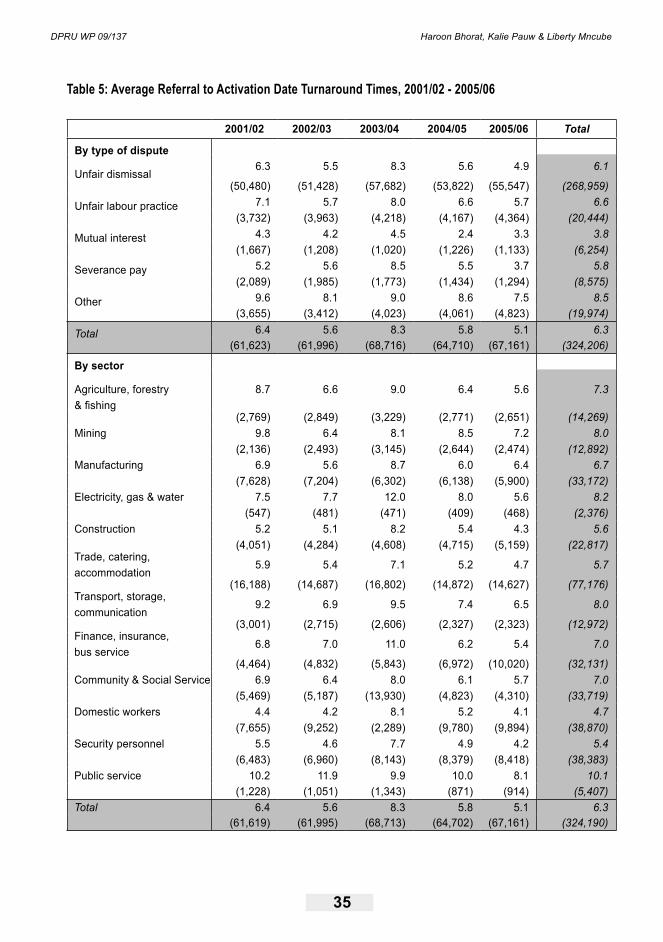
DPRU WP 09/137 Haroon Bhorat, Kalie Pauw & Liberty Mncube
35
Table 5: Average Referral to Activation Date Turnaround Times, 2001/02 - 2005/06
2001/02 2002/03 2003/04 2004/05 2005/06 Total
By type of dispute
Unfair dismissal6.3 5.5 8.3 5.6 4.9 6.1
(50,480) (51,428) (57,682) (53,822) (55,547) (268,959)
Unfair labour practice 7.1 5.7 8.0 6.6 5.7 6.6
(3,732) (3,963) (4,218) (4,167) (4,364) (20,444)
Mutual interest 4.3 4.2 4.5 2.4 3.3 3.8
(1,667) (1,208) (1,020) (1,226) (1,133) (6,254)
Severance pay 5.2 5.6 8.5 5.5 3.7 5.8
(2,089) (1,985) (1,773) (1,434) (1,294) (8,575)
Other 9.6 8.1 9.0 8.6 7.5 8.5
(3,655) (3,412) (4,023) (4,061) (4,823) (19,974)
Total 6.4 5.6 8.3 5.8 5.1 6.3
(61,623) (61,996) (68,716) (64,710) (67,161) (324,206)
By sector
Agriculture, forestry & fishing
8.7 6.6 9.0 6.4 5.6 7.3
(2,769) (2,849) (3,229) (2,771) (2,651) (14,269)Mining 9.8 6.4 8.1 8.5 7.2 8.0 (2,136) (2,493) (3,145) (2,644) (2,474) (12,892)Manufacturing 6.9 5.6 8.7 6.0 6.4 6.7 (7,628) (7,204) (6,302) (6,138) (5,900) (33,172)Electricity, gas & water 7.5 7.7 12.0 8.0 5.6 8.2 (547) (481) (471) (409) (468) (2,376)Construction 5.2 5.1 8.2 5.4 4.3 5.6 (4,051) (4,284) (4,608) (4,715) (5,159) (22,817)Trade, catering, accommodation
5.9 5.4 7.1 5.2 4.7 5.7
(16,188) (14,687) (16,802) (14,872) (14,627) (77,176)Transport, storage, communication
9.2 6.9 9.5 7.4 6.5 8.0
(3,001) (2,715) (2,606) (2,327) (2,323) (12,972)Finance, insurance, bus service
6.8 7.0 11.0 6.2 5.4 7.0
(4,464) (4,832) (5,843) (6,972) (10,020) (32,131)Community & Social Service 6.9 6.4 8.0 6.1 5.7 7.0 (5,469) (5,187) (13,930) (4,823) (4,310) (33,719)Domestic workers 4.4 4.2 8.1 5.2 4.1 4.7 (7,655) (9,252) (2,289) (9,780) (9,894) (38,870)Security personnel 5.5 4.6 7.7 4.9 4.2 5.4 (6,483) (6,960) (8,143) (8,379) (8,418) (38,383)Public service 10.2 11.9 9.9 10.0 8.1 10.1 (1,228) (1,051) (1,343) (871) (914) (5,407)Total 6.4 5.6 8.3 5.8 5.1 6.3
(61,619) (61,995) (68,713) (64,702) (67,161) (324,190)

Understanding the Efficiency and Effectiveness of the Dispute Resolution System in South Africa: An Analysis of CCMA Data
36
Table 5 continued…
2001/02 2002/03 2003/04 2004/05 2005/06 TotalBy province
Western Cape9.7 7.2 7.7 5.5 4.3 6.8
(7,979) (8,141) (8,986) (9,007) (10,075) (44,188)Eastern Cape 5.5 9.1 7.1 8.2 6.3 6.9 (4,067) (2,395) (2,106) (1,908) (2,820) (13,296)Northern Cape 8.2 5.3 5.4 8.1 6.6 6.7 (1,068) (1,115) (1,316) (1,414) (1,524) (6,437)Free State 5.4 6.7 7.2 8.0 6.8 6.6 (4,358) (4,058) (4,296) (1,144) (440) (14,296)KwaZulu-Natal 2.5 0.5 1.1 1.5 1.5 1.4 (11,215) (12,214) (14,934) (13,829) (13,500) (65,692)North West 11.0 6.6 9.7 10.6 9.4 9.4 (4,050) (4,564) (4,835) (4,229) (4,445) (22,123)Gauteng 5.8 6.5 12.9 6.8 6.3 7.7 (22,751) (23,854) (25,974) (27,157) (27,785) (127,521)Mpumalanga 14.5 8.6 6.5 5.1 3.2 7.3 (3,211) (3,726) (4,060) (3,580) (3,987) (18,564)Limpopo 4.6 6.7 9.6 7.0 6.2 6.7 (2,924) (1,929) (2,209) (2,442) (2,585) (12,089)Total 6.4 5.6 8.3 5.8 5.1 6.3 (61,623) (61,996) (68,716) (64,710) (67,161) (324,206)
By determinitive process
Pre-conciliation4.0 5.2 5.9 4.5 2.6 4.4
(3,312) (4,629) (3,427) (2,394) (4,746) (18,508)Conciliation 6.1 4.8 8.3 6.6 5.7 6.2 (34,574) (29,541) (21,862) (17,385) (17,008) (120,370)Con-Arb 0.0 6.2 6.7 4.7 3.9 5.0 (2) (2,332) (15,901) (23,612) (21,594) (63,441)Arbitration 7.3 6.6 9.4 6.4 6.2 7.3 (23,735) (25,494) (27,526) (21,319) (23,813) (121,887)Total 6.4 5.6 8.3 5.8 5.1 6.3
(61,623) (61,996) (68,716) (64,710) (67,161) (324,206)
Source: CMS (various years) and Author’s Calculations.Notes: (1) The numbers in brackets show the number of observations on which the estimate is based. (2) This table only includes cases referred and activated, and eventually being resolved at one of the ‘main’ determinative processes, that is, pre-conciliation, conciliation, con-arb or arbitration. The sample is truncated by dropping all observations with turnaround times exceeding 365 days. This ensures that estimates of the mean are not biased upwards by outliers.

DPRU WP 09/137 Haroon Bhorat, Kalie Pauw & Liberty Mncube
37
4.3.2. Conciliation and Arbitration Turnaround Times to End Date
It is only once a case has been activated that the CCMA begins to monitor turnaround times
to the point of closure of a case. As discussed previously the internal efficiency target for the
closing of cases where conciliation is the determinative process is 30 days, and 60 days for an
arbitration case. In the case of conciliation cases the measurement is taken from the activation
date, while for arbitration cases, the turnaround time is calculated from the arbitration referral
date to the end date.
Table 6 shows the conciliation turnaround times based on two alternative definitions. The first
set of results shows the average activation to end date turnaround times for conciliation cases.
These include all cases that were concluded (closed) at conciliation stage or in the conciliation
stage of the con-arb process. This is also the turnaround time variable for conciliation
cases that is used in the econometric analyses to follow, and, to our knowledge, closely
approximates the approach used by the CCMA to calculate their conciliation turnaround
times. The second set of results shows the same turnaround times, only now including pre-
conciliation cases. About a quarter of pre-conciliation cases are resolved or closed on the
activation date and hence the turnaround time is zero. As a result estimates in this second
set are slightly lower than the first. Since pre-conciliation is not seen as a possible efficiency
enhancing option (see earlier discussion), these lower turnaround times may be misleading. In
the discussion that follows we only consider the first set of results.
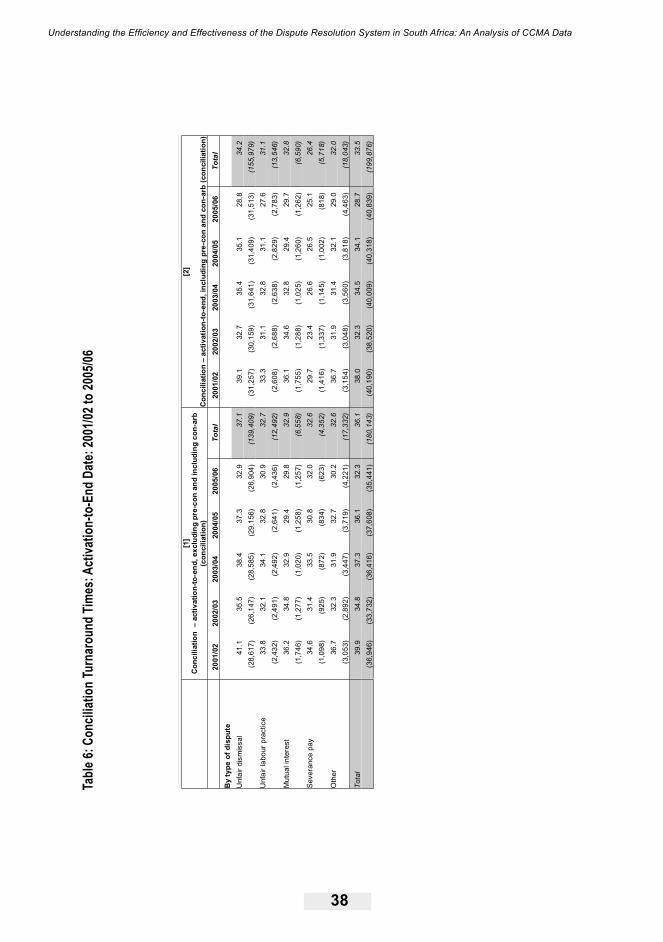
Understanding the Efficiency and Effectiveness of the Dispute Resolution System in South Africa: An Analysis of CCMA Data
38
Tabl
e 6: C
oncil
iatio
n Tu
rnar
ound
Time
s: A
ctiva
tion-
to-E
nd D
ate:
2001
/02 to
2005
/06
[1]
Con
cilia
tion
– a
ctiv
atio
n-to
-end
, exc
ludi
ng p
re-c
on a
nd in
clud
ing
con-
arb
(con
cilia
tion)
[2]
Con
cilia
tion
– ac
tivat
ion-
to-e
nd, i
nclu
ding
pre
-con
and
con
-arb
(con
cilia
tion)
2001
/02
2002
/03
2003
/04
2004
/05
2005
/06
Tota
l 20
01/0
2 20
02/0
3 20
03/0
4 20
04/0
5 20
05/0
6 To
tal
By
type
of d
ispu
te
U
nfai
r dis
mis
sal
41.1
35
.5
38.4
37
.3
32.9
37
.1
39.1
32
.7
35.4
35
.1
28.8
34
.2
(2
8,61
7)
(26,
147)
(2
8,58
5)
(29,
156)
(2
6,90
4)
(139
,409
) (3
1,25
7)
(30,
159)
(3
1,64
1)
(31,
409)
(3
1,51
3)
(155
,979
) U
nfai
r lab
our p
ract
ice
33.8
32
.1
34.1
32
.8
30.9
32
.7
33.3
31
.1
32.8
31
.1
27.6
31
.1
(2
,432
) (2
,491
) (2
,492
) (2
,641
) (2
,436
) (1
2,49
2)
(2,6
08)
(2,6
88)
(2,6
38)
(2,8
29)
(2,7
83)
(13,
546)
M
utua
l int
eres
t 36
.2
34.8
32
.9
29.4
29
.8
32.9
36
.1
34.6
32
.8
29.4
29
.7
32.8
(1,7
46)
(1,2
77)
(1,0
20)
(1,2
58)
(1,2
57)
(6,5
58)
(1,7
55)
(1,2
88)
(1,0
25)
(1,2
60)
(1,2
62)
(6,5
90)
Sev
eran
ce p
ay
34.6
31
.4
33.5
30
.8
32.0
32
.6
29.7
23
.4
26.6
26
.5
25.1
26
.4
(1
,098
) (9
25)
(872
) (8
34)
(623
) (4
,352
) (1
,416
) (1
,337
) (1
,145
) (1
,002
) (8
18)
(5,7
18)
Oth
er
36.7
32
.3
31.9
32
.7
30.2
32
.6
36.7
31
.9
31.4
32
.1
29.0
32
.0
(3
,053
) (2
,892
) (3
,447
) (3
,719
) (4
,221
) (1
7,33
2)
(3,1
54)
(3,0
48)
(3,5
60)
(3,8
18)
(4,4
63)
(18,
043)
Tota
l 39
.9
34.8
37
.3
36.1
32
.3
36.1
38
.0
32.3
34
.5
34.1
28
.7
33.5
(3
6,94
6)
(33,
732)
(3
6,41
6)
(37,
608)
(3
5,44
1)
(180
,143
) (4
0,19
0)
(38,
520)
(4
0,00
9)
(40,
318)
(4
0,83
9)
(199
,876
)

DPRU WP 09/137 Haroon Bhorat, Kalie Pauw & Liberty Mncube
39
[1]
Con
cilia
tion
– ac
tivat
ion-
to-e
nd, e
xclu
ding
pre
-con
and
incl
udin
g co
n-ar
b (c
onci
liatio
n
[2]
Con
cilia
tion
– ac
tivat
ion-
to-e
nd, i
nclu
ding
pre
-con
and
con
-arb
(con
cilia
tion)
2001
/02
2002
/03
2003
/04
2004
/05
2005
/06
Tota
l 20
01/0
2 20
02/0
3 20
03/0
4 20
04/0
5 20
05/0
6 To
tal
By
sect
or
Ag
ricul
ture
, for
estry
& fi
shin
g 40
.9
33.6
36
.5
39.9
34
.8
37.3
40
.3
32.5
35
.0
38.7
32
.1
35.8
(2,0
27)
(1,8
59)
(1,9
44)
(2,0
55)
(1,8
42)
(9,7
27)
(2,1
42)
(2,0
75)
(2,1
35)
(2,1
45)
(2,0
54)
(10,
551)
M
inin
g 42
.2
36.8
39
.4
37.7
37
.3
38.6
41
.4
36.5
38
.5
36.9
34
.1
37.4
(1,2
22)
(1,3
84)
(1,6
88)
(1,5
97)
(1,2
98)
(7,1
89)
(1,3
40)
(1,4
70)
(1,7
42)
(1,6
45)
(1,4
57)
(7,6
54)
Man
ufac
turin
g 38
.4
33.7
35
.7
34.3
31
.3
34.8
37
.4
32.6
34
.1
33.0
29
.2
33.4
(4,2
33)
(3,8
62)
(3,5
77)
(3,8
12)
(3,5
25)
(19,
009)
(4
,482
) (4
,207
) (3
,823
) (3
,996
) (3
,836
) (2
0,34
4)
Elec
trici
ty, g
as &
wat
er
37.9
34
.9
35.9
35
.3
34.4
35
.9
35.8
32
.3
33.7
33
.4
29.3
33
.1
(2
74)
(228
) (1
92)
(204
) (1
65)
(1,0
63)
(296
) (2
52)
(206
) (2
19)
(202
) (1
,175
) C
onst
ruct
ion
39.6
34
.9
38.2
36
.5
32.3
36
.3
37.9
32
.3
35.9
34
.1
28.1
33
.5
(2
,584
) (2
,460
) (2
,571
) (2
,802
) (2
,715
) (1
3,13
2)
(2,8
23)
(2,8
30)
(2,7
70)
(3,0
38)
(3,1
95)
(14,
656)
Tr
ade,
cat
erin
g, a
ccom
mod
atio
n37
.5
33.5
35
.1
35.1
31
.6
34.7
35
.8
31.8
33
.0
33.5
28
.6
32.7
(9,9
07)
(8,2
80)
(9,0
08)
(8,9
29)
(7,9
91)
(44,
115)
(1
0,70
4)
(9,1
95)
(9,7
59)
(9,4
88)
(9,0
37)
(48,
183)
Tr
ansp
ort,
stor
age,
co
mm
unic
atio
n 40
.1
34.6
37
.5
35.5
32
.2
36.1
38
.8
33.1
35
.5
33.5
29
.2
34.2
(1,5
72)
(1,4
17)
(1,3
59)
(1,3
22)
(1,2
40)
(6,9
10)
(1,6
73)
(1,5
53)
(1,4
56)
(1,4
25)
(1,4
06)
(7,5
13)
Fina
nce,
insu
ranc
e, b
us s
ervi
ce40
.4
36.3
39
.6
35.0
31
.6
35.8
39
.0
34.6
37
.9
33.6
28
.8
33.9
(2,8
65)
(2,7
34)
(3,0
47)
(3,9
67)
(5,3
68)
(17,
981)
(3
,029
) (3
,019
) (3
,223
) (4
,172
) (5
,961
) (1
9,40
4)
Com
mun
ity &
Soc
ial S
ervi
ce
42.0
36
.8
38.8
36
.6
33.2
38
.0
40.8
35
.1
32.3
35
.0
30.6
34
.4
(3
,499
) (2
,897
) (6
,983
) (2
,836
) (2
,372
) (1
8,58
7)
(3,7
49)
(3,1
64)
(8,5
60)
(2,9
94)
(2,6
28)
(21,
095)
D
omes
tic w
orke
rs
43.5
35
.6
37.9
37
.6
32.8
37
.3
37.6
27
.7
36.2
32
.4
24.7
30
.6
(4
,390
) (4
,495
) (1
,174
) (5
,129
) (4
,472
) (1
9,66
0)
(5,3
36)
(6,2
66)
(1,2
48)
(6,0
41)
(6,1
69)
(25,
060)
Se
curit
y pe
rson
nel
39.9
35
.5
38.3
37
.2
32.0
36
.6
39.0
34
.2
37.2
36
.1
29.6
35
.2
(3
,694
) (3
,554
) (4
,110
) (4
,316
) (3
,909
) (1
9,58
3)
(3,9
19)
(3,8
84)
(4,2
86)
(4,4
88)
(4,2
99)
(20,
876)
Pu
blic
ser
vice
40
.0
31.8
33
.8
33.3
30
.1
34.0
40
.5
31.6
32
.8
32.8
28
.8
33.5
(676
) (5
61)
(761
) (6
38)
(543
) (3
,179
) (6
94)
(604
) (7
99)
(662
) (5
93)
(3,3
52)
Tota
l 39
.9
34.8
37
.3
36.1
32
.3
36.1
38
.0
32.3
34
.5
34.1
28
.7
33.5
(3
6,94
3)
(33,
731)
(3
6,41
5)
(37,
608)
(3
5,44
1)
(180
,138
) (4
0,18
7)
(38,
519)
(4
0,00
8)
(40,
314)
(4
0,83
9)
(199
,867
)
Tabl
e 6 co
ntin
ued…
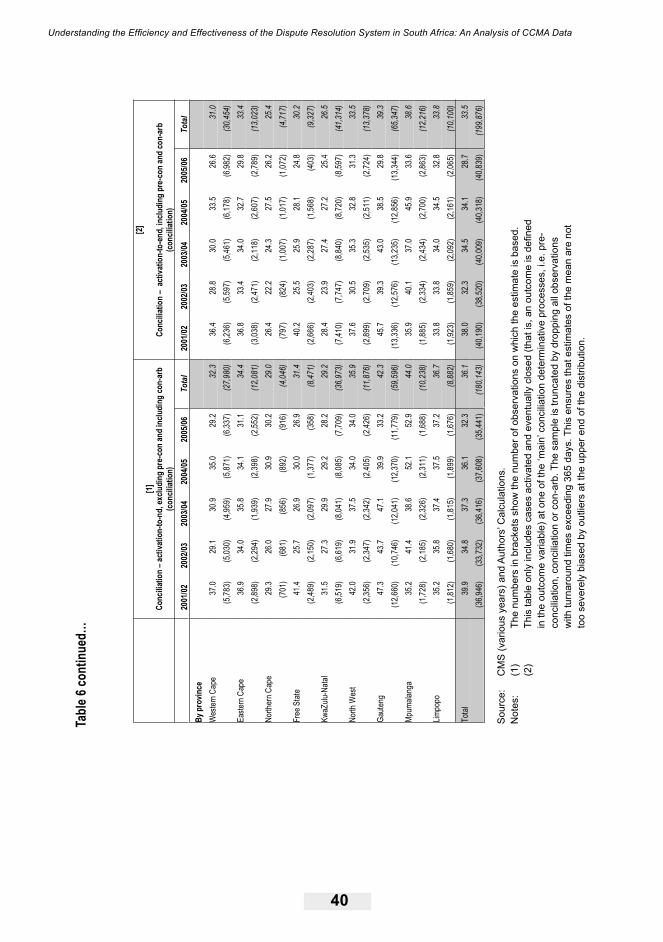
Understanding the Efficiency and Effectiveness of the Dispute Resolution System in South Africa: An Analysis of CCMA Data
40
Tabl
e 6 co
ntin
ued…
[1]
Conc
iliatio
n – a
ctiva
tion-
to-n
d, ex
cludi
ng p
re-c
on an
d in
cludi
ng co
n-ar
b (c
oncil
iatio
n)
[2]
Conc
iliatio
n –
activ
atio
n-to
-end
, inclu
ding
pre
-con
and
con-
arb
(con
ciliat
ion)
20
01/02
20
02/03
20
03/04
20
04/05
20
05/06
To
tal
2001
/02
2002
/03
2003
/04
2004
/05
2005
/06
Tota
l By
pro
vince
Wes
tern
Cap
e 37
.0
29.1
30
.9
35.0
29
.2
32.3
36
.4
28.8
30
.0
33.5
26
.6
31.0
(5,7
83)
(5,0
30)
(4,9
59)
(5,8
71)
(6,3
37)
(27,
980)
(6
,236
) (5
,597
) (5
,461
) (6
,178
) (6
,982
) (3
0,45
4)
Easte
rn C
ape
36.9
34
.0
35.8
34
.1
31.1
34
.4
36.8
33
.4
34.0
32
.7
29.8
33
.4
(2
,898
) (2
,294
) (1
,939
) (2
,398
) (2
,552
) (1
2,08
1)
(3,0
38)
(2,4
71)
(2,1
18)
(2,6
07)
(2,7
89)
(13,
023)
No
rther
n Cap
e 29
.3
26.0
27
.9
30.9
30
.2
29.0
26
.4
22.2
24
.3
27.5
26
.2
25.4
(701
) (6
81)
(856
) (8
92)
(916
) (4
,046
) (7
97)
(824
) (1
,007
) (1
,017
) (1
,072
) (4
,717
) Fr
ee S
tate
41
.4
25.7
26
.9
30.0
26
.9
31.4
40
.2
25.5
25
.9
28.1
24
.8
30.2
(2,4
89)
(2,1
50)
(2,0
97)
(1,3
77)
(358
) (8
,471
) (2
,666
) (2
,403
) (2
,287
) (1
,568
) (4
03)
(9,3
27)
KwaZ
ulu-N
atal
31.5
27
.3
29.9
29
.2
28.2
29
.2
28.4
23
.9
27.4
27
.2
25.4
26
.5
(6
,519
) (6
,619
) (8
,041
) (8
,085
) (7
,709
) (3
6,97
3)
(7,4
10)
(7,7
47)
(8,8
40)
(8,7
20)
(8,5
97)
(41,
314)
No
rth W
est
42.0
31
.9
37.5
34
.0
34.0
35
.9
37.6
30
.5
35.3
32
.8
31.3
33
.5
(2
,356
) (2
,347
) (2
,342
) (2
,405
) (2
,426
) (1
1,87
6)
(2,8
99)
(2,7
09)
(2,5
35)
(2,5
11)
(2,7
24)
(13,
378)
Ga
uten
g 47
.3
43.7
47
.1
39.9
33
.2
42.3
45
.7
39.3
43
.0
38.5
29
.8
39.3
(12,
660)
(1
0,74
6)
(12,
041)
(1
2,37
0)
(11,
779)
(5
9,59
6)
(13,
336)
(1
2,57
6)
(13,
235)
(1
2,85
6)
(13,
344)
(6
5,34
7)
Mpu
malan
ga
35.2
41
.4
38.6
52
.1
52.9
44
.0
35.9
40
.1
37.0
45
.9
33.6
38
.6
(1
,728
) (2
,185
) (2
,326
) (2
,311
) (1
,688
) (1
0,23
8)
(1,8
85)
(2,3
34)
(2,4
34)
(2,7
00)
(2,8
63)
(12,
216)
Lim
popo
35
.2
35.8
37
.4
37.5
37
.2
36.7
33
.8
33.8
34
.0
34.5
32
.8
33.8
(1,8
12)
(1,6
80)
(1,8
15)
(1,8
99)
(1,6
76)
(8,8
82)
(1,9
23)
(1,8
59)
(2,0
92)
(2,1
61)
(2,0
65)
(10,
100)
Tota
l 39
.9
34.8
37
.3
36.1
32
.3
36.1
38
.0
32.3
34
.5
34.1
28
.7
33.5
(3
6,94
6)
(33,
732)
(3
6,41
6)
(37,
608)
(3
5,44
1)
(180
,143
) (4
0,19
0)
(38,
520)
(4
0,00
9)
(40,
318)
(4
0,83
9)
(199
,876
)
Sou
rce:
C
MS
(var
ious
yea
rs) a
nd A
utho
rs’ C
alcu
latio
ns.
Not
es:
(1)
Th
e nu
mbe
rs in
bra
cket
s sh
ow th
e nu
mbe
r of o
bser
vatio
ns o
n w
hich
the
estim
ate
is b
ased
.
(2)
Th
is ta
ble
only
incl
udes
cas
es a
ctiv
ated
and
eve
ntua
lly c
lose
d (th
at is
, an
outc
ome
is d
efine
d
in th
e ou
tcom
e va
riabl
e) a
t one
of t
he ‘m
ain’
con
cilia
tion
dete
rmin
ativ
e pr
oces
ses,
i.e.
pre
-
co
ncili
atio
n, c
onci
liatio
n or
con
-arb
. The
sam
ple
is tr
unca
ted
by d
ropp
ing
all o
bser
vatio
ns
with
turn
arou
nd ti
mes
exc
eedi
ng 3
65 d
ays.
Thi
s en
sure
s th
at e
stim
ates
of t
he m
ean
are
not
too
seve
rely
bia
sed
by o
utlie
rs a
t the
upp
er e
nd o
f the
dis
tribu
tion.
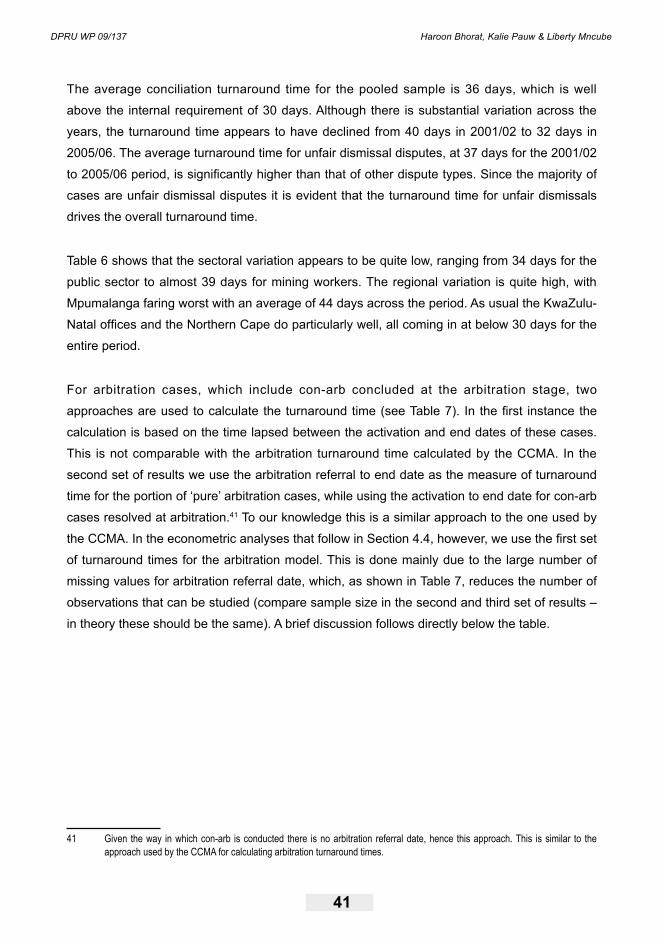
DPRU WP 09/137 Haroon Bhorat, Kalie Pauw & Liberty Mncube
41
The average conciliation turnaround time for the pooled sample is 36 days, which is well
above the internal requirement of 30 days. Although there is substantial variation across the
years, the turnaround time appears to have declined from 40 days in 2001/02 to 32 days in
2005/06. The average turnaround time for unfair dismissal disputes, at 37 days for the 2001/02
to 2005/06 period, is significantly higher than that of other dispute types. Since the majority of
cases are unfair dismissal disputes it is evident that the turnaround time for unfair dismissals
drives the overall turnaround time.
Table 6 shows that the sectoral variation appears to be quite low, ranging from 34 days for the
public sector to almost 39 days for mining workers. The regional variation is quite high, with
Mpumalanga faring worst with an average of 44 days across the period. As usual the KwaZulu-
Natal offices and the Northern Cape do particularly well, all coming in at below 30 days for the
entire period.
For arbitration cases, which include con-arb concluded at the arbitration stage, two
approaches are used to calculate the turnaround time (see Table 7). In the first instance the
calculation is based on the time lapsed between the activation and end dates of these cases.
This is not comparable with the arbitration turnaround time calculated by the CCMA. In the
second set of results we use the arbitration referral to end date as the measure of turnaround
time for the portion of ‘pure’ arbitration cases, while using the activation to end date for con-arb
cases resolved at arbitration.41 To our knowledge this is a similar approach to the one used by
the CCMA. In the econometric analyses that follow in Section 4.4, however, we use the first set
of turnaround times for the arbitration model. This is done mainly due to the large number of
missing values for arbitration referral date, which, as shown in Table 7, reduces the number of
observations that can be studied (compare sample size in the second and third set of results –
in theory these should be the same). A brief discussion follows directly below the table.
41 Given the way in which con-arb is conducted there is no arbitration referral date, hence this approach. This is similar to the approach used by the CCMA for calculating arbitration turnaround times.
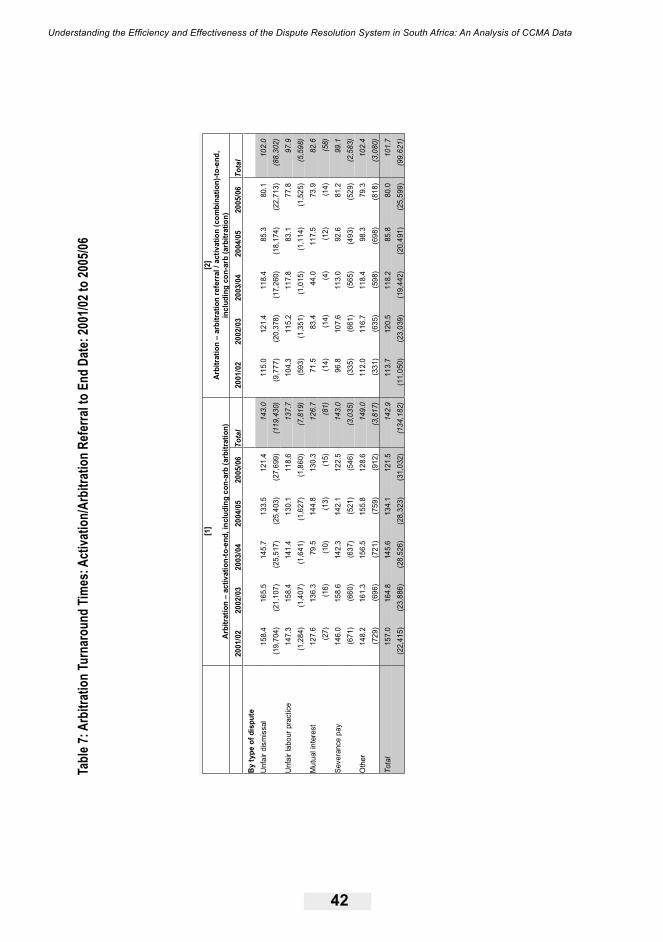
Understanding the Efficiency and Effectiveness of the Dispute Resolution System in South Africa: An Analysis of CCMA Data
42
Tabl
e 7: A
rbitr
atio
n Tu
rnar
ound
Time
s: A
ctiva
tion/
Arbi
tratio
n Re
ferra
l to
End
Date
: 200
1/02 t
o 20
05/06
[1]
Arbi
trat
ion
– ac
tivat
ion-
to-e
nd, i
nclu
ding
con
-arb
(arb
itrat
ion)
[2]
Arbi
trat
ion
– ar
bitra
tion
refe
rral
/ ac
tivat
ion
(com
bina
tion)
-to-e
nd,
incl
udin
g co
n-ar
b (a
rbitr
atio
n)
2001
/02
2002
/03
2003
/04
2004
/05
2005
/06
Tota
l 20
01/0
2 20
02/0
3 20
03/0
4 20
04/0
5 20
05/0
6 To
tal
By ty
pe o
f dis
pute
Unf
air d
ism
issa
l 15
8.4
165.
5 14
5.7
133.
5 12
1.4
143.
0 11
5.0
121.
4 11
8.4
85.3
80
.1
102.
0
(19,
704)
(2
1,10
7)
(25,
517)
(2
5,40
3)
(27,
699)
(1
19,4
30)
(9,7
77)
(20,
378)
(1
7,26
0)
(18,
174)
(2
2,71
3)
(88,
302)
U
nfai
r lab
our p
ract
ice
147.
3 15
8.4
141.
4 13
0.1
118.
6 13
7.7
104.
3 11
5.2
117.
8 83
.1
77.8
97
.9
(1
,284
) (1
,407
) (1
,641
) (1
,627
) (1
,860
) (7
,819
) (5
93)
(1,3
51)
(1,0
15)
(1,1
14)
(1,5
25)
(5,5
98)
Mut
ual i
nter
est
127.
6 13
6.3
79.5
14
4.8
130.
3 12
6.7
71.5
83
.4
44.0
11
7.5
73.9
82
.6
(2
7)
(16)
(1
0)
(13)
(1
5)
(81)
(1
4)
(14)
(4
) (1
2)
(14)
(5
8)
Seve
ranc
e pa
y 14
6.0
158.
6 14
2.3
142.
1 12
2.5
143.
0 96
.8
107.
6 11
3.0
92.6
81
.2
99.1
(671
) (6
60)
(637
) (5
21)
(546
) (3
,035
) (3
35)
(661
) (5
65)
(493
) (5
29)
(2,5
83)
Oth
er
148.
2 16
1.3
156.
5 15
5.8
128.
6 14
9.0
112.
0 11
6.7
118.
4 98
.3
79.3
10
2.4
(7
29)
(696
) (7
21)
(759
) (9
12)
(3,8
17)
(331
) (6
35)
(598
) (6
98)
(818
) (3
,080
)
Tota
l 15
7.0
164.
8 14
5.6
134.
1 12
1.5
142.
9 11
3.7
120.
5 11
8.2
85.8
80
.0
101.
7 (2
2,41
5)
(23,
886)
(2
8,52
6)
(28,
323)
(3
1,03
2)
(134
,182
) (1
1,05
0)
(23,
039)
(1
9,44
2)
(20,
491)
(2
5,59
9)
(99,
621)
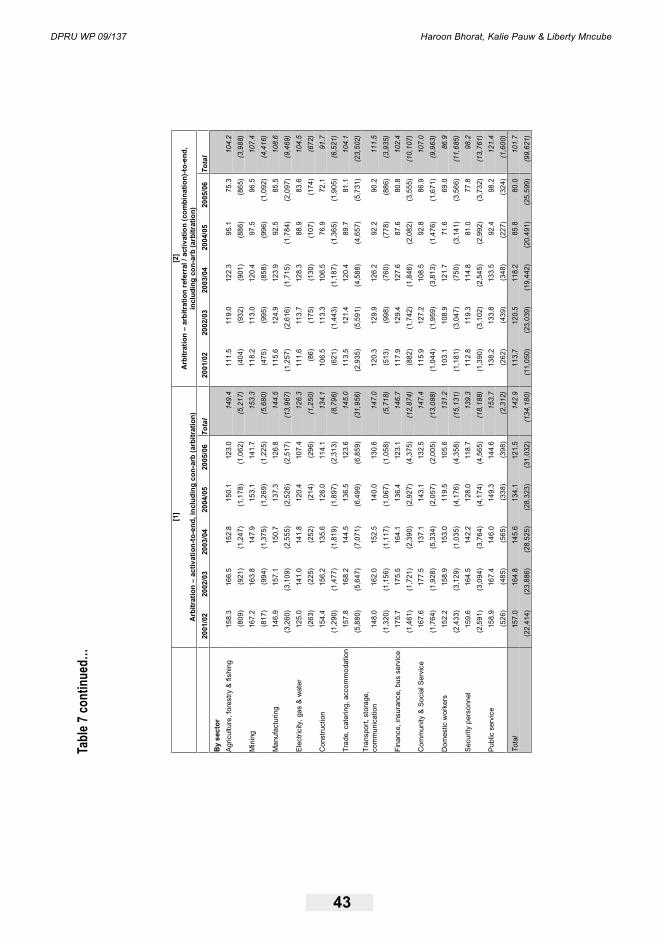
DPRU WP 09/137 Haroon Bhorat, Kalie Pauw & Liberty Mncube
43
[1]
Arb
itrat
ion
– ac
tivat
ion-
to-e
nd, i
nclu
ding
con
-arb
(arb
itrat
ion)
[2]
Arb
itrat
ion
– ar
bitr
atio
n re
ferr
al /
activ
atio
n (c
ombi
natio
n)-to
-end
, in
clud
ing
con-
arb
(arb
itrat
ion)
20
01/0
2 20
02/0
3 20
03/0
4 20
04/0
5 20
05/0
6 To
tal
2001
/02
2002
/03
2003
/04
2004
/05
2005
/06
Tota
l B
y se
ctor
Agric
ultu
re, f
ores
try &
fish
ing
158.
3 16
6.5
152.
8 15
0.1
123.
0 14
9.4
111.
5 11
9.0
122.
3 95
.1
75.3
10
4.2
(8
09)
(921
) (1
,247
) (1
,178
) (1
,062
) (5
,217
) (4
04)
(932
) (9
01)
(886
) (8
65)
(3,9
88)
Min
ing
167.
2 16
3.8
147.
9 15
3.1
141.
7 15
3.3
118.
2 11
3.0
120.
4 97
.5
96.5
10
7.4
(8
17)
(994
) (1
,375
) (1
,269
) (1
,225
) (5
,680
) (4
75)
(995
) (8
58)
(996
) (1
,092
) (4
,416
) M
anuf
actu
ring
146.
9 15
7.1
150.
7 13
7.3
126.
8 14
4.5
115.
6 12
4.9
123.
9 92
.5
85.5
10
8.6
(3
,260
) (3
,109
) (2
,555
) (2
,526
) (2
,517
) (1
3,96
7)
(1,2
57)
(2,6
16)
(1,7
15)
(1,7
84)
(2,0
97)
(9,4
69)
Elec
trici
ty, g
as &
wat
er
125.
0 14
1.0
141.
8 12
0.4
107.
4 12
6.3
111.
6 11
3.7
128.
3 88
.9
83.6
10
4.5
(2
63)
(225
) (2
52)
(214
) (2
96)
(1,2
50)
(86)
(1
75)
(130
) (1
07)
(174
) (6
72)
Con
stru
ctio
n 15
4.4
156.
2 13
5.6
126.
0 11
4.1
134.
1 10
6.5
113.
3 10
6.5
76.9
72
.1
91.7
(1,2
90)
(1,4
77)
(1,8
19)
(1,8
97)
(2,3
13)
(8,7
96)
(621
) (1
,443
) (1
,187
) (1
,365
) (1
,905
) (6
,521
) Tr
ade,
cat
erin
g, a
ccom
mod
atio
n15
7.8
168.
2 14
4.5
136.
5 12
3.6
145.
0 11
3.5
121.
4 12
0.4
89.7
81
.1
104.
1
(5,8
80)
(5,6
47)
(7,0
71)
(6,4
99)
(6,8
59)
(31,
956)
(2
,935
) (5
,591
) (4
,588
) (4
,657
) (5
,731
) (2
3,50
2)
Tran
spor
t, st
orag
e,
com
mun
icat
ion
148.
0 16
2.0
152.
5 14
0.0
130.
6 14
7.0
120.
3 12
9.9
126.
2 92
.2
90.2
11
1.5
(1
,320
) (1
,156
) (1
,117
) (1
,067
) (1
,058
) (5
,718
) (5
13)
(998
) (7
60)
(778
) (8
86)
(3,9
35)
Fina
nce,
insu
ranc
e, b
us s
ervi
ce17
5.7
175.
5 16
4.1
136.
4 12
3.1
146.
7 11
7.9
129.
4 12
7.6
87.6
80
.8
102.
4
(1,4
61)
(1,7
21)
(2,3
90)
(2,9
27)
(4,3
75)
(12,
874)
(8
82)
(1,7
42)
(1,8
46)
(2,0
82)
(3,5
55)
(10,
107)
C
omm
unity
& S
ocia
l Ser
vice
16
7.6
177.
5 13
7.1
143.
1 13
2.5
147.
4 11
5.9
127.
2 10
8.5
92.8
86
.9
107.
0
(1,7
64)
(1,9
28)
(5,3
34)
(2,0
57)
(2,0
05)
(13,
088)
(1
,044
) (1
,959
) (3
,813
) (1
,476
) (1
,671
) (9
,963
) D
omes
tic w
orke
rs
152.
2 15
8.9
153.
0 11
9.5
105.
6 13
1.2
103.
1 10
8.9
121.
7 71
.6
69.0
86
.9
(2
,433
) (3
,129
) (1
,035
) (4
,176
) (4
,358
) (1
5,13
1)
(1,1
81)
(3,0
47)
(750
) (3
,141
) (3
,566
) (1
1,68
5)
Secu
rity
pers
onne
l 15
9.6
164.
5 14
2.2
128.
0 11
8.7
139.
3 11
2.8
119.
3 11
4.8
81.0
77
.8
98.2
(2,5
91)
(3,0
94)
(3,7
64)
(4,1
74)
(4,5
65)
(18,
188)
(1
,390
) (3
,102
) (2
,545
) (2
,992
) (3
,732
) (1
3,76
1)
Publ
ic s
ervi
ce
158.
9 16
7.4
146.
0 14
9.3
144.
6 15
3.7
138.
2 13
3.8
133.
5 92
.4
98.2
12
1.4
(5
26)
(485
) (5
65)
(338
) (3
98)
(2,3
12)
(262
) (4
39)
(348
) (2
27)
(324
) (1
,600
)
Tota
l 15
7.0
164.
8 14
5.6
134.
1 12
1.5
142.
9 11
3.7
120.
5 11
8.2
85.8
80
.0
101.
7 (2
2,41
4)
(23,
886)
(2
8,52
5)
(28,
323)
(3
1,03
2)
(134
,180
) (1
1,05
0)
(23,
039)
(1
9,44
2)
(20,
491)
(2
5,59
9)
(99,
621)
Tabl
e 7 co
ntin
ued…
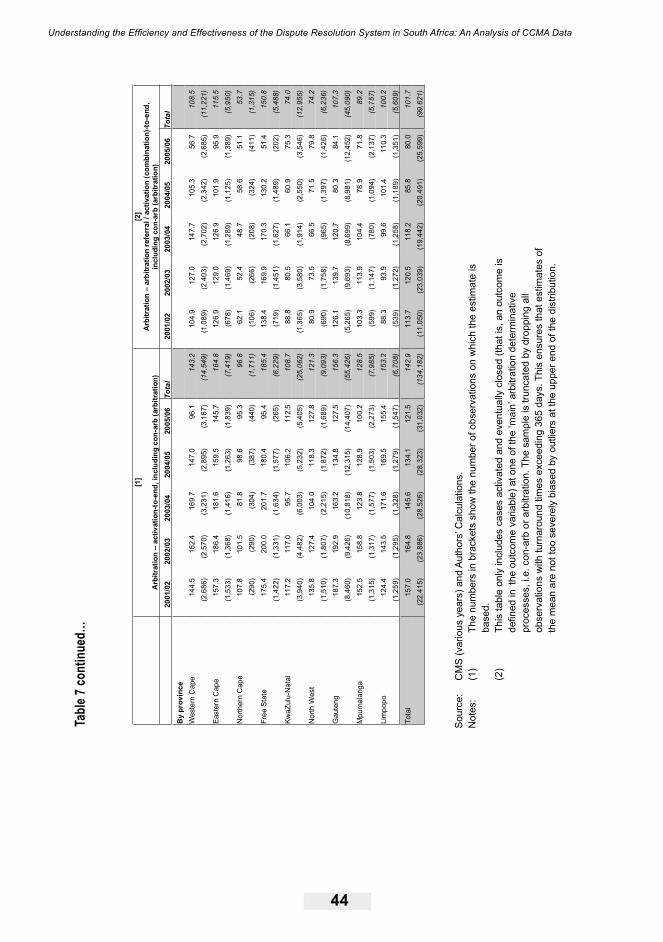
Understanding the Efficiency and Effectiveness of the Dispute Resolution System in South Africa: An Analysis of CCMA Data
44
Tabl
e 7 co
ntin
ued…
[1]
Arb
itrat
ion
– ac
tivat
ion-
to-e
nd, i
nclu
ding
con
-arb
(arb
itrat
ion)
[2]
Arb
itrat
ion
– ar
bitr
atio
n re
ferr
al /
activ
atio
n (c
ombi
natio
n)-to
-end
, in
clud
ing
con-
arb
(arb
itrat
ion)
20
01/0
2 20
02/0
3 20
03/0
4 20
04/0
5 20
05/0
6 To
tal
2001
/02
2002
/03
2003
/04
2004
/05
2005
/06
Tota
l B
y pr
ovin
ce
W
este
rn C
ape
144.
5 16
2.4
169.
7 14
7.0
96.1
14
3.2
104.
9 12
7.0
147.
7 10
5.3
56.7
10
8.5
(2
,686
) (2
,570
) (3
,231
) (2
,895
) (3
,167
) (1
4,54
9)
(1,0
89)
(2,4
03)
(2,7
02)
(2,3
42)
(2,6
85)
(11,
221)
Ea
ster
n C
ape
157.
3 18
6.4
181.
6 15
9.5
145.
7 16
4.8
126.
9 12
9.0
126.
9 10
1.9
95.9
11
5.5
(1
,533
) (1
,368
) (1
,416
) (1
,263
) (1
,839
) (7
,419
) (6
78)
(1,4
69)
(1,2
89)
(1,1
25)
(1,3
89)
(5,9
50)
Nor
ther
n C
ape
107.
8 10
1.5
81.8
98
.6
95.3
96
.8
62.1
52
.4
48.7
58
.6
51.1
53
.7
(2
90)
(290
) (3
04)
(387
) (4
40)
(1,7
11)
(106
) (2
66)
(208
) (3
24)
(411
) (1
,315
) Fr
ee S
tate
17
5.4
200.
0 20
1.7
180.
4 95
.4
185.
4 13
8.4
169.
9 17
0.3
130.
2 51
.4
150.
8
(1,4
22)
(1,3
31)
(1,6
34)
(1,5
77)
(265
) (6
,229
) (7
19)
(1,4
51)
(1,6
27)
(1,4
89)
(202
) (5
,488
) Kw
aZul
u-N
atal
11
7.2
117.
0 95
.7
106.
2 11
2.5
108.
7 88
.8
80.5
66
.1
60.9
75
.3
74.0
(3,9
40)
(4,4
82)
(6,0
03)
(5,2
32)
(5,4
05)
(25,
062)
(1
,365
) (3
,580
) (1
,914
) (2
,550
) (3
,546
) (1
2,95
5)
Nor
th W
est
135.
8 12
7.4
104.
0 11
8.3
127.
8 12
1.3
80.9
73
.5
66.5
71
.5
79.8
74
.2
(1
,510
) (1
,807
) (2
,215
) (1
,872
) (1
,689
) (9
,093
) (6
90)
(1,7
58)
(965
) (1
,397
) (1
,426
) (6
,236
) G
aute
ng
187.
3 19
2.9
163.
2 13
4.8
127.
5 15
6.3
126.
1 13
9.7
120.
7 80
.3
84.1
10
7.3
(8
,460
) (9
,426
) (1
0,81
8)
(12,
315)
(1
4,40
7)
(55,
426)
(5
,265
) (9
,693
) (8
,699
) (8
,981
) (1
2,45
2)
(45,
090)
M
pum
alan
ga
152.
5 15
8.8
123.
8 12
8.9
100.
2 12
8.5
103.
3 11
3.9
104.
4 78
.9
71.8
89
.2
(1
,315
) (1
,317
) (1
,577
) (1
,503
) (2
,273
) (7
,985
) (5
99)
(1,1
47)
(780
) (1
,094
) (2
,137
) (5
,757
) Li
mpo
po
124.
4 14
3.5
171.
6 16
9.5
155.
4 15
3.2
88.3
93
.9
99.6
10
1.4
110.
3 10
0.2
(1
,259
) (1
,295
) (1
,328
) (1
,279
) (1
,547
) (6
,708
) (5
39)
(1,2
72)
(1,2
58)
(1,1
89)
(1,3
51)
(5,6
09)
Tota
l 15
7.0
164.
8 14
5.6
134.
1 12
1.5
142.
9 11
3.7
120.
5 11
8.2
85.8
80
.0
101.
7 (2
2,41
5)
(23,
886)
(2
8,52
6)
(28,
323)
(3
1,03
2)
(134
,182
) (1
1,05
0)
(23,
039)
(1
9,44
2)
(20,
491)
(2
5,59
9)
(99,
621)
Sou
rce:
C
MS
(var
ious
yea
rs) a
nd A
utho
rs’ C
alcu
latio
ns.
Not
es:
(1)
The
num
bers
in b
rack
ets
show
the
num
ber o
f obs
erva
tions
on
whi
ch th
e es
timat
e is
base
d.
(2)
This
tabl
e on
ly in
clud
es c
ases
act
ivat
ed a
nd e
vent
ually
clo
sed
(that
is, a
n ou
tcom
e is
defin
ed in
the
out
com
e va
riabl
e) a
t one
of t
he ‘m
ain’
arb
itrat
ion
dete
rmin
ativ
e
pr
oces
ses,
i.e.
con
-arb
or a
rbitr
atio
n. T
he s
ampl
e is
trun
cate
d by
dro
ppin
g al
l
obse
rvat
ions
with
turn
arou
nd ti
mes
exc
eedi
ng 3
65 d
ays.
Thi
s en
sure
s th
at e
stim
ates
of
the
mea
n ar
e no
t too
sev
erel
y bi
ased
by
outli
ers
at th
e up
per e
nd o
f the
dis
tribu
tion.
DPRU WP 09/137 Haroon Bhorat, Kalie Pauw & Liberty Mncube
45
In the first set of results the average turnaround time for arbitration cases over the entire
period was 143 days, declining significantly over the period from around 157 in the first year
to 122 in 2005/06. As expected, the average turnaround time for unfair dismissal cases is
again close to the overall average given the large share of unfair dismissal disputes. However,
in contrast to the conciliation turnaround times, unfair dismissals do not have the highest
turnaround time. The public service sector has the highest average turnaround time (153
days). Gauteng, Eastern Cape and the Free State are at the top of the distribution, with
average turnaround times ranging between 156 and 185 days.
In the second set of results we find that the way in which turnaround times are now calculated
brings the averages down to levels that are more comparable with the CCMA’s internal
estimates. By 2005/06 the turnaround time had dropped significantly to around 80 days. The
distribution across dispute types, sectors and provinces is similar to the estimates in the first
set of results, although now at lower levels.
The next section analyses the determinants of these turnaround times in an econometric
model. In doing so we will hopefully be able to determine, within a multivariate context, how
the different independent variables, such as province, sector, type of dispute and so on, may
simultaneously impact on average turnaround times for different types of processes.
4.4. Determinants of Variation in Turnaround Times
4.4.1. Estimation Approach
In order to assess the efficiency of the CCMA we analyse the turnaround time for the
conciliation and arbitration processes to be finalised. Our estimate of turnaround time for a
case should not be confused with the “turnaround times” used by the CCMA as internal and
statutory measures of efficiency, although they are very similar. We define the turnaround
time as the number of days from the activation of the case42 up to the end date of the case.
Disputes are referred to the CCMA as noted in detail above, only after all the intra-firm dispute
resolution procedures have been exhausted and the dispute remains unresolved. Therefore,
within the context of our estimation approach here, the conciliation and con-arb processes at
the CCMA are conditional on a dispute not being resolved at the firm level and consequently
the parties to the dispute deciding to bring the case to the attention of the CCMA.
42 This activation date is on or after the case referral date.
Understanding the Efficiency and Effectiveness of the Dispute Resolution System in South Africa: An Analysis of CCMA Data
46
Unfortunately, however, we do not have access to intra-firm dispute resolution data
and therefore we do not know the characteristics or extent of the underlying population.
Specifically, the underlying population is unobserved and we effectively rely solely on the CMS
database, which is not a random sample of labour disputes. This data limitation results in a
selection bias problem that we acknowledge from the outset, but cannot control for. Sample
selection bias arises given that we only observe a restricted, non-random sample of disputes
referred to the CCMA. We are therefore implicitly analysing more intractable disputes that
have failed to be resolved within the firm. Empirically therefore, the measured turnaround
times for disputes in our sample, are upwardly biased estimates of the true measures of mean
turnaround time.
A further limitation relates to the fact that we only analyse disputes referred to the CCMA.
While the CCMA handles the majority of labour market disputes in South Africa, the exclusion
of disputes referred to and handled by the various Bargaining Councils detracts from the
analysis in terms of it being truly representative of dispute resolution in South Africa. Our
analysis is then also only based on the referred cases that also fall within the jurisdiction of the
CCMA, as these are the only cases for which detailed data exists at all stages of the dispute
resolution process.
Given the above problems, our estimation approach is set up in two stages. In the first stage,
we start with a full sample of cases referred to the CCMA for dispute resolution and estimate
a semi-logarithmic turnaround time function for conciliation at both the conciliation or at
the con-arb processes. Because the CMS database does not have information on whether
con-arb cases that are settled prior to an arbitration award being made were settled during the
conciliation phase or the arbitration phase. We assume that all settled cases at the con-arb
process are settled during a conciliation hearing and therefore represent the conciliation
cases of this process and that cases that are not settled at the conciliation hearing proceed
to the arbitration hearing where they may be settled during the formal arbitration process
or dismissed. In the second stage, we estimate a Heckman selection model for arbitration
using a reduced sample of cases that were not settled during the conciliation processes. Our
conciliation equation can be represented as:
(1)
and j = 1,…, n

DPRU WP 09/137 Haroon Bhorat, Kalie Pauw & Liberty Mncube
47
Where YjT
is the natural log of turnaround time of the conciliation or the settled con-arb case j
that is brought to the CCMA. Zj is a vector of the case characteristics and εj is an independent
and identically distributed error term with mean zero and variance σ2. We use a normal OLS
estimation approach for this stage of the estimation process.
Equation (1), however, only captures conciliation and settled con-arb cases. Unresolved
conciliation disputes are referred to arbitration. The main problem with adopting Equation
(1) for the arbitration process is that the sample actually observed at the arbitration stage is
not random, and the application of OLS regressions will yield potentially biased estimates. If
we model the selection process that governs observing the potentially non-random sample
of cases going to the arbitration process then we may be able to provide a solution to the
problem. We adopt the Heckman selection model to cope with the sample selection bias and
estimate the following model for the arbitration process43:
AjT = Xj b + μ1j (2)
AjT is the natural log of turnaround time for an arbitration case j multiplied by the number of
hearings and Xj are the case characteristics that determine the dependent variable. Equation
(3) shows the selection equation. We assume then that the dependent variable (AjT) in the
outcome equation for the case j is observed if:
(3)
The dependent variable in Equation (3), sj is a dummy variable equal to one if the case
proceeds to arbitration and 0, if there is no progress to arbitration and the case is resolved
through conciliation. The vector of case characteristics, Xj , included in the outcome equation
can include some of the same independent variables as those included in Sj in the selection
43 For an introduction into the Heckman selection model see Heckman (1979) and Greene (2003). Although, we use the Heckman selection model to cope with the sample selection bias problem, it has some important weaknesses as well. For example, such models are very sensitive to the assumption of bivariate normality and rely heavily on the distributional assumptions.
Understanding the Efficiency and Effectiveness of the Dispute Resolution System in South Africa: An Analysis of CCMA Data
48
equation, but in order to identify the equations, they cannot overlap completely. The correlation
between the error terms (μ1, μ2) is given by ρ, and the two decisions (that is, to proceed to
arbitration and how long to take in order to reach a settlement) are related if ρ is not equal
to zero. In such a case, estimating the semi-logarithmic function of arbitration turnaround
time would induce a sample selection bias, which we are controlling for by estimating both
equations as proposed by Heckman (1979).
Consistent estimation requires that we include an additional variable called the inverse Mills
ratio. Thus, the process of correction for sample selection can be viewed as including an
omitted variable. We interpret the omitted variable also as a proxy for unobserved private
information. We suggest that the omitted variable controls for, and tests for, the significance
of private information in explaining the ex-post outcomes of choices to proceed to arbitration.
This private information set would for example make the employee or employer more willing
to proceed to arbitration if he knew for sure that he would win perhaps because costs of the
conciliation process are lower than those of the arbitration process.
4.4.2. Estimation Results
As already mentioned in the estimation approach, our discussion of the empirical results will
commence first with a presentation of the conciliation results from the conciliation and the
settled con-arb processes. These results will then be followed by a summary presentation of
the results from the arbitration processes.
Table 8 shows the estimated estimation results for the conciliation and the settled con-arb
processes. For all the conciliation and the settled con-arb cases,44 we estimated Equation
(1) using a pooled sample of all jurisdictional disputes brought to the CCMA from 2001/02 to
2005/06. The dependent variable, the natural log of turnaround time, is used here as a proxy
for efficiency. The time taken in order to reach a settlement may indicate how complex the
issues are and how thoroughly the CCMA deals with these issues. However, it is costly to the
parties involved and may indicate poor performance on the part of the CCMA.
44 We assume that the settled disputes at the con-arb process are essentially conciliation cases and are governed by the same rules as a conciliation case in a conciliation process.
DPRU WP 09/137 Haroon Bhorat, Kalie Pauw & Liberty Mncube
49
The independent variables include a set of regional CCMA office dummy variables to which the
dispute is referred:
• A set of economic sector dummy variables which indicate where the dispute originated.
• A set of year dummy variables which identify the year in which the dispute took place.
• A set of type of dispute dummy variables that describe the four main types of
disputes (that is, unfair dismissal, unfair labour practice, mutual interest and
severance pay).
• A dummy variable for the outcome of a dispute (that is, one if the case was
dismissed and zero if the case was settled).
• A dummy variable Con that represents a conciliation case from the con-arb
process.
• A continuous variable that represents the number hearings that a particular case
had for it to be resolved.
The regional dummy variables can be used to test whether differences in efficiency and other
regional characteristics (unobserved labour market or CCMA office characteristics) explain
the variation in the dependent variable. The sector and dispute type dummy variables can be
used to test the hypothesis that there are marked differences in patterns of dispute resolution
outcome of disputes in the different economic sectors or for different types of disputes.45 The
referent variables are Western Cape (for region), unfair dismissal disputes (for type of dispute)
and domestic workers (for economic sector), 2006 (for individual years) and case dismissed
(for outcome of the dispute).
The results show that the Pretoria, Northern Cape, Limpopo and all the KwaZulu-Natal regions
have negative and significant coefficients. We interpret these results to mean that Pretoria,
Northern Cape, Limpopo and all the KwaZulu-Natal, when controlling for other variables,
the offices in these particular regions are, significantly more efficient than the Western Cape
office. What is useful about the semi-logarithmic functional form underlying the estimation
45 Benjamin and Gruen (2006) conclude that there are marked differences in patterns of dispute resolution and the outcome of disputes in the CCMA’s different provincial region. They suggest that these regional variations are significantly greater than those between different economic sectors.

Understanding the Efficiency and Effectiveness of the Dispute Resolution System in South Africa: An Analysis of CCMA Data
50
approach here is that the coefficients can be interpreted as a ‘percentage point differential’.
Thus, the differential for the Pretoria is about nine per cent, which implies that Pretoria has a
mean turnaround time which is nine per cent greater than the Western Cape, holding other
variables constant. Mpumalanga, North West, Johannesburg and East London regions all have
significant and positive coefficients. This finding reflects that these regions have turnaround
times greater than the Western Cape region, holding other factors fixed. The differential ranges
from about two per cent in East London to about 19 per cent in Mpumalanga.

DPRU WP 09/137 Haroon Bhorat, Kalie Pauw & Liberty Mncube
51
Table 8: Determinants of Turnaround time of the CCMA Conciliation Processes: 2001-2006Dependent Variable: Log (Turnaround Time) Coef. East Cape (East London) 0.0231 ***East Cape (Port Elizabeth) 0.0014Free State 0.0021Gauteng (Pretoria) -0.0887 ***Gauteng (Johannesburg) 0.1468 ***Limpopo -0.0580 ***Mpumalanga 0.1863 ***Northern Cape -0.0526 ***North West 0.0843 ***KwaZulu-Natal (Durban) -0.0918 ***KwaZul-Natal (Pietermaritzburg) -0.0789 ***KwaZulu-Natal (Richards Bay) -0.0803 ***Unfair Labour Practice -0.0007Mutual Interest -0.0964 ***Severance Pay -0.0534 ***Other Type Dispute -0.0357 ***Agriculture 0.0783 ***Mining 0.0295 ***Manufacturing 0.0232 ***Construction 0.0143 ***Trade 0.0208 ***Transport 0.0238 ***Finance 0.0244 ***Social Services 0.0208 ***Electricity, Gas & Water 0.0257 *Security (Private) 0.0233 ***Public Service 0.0349 ***Dismissed 0.0282 ***Number of Hearings 0.7660 ***Con -0.0058 **2001_02 0.0951 ***2002_03 -0.0113 ***2003_04 0.0699 ***2004_05 0.0500 ***_cons 2.4740 ***Number of obs = 157573
R-squared = 0.4463 Root MSE = 0.3635
Notes: *** Significant at the one per cent level, ** Significant at the five per cent level and * Significant at the ten per cent level

Understanding the Efficiency and Effectiveness of the Dispute Resolution System in South Africa: An Analysis of CCMA Data
52
The type of dispute variables show a strong and clear pattern: Relative to unfair dismissal
disputes the coefficients on all the other types of dispute are significant and negative apart
from unfair labour practice disputes. Hence, the CCMA resolves disputes about mutual
interest, severance pay and other types of disputes more speedily relative to unfair dismissal
disputes at the conciliation process. The differential ranges from about four per cent for all
other types of disputes to about ten per cent for mutual interest disputes. Put differently then,
when controlling for other factors such as province and sector, unfair dismissal disputes are
associated with the highest turnaround times. Notably, issues of mutual interest appear to be
resolved most speedily. The sectoral results show that disputes from domestic workers sector
have the lowest turnaround times, holding other factors constant. In fact disputes from all the
other sectors have turnaround times greater than the domestic worker sector. The differential
ranges from about one per cent in the construction sector to about eight per cent in the
agriculture sector.
The coefficient on the Con dummy implies that, for the same region, type of dispute,
sector, outcome and number of hearings, conciliation disputes at the con-arb process have
turnaround times that are approximately one per cent less than conciliation disputes at the
conciliation process. The coefficient on the number of hearings is significant and positive. This
is a key result, suggesting that conciliation undertaken as part of the con-arb process are in
fact marginally more efficient than those outside of con-arb. This coefficient can be interpreted
as the percentage increase in the turnaround times for each additional hearing. Therefore,
ceteris paribus, each additional hearing is predicted to increase the turnaround time by about
77 per cent. For a given region, type of dispute and sector, the difference in log (turnaround
time) between a case that is dismissed and a case that is settled is 0.0282. This means that
a dismissed case is predicted to have turnaround times that are approximately three per cent
higher than a settled case, holding other factors constant.
Table 9 shows the results from the arbitration processes. The sample of cases going to
arbitration is not a random selection of cases drawn from the pool of disputes at the CCMA.
We therefore follow the Heckman selection model described in the estimation approach
above to control for the sample selection problem and assume that natural log of arbitration
turnaround time is the dependent variable and that the variables listed in the outcome
equation, are the determinants of turnaround time. The variables specified in the selection
equation are assumed to determine whether the arbitration process is observed.
DPRU WP 09/137 Haroon Bhorat, Kalie Pauw & Liberty Mncube
53
As in the conciliation equation our independent variables include a set of regional CCMA office
dummy variables to which the dispute is referred:
• A set of economic sector dummy variables that indicate where the dispute originated.
• A set of year dummy variables that identify the year in which the dispute took place.
• Type of dispute dummy variables describe the four main types of disputes, while a
dummy variable Arb represents an arbitration case from the con-arb process.
• A continuous variable represents the number of hearings that a particular case had
for it to be resolved.
• A set of dummy variables capture the outcome of a dispute (that is, settled, pure
arbitration award and default arbitration award).
The difference between a pure and default award is that unlike a pure award, a default award
in an arbitration proceeding occurs if one of the parties to the dispute does not attend the
hearings and a decision is thus made in favour of the party that attends. A settled arbitration
occurs when parties at arbitration arrive at mutually acceptable solution to their dispute before
the arbitrator makes his or her decision.
Unlike the conciliation process, legal representation is allowed at arbitration proceedings.46 We
therefore include a set of representation dummy variables for both the worker and employer.
Representation as captured in the CMS database is not a mandatory field. As a result
information on representation is missing for the majority of cases. Thus we need to interpret to
interpret the representation results with caution. We also note that trade unions and employer
organisations often hire ‘consultant’ organisations to advise them. We choose rather to include
dummy variables for professional representation, for example, professional representation for
workers would include both legal and trade union representation instead of using dummies
for legal and trade union representation individually. We also include an interaction dummy
between a worker having professional representation and professional representation for
the employer in a given dispute. The referent variables are Western Cape (for region), unfair
dismissal disputes (for type of dispute) and domestic workers (for economic sector), 2006 (for
46 However, it should be clearly noted that legal representation is not automatically allowed in all cases. For example, in cases where the reason for dismissal relates to misconduct and capacity, legal representation is not allowed. A party may make an application for legal representation in terms of Rule 25(1)(c) of the Rules for the Conduct of Proceedings before the CCMA (CCMA, 2007).

Understanding the Efficiency and Effectiveness of the Dispute Resolution System in South Africa: An Analysis of CCMA Data
54
individual years), pure arbitration award (for outcome of the dispute) and no representation (for
type of representation).
Consider first the parameter estimates of the selection equation in Table 9. Notice that only
the Northern Cape region has a significant and negative coefficient. Interestingly, this finding
suggests that a case from the Northern Cape region has a decreased probability (about four
per percent) of proceeding to arbitration relative to a case from the Western Cape which is
the same in all other respects (including the type of dispute and the sector ). On the other
hand, all the other regions have significant and positive coefficients. This means that all
other regions apart from the Northern Cape have an increased probability of proceeding to
arbitration relative to the Western Cape. The differential ranges from about 12 per cent in East
London to about 75 per cent in Pretoria.
Another important observation from the selection equation is that unfair labour practice, mutual
interest, severance pay and other dispute types are all significant and negative. In other words,
the dispute type dummies suggest that the probability of arbitration decreases for all disputes
relative to unfair dismissal disputes, holding the sector and region of the case constant. Put
differently, an unfair dismissal case has the highest conditional probability of proceeding
to arbitration. The coefficients on agriculture and construction are negative and significant
which indicates that holding the type of dispute and the region constant, the agriculture and
construction sectors have a decreased probability (about ten per cent and five per cent
respectively) of proceeding to arbitration relative to the domestic workers sector while all the
sectors have an increased probability. Of interest from the sector dummies is that the utilities
and public service sector have the highest increased probability of proceeding to arbitration,
holding the other variables constant. These two sectors are also more likely to have the largest
share of essential workers who under the LRA are prohibited from industrial action. The Mills
ratio is shown to be significant and negative, thus suggesting that sample selection bias was
detected and subsequently corrected for.

DPRU WP 09/137 Haroon Bhorat, Kalie Pauw & Liberty Mncube
55
Table 9: Determinants of Turnaround time of the CCMA Arbitration Processes: 2001-2006
N t *** Si ifi t t th t l l ** Si ifi t t th fi t l l d * Si ifi t t th t
Dependent Variable: Dependent Variable: Log (Turnaround Time) Arbitration Selection Equation Coef. Outcome Equation Coef. East Cape EL 0.1241 *** East Cape EL 0.3011 *** East Cape PE 0.2917 *** East Cape PE -0.0167 **Free State 0.1787 *** Free State 0.3651 *** Gauteng PT 0.7543 *** Gauteng PT -0.1402 *** Gauteng JB 0.4119 *** Gauteng JB 0.1741 *** Limpopo 0.1392 *** Limpopo -0.0852 *** Mpumalanga 0.5143 *** Mpumalanga -0.1676 *** Northern Cape -0.0447 ** Northern Cape -0.3930 *** North West 0.3458 *** North West -0.2378 *** KwaZulu-Natal DB 0.4268 *** KwaZulu-Natal DB -0.3844 *** KwaZulu-Natal PM 0.1264 *** KwaZulu-Natal PM -0.3693 *** KwaZulu-Natal RB 0.2517 *** KwaZulu-Natal RB -0.3451 *** Unfair Labour Practice -0.2200 *** Unfair Labour Practice -0.0125 **Mutual Interest -2.5120 *** Mutual Interest -0.2914 *** Severance Pay -0.3236 *** Severance Pay 0.0103Other Type Dispute -1.0821 *** Other Type Dispute 0.0565 *** Agriculture -0.0993 *** Agriculture 0.1220 *** Mining 0.0991 *** Mining 0.1023 *** Manufacturing 0.1063 *** Manufacturing 0.0391 *** Construction -0.0495 *** Construction 0.0204 *** Trade 0.0369 *** Trade 0.0532 *** Transport 0.1385 *** Transport 0.0474 *** Finance -0.0055 Finance 0.0678 *** Social Services 0.0065 Social Services 0.0276 *** Electricity, Gas & Water 0.3163 *** Electricity, Gas & Water -0.0731 *** Security (Private) 0.1564 *** Security (Private) 0.0235 *** Public Service 0.4360 *** Public Service 0.0606 *** _cons -0.1353 *** Number of Hearings 0.3267 *** Prof- Rep-Worker 0.0237 *** /athrho 0.0085 * Prof- Rep -Employer 0.0066 */lnsigma -0.7797 *** Prof Worker * Employer -0.0083 * Award Employee -0.0322 *** rho 0.0085 Arb -1.3669 *** sigma 0.4585 Settled 0.0139 *** lambda 0.0039 Default Arb_awrd 0.0214 *** Dismissed 0.0626 *** 2001_02 0.1282 *** 2002_03 0.2117 *** 2003_04 0.0529 *** 2004_05 0.1085 *** _cons 4.0739 *** Number of obs = 269121 Wald chi2(40) = 368534.67Censored obs = 124228 Prob > chi2 = 0.0000
Notes: *** Significant at the one per cent level, ** Significant at the five percent level and * Significant at the ten percent level

Understanding the Efficiency and Effectiveness of the Dispute Resolution System in South Africa: An Analysis of CCMA Data
56
In terms of the outcome equation results, Pretoria, Port Elizabeth, Limpopo, Mpumalanga,
Northern Cape, North West, and the KwaZulu-Natal region all have significant and negative
coefficients, suggesting that these regions have turnaround times less than the Western
Cape, holding the other variables constant. The differential for these regions ranges from
about two per cent in Port Elizabeth to about 40 per cent in the Northern Cape. To interpret
the coefficients on the type of dispute dummy variables, recall that the estimates on the four
dummy variables measure the proportionate difference in the turnaround time relative to unfair
dismissal disputes. Therefore, the results by type of dispute suggest that unfair labour practice
and mutual interest disputes have turnaround times less (about one per cent and 30 per cent
respectively) than unfair dismissal disputes, holding all the other variables constant. Other
types of disputes have turnaround times greater (about five per cent) than unfair dismissal
disputes, holding all the other variables constant.
As in the conciliation equation the coefficient on the number of hearings is positive and
significant which means that the effect of an additional hearing is predicted to increase
the turnaround time by about 33 per cent, holding other factors constant. The increase in
turnaround times associated with number of hearings may represent an opportunity cost for
parties in dispute and the CCMA. These costs relate to costs arising from preparing for and
attending hearings. It is worth noticing that a case with professional representation for the
worker (but not for the employee) has a turnaround time of about two per cent more than when
a worker has no representation at all. Similarly, having professional representation for the
employer (but not for the worker) increases the turnaround times by about one per cent over
not having any representation at all, holding other factors constant. The differential between
those cases with professional representation for both workers and employers, relative to those
when there is no representation at all, is about two per cent. Hence, the results suggest that
formalised representation for either workers or employers result in a marginal increase in the
turnaround time for arbitration cases.
This is a potentially important result given that it may reflect the high presence of legal and
procedural technicalities within the CCMA resulting in a protracted arbitration process in
some cases. The fact that when a worker is represented by other forms of representation
such as a co-worker, the arbitration proceedings are more efficient relative to a worker not
having any representation at all indeed buttresses the view that over-proceduralisation and a
growing tendency toward technicalities in disputes may be frustrating attempts at increased
DPRU WP 09/137 Haroon Bhorat, Kalie Pauw & Liberty Mncube
57
efficiency within the CCMA.47 The coefficient on the arbitration dispute at the con-arb process
suggests that, holding other factors constant, arbitration disputes at the con-arb process have
turnaround times that are approximately 137 per cent less than arbitration disputes at the
arbitration process. This indeed reinforces the efficiency-enhancing impact realised through
the con-arb innovation.
The award employee award dummy is significant and negative. If the award is made in favour
of the worker, then the turnaround time of the arbitration proceedings is about three per cent
less than when the award is made in favour of the employer. One possible explanation for
this observation is that a risk-averse employer upon realising early that he has a weak case,
may decide to move to a speedy outcome instead of a protracted arbitration preceding which
can only raise costs to the employer. As an indication of the effect of the outcome of a dispute
on the turnaround times we included a set of outcome dummy variables to measure the
proportionate difference in the turnaround times for the different outcomes at the arbitration
proceedings. Table 9 shows that disputes that are settled at arbitration, disputes with a default
award or dismissed disputes all have significant and positive coefficients, which suggests
turnaround times of these cases are higher than pure arbitration cases that eventually result
in a formal arbitration award being rendered. This result is consistent with that of dismissed
cases in the conciliation equation. While at first this may seem counterintuitive – dismissed
cases are thrown out before any formal arbitration ruling has to be made, which in itself is
a time-consuming process – it perhaps points at the fact that cases that are dismissed (on
technical grounds) or due to parties not arriving at hearing (default awards) often take longer
to be closed due to technicalities that have to be resolved first. Those cases that eventually
lead to an arbitration award are probably more likely to be the straightforward ones that can be
resolved more speedily.
4.4.3. Concluding Remarks
In light of the overview and the patterns of dispute resolution described in Section 4, how
do we explain some of the key results presented above? First and foremost, the provincial
results suggest that the descriptive evidence as shown in Figure 6 and Table 6, illustrating
that KwaZulu-Natal and the Northern Cape offices, were the most efficiently provinces
corroborated in the econometric results. Although in the econometric results KwaZulu-Natal
is disaggregated into three regional offices, these three regional offices and the Northern
47 See Table 12 in the Appendix.
Understanding the Efficiency and Effectiveness of the Dispute Resolution System in South Africa: An Analysis of CCMA Data
58
Cape office are significantly more efficient relative to the Western Cape at both the conciliation
and arbitration processes. Our results have also shown that disputes of mutual interest are
the most efficiently resolved relative to unfair dismissal disputes at both conciliation and
arbitration proceedings due to the sense of urgency in these matters. It is possible that with
such disputes there is the inability or perhaps the lack thereof, to resort to an effective strike
action that persuades parties to speedily resolve their dispute at conciliation. Unfair dismissal
disputes account for the largest share of referrals at the CCMA. However, with unfair dismissal
disputes, parties will only settle at conciliation after assessing their risk of losing at arbitration,
and costs associated with arbitration. Our results have shown that professional representation
at the arbitration hearings leads to less efficient arbitration proceedings relative to not having
any representation at all, holding all the other factors fixed. We suggest that because each
party may believe that having professional representation moves the arbitrator’s perception of
a just settlement close to that party’s position and that the gain of professional representation
(in terms of a greater award) exceeds the costs, both the employers and workers may have
private incentives to have professional representation. Finally, the econometric work illustrates
that the con-arb innovation is in fact associated with an increase in efficiency both in terms of
conciliation and arbitration turnaround times.

DPRU WP 09/137 Haroon Bhorat, Kalie Pauw & Liberty Mncube
59
5. Conclusions and Policy Recommendations
The above has provided a deliberately clinical, and non-legalistic interpretation of the efficiency
and effectiveness of the CCMA since its inception. The study is groundbreaking in that it
employs advanced statistical techniques and models to analyse labour dispute referral trends
and investigate variations in efficiency across regions, sectors and types of disputes.
A number of key conclusions can be drawn from the statistical analysis and econometric
models. Firstly, while the growth in the number of referrals received by the CCMA was initially
high, it appears to have stabilised in recent years. It is also evident that no significant structural
changes in dispute patterns (types of disputes) or the share of referrals across regions and
economic sectors have occurred since the inception of the CCMA. While we observed slight
compositional shifts for agricultural and domestic workers shortly after the 2002 sectoral
determinations were enacted, none of these were lasting in nature. The stability in referral
rates and patterns should, in theory, aid regional CCMA offices in their planning processes.
Variations in measured efficiency across regions and financial years cannot be viewed as
resulting from unexpected structural or compositional shifts in dispute referrals, nor high or
unexpected growth in referrals. Instead, we believe, regional variations in turnaround times
or other efficiency measures are a function primarily of regional differences in organisational
effectiveness and management.
Secondly, the analysis paid some attention to dispute referrals originating from domestic
and agricultural workers. A perception that has developed is that referral rates from these
types of workers are overrepresented and pose an undue burden on the CCMA’s resources.
Furthermore, given the informal nature of occupational contracts of domestic and agricultural
workers, some have called for the introduction of separate dispute resolution processes within
the CCMA for these workers. The analysis here has shown that, given labour market statistics
and jurisdictional information, referral rates from domestic and agricultural workers are not
abnormally large or dominant. Furthermore, the statistical analysis has provided no significant
evidence that disputes involving these types of workers are necessarily less efficiently
resolved (as measured in terms of turnaround times for disputes) than other dispute types. As
discussed in the document, the CCMA has introduced measures that have seemingly been
successful in dealing with matters that have caused turnaround times for disputes from these
types of workers to be high in the past.

Understanding the Efficiency and Effectiveness of the Dispute Resolution System in South Africa: An Analysis of CCMA Data
60
The third main finding relates to the introduction of the con-arb process. The process of
con-arb, through ‘replacing’ conciliation and arbitration cases heard in separate hearings and
on separate days, made allowance for conciliation and arbitration cases to be run back-to-back
in a single hearing. The actual conciliation and arbitration processes that form part of a con-arb
process are no different from ‘pure’ conciliation and arbitration processes. The perception may
arise that more people would now opt to continue on to arbitration after the conciliation hearing
of a con-arb, simply because there is no real time delay, which reduces the cost of arbitration.
Since arbitrations are generally more resource intensive this would have been an undesirable
outcome. However, the results show that the share of cases settled at conciliation (either
during a ‘pure’ conciliation or during the conciliation phase of a con-arb) has remained stable
over the years, hence there is no evidence that the introduction of con-arb has caused a shift
towards arbitration. Early indications are that the settlement rate for con-arb is in fact higher
than for pure conciliation. Further, as the econometric evidence indicates, the introduction
of con-arb is associated with a drop in turnaround times for both conciliation and arbitration
cases.
A fourth conclusion pertains to atypical forms of employment and dispute resolution. A key
aspect of the post-1994 labour market environment in terms of employment trends has been,
as noted, the rise in the incidence of atypical employment – marked by work arrangements
such as outsourcing, labour brokering, part-time contracts and so on. While the CCMA data,
in its present format, has limited information on the nature of work contracts, the institution
should perhaps take a bigger responsibility for monitoring the impact of atypical forms of
employment on the incidence and nature of labour market disputes. It is also important to
formalise processes that would allow such disputes to be handled efficiently and effectively
within the legislative context.
Fifth, although it remained at the margins of this particular analysis, a worrying trend that
has emerged at the CCMA in recent years is a seemingly increased tendency for part-time
commissioners to postpone cases and utilise other mechanisms for delaying cases. While
concrete evidence is lacking, there is a concern that this is being done for financial reasons
given that they work on a contract/hourly basis. This is of course a sensitive issue and one
that we do not deal with in depth. It does, however, for the purposes of this study, point to the
importance of possibly including more detail on the commissioners themselves in order to
incorporate this evidence into any future econometric modelling.
DPRU WP 09/137 Haroon Bhorat, Kalie Pauw & Liberty Mncube
61
Sixth, the econometric evidence is both strong and consistent with regard to disputes of mutual
interest at both the conciliation and arbitration proceedings. Disputes of mutual interest are
most efficiently resolved relative to unfair dismissal disputes when controlling for other factors
due to the sense of urgency in the matters (industrial action). However, with rights disputes
(such as unfair dismissal disputes) parties will only settle at conciliation after assessing their
risk of losing at arbitration, and costs associated with arbitration. Furthermore, arbitration
cases with professional representation for both workers and employers have higher turnaround
times, relative to no representation at all when controlling for all the other factors. This is a
particularly powerful result. On the one hand it could indicate the complexity of the issues and
how thorough the CCMA deals with issues taking into account the social justice issues related
to a legal person’s right to be heard. On the other hand, it is indicative of the importance of
examining the role and functions of professional representation within the CCMA.
Finally, and related to the first conclusion, the econometric evidence suggests that KwaZulu-
Natal and the Northern Cape offices, when controlling for a range of factors, are the most
efficient provinces. In addition the descriptive evidence illustrating that the Eastern Cape
is the least efficient province is also supported by the empirical evidence. While variations
in efficiency can not be explained by case load pressures and resource constraints alone,
perhaps the CCMA is better placed to investigate issues around management and other
unique circumstances that exist in each province to explain differences in efficiency across the
provinces.
The study’s attempts at broadening our understanding of dispute resolution in South Africa
are, understandably, somewhat restricted by the availability of reliable and relevant data.
The study only uses CCMA case data. About 72 per cent of the South African workforce falls
under jurisdiction of the CCMA, while the rest, for all practical purposes, fall under any one of
the various Bargaining Councils. Cases referred to Bargaining Councils are excluded in the
analysis here given data compatibility and availability problems. While we believe that our
findings present an accurate reflection of dispute resolution in South Africa in general, this
hypothesis can only be tested once a comprehensive study is conducted using Bargaining
Council data as well. Although many non-jurisdictional cases are also referred to the CCMA
and recorded as such, the majority of these cases are dismissed during an initial screening
stage, and no further data is captured for these cases. For this reason these non-jurisdictional
cases are also largely excluded from the analysis here. A further limitation mentioned is the
fact that we only have data on those cases that are not resolved at the workplace. Hence the
Understanding the Efficiency and Effectiveness of the Dispute Resolution System in South Africa: An Analysis of CCMA Data
62
sample of cases that are observable already suffer from so-called selection bias, which cannot
be corrected in the econometric models used.
In summary, this paper has attempted, through the use of official CCMA data, to provide both
a descriptive and econometric analysis of the institutionalised dispute resolution system. As
noted, an analysis based solely on CCMA data may draw criticism. In addition the lack of
sufficient variable coverage, and possibly the difficulty in converting some of the qualitative
case evidence into quantitative information may have militated against a more exhaustive
analysis. It is hoped, however, that such a study provides for a point of departure for a more
informed debate on the role of dispute resolution in improving the economy’s labour regulatory
environment.
.
References

DPRU WP 09/137 Haroon Bhorat, Kalie Pauw & Liberty Mncube
63
6. References
Benjamin, P. 2006. The Impact of the Decisions of the Labour Courts on the Operation of the CCMA. Development Policy Research Unit, Draft Paper, November 2006.
Benjamin, P. and Gruen, C. 2006. The Regulatory Efficiency of the CCMA: A Statistical
Analysis of the CCMA’s Database, DPRU Working Paper No 06/110.
Bhoola, U. 2002. National Labour Law Profile: South Africa. International Labour
Organisation. Accessed at: http://www.ilo.org/public/english/dialogue/ifpdial/info/
national/sa.htm.
Bhorat, H. and Hinks, T. 2005. Changing Patterns of Employment and Employer-Employee
Relations in Post-Apartheid South Africa, Mimeo.
Bosch, D., Molahlehi, E. and Everett, W. 2004. The Conciliation and Arbitration Handbook:
A Comprehensive Guide to Labour Dispute Resolution Procedures. LexisNexis
Butterworths: Durban.
Brand, J. 2000. CCMA: Achievements and Challenges – Lessons from the First Three
Years, Industrial Law Journal, 21(1-3).
Brand, J. 2002. Bargaining Council Dispute Resolution under the LRA as Amended,
Industrial Law Journal, 23 (10-12) 1737.
CCMA. 2007. CCMA Commentary and Input on “Understanding the Efficiency and
Effectiveness and Efficiency of the Dispute Resolution System in South Africa”.
Comments on an earlier draft of this paper, submitted by the CCMA, June 2007.
Cheadle, H. 2006. Regulated Flexibility and Small Business: Revisiting the LRA and the
BEA. Development Policy Research Unit Working Paper 06/109.
Understanding the Efficiency and Effectiveness of the Dispute Resolution System in South Africa: An Analysis of CCMA Data
64
Collier, D. 2003. The right to legal representation under the LRA, Industrial Law Journal,
24: 757.
Du Toit, D., Woolfrey, D., Godfrey, S., Bosch, D., Christie, S., Giles, G. and Rossow, J.
2003. Labour Relations Law – A Comprehensive Guide, 4th Edition. LexisNexis
Butterworths Durban.
Greene, W. 2003. Econometric Analysis, 5th. Upper Saddle River, NJ: Prentice: 5th Edition.
Heckman, J. (1979). “Sample Selection Bias as a Specification Error,” Econometrica, 47.
ILO. 2001. The Labour Legislation Guidelines, Substantive Provisions of Labour Legislation:
Settlement of Collective Labour Disputes. International Labour Organisation.
Accessed at: http://www.ilo.org/public/english/dialogue/ifpdial/llg/index.htm
(20 November 2006).
Lundall, P., Majeke, A. and Poswell, L. 2004. Atypical Employment and Labour Market
Flexibility: Experiences of Manufacturing Firms in the Greater Cape Town
Metropolitan Area. Development Policy Research Unit, Cape Town. July 2004.
Molahlehi, E.M. 2005. CCMA Developments: Review of Operations During 2004/2005.
Commission for Conciliation, Mediation and Arbitration. Accessed at: http://www.
lexisnexis.co.za/ServicesProducts/presentations/18th/EdwinMolahlehi.doc
(21 November 2006).
Ngcukaitobi, T. 2004. Sidestepping the Commission for Conciliation, Mediation and
Arbitration: Unfair Dismissal Disputes in the High Court, Industrial Law Journal, 25.
Roskam, A. 2007. An Exploratory Look into Labour Market Regulation. DPRU Working
Paper 07/116

DPRU WP 09/137 Haroon Bhorat, Kalie Pauw & Liberty Mncube
65
Van der Westhuizen, C. and Goga, S. 2009. Analysing Wage Formation in the South African
Labour Market: The Role of Bargaining Councils. DPRU Working Paper 09/135
Van Niekerk, A. 2005. In search of Justification, Industrial Law Journal, 25.
Van Niekerk, A. 2007. Regulating Flexibility and Small Business: Revisiting the LRA and
BCEA – A Response to Halton Cheadle’s Draft Concept Paper. DPRU Working
Paper 07/119
Venter, T. 2007. Personal Communication, 15 March 2007.
Young, L.K. 2004. CCMA arbitration awards: An update, Contemporary Labour Law, 14:2.
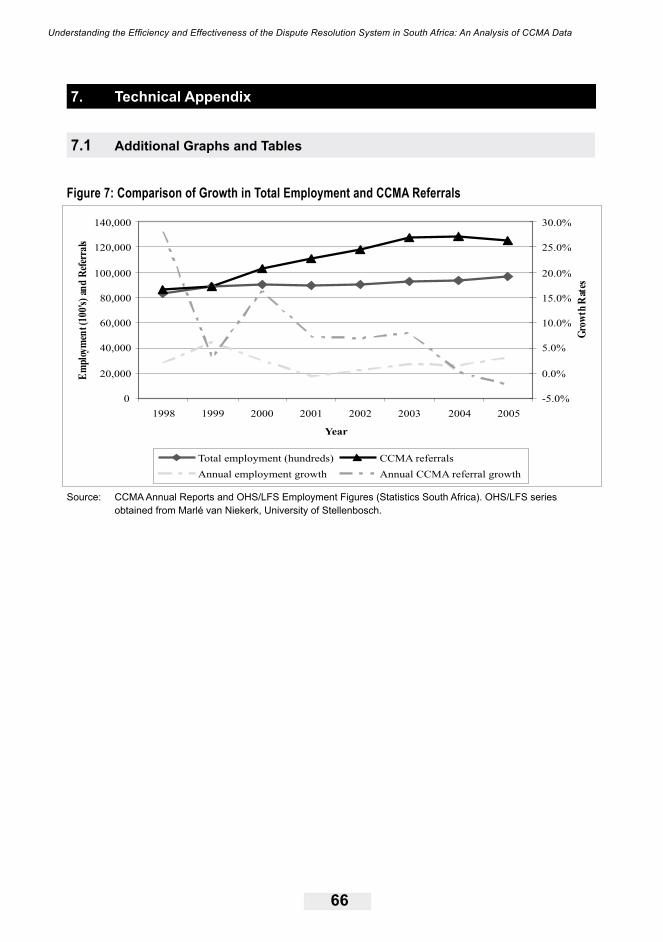
Understanding the Efficiency and Effectiveness of the Dispute Resolution System in South Africa: An Analysis of CCMA Data
66
7. Technical Appendix
7.1 Additional Graphs and Tables
Figure 7: Comparison of Growth in Total Employment and CCMA Referrals
0
20,000
40,000
60,000
80,000
100,000
120,000
140,000
1998 1999 2000 2001 2002 2003 2004 2005
Year
Em
ploy
men
t(10
0's)
and
Ref
erra
ls
-5.0%
0.0%
5.0%
10.0%
15.0%
20.0%
25.0%
30.0%
Gro
wth
Rat
es
Total employment (hundreds) CCMA referrals
Annual employment growth Annual CCMA referral growth
Source: CCMA Annual Reports and OHS/LFS Employment Figures (Statistics South Africa). OHS/LFS series obtained from Marlé van Niekerk, University of Stellenbosch.

DPRU WP 09/137 Haroon Bhorat, Kalie Pauw & Liberty Mncube
67
Table 10: List of Accredited Bargaining Councils
Furniture Manufacturing Industry (KZN) Contract Cleaning Industry
Restaurant Catering and Allied Trades Metal and Engineering Industry
Canvas Goods Industry Motor Industry
New Tyre Manufacturing Industry Road Freight Industry
Grain Industry Laundry Industry of South Africa
Entertainment Industry of South Africa Furniture Manufacturing Industry
Hairdressing and Cosmetology Trade (PTA) Electrical Industry Bargaining Council (National)
Sugar Manufacturing and Refining Industry Fishing Industry
Building Industry (Bloemfontein) Furniture Bedding and Upholstery
Tearoom Restaurant and Catering Trade (PTA)
Transnet
Hairdressing and Cosmetology Trade (National)
Amanzi Statutory Council
Building Industry (South-Eastern) South African Local Government
Building Industry (East London) General Public Service Sectoral Bargaining Council
Retail Meat Trade Public Service Co-ordinating Bargaining Council
Building Industry (Cape of Good Hope) Safety and Security Sectoral Bargaining Council
Printing, Newspaper and Packaging Industry
Public Health and Welfare Sector Sectoral
Clothing Industry
Source: CCMA Annual Report 2005/06
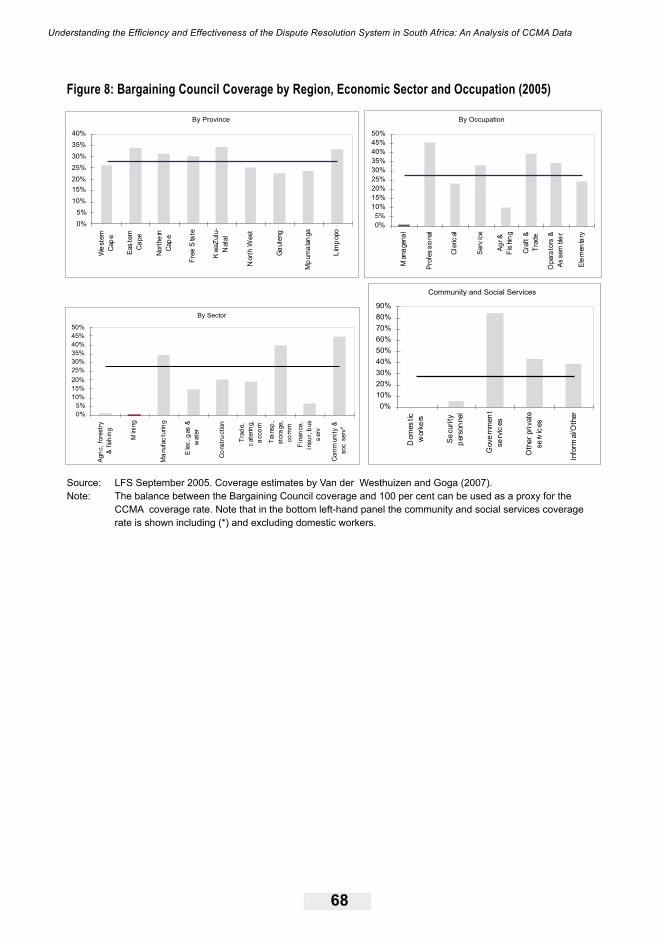
Understanding the Efficiency and Effectiveness of the Dispute Resolution System in South Africa: An Analysis of CCMA Data
68
Figure 8: Bargaining Council Coverage by Region, Economic Sector and Occupation (2005)
By Province
0%
5%
10%
15%
20%
25%
30%
35%
40%
We
ste
rn
Cap
e
Eas
tern
Ca
pe
Nort
he
rn
Cap
e
Fre
eS
tate
Kw
aZ
ulu
-
Nata
l
Nort
hW
est
Ga
ute
ng
Mp
um
ala
nga
Lim
popo
By Occupation
0%
5%
10%
15%
20%
25%
30%
35%
40%
45%
50%
Mana
geria
l
Pro
fes
sio
nal
Cle
ric
al
Serv
ice
Ag
r&
Fis
hin
g
Cra
ft&
Tra
de
Opera
tors
&
As
sem
ble
r
Ele
men
tary
By Sector
0%
5%
10%
15%
20%
25%
30%
35%
40%
45%
50%
Agri
c,
fore
str
y
&fish
ing
Min
ing
Ma
nufa
ctu
rin
g
Ele
c,g
as
&
wate
r
Co
nstr
uction
Tra
de,
cate
rin
g,
acco
m
Tra
nsp
,
sto
rage,
co
mm
Fin
an
ce,
insu
r,b
us
serv
Com
munit
y&
soc
serv
*
Community and Social Services
0%
10%
20%
30%
40%
50%
60%
70%
80%
90%
Dom
es
tic
work
ers
Se
curi
ty
pers
on
nel
Gove
rnm
en
t
se
rvic
es
Oth
er
pri
vate
se
rvic
es
Info
rmal/O
ther
Source: LFS September 2005. Coverage estimates by Van der Westhuizen and Goga (2007). Note: The balance between the Bargaining Council coverage and 100 per cent can be used as a proxy for the CCMA coverage rate. Note that in the bottom left-hand panel the community and social services coverage rate is shown including (*) and excluding domestic workers.
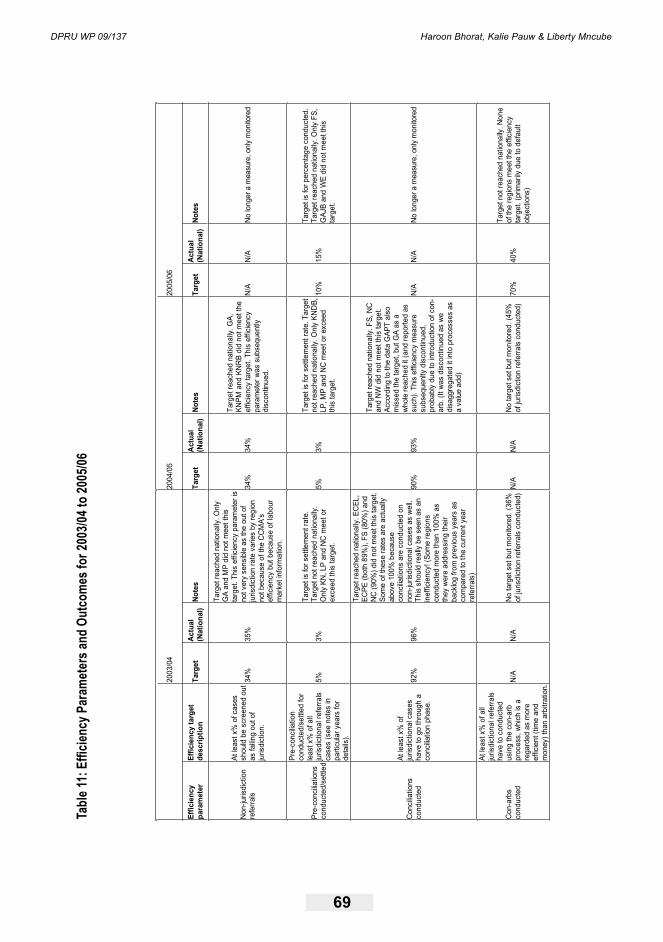
DPRU WP 09/137 Haroon Bhorat, Kalie Pauw & Liberty Mncube
69
Tabl
e 11:
Effi
cienc
y Par
amet
ers a
nd O
utco
mes f
or 20
03/04
to 20
05/06
20
03/0
4 20
04/0
5 20
05/0
6
Effic
ienc
y pa
ram
eter
Ef
ficie
ncy
targ
et
desc
riptio
n Ta
rget
Ac
tual
(N
atio
nal)
Note
s Ta
rget
Ac
tual
(N
atio
nal)
Note
s Ta
rget
Ac
tual
(N
atio
nal)
Note
s
Non
-juris
dict
ion
refe
rrals
At le
ast x
% o
f cas
es
shou
ld b
e sc
reen
ed o
ut
as fa
lling
out o
f ju
risdi
ctio
n.
34%
35
%
Targ
et re
ache
d na
tiona
lly. O
nly
GA
and
MP
did
not m
eet t
his
targ
et. T
his
effic
ienc
y pa
ram
eter
isno
t ver
y se
nsib
le a
s th
e ou
t of
juris
dict
ion
rate
var
ies
by re
gion
no
t bec
ause
of t
he C
CM
A's
effic
ienc
y bu
t bec
ause
of l
abou
r m
arke
t inf
orm
atio
n.
34%
34
%
Targ
et re
ache
d na
tiona
lly. G
A,
KNPM
and
KN
RB
did
not m
eet t
he
effic
ienc
y ta
rget
. Thi
s ef
ficie
ncy
para
met
er w
as s
ubse
quen
tly
disc
ontin
ued.
N/A
N
/A
No
long
er a
mea
sure
, onl
y m
onito
red
Pre-
conc
iliatio
ns
cond
ucte
d/se
ttled
Pre-
conc
iliatio
n co
nduc
ted/
settl
ed fo
r le
ast x
% o
f all
juris
dict
iona
l ref
erra
ls
case
s (s
ee n
otes
in
parti
cula
r yea
rs fo
r de
tails
).
5%
3%
Targ
et is
for s
ettle
men
t rat
e.
Targ
et n
ot re
ache
d na
tiona
lly.
Onl
y KN
, LP
and
NC
mee
t or
exce
ed th
is ta
rget
.
5%
3%
Targ
et is
for s
ettle
men
t rat
e. T
arge
t no
t rea
ched
nat
iona
lly. O
nly
KND
B,
LP, M
P an
d N
C m
eet o
r exc
eed
this
targ
et.
10%
15
%
Targ
et is
for p
erce
ntag
e co
nduc
ted.
Ta
rget
reac
hed
natio
nally
. Onl
y FS
, G
AJB
and
WE
did
not m
eet t
his
targ
et.
Con
cilia
tions
co
nduc
ted
At le
ast x
% o
f ju
risdi
ctio
nal c
ases
ha
ve to
go
thro
ugh
a co
ncilia
tion
phas
e.
92%
96
%
Targ
et re
ache
d na
tiona
lly. E
CEL
, EC
PE (b
oth
89%
), FS
(80%
) and
N
C (9
0%) d
id n
ot m
eet t
his
targ
et.
Som
e of
thes
e ra
tes
are
actu
ally
ab
ove
100%
bec
ause
co
ncilia
tions
are
con
duct
ed o
n no
n-ju
risdi
ctio
nal c
ases
as
wel
l. Th
is s
houl
d re
ally
be
seen
as
an
inef
ficie
ncy!
(Som
e re
gion
s co
nduc
ted
mor
e th
an 1
00%
as
they
wer
e ad
dres
sing
thei
r ba
cklo
g fro
m p
revi
ous
year
s as
co
mpa
red
to th
e cu
rrent
yea
r re
ferra
ls)
90%
93
%
Targ
et re
ache
d na
tiona
lly. F
S, N
C
and
NW
did
not
mee
t thi
s ta
rget
. Ac
cord
ing
to th
e da
ta G
APT
also
m
isse
d th
e ta
rget
, but
GA
as a
w
hole
reac
hed
it (a
nd re
porte
d as
su
ch).
This
effi
cien
cy m
easu
re
subs
eque
nlty
dis
cont
inue
d,
prob
ably
due
to in
trodu
ctio
n of
con
-ar
b. (I
t was
dis
cont
inue
d as
we
disa
ggre
gate
d it
into
pro
cess
es a
s a
valu
e ad
d)
N/A
N
/A
No
long
er a
mea
sure
, onl
y m
onito
red
Con
-arb
s co
nduc
ted
At le
ast x
% o
f all
juris
dict
iona
l ref
erra
ls
have
to c
ondu
cted
us
ing
the
con-
arb
proc
ess,
whi
ch is
a
rega
rded
as
mor
e ef
ficie
nt (t
ime
and
mon
ey) t
han
arbi
tratio
n.
N/A
N
/A
No
targ
et s
et b
ut m
onito
red.
(36%
of
juris
dict
ion
refe
rrals
con
duct
ed)
N/A
N
/A
No
targ
et s
et b
ut m
onito
red.
(45%
of
juris
dict
ion
refe
rrals
con
duct
ed)
70%
40
%
Targ
et n
ot re
ache
d na
tiona
lly. N
one
of th
e re
gion
s m
eet t
he e
ffici
ency
ta
rget
. (pr
imar
ily d
ue to
def
ault
obje
ctio
ns)
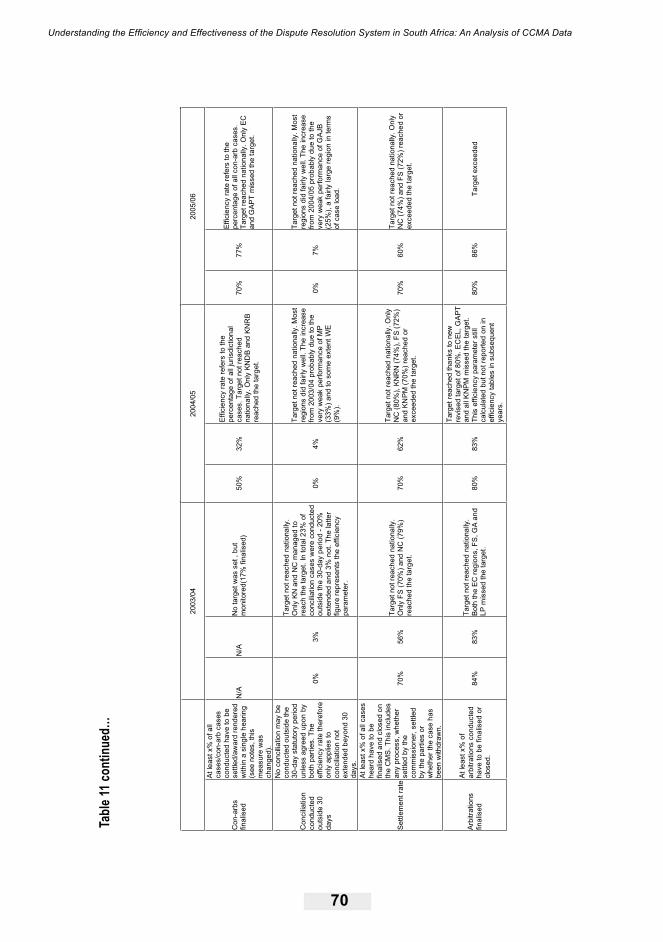
Understanding the Efficiency and Effectiveness of the Dispute Resolution System in South Africa: An Analysis of CCMA Data
70
20
03/0
4 20
04/0
5 20
05/0
6
Con
-arb
s fin
alis
ed
At le
ast x
% o
f all
case
s/co
n-ar
b ca
ses
cond
ucte
d ha
ve to
be
settl
ed/a
war
d re
nder
edw
ithin
a s
ingl
e he
arin
g (s
ee n
otes
, thi
s m
easu
re w
as
chan
ged)
.
N/A
N
/A
No
targ
et w
as s
et ,
but
mon
itore
d(17
% fi
nalis
ed)
50%
32
%
Effic
ienc
y ra
te re
fers
to th
e pe
rcen
tage
of a
ll ju
risdi
ctio
nal
case
s. T
arge
t not
reac
hed
natio
nally
. Onl
y KN
DB
and
KNR
B
reac
hed
the
targ
et.
70%
77
%
Effic
ienc
y ra
te re
fers
to th
e pe
rcen
tage
of a
ll co
n-ar
b ca
ses.
Ta
rget
reac
hed
natio
nally
. Onl
y EC
an
d G
APT
mis
sed
the
targ
et.
Con
cilia
tion
cond
ucte
d ou
tsid
e 30
da
ys
No
conc
iliatio
n m
ay b
eco
nduc
ted
outs
ide
the
30-d
ay s
tatu
tory
per
iod
unle
ss a
gree
d up
on b
ybo
th p
artie
s. T
he
effic
ienc
y ra
te th
eref
ore
only
app
lies
to
conc
iliatio
n no
t ex
tend
ed b
eyon
d 30
da
ys.
0%
3%
Targ
et n
ot re
ache
d na
tiona
lly.
Onl
y KN
and
NC
man
aged
to
reac
h th
e ta
rget
. In
tota
l 23%
of
conc
iliatio
n ca
ses
wer
e co
nduc
ted
outs
ide
the
30-d
ay p
erio
d - 2
0%
exte
nded
and
3%
not
. The
latte
r fig
ure
repr
esen
ts th
e ef
ficie
ncy
para
met
er.
0%
4%
Targ
et n
ot re
ache
d na
tiona
lly. M
ost
regi
ons
did
fairl
y w
ell.
The
incr
ease
from
200
3/04
pro
babl
y du
e to
the
very
wea
k pe
rform
ance
of M
P
(33%
) and
to s
ome
exte
nt W
E (9
%).
0%
7%
Targ
et n
ot re
ache
d na
tiona
lly. M
ost
regi
ons
did
fairl
y w
ell.
The
incr
ease
fro
m 2
004/
05 p
roba
bly
due
to th
e ve
ry w
eak
perfo
rman
ce o
f GAJ
B (2
5%),
a fa
irly
larg
e re
gion
in te
rms
of c
ase
load
.
Settl
emen
t rat
e
At le
ast x
% o
f all
case
she
ard
have
to b
e fin
alis
ed a
nd c
lose
d on
the
CM
S. T
his
incl
udes
any
proc
ess,
whe
ther
se
ttled
by
the
com
mis
sion
er, s
ettle
d by
the
parti
es o
r w
heth
er th
e ca
se h
as
been
with
draw
n.
70%
56
%
Targ
et n
ot re
ache
d na
tiona
lly.
Onl
y FS
(70%
) and
NC
(79%
) re
ache
d th
e ta
rget
. 70
%
62%
Targ
et n
ot re
ache
d na
tiona
lly. O
nly
NC
(80%
), K
NR
N (7
4%),
FS (7
2%)
and
KNPM
(70%
) rea
ched
or
exce
eded
the
targ
et.
70%
60
%
Targ
et n
ot re
ache
d na
tiona
lly. O
nly
NC
(74%
) and
FS
(72%
) rea
ched
or
exce
eded
the
targ
et.
Arbi
tratio
ns
final
ised
At le
ast x
% o
f ar
bitra
tions
con
duct
ed
have
to b
e fin
alis
ed o
r cl
osed
.
84%
83
%
Targ
et n
ot re
ache
d na
tiona
lly.
Both
the
EC re
gion
s, F
S, G
A an
dLP
mis
sed
the
targ
et.
80%
83
%
Targ
et re
ache
d th
anks
to n
ew
revi
sed
targ
et o
f 80%
. EC
EL, G
APT
and
all K
NPM
mis
sed
the
targ
et.
This
effi
cien
cy p
aram
eter
stil
l ca
lcul
ated
but
not
repo
rted
on in
ef
ficie
ncy
tabl
es in
sub
sequ
ent
year
s.
80%
86
%
Targ
et e
xcee
ded
Tabl
e 11 c
ontin
ued…
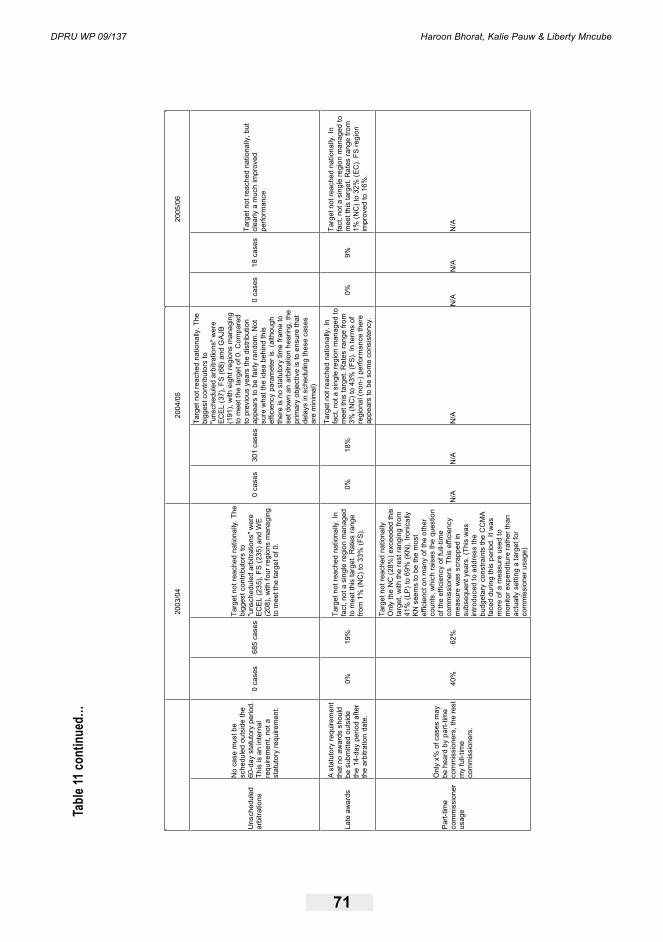
DPRU WP 09/137 Haroon Bhorat, Kalie Pauw & Liberty Mncube
71
20
03/0
4 20
04/0
5 20
05/0
6
Uns
ched
uled
ar
bitra
tions
No
case
mus
t be
sche
dule
d ou
tsid
e th
e 60
-day
sta
tuto
ry p
erio
d.Th
is is
an
inte
rnal
re
quire
men
t, no
t a
stat
utor
y re
quire
men
t.
0 ca
ses
685
case
s
Targ
et n
ot re
ache
d na
tiona
lly. T
he
bigg
est c
ontri
buto
rs to
"u
nsch
edul
ed a
rbitr
atio
ns" w
ere
ECEL
(235
), FS
(235
) and
WE
(208
), w
ith fo
ur re
gion
s m
anag
ing
to m
eet t
he ta
rget
of 0
.
0 ca
ses
301
case
s
Targ
et n
ot re
ache
d na
tiona
lly. T
he
bigg
est c
ontri
buto
rs to
"u
nsch
edul
ed a
rbitr
atio
ns" w
ere
ECEL
(37)
, FS
(68)
and
GAJ
B (1
91),
with
eig
ht re
gion
s m
anag
ing
to m
eet t
he ta
rget
of 0
. Com
pare
d to
pre
viou
s ye
ars
the
dist
ribut
ion
appe
ars
to b
e fa
irly
rand
om. N
ot
sure
wha
t the
idea
beh
ind
this
ef
ficie
ncy
para
met
er is
. (al
thou
gh
ther
e is
no
stat
utor
y tim
e fra
me
to
set d
own
an a
rbitr
atio
n he
arin
g, th
e pr
imar
y ob
ject
ive
is to
ens
ure
that
de
lays
in s
ched
ulin
g th
ese
case
s ar
e m
inim
al)
0 ca
ses
18 c
ases
Ta
rget
not
reac
hed
natio
nally
, but
cl
early
a m
uch
impr
oved
pe
rform
ance
.
Late
aw
ards
A st
atut
ory
requ
irem
ent
that
no
awar
ds s
houl
d be
sub
mitt
ed o
utsi
de
the
14-d
ay p
erio
d af
ter
the
arbi
tratio
n da
te.
0%
19%
Targ
et n
ot re
ache
d na
tiona
lly. I
n fa
ct, n
ot a
sin
gle
regi
on m
anag
ed
to m
eet t
his
targ
et. R
ates
rang
e fro
m 1
% (N
C) t
o 33
% (F
S).
0%
18%
Targ
et n
ot re
ache
d na
tiona
lly. I
n fa
ct, n
ot a
sin
gle
regi
on m
anag
ed to
mee
t thi
s ta
rget
. Rat
es ra
nge
from
3%
(NC
) to
43%
(FS)
. In
term
s of
re
gion
al (n
on-)
per
form
ance
ther
e ap
pear
s to
be
som
e co
nsis
tenc
y.
0%
9%
Targ
et n
ot re
ache
d na
tiona
lly. I
n fa
ct, n
ot a
sin
gle
regi
on m
anag
ed to
m
eet t
his
targ
et. R
ates
rang
e fro
m
1% (N
C) t
o 32
% (E
C).
FS re
gion
im
prov
ed to
16%
.
Part-
time
com
mis
sion
er
usag
e
Onl
y x%
of c
ases
may
be
hea
rd b
y pa
rt-tim
e co
mm
issi
oner
s, th
e re
stm
y fu
ll-tim
e co
mm
issi
oner
s.
40%
62
%
Targ
et n
ot re
ache
d na
tiona
lly.
Onl
y th
e N
C (2
8%) e
xcee
ded
this
ta
rget
, with
the
rest
rang
ing
from
41
% (L
P) to
69%
(KN
). Iro
nica
lly
KN s
eem
s to
be
the
mos
t ef
ficie
nct o
n m
any
of th
e ot
her
coun
ts, w
hich
rais
es th
e qu
estio
n of
the
effic
ienc
y of
full-
time
com
mis
sion
ers.
Thi
s ef
ficie
ncy
mea
sure
was
scr
appe
d in
su
bseq
uent
yea
rs. (
This
was
in
trodu
ced
to a
ddre
ss th
e bu
dget
ary
cons
train
ts th
e C
CM
A
face
d du
ring
this
per
iod.
It w
as
mor
e of
a m
easu
re u
sed
to
mon
itor e
xpen
ditu
re ra
ther
than
ac
tual
ly s
ettin
g a
targ
et fo
r co
mm
issi
oner
usa
ge)
N/A
N
/A
N/A
N
/A
N/A
N
/A
Tabl
e 11 c
ontin
ued…
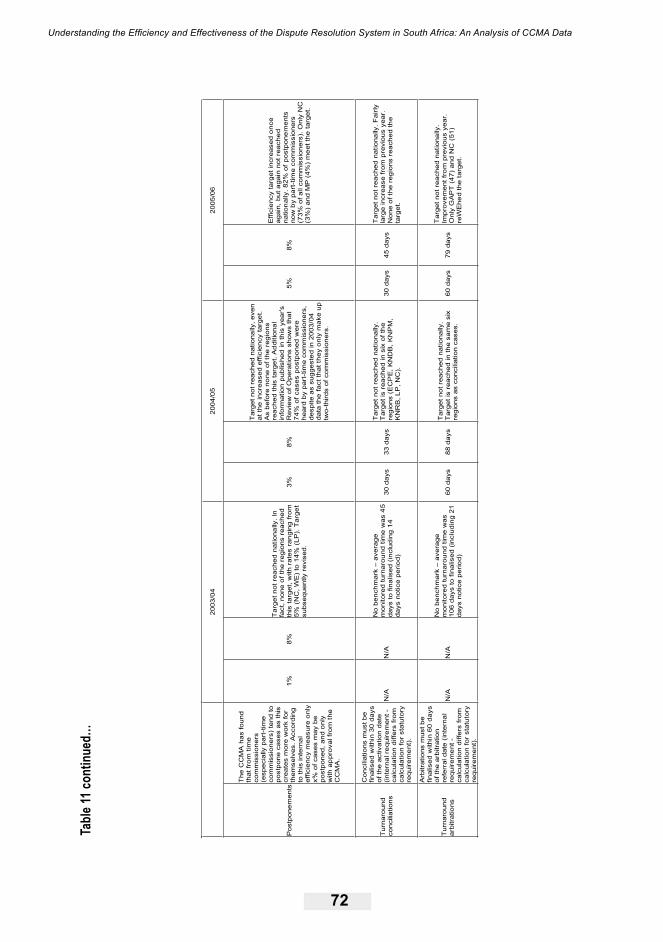
Understanding the Efficiency and Effectiveness of the Dispute Resolution System in South Africa: An Analysis of CCMA Data
72
20
03/0
4 20
04/0
5 20
05/0
6
Pos
tpon
em
ents
The
CC
MA
has
foun
d
that
from
tim
e co
mm
issi
oner
s (e
spec
ially
par
t-tim
e co
mm
issi
oner
s) te
nd to
post
pone
cas
es a
s th
iscr
eate
s m
ore
wor
k fo
r th
emse
lves
. Acc
ordi
ngto
this
inte
rna
l ef
ficie
ncy
mea
sure
onl
yx%
of c
ases
may
be
post
pone
d, a
nd o
nly
with
ap
prov
al fr
om t
he
CC
MA
.
1%
8%
Tar
get n
ot r
each
ed n
atio
nally
. In
fact
, non
e o
f the
reg
ions
rea
ched
th
is ta
rget
, with
rat
es r
angi
ng fr
om5%
(N
C, W
E)
to 1
4% (
LP).
Tar
get
subs
eque
ntly
rev
ised
.
3%
8%
Tar
get n
ot r
each
ed n
atio
nally
, eve
nat
the
incr
ease
d ef
ficie
ncy
targ
et.
As
befo
re n
one
of t
he r
egio
ns
reac
hed
this
targ
et.
Ad
ditio
nal
info
rmat
ion
pub
lishe
d in
this
yea
r'sR
evie
w o
f Ope
ratio
ns s
how
s th
at
74%
of c
ases
pos
tpon
ed w
ere
hear
d by
par
t-tim
e co
mm
issi
oner
s,de
spite
as
sugg
este
d in
200
3/04
da
ta th
e fa
ct th
at t
hey
only
mak
e up
two-
third
s of
com
mis
sion
ers.
5%
8%
Effi
cie
ncy
targ
et in
crea
sed
onc
e ag
ain,
but
aga
in n
ot r
each
ed
natio
nal
ly. 8
2% o
f po
stpo
nem
ents
no
w b
y pa
rt-t
ime
com
mis
sion
ers
(73%
of a
ll co
mm
issi
oner
s). O
nly
NC
(3%
) an
d M
P (
4%)
me
et th
e ta
rget
.
Tur
naro
und
conc
iliat
ions
Con
cilia
tions
mus
t be
final
ised
with
in 3
0 da
ysof
the
activ
atio
n da
te
(inte
rnal
re
quire
men
t -
calc
ulat
ion
diff
ers
from
calc
ulat
ion
for
stat
utor
yre
quire
me
nt).
N/A
N
/A
No
benc
hmar
k –
aver
age
m
onito
red
turn
arou
nd t
ime
was
45
days
to fi
nalis
ed (
incl
udin
g 1
4 da
ys n
otic
e pe
riod)
30 d
ays
33 d
ays
Tar
get n
ot r
each
ed n
atio
nally
. T
arge
t is
reac
hed
in s
ix o
f th
e re
gion
s (E
CP
E,
KN
DB
, K
NP
M,
KN
RB
, LP
, NC
).
30 d
ays
45 d
ays
Tar
get n
ot r
each
ed n
atio
nally
. Fai
rly
larg
e in
crea
se fr
om p
revi
ous
year
. N
one
of t
he r
egio
ns r
each
ed th
e ta
rget
.
Tur
naro
und
arbi
trat
ions
Arb
itrat
ions
mus
t be
final
ised
with
in 6
0 da
ysof
the
arb
itrat
ion
refe
rral
dat
e (i
nter
nal
requ
irem
ent
-
calc
ulat
ion
diff
ers
from
calc
ulat
ion
for
stat
utor
yre
quire
me
nt).
N/A
N
/A
No
benc
hmar
k –
aver
age
m
onito
red
turn
arou
nd t
ime
was
10
6 da
ys to
fina
lised
(in
clud
ing
21da
ys n
otic
e pe
riod)
60 d
ays
88 d
ays
Tar
get n
ot r
each
ed n
atio
nally
. T
arge
t is
reac
hed
in th
e sa
me
six
regi
ons
as c
onci
liatio
n ca
ses.
60
day
s79
day
s
Tar
get n
ot r
each
ed n
atio
nally
. Im
prov
emen
t fro
m p
revi
ous
year
. O
nly
GA
PT
(47
) an
d N
C (
51)
reW
Ehe
d th
e ta
rget
.
Tabl
e 11 c
ontin
ued…

DPRU WP 09/137 Haroon Bhorat, Kalie Pauw & Liberty Mncube
73
20
03/0
4 20
04/0
5 20
05/0
6
Cas
es
sche
dule
d pe
rda
y
Num
ber o
f cas
es
sche
dule
d pe
r day
per
ad
min
istra
tor
15 p
er d
ay
18 p
er d
ay
Targ
et re
ache
d na
tiona
lly. M
ost
effic
ient
is G
A (4
8 ca
ses)
- al
so
the
larg
est o
ffice
in te
rms
of
refe
rral
s. P
erha
ps th
ere
are
som
eec
onom
ies
of s
cale
/div
isio
n of
la
bour
ben
efits
? H
owev
er, s
econ
dbe
st is
LP
(34
case
s), a
fairl
y sm
all o
ffice
in c
ompa
rison
. A to
tal
of fi
ve re
gion
s m
isse
d th
e ta
rget
.
15 p
er d
ay10
per
day
Targ
et n
ot re
ache
d na
tiona
lly.
Wor
st p
erfo
rmin
g re
gion
is N
C (6
ca
ses)
. The
GA
regi
on's
pre
viou
s go
od p
erfo
rman
ce is
now
ave
rage
.
10 p
er
day
Rea
ched
Inco
mpl
ete
info
rmat
ion,
but
targ
et
reac
hed
at n
atio
nal l
evel
. (in
com
plet
e in
form
atio
n re
late
s to
H
ead
Offi
ce w
ho d
on’t
have
cas
e m
anag
emen
t offi
cers
)
Cas
es c
lose
d pe
r day
Num
ber o
f cas
es
clos
ed p
er d
ay p
er
adm
inis
trato
r 15
per
day
19 p
er d
ay
Targ
et re
ache
d na
tiona
lly. G
A (3
3ca
ses)
aga
in th
e m
ost e
ffici
ent,
with
not
muc
h va
riatio
n am
ong
the
rem
anin
g. S
ix re
gion
s m
isse
d th
eta
rget
.
15 p
er d
ay11
per
day
Targ
et n
ot re
ache
d na
tiona
lly.
Wor
st p
erfo
rmin
g re
gion
is N
C (5
ca
ses)
. The
GA
regi
on's
pre
viou
s go
od p
erfo
rman
ce is
now
ave
rage
.
10 p
er
day
Rea
ched
Inco
mpl
ete
info
rmat
ion,
but
targ
et
reac
hed
at n
atio
nal l
evel
. (in
com
plet
e in
form
atio
n re
late
s to
H
ead
Offi
ce w
ho d
on’t
have
cas
e m
anag
emen
t offi
cers
)
Cas
e ca
rry
over
Onl
y x%
of c
ases
may
be c
arrie
d ov
er to
the
next
fina
ncia
l yea
r (s
hare
of c
ases
not
cl
osed
at a
ny g
iven
po
int i
n tim
e, in
this
in
stan
ce y
ear-
end)
.
24%
16
%
Effic
ienc
y ta
rget
reac
hed
in a
ll re
gion
s ex
cept
EC
EL
(30%
). Th
ism
easu
re c
alcu
late
d bu
t not
pu
blis
hed
in e
ffici
ency
tabl
es in
su
bseq
uent
yea
rs.
30%
18
%
Targ
et e
xcee
ded
24%
20
%
Targ
et e
xcee
ded.
Dis
burs
emen
t(a
ctua
l vs
budg
et)
Budg
etar
y ef
ficie
ncy
Actu
al
Budg
eted
Targ
et re
ache
d na
tiona
lly. A
ll re
gion
s ex
cept
EC
EL
and
EC
PE
did
not m
eet t
heir
budg
etar
y re
quire
men
ts.
Actu
al
Budg
eted
Targ
et n
ot re
ache
d na
tiona
lly. I
n st
ark
cont
rast
to p
revi
ous
year
s on
ly K
ND
B, K
NPM
, KN
RB,
NC
and
NW
mee
t the
ir bu
dget
.
Actu
al
Budg
eted
Targ
et re
ache
d na
tiona
lly. A
ll re
gion
s ex
cept
FS,
LP,
MP
and
WE
did
not m
eet t
heir
budg
etar
y re
quire
men
ts.
Tabl
e 11 c
ontin
ued…
Sou
rce:
C
CM
A R
evie
w o
f Ope
ratio
ns, 2
003/
04 to
200
5/06
. Com
men
ts a
nd a
dditi
ons
by N
ersa
n G
oven
der,
CC
MA
.
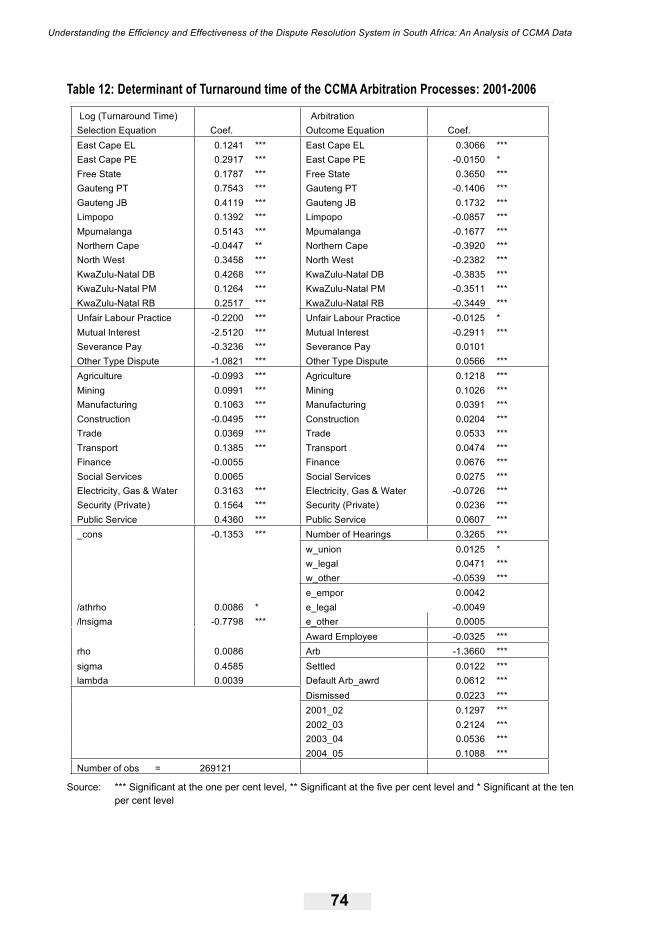
Understanding the Efficiency and Effectiveness of the Dispute Resolution System in South Africa: An Analysis of CCMA Data
74
Table 12: Determinant of Turnaround time of the CCMA Arbitration Processes: 2001-2006
Log (Turnaround Time) Arbitration Selection Equation Coef. Outcome Equation Coef. East Cape EL 0.1241 *** East Cape EL 0.3066 *** East Cape PE 0.2917 *** East Cape PE -0.0150 *Free State 0.1787 *** Free State 0.3650 *** Gauteng PT 0.7543 *** Gauteng PT -0.1406 *** Gauteng JB 0.4119 *** Gauteng JB 0.1732 *** Limpopo 0.1392 *** Limpopo -0.0857 *** Mpumalanga 0.5143 *** Mpumalanga -0.1677 *** Northern Cape -0.0447 ** Northern Cape -0.3920 *** North West 0.3458 *** North West -0.2382 *** KwaZulu-Natal DB 0.4268 *** KwaZulu-Natal DB -0.3835 *** KwaZulu-Natal PM 0.1264 *** KwaZulu-Natal PM -0.3511 *** KwaZulu-Natal RB 0.2517 *** KwaZulu-Natal RB -0.3449 *** Unfair Labour Practice -0.2200 *** Unfair Labour Practice -0.0125 *Mutual Interest -2.5120 *** Mutual Interest -0.2911 *** Severance Pay -0.3236 *** Severance Pay 0.0101Other Type Dispute -1.0821 *** Other Type Dispute 0.0566 *** Agriculture -0.0993 *** Agriculture 0.1218 *** Mining 0.0991 *** Mining 0.1026 *** Manufacturing 0.1063 *** Manufacturing 0.0391 *** Construction -0.0495 *** Construction 0.0204 *** Trade 0.0369 *** Trade 0.0533 *** Transport 0.1385 *** Transport 0.0474 *** Finance -0.0055 Finance 0.0676 *** Social Services 0.0065 Social Services 0.0275 *** Electricity, Gas & Water 0.3163 *** Electricity, Gas & Water -0.0726 *** Security (Private) 0.1564 *** Security (Private) 0.0236 *** Public Service 0.4360 *** Public Service 0.0607 *** _cons -0.1353 *** Number of Hearings 0.3265 *** w_union 0.0125 *
w_legal 0.0471 *** w_other -0.0539 ***
e_empor 0.0042/athrho 0.0086 * e_legal -0.0049/lnsigma -0.7798 *** e_other 0.0005 Award Employee -0.0325 *** rho 0.0086 Arb -1.3660 *** sigma 0.4585 Settled 0.0122 *** lambda 0.0039 Default Arb_awrd 0.0612 *** Dismissed 0.0223 *** 2001_02 0.1297 *** 2002_03 0.2124 *** 2003_04 0.0536 *** 2004_05 0.1088 *** Number of obs = 269121
Source: *** Significant at the one per cent level, ** Significant at the five per cent level and * Significant at the ten per cent level

DPRU WP 09/137 Haroon Bhorat, Kalie Pauw & Liberty Mncube
75
7.2. A Note on CCMA Jurisdiction
One of the issues identified as impacting on service delivery and efficiency of the CCMA is the
large number of cases that are being referred to this institution when they should have been
referred to the Labour Court, the Department of Labour or one of the Bargaining Councils. All
cases referred to the CCMA, including those that are out of jurisdiction, have to be recorded
and captured in the CMS database, which is administratively burdensome. It is nevertheless
important to screen the out of jurisdiction cases, if possible already at the referral stage, as it
reduces the administrative burden on the CCMA in the conciliation or arbitration phases.
It can be argued that the out of jurisdiction rate, that is, the percentage of total referrals that
are out of jurisdiction, is largely beyond control of the CCMA. Anyone can refer a case to the
CCMA and this case has to be processed by them, whether it falls within their jurisdiction or
not. For this reason it appears strange that a minimum out of jurisdiction rate of 34 per cent
was initially used as an efficiency target of the CCMA until 2004/05 (see Table 11). This may
have created perverse incentives for CCMA offices to be overly technical in deciding whether
cases are out of jurisdiction simply in order to meet the out of jurisdiction target.
Instead, as we argue here, a high out of jurisdiction rate actually has negative consequences
for efficiency, and hence the CCMA should strive to reduce the number of out of jurisdiction
referrals. The out of jurisdiction rate is really a reflection of the degree to which the labour force
lacks of information about jurisdictional matters. Part of the task of the CCMA, and of course
the Bargaining Councils and the Department of Labour, is to inform the public of their labour
rights, but also to educate them about how they should go about dealing with any disputes
that may arise. Therefore, if the CCMA is successful in educating the labour market in this
regards, the out of jurisdiction rate is likely to drop, resulting in lower administrative costs for
the institution.
Table 13 shows the out of jurisdiction rates by regional office for the years 2001/02, 2003/04
and 2005/06. In the early years the out of jurisdiction rate varied substantially between regions,
possibly since some regional offices at that stage had only just started operating and had few
cases. The national average in that year was 32.5 per cent. It subsequently rose to 35.3 per
cent, thus reaching the efficiency target of 34 per cent in that year. By 2005/06 the efficiency

Understanding the Efficiency and Effectiveness of the Dispute Resolution System in South Africa: An Analysis of CCMA Data
76
target had been removed, and the national average had also declined back to 32.0 per cent.
Variation between regions is also much lower, which suggest that an out of jurisdiction rate
of about one-third is probably a fair indication of the ‘natural’ out of jurisdiction rate of CCMA
referrals.
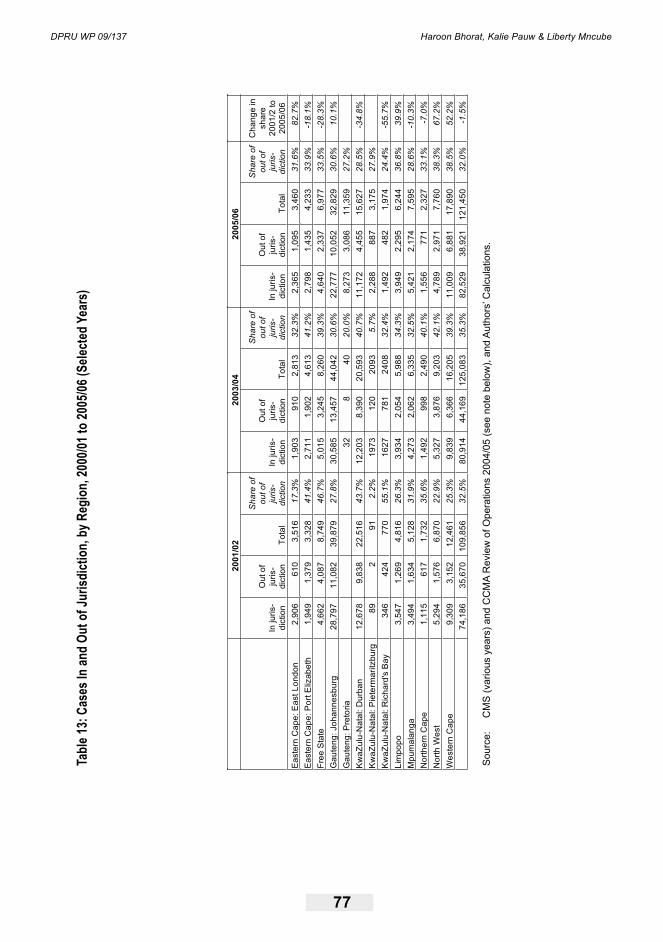
DPRU WP 09/137 Haroon Bhorat, Kalie Pauw & Liberty Mncube
77
Tabl
e 13:
Cas
es In
and
Out o
f Jur
isdict
ion,
by R
egio
n, 20
00/01
to 20
05/06
(Sele
cted
Year
s)
2001
/02
2003
/04
2005
/06
In ju
ris-
dict
ion
Out
of
juris
-di
ctio
n To
tal
Sha
re o
fou
t of
juris
-di
ctio
n In
juris
-di
ctio
n
Out
of
juris
-di
ctio
n To
tal
Sha
re o
fou
t of
juris
-di
ctio
n In
juris
-di
ctio
n
Out
of
juris
-di
ctio
n To
tal
Sha
re o
fou
t of
juris
-di
ctio
n
Cha
nge
in
shar
e 20
01/2
to
2005
/06
Eas
tern
Cap
e: E
ast L
ondo
n 2,
906
610
3,51
6 17
.3%
1,90
3 91
0 2,
813
32.3
%2,
365
1,09
5 3,
460
31.6
%82
.7%
Eas
tern
Cap
e: P
ort E
lizab
eth
1,94
9 1,
379
3,32
8 41
.4%
2,71
1 1,
902
4,61
3 41
.2%
2,79
8 1,
435
4,23
3 33
.9%
-18.
1%Fr
ee S
tate
4,
662
4,08
7 8,
749
46.7
%5,
015
3,24
5 8,
260
39.3
%4,
640
2,33
7 6,
977
33.5
%-2
8.3%
Gau
teng
: Joh
anne
sbur
g 28
,797
11
,082
39
,879
27
.8%
30,5
85
13,4
57
44,0
42
30.6
%22
,777
10
,052
32
,829
30
.6%
10.1
%G
aute
ng: P
reto
ria
32
8
40
20.0
%8,
273
3,08
6 11
,359
27
.2%
Kw
aZul
u-N
atal
: Dur
ban
12,6
78
9,83
8 22
,516
43
.7%
12,2
03
8,39
0 20
,593
40
.7%
11,1
72
4,45
5 15
,627
28
.5%
-34.
8%K
waZ
ulu-
Nat
al: P
iete
rmar
itzbu
rg
89
2 91
2.
2%19
73
120
2093
5.
7%2,
288
887
3,17
5 27
.9%
Kw
aZul
u-N
atal
: Ric
hard
's B
ay
346
424
770
55.1
%16
27
781
2408
32
.4%
1,49
2 48
2 1,
974
24.4
%-5
5.7%
Lim
popo
3,
547
1,26
9 4,
816
26.3
%3,
934
2,05
4 5,
988
34.3
%3,
949
2,29
5 6,
244
36.8
%39
.9%
Mpu
mal
anga
3,
494
1,63
4 5,
128
31.9
%4,
273
2,06
2 6,
335
32.5
%5,
421
2,17
4 7,
595
28.6
%-1
0.3%
Nor
ther
n C
ape
1,
115
617
1,73
2 35
.6%
1,49
2 99
8 2,
490
40.1
%1,
556
771
2,32
7 33
.1%
-7.0
%N
orth
Wes
t 5,
294
1,57
6 6,
870
22.9
%5,
327
3,87
6 9,
203
42.1
%4,
789
2,97
1 7,
760
38.3
%67
.2%
Wes
tern
Cap
e
9,30
9 3,
152
12,4
61
25.3
%9,
839
6,36
6 16
,205
39
.3%
11,0
09
6,88
1 17
,890
38
.5%
52.2
%
74,1
86
35,6
70
109,
856
32.5
%80
,914
44
,169
12
5,08
3 35
.3%
82,5
29
38,9
21
121,
450
32.0
%-1
.5%
Sou
rce:
C
MS
(var
ious
yea
rs) a
nd C
CM
A R
evie
w o
f Ope
ratio
ns 2
004/
05 (s
ee n
ote
belo
w),
and
Aut
hors
’ Cal
cula
tions
.
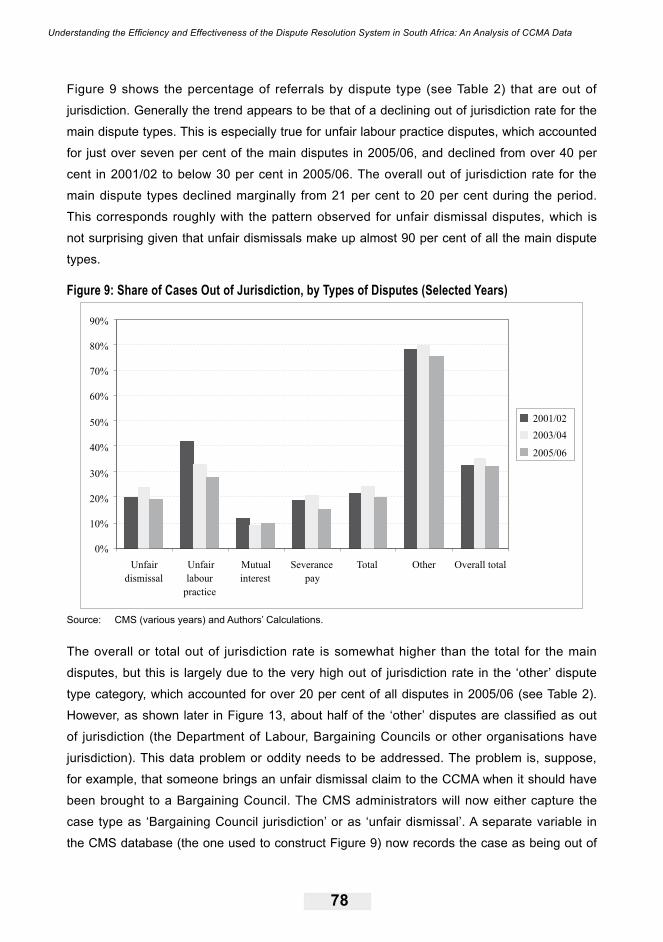
Understanding the Efficiency and Effectiveness of the Dispute Resolution System in South Africa: An Analysis of CCMA Data
78
Figure 9 shows the percentage of referrals by dispute type (see Table 2) that are out of
jurisdiction. Generally the trend appears to be that of a declining out of jurisdiction rate for the
main dispute types. This is especially true for unfair labour practice disputes, which accounted
for just over seven per cent of the main disputes in 2005/06, and declined from over 40 per
cent in 2001/02 to below 30 per cent in 2005/06. The overall out of jurisdiction rate for the
main dispute types declined marginally from 21 per cent to 20 per cent during the period.
This corresponds roughly with the pattern observed for unfair dismissal disputes, which is
not surprising given that unfair dismissals make up almost 90 per cent of all the main dispute
types.
Figure 9: Share of Cases Out of Jurisdiction, by Types of Disputes (Selected Years)
0%
10%
20%
30%
40%
50%
60%
70%
80%
90%
Unfair
dismissal
Unfair
labour
practice
Mutual
interest
Severance
pay
Total Other Overall total
2001/02
2003/04
2005/06
Source: CMS (various years) and Authors’ Calculations.
The overall or total out of jurisdiction rate is somewhat higher than the total for the main
disputes, but this is largely due to the very high out of jurisdiction rate in the ‘other’ dispute
type category, which accounted for over 20 per cent of all disputes in 2005/06 (see Table 2).
However, as shown later in Figure 13, about half of the ‘other’ disputes are classified as out
of jurisdiction (the Department of Labour, Bargaining Councils or other organisations have
jurisdiction). This data problem or oddity needs to be addressed. The problem is, suppose,
for example, that someone brings an unfair dismissal claim to the CCMA when it should have
been brought to a Bargaining Council. The CMS administrators will now either capture the
case type as ‘Bargaining Council jurisdiction’ or as ‘unfair dismissal’. A separate variable in
the CMS database (the one used to construct Figure 9) now records the case as being out of
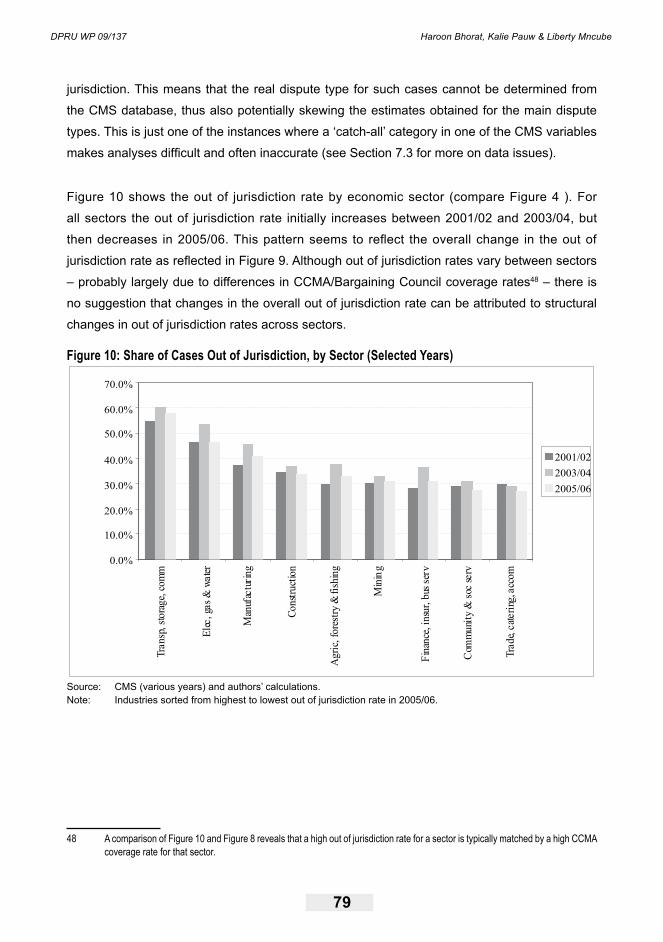
DPRU WP 09/137 Haroon Bhorat, Kalie Pauw & Liberty Mncube
79
jurisdiction. This means that the real dispute type for such cases cannot be determined from
the CMS database, thus also potentially skewing the estimates obtained for the main dispute
types. This is just one of the instances where a ‘catch-all’ category in one of the CMS variables
makes analyses difficult and often inaccurate (see Section 7.3 for more on data issues).
Figure 10 shows the out of jurisdiction rate by economic sector (compare Figure 4 ). For
all sectors the out of jurisdiction rate initially increases between 2001/02 and 2003/04, but
then decreases in 2005/06. This pattern seems to reflect the overall change in the out of
jurisdiction rate as reflected in Figure 9. Although out of jurisdiction rates vary between sectors
– probably largely due to differences in CCMA/Bargaining Council coverage rates48 – there is
no suggestion that changes in the overall out of jurisdiction rate can be attributed to structural
changes in out of jurisdiction rates across sectors.
Figure 10: Share of Cases Out of Jurisdiction, by Sector (Selected Years)
0.0%
10.0%
20.0%
30.0%
40.0%
50.0%
60.0%
70.0%
Tra
nsp
,st
ora
ge,
com
m
Ele
c,ga
s&
wate
r
Man
ufac
turi
ng
Const
ruct
ion
Agri
c,fo
rest
ry&
fish
ing
Min
ing
Fin
ance
,in
sur,
bus
serv
Com
muni
ty&
soc
serv
Tra
de,
cat
eri
ng,a
ccom
2001/02
2003/04
2005/06
Source: CMS (various years) and authors’ calculations.Note: Industries sorted from highest to lowest out of jurisdiction rate in 2005/06.
48 A comparison of Figure 10 and Figure 8 reveals that a high out of jurisdiction rate for a sector is typically matched by a high CCMA coverage rate for that sector.
Understanding the Efficiency and Effectiveness of the Dispute Resolution System in South Africa: An Analysis of CCMA Data
80
7.3. Proposals for Data Improvements
The CMS was designed as an internal tool to monitor the effectiveness and efficiency of
the CCMA. As such it is basically an administrative database and hence not entirely useful
to analyse dispute resolution issues in much detail. This is understandable, as much of the
information that is required to do better labour market research is not the kind of information
needed by the CCMA in order to improve performance. However, a strong case can be made
for the fact that a better understanding, broadly speaking, of how specific labour market
issues impact on the efficiency and effectiveness of the CCMA will also assist this institution in
improving their administrative processes.
7.3.1. Summary of Benjamin and Gruen’s Data Proposals
Benjamin and Gruen (2006) discuss a range of variables that they feel should be included
in the CMS data that would enable better analysis of labour market regulatory issues in the
future. Some of these proposals include the following:
• Length of service of employees: there is a perception that a large proportion of the
unfair dismissal cases concern employees with a short length of service.
• Nature of employment contracts: an identifier of non-standard employment contracts is
needed in order to investigate the issue of in limine cases in more depth.
• Earnings and skills levels of applicants: Many feel that the CCMA services, which
are free of charge, should be reserved for lower-skilled or low-income workers who
cannot afford private arbitration. Knowledge of the skills or income levels of applicants
would enable the CCMA to determine whether high-skilled applicants really congest
the system. It may also be that high-skilled workers typically have more complex
employment contracts, which may impact on the conciliation ruling or calculation of
arbitration awards.
• Size of employer: Often Small, Medium and Micro Enterprises (SMMEs) are mooted as
the drivers of employment in developing countries. SMMEs are by nature sensitive to
non-wage labour costs imposed by labour market regulation and legislation. Information
in this regard may be useful for analysing the economic implications of dispute
resolution processes for small firms.
• Representation at arbitration cases: At present representation is a non-mandatory
field in the CMS database. This makes analyses of the impact of representation on
DPRU WP 09/137 Haroon Bhorat, Kalie Pauw & Liberty Mncube
81
outcomes, turnaround times and so on difficult. It also makes it difficult to assess claims
that, for example, trade unions and employer organisations representing parties are
simply consultancies operating under a guise. Better information about representation
will also be useful to assess the cost implications of dispute resolution.
While scrutinising the CMS databases we also came across a number of oddities, data
problems and inconsistencies in the way in which information is captured. While the CMS is
clearly an enormously powerful and impressive database, we believe some further proposals
below would ensure improved analyses of the data.
7.3.1. Types of Unfair Dismissal or Unfair Labour Practice Cases
Figure 11 shows how different types of unfair dismissal cases are recorded in the CMS
database. This breakdown in the figure is based on 2005/06 data, and only includes
jurisdictional cases. Clearly unfair dismissal cases are not properly described in the CMS
database, with about 63 per cent of unfair dismissal disputes recorded as ‘reason for dismissal
unknown’ or ‘dismissal disputes not further classified’. This makes any analysis of the types
of unfair dismissal cases difficult. A further 25 per cent of unfair dismissal cases related to
misconduct, while the remainder are related to operational requirements and constructive
dismissals (both four per cent), incapacity (two per cent) and termination of contracts without
notice (one per cent). A variety of other categories exist in the CMS database, but these only
amount to about one per cent of all unfair dismissal disputes.

Understanding the Efficiency and Effectiveness of the Dispute Resolution System in South Africa: An Analysis of CCMA Data
82
Figure 11: Types of Unfair Dismissal Cases, 2005/06
Not known or further
classified
62.6%
Termination of
contract without
notice
1.2%
Other
1.2%Incapacity
2.3%
Misconduct
24.8%
Operational
requirements
4.0%
Constructive
dismissal
3.8%
Source: CMS (2005/06) and Authors’ Calculations.Note: Only cases in jurisdiction included.
Similarly, unfair labour practice is also not very well coded in the CMS database. About
29 per cent of cases are recorded under the default ‘unfair labour practice’ category, thus
making further analysis of the types of unfair labour practice cases pointless (see Figure 12).
Other relatively large categories include unfair suspension or discipline (40 per cent) and
unfair conduct relating to promotion, demotion or training (31 per cent). If the types of unfair
dismissal or unfair labour practice disputes that are referred to the CCMA for conciliation
or arbitration are important in determining, for example, variations in turnaround times, it is
important that the CMS database is improved to properly capture this information.
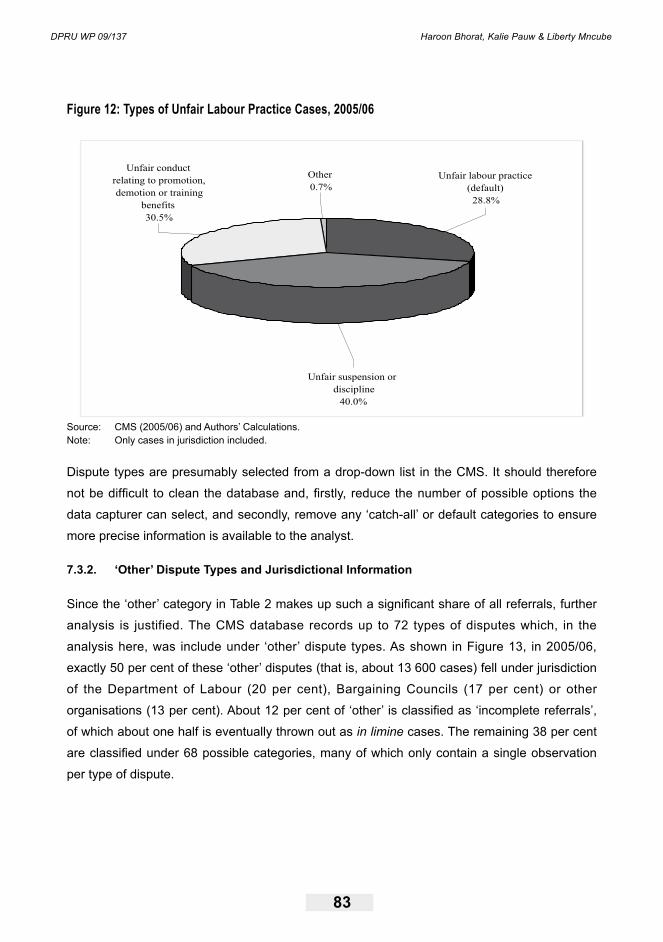
DPRU WP 09/137 Haroon Bhorat, Kalie Pauw & Liberty Mncube
83
Figure 12: Types of Unfair Labour Practice Cases, 2005/06
Unfair suspension or
discipline
40.0%
Unfair conduct
relating to promotion,
demotion or training
benefits
30.5%
Other
0.7%
Unfair labour practice
(default)
28.8%
Source: CMS (2005/06) and Authors’ Calculations.Note: Only cases in jurisdiction included.
Dispute types are presumably selected from a drop-down list in the CMS. It should therefore
not be difficult to clean the database and, firstly, reduce the number of possible options the
data capturer can select, and secondly, remove any ‘catch-all’ or default categories to ensure
more precise information is available to the analyst.
7.3.2. ‘Other’ Dispute Types and Jurisdictional Information
Since the ‘other’ category in Table 2 makes up such a significant share of all referrals, further
analysis is justified. The CMS database records up to 72 types of disputes which, in the
analysis here, was include under ‘other’ dispute types. As shown in Figure 13, in 2005/06,
exactly 50 per cent of these ‘other’ disputes (that is, about 13 600 cases) fell under jurisdiction
of the Department of Labour (20 per cent), Bargaining Councils (17 per cent) or other
organisations (13 per cent). About 12 per cent of ‘other’ is classified as ‘incomplete referrals’,
of which about one half is eventually thrown out as in limine cases. The remaining 38 per cent
are classified under 68 possible categories, many of which only contain a single observation
per type of dispute.

Understanding the Efficiency and Effectiveness of the Dispute Resolution System in South Africa: An Analysis of CCMA Data
84
Figure13:Classificationof‘Other’Disputes,2005/06
Department of Labour
jurisdiction
20%
Bargaining Council
jurisdiction
17%
Other organisation
has jurisdiction
13%
Incomplete referral
12%
Other
38%
Source: CMS (2005/06) and Authors’ Calculations.Note: The out of jurisdiction categories were only properly disaggregated in the CMS 2005/06. Prior to that there was only a single out of jurisdiction category, hence it is not possible to analyse the trends in this regard.
Thus, while it is useful to know which institution has jurisdiction (the standard out of jurisdiction
variable in the CMS does not mention this information), it is problematic to capture this
information in the dispute type variable. Many of these out of jurisdiction cases may in fact be
unfair dismissal or unfair labour market disputes, but given the way in which it is captured this
information is lost. The proposal is therefore, as before, to firstly reduce the number of options
that the data capturer can select for the dispute type variable, and to capture the jurisdictional
information separately from this.

DPRU WP 09/137 Haroon Bhorat, Kalie Pauw & Liberty Mncube
85
7.4. A Note on the Number of Hearings
The CMS database keeps a record of the number of hearings conducted until a determinative
process had been reached,that is, a case has been closed. Generally conciliation cases are
meant to be finalised in a single hearing, while a second hearing is scheduled for arbitration
cases. Consequently the majority of conciliation cases (between 87 and 90 per cent) are
resolved in a single hearing. For arbitration cases most are resolved in two hearings (between
55 and 57 per cent)49. For con-arb cases the share of cases resolved in a single hearing has
increased rapidly over the past five years. The estimates for 2001/02 included in Figure 14 are
based on only three con-arb cases conducted in that year and can be ignored. From 2002/03
onwards the rate improved from 51 per cent to 74 per cent currently.
Figure 14: Number of Hearings: Conciliation, Arbitration and Con-Arb Cases
0%
20%
40%
60%
80%
100%
200
1/0
2
200
2/0
3
200
3/0
4
20
04/0
5
200
5/0
6
200
1/0
2
200
2/0
3
200
3/0
4
20
04/0
5
200
5/0
6
200
1/0
2
200
2/0
3
200
3/0
4
20
04/0
5
20
05/0
6
Conciliation Arbitration Con-Arb
1 Hearing 2 Hearings 3 Hearings 4+ Hearings
Source: CMS (various) and Authors’ Calculations.
49 If arbitration cases resolved in single hearing are added the share increases to between 63 and 65 per cent.