Understanding the customer base of service providers: An ...
24
University of Central Florida University of Central Florida STARS STARS Faculty Bibliography 2000s Faculty Bibliography 1-1-2000 Understanding the customer base of service providers: An Understanding the customer base of service providers: An examination of the differences between switchers and stayers examination of the differences between switchers and stayers Jaishankar Ganesh University of Central Florida Mark J. Arnold University of Central Florida Kristy E. Reynolds University of Central Florida Find similar works at: https://stars.library.ucf.edu/facultybib2000 University of Central Florida Libraries http://library.ucf.edu This Article is brought to you for free and open access by the Faculty Bibliography at STARS. It has been accepted for inclusion in Faculty Bibliography 2000s by an authorized administrator of STARS. For more information, please contact [email protected]. Recommended Citation Recommended Citation Ganesh, Jaishankar; Arnold, Mark J.; and Reynolds, Kristy E., "Understanding the customer base of service providers: An examination of the differences between switchers and stayers" (2000). Faculty Bibliography 2000s. 7859. https://stars.library.ucf.edu/facultybib2000/7859
Transcript of Understanding the customer base of service providers: An ...

University of Central Florida University of Central Florida
STARS STARS
Faculty Bibliography 2000s Faculty Bibliography
1-1-2000
Understanding the customer base of service providers: An Understanding the customer base of service providers: An
examination of the differences between switchers and stayers examination of the differences between switchers and stayers
Jaishankar Ganesh University of Central Florida
Mark J. Arnold University of Central Florida
Kristy E. Reynolds University of Central Florida
Find similar works at: https://stars.library.ucf.edu/facultybib2000
University of Central Florida Libraries http://library.ucf.edu
This Article is brought to you for free and open access by the Faculty Bibliography at STARS. It has been accepted for
inclusion in Faculty Bibliography 2000s by an authorized administrator of STARS. For more information, please
contact [email protected].
Recommended Citation Recommended Citation Ganesh, Jaishankar; Arnold, Mark J.; and Reynolds, Kristy E., "Understanding the customer base of service providers: An examination of the differences between switchers and stayers" (2000). Faculty Bibliography 2000s. 7859. https://stars.library.ucf.edu/facultybib2000/7859

Customer Base of Service Providers / 65Journal of MarketingVol. 64 (July 2000), 65–87
Jaishankar Ganesh, Mark J. Arnold, & Kristy E. Reynolds
Understanding the Customer Base ofService Providers: An Examination
of the Differences BetweenSwitchers and Stayers
Creating and maintaining customer loyalty has become a strategic mandate in today’s service markets. Recentresearch suggests that customers differ in their value to a firm, and therefore customer retention and loyalty-build-ing efforts should not necessarily be targeted to all customers of a firm. Given these sentiments, it is becomingincreasingly necessary for firms to have a thorough understanding of their customer base. Yet current knowledgeis limited in providing insights to firms regarding the differences within their customer base. This research com-prises two studies in which the authors examine the differences among internal customer groups in a service indus-try. As theory suggests and as is empirically validated here, customers who have switched service providersbecause of dissatisfaction seem to differ significantly from other customer groups in their satisfaction and loyaltybehaviors. The findings offer some interesting implications for both marketing theory and practice.
Jaishankar Ganesh, Mark J. Arnold, and Kristy E. Reynolds are assistantprofessors, Department of Marketing, University of Central Florida. Theauthors thank the anonymous JM reviewers for their insightful commentsand constructive feedback that helped shape this article. The authorsgratefully acknowledge the financial support of the Department of Market-ing and the Office of Sponsored Research at the University of CentralFlorida. The authors thank Alicia Leuven for her assistance in data collec-tion and Ronald Michaels, Raj Echambadi, Ronald Hess, and Chris Whitefor their insightful comments and suggestions.
Over the past decade, researchers have recognizedthat customer switching behavior can have deleteri-ous effects on the profitability and viability of firms
in today’s marketplace. For example, statistics reveal thatU.S. corporations lose half their customers in five years andthat customer disloyalty at these rates stunts corporate per-formance by 25% to 50% (Reichheld and Teal 1996). How-ever, researchers have also observed that with each addi-tional year of a relationship between a company and aconsumer, the customer becomes less costly to servebecause of learning effects and decreased servicing costs.Over time, loyal customers build businesses by buyingmore, paying premium prices, and providing new referralsthrough positive word of mouth (Keaveney 1995; O’ Brienand Jones 1995; Reichheld and Kenny 1990). Given thisevidence, it is no wonder that companies are rushing toimplement retention and loyalty programs.
However, for all the anticipated benefits of customerretention and loyalty, problems have become evident insome of these efforts (Dowling and Uncles 1997). Central tothese concerns is researchers’ and practitioners’ realizationthat (1) not all customers should be targeted with retentionand loyalty efforts and (2) some of the most satisfied andloyal customers might still switch for reasons beyond thecontrol of the firm and at times even beyond the control of
the customer. Although it is encouraging to note the increas-ing awareness that not all customers are alike (Blattberg andDeighton 1996; Reichheld 1993), little is known about howand why they differ. Simply put, if important attitudinal andbehavioral differences can be identified among various cus-tomer groups, service providers can efficiently identify andtarget customers as part of a broader acquisition, valueassessment, and retention strategy. This, in essence, is thefocus of the current study.
A basic assumption of this research is that, at its mostfundamental level, a firm’s customer base can be thoughtto comprise two groups of customers: (1) customers whohave switched from other service providers (whom werefer to as “switchers”) and (2) those who have not (thefirst-time adopters whom we refer to as “stayers”). Theswitchers can be further classified into two types: dissatis-fied switchers and satisfied switchers (customers whoswitch for reasons other than dissatisfaction, e.g., job-related relocation). An understanding of how these cus-tomer groups differ in their attitude and behavior towardthe firm might provide crucial insights for designing andimplementing effective customer acquisition and retentionstrategies.
Prior research has related switching behavior/intentionsto perceptions of quality (Rust and Zahorik 1993), dissatis-faction (Crosby and Stephens 1987), and service encounterfailures (Kelley, Hoffman, and Davis 1993). However, thepredominant focus of the research addressing customerswitching behavior has been the costs to a firm because ofcustomer switching and the costs of replacing customerswho have defected (Keaveney 1995). In other words, priorresearch has focused on the “switched-from” firm and notthe “switched-to” firm. There is a dearth of research exam-ining what happens to customers after they have switched inregard to satisfaction with and loyalty to the new firm.
66 / Journal of Marketing, July 2000
We address this issue by proposing that customers whoswitch to a firm because of dissatisfaction with a previousservice provider constitute a key customer group that ischaracterized by a propensity for higher levels of satisfac-tion with and loyalty toward the new firm and accordinglycould be central to a firm’s acquisition and retention efforts.Drawing from rich theories on customer satisfaction andloyalty, we attempt to identify attitudinal and behavioralfactors that differentiate the three groups of customers (dis-satisfied switchers, satisfied switchers, and stayers) in theretail banking industry. In effect, the major objectives of thisstudy are
1. to examine whether the three groups of customers differ intheir overall satisfaction with the service provided by thecurrent firm (in the case of switchers, this would be theswitched-to firm),
2. to investigate the role of satisfaction with the various aspectsof the service in differentiating among the groups, and
3. to examine whether the groups differ in their involvementwith and loyalty behavior toward the service.
This research comprises two studies. In Study 1, on thebasis of a thorough review of relevant literature, we developand test research hypotheses pertaining to the objectives ofthe study. Then we describe the data, the analyses used intesting the hypotheses, and the research results. Study 2replicates the findings of Study 1 in a larger sample andexplores some interesting issues that arise from the resultsof the first study. The issues we examine in Study 2 include(1) the influence of time (tenure as a customer with the cur-rent firm) on the hypothesized difference among the groupsin terms of their overall satisfaction with the serviceprovider, (2) differences within the switcher groups in termsof their prior switching experiences, and (3) differenceswithin the three groups in terms of other relevant variables,such as commitment, dependence, and risk aversion. InStudy 2, we discuss the relevant literature pertaining to thesethree issues and empirically examine these relationships.Finally, on the basis of the findings of both studies, we drawmanagerial implications, discuss limitations pertaining tothe generalizability of the results, and offer guidelines forfurther research.
Theoretical Foundation andResearch Hypotheses
The literature on service satisfaction and switching behaviorsuggests that three critical constructs should be examinedwhen the differences among customers are investigated:customer loyalty, customer satisfaction, and involvement.First, the core of a valuable customer base consists of loyalcustomers. Research has shown that loyal customers aremore profitable not only in the short run because they spendmore (O’Brien and Jones 1995) but also in the long runbecause they spread positive word of mouth (Reichheld andTeal 1996). Loyal customers most directly affect profit byensuring a steady stream of future customers (Oliver 1997).Because of their current and potential future value, loyalcustomers are logically at the heart of a company’s mostvaluable customer group.
Second, satisfaction is also acknowledged as a key deter-minant of not only continued patronage but also firm prof-itability. Prior research has shown that satisfied customersexhibit reduced price elasticities and greater competitiveresistance and that firms enjoy reduced failure costs and anenhanced reputation (Anderson, Fornell, and Lehman 1994;Fornell 1992). The perspective of the satisfaction and servicesresearch suggests that satisfaction is also a significantantecedent to postpurchase attitude and repeat purchase inten-tions, as well as several other beneficial behavioral intentions(Anderson 1994; Zeithaml, Berry, and Parasuraman 1996).
Third, involvement has been shown to play a key role inthis area of research. Researchers have shown the importantmoderating influence of both purchase involvement (Oliva,Oliver, and MacMillan 1992) and ego involvement (Bloe-mer and Kasper 1995) on the satisfaction–loyalty relation-ship and the antecedent role that these variables play indetermining brand commitment (Beatty, Kahle, and Homer1988).
However, to our knowledge, no research has yet exam-ined whether or how these critical variables are likely to dif-fer among the three customer groups—dissatisfied switch-ers, satisfied switchers, and stayers. Drawing on the richtheoretical foundation in this area, in the current study weattempt to formulate and test specific hypotheses regardingdifferences among the three customer groups in terms ofcustomer satisfaction, involvement, and loyalty.
Overall Customer Satisfaction
Two broad theoretical bases are directly relevant to our study:the expectancy–disconfirmation paradigm (Oliver 1980) andcomparison-level theory (Thibaut and Kelly 1959).
Expectancy–disconfirmation theory. According to theexpectancy–disconfirmation paradigm (Oliver 1980), con-sumers judge satisfaction with a product by comparing previ-ously held expectations with perceived product performance.If performance is above (below) expectations, positive (neg-ative) disconfirmation occurs and increases (decreases) insatisfaction are expected. Thus, consumer satisfaction is afunction of expectations and disconfirmation, and predictiveexpectations are used as the standard of comparison.
More important, Oliver (1997) suggests that two under-lying forces drive the expectancy–disconfirmation process:assimilation and contrast effects. Assimilation strategyimplies a heavy reliance on expectations in arriving at satis-faction judgments, such that consumers are thought to assim-ilate performance toward previously held expectations(Oliver 1997). Similar to adaptation-level theory (Helson1964), expectations are viewed as the anchor for future per-formance evaluations and are believed to take on increasedimportance under conditions of high performance ambiguity.
Alternatively, contrast effects manifest themselves insatisfaction judgments, as consumers are likely to exagger-ate the perceived levels of performance so that performancelevels that exceed expectations tend to be rated much higherthan they really are (Oliver 1997). In effect, a consumer isbelieved to magnify perceptions of performance in thedirection of the performance discrepancy. Oliver (1997)notes that disconfirmation, a proxy for contrast effects, is
Customer Base of Service Providers / 67
strongest under conditions of high salience, or involvement,and when consumers are easily able to discern performancedifferences.
In this context, the dissatisfied switchers are likely toexperience higher levels of involvement (discussed subse-quently) and thus should easily discern changes in the per-formance levels from the previous dissatisfying serviceexperience to the new one. Thus, higher involvement sug-gests that the satisfaction judgments of the dissatisfiedswitchers will be disconfirmation driven. However, involve-ment tends to have the effect of magnifying disconfirmationeffects, regardless of whether an expectation is positively ornegatively confirmed. As such, elevated levels of involve-ment can, in some cases, have a deleterious effect on the dis-satisfied switcher’s level of satisfaction as well (Oliver1997). Thus, the question becomes whether the dissatisfiedswitchers are likely to experience positive disconfirmationor negative disconfirmation, a question addressed by com-parison-level theory.
Comparison-level theory. According to Thibaut andKelley (1959), the key to determining the level of satis-faction with and motivation to remain in a relationship isthe concept of comparison levels, of which two standardsare employed: the comparison level and the comparisonlevel for alternatives. The comparison level is “the stan-dard against which a member evaluates the ‘attractiveness’of the relationship or how satisfactory it is” (Thibaut andKelley 1959, p. 21). Thibaut and Kelley (1959) advancethe general hypothesis, which is central to our researchfocus, that the comparison level tends to move to the levelof outcomes currently being attained. Thus, a customerwho has experienced declining outcomes with a previousservice provider and switches because of dissatisfactionwill enter a new relationship with a reduced comparisonlevel. Therefore, we expect this customer to exhibit highlevels of satisfaction relative to other customers who haveexperienced relatively little change in their comparisonlevels.
Prior consumer research (e.g., LaTour and Peat 1979,1980), as well as interorganizational exchange research(e.g., Anderson and Narus 1990), has generally found sup-port for comparison-level theory predictions regarding priorexperience and satisfaction. However, although theory isinstructive regarding the generalized operation of expecta-tions and comparison standards, it remains relatively silenton the specific time frame in which these operations are sup-posed to occur. Therefore, the predictions that are suggestedby comparison-level theory should be treated with a degreeof caution.
In summary, expectancy–disconfirmation theory pre-dicts that satisfaction judgments of the dissatisfied switcherswill be disconfirmation driven, largely because of thesalience of the service to the customer, and that satisfactionjudgments will be more extreme for this group. Considera-tion of this theoretical prediction in the light of comparison-level predictions of higher satisfaction, or positive discon-firmation, suggests that the dissatisfied switchers will bemore satisfied than the other customer groups with their newservice provider. Therefore,
H1: All else being equal, compared with satisfied switchersand stayers, dissatisfied switchers are more satisfied withtheir current service providers.
A fundamental difference between customers who haveswitched for reasons other than dissatisfaction and customerswho have not switched at all is the notion that the satisfiedswitchers have prior experience with other service providersin the same category (i.e., experience-based norms). Thissuggests that differences exist in the sets of expectations usedby these two groups and accordingly implies differences inthe levels of subsequent satisfaction judgments. Althoughdissatisfied switchers also possess prior experience, thenature and valence of their experience differ from that of sat-isfied switchers, and this difference suggests opposite effectsin subsequent satisfaction judgments.
Researchers have shown that the nature and amount of aconsumer’s experience with an evoked set of brands areimportant determinants of the satisfaction process (Cadotte,Woodruff, and Jenkins 1987; Woodruff, Cadotte, and Jenk-ins 1983). Focal brand expectations are likely to result fromthe decision to use the brand, but consumers also enter thisscenario with different levels of prior product experience.Specifically, consumers with broader experience are likelyto develop different standards of comparison than con-sumers with less experience, such that prior experienceinfluences both focal brand expectations and product-cate-gory performance norms. These latter standards are closelyaligned with norms that reflect what the focal brand shouldbe able to achieve, not just predictions as to what the focalbrand will achieve. Although research in this area specifiesthe overall nature of these expectation processes, little guid-ance is offered regarding the specific time frame for theseoperations.
Oliver (1997) suggests that these experience-basednorms, when employed as expectations, determine the rela-tive level of a consumer’s expectations in a better than/worsethan sense. As such, it is reasonable to suggest that expecta-tions held by satisfied switchers will be at least at the levelspreviously held. This line of argument finds support in stud-ies that suggest that a positive relationship exists betweenprior experience and current levels of expectations (Zei-thaml, Berry, and Parasuraman 1993), as well as the upwardshift of should expectations over time (Boulding et al. 1993).The preceding discussion suggests the following:
H2: Compared with stayers, satisfied switchers are less satis-fied with their current service providers.
Customer Satisfaction with Service Dimensions
Although investigations of overall satisfaction provide use-ful insights into the various customer groups, further explo-ration of satisfaction with service dimensions provides amore detailed look into the factors that drive customer satis-faction. Researchers have suggested that satisfaction withspecific service attributes should be measured routinelywhen customer satisfaction and switching behavior areinvestigated (Rust and Zahorik 1993). The reasoning behindsuch advice relies on the multidimensional nature of per-ceptions of service quality and satisfaction, such that some

68 / Journal of Marketing, July 2000
dimensions may be perceived as more important than othersin determining overall satisfaction and intentions to repa-tronize or switch. Furthermore, by investigating individualservice dimensions, researchers are better able to provideactionable managerial guidance regarding which serviceareas a firm should concentrate on in efforts to build loyaltyamong current customers and attract profitable prospects.
Service quality research has shown that five dimensionsof service are most relevant in determining perceptions ofservice quality and satisfaction: tangibility, reliability,responsiveness, assurance, and empathy (Parasuraman, Zei-thaml, and Berry 1985, 1988, 1994). Other research hasshown that service factors such as convenience and warmthare dimensions of service satisfaction and loyalty (Rust andZahorik 1993). An underlying element of these various ser-vice dimensions is the notion of interaction with firm repre-sentatives, or a broader “people factor,” which theory sug-gests may be the most important determinant of overallsatisfaction and repeat patronage intentions in many serviceindustries.
According to the services marketing literature, serviceencounters are first and foremost social encounters (Berry1983; Czepiel 1990). The purchase of a service is a processthat relies on the interaction between the service providerand the customer, and therefore service encounters are con-sidered interpersonally relational in nature (see Crosby,Evans, and Cowles 1990; Crosby and Stephens 1987;Iacobucci and Ostrom 1996; Ostrom and Iacobucci 1995).As a result, customer perceptions of contact employees willaffect their perceptions of the company and greatly influ-ence customer satisfaction (Bitner, Booms, and Mohr 1994;Goff et al. 1997; Iacobucci and Ostrom 1996; Rust andZahorik 1993; Westbrook 1981).
This factor may be best understood as a problem-solvingissue. Service failure and recovery research suggests that inter-personal contact during service recovery is a factor in deter-mining ultimate satisfaction and perceptions of service quality(Kelley, Hoffman, and Davis 1993). In other words, servicepersonnel appear to be key to service recovery and otherrelated encounters, and because of this the customer’s ultimatesatisfaction or dissatisfaction is likely to be couched in termsof how the employees handled the service problem. Therefore,it makes sense that the people factor would discriminate betterthan other factors among customer groups with presumablydiffering service experiences. However, note that the impor-tance of the people factor is likely to vary across industries.
In summary, this research implies that satisfaction withservice dimensions related to interaction with a firm’s repre-sentatives is likely to be more important than satisfaction withthe other service dimensions and, in the research context here,is likely to be a discriminator among the various customergroups of interest. As such, we hypothesize the following:
H3: Satisfaction with the people factor of the service is astronger discriminant of the three groups of customers thansatisfaction with the other aspects of the service.
Involvement
The two forms of involvement relevant to this research arepurchase and ego involvement. Purchase involvement
relates to the level of concern for or interest in the purchaseprocess that is triggered by the need to consider a particularpurchase. Purchase involvement can best be understood asthe cost, effort, or investment in a purchase (Mittal and Lee1989; Zaichkowsky 1985). It is the outcome of a person’sinteraction with a product and the purchase situation(Beatty, Kahle, and Homer 1988) and is similar to, but morenarrowly focused than, Houston and Rothschild’s (1978)definition of situational involvement. Because customersare likely to experience changes in levels of purchaseinvolvement when key facets of the relevant environmentchange (Beatty, Kahle, and Homer 1988), such as a serviceswitch, stayers are not likely to experience purchaseinvolvement in a manner similar to that of switchers. There-fore, we hypothesize differences only between the twoswitching groups.
Switchers who are dissatisfied should be expected tohave experienced critical changes in levels of perceived ser-vice quality, whether they relate to core service failures, ser-vice encounters, or service design (Keaveney 1995). Nega-tive outcomes from such experiences are highly salient andare likely to be distinctive, atypical, and emotionallycharged, and such information is bound to be encoded morethoroughly and be more easily retrieved from memory(Folkes 1988). Such prior experiences will be factored intoexpectations and apprehensions about future service experi-ences (Oliver and Winer 1987), thereby affecting perceivedrisk associated with service selection and use (Mittal andLee 1989). Because the result of such cognitive evaluationsis an increase in purchase involvement (Bloch 1982; Blochand Richins 1983; Houston and Rothschild 1978), weexpect that the dissatisfied switchers experience greater lev-els of purchase involvement than customers who switch forother reasons. This suggests the following:
H4: Compared with satisfied switchers, dissatisfied switchersexhibit higher levels of purchase involvement.
Ego involvement has been defined as the “importance ofthe product to the individual and to the individual’s self con-cept, values, and ego” (Beatty, Kahle, and Homer 1988, p.150). Ego involvement is similar to enduring involvement,which is defined as an ongoing concern for a particularproduct class and relatively independent of purchase situa-tions (Bloch and Richins 1983; Richins and Bloch 1986).Although ego involvement has also been conceptualized asa relatively stable phenomenon (Richins and Bloch 1986),researchers have recognized several psychological mecha-nisms that are likely to influence the levels of ego involve-ment people experience.
One such mechanism is familiarity, which according toSherif and Cantril (1947), can increase ego involvement.Customers who have experience with only one serviceprovider—the stayers—are more likely to experience higherdegrees of familiarity and to develop a favorable attitudetoward a particular service provider and the service categoryin general. Thus, their level of ego involvement is likely tobe higher than that of the other customer groups. Therefore,we hypothesize the following:
H5: Compared with stayers, both dissatisfied and satisfiedswitchers exhibit lower levels of ego involvement.

Customer Base of Service Providers / 69
Customers who switch because of dissatisfaction arelikely to experience changes in their levels of ego involve-ment with a specific service category. A previously positiveelement of self-definition that has now become negative(i.e., the service) is not likely to continue to play the samerole in defining the customer’s self-identity. The manifesta-tion of this cognitive process is a reduction in the level ofego involvement by the customer regarding the service rela-tionship. Such changes in ego involvement are not unex-pected, as ego involvement has long been conceptualized aschanging in response to the stresses and strains that peopleexperience (Sherif and Cantril 1947).
Furthermore, dissatisfying service experiences, particu-larly those that result from service failures, accumulate up tothe point of service switching and are salient and memo-rable. This negative consumption experience should influ-ence the extent of enduring importance that a person placeson the product or service category (Bloch and Richins1983). This is particularly relevant because consumerresearchers have identified several psychological copingmechanisms that relate to devaluing, or decreasing theimportance of, the object causing psychological stress(Pearlin and Schooler 1978). A dissatisfying relationshipthat results in termination would influence the degree ofimportance consumers place on that service in defining theirself-concept and as a result would influence the level of egoinvolvement associated with that service category. Thisleads us to hypothesize the following:
H6: Compared with satisfied switchers, dissatisfied switchersexhibit lower levels of ego involvement.
Customer Loyalty
An important consideration in a service firm’s customerbase is the degree to which its customers are loyal. We con-ceptualize customer loyalty as a combination of both com-mitment to the relationship and other overt loyalty behav-iors. This is consistent with prior loyalty research (see Day1969; Dick and Basu 1994). Again, we rely on the work ofThibaut and Kelley (1959) and the loyalty literature in for-mulating our hypotheses related to group differences.
Comparison-level theory revisited. The comparison levelfor alternatives is the standard a person uses in decidingwhether to remain in a relationship and can be defined infor-mally as the “lowest level of outcomes a person will acceptin light of available alternative opportunities” (Thibaut andKelley 1959, p. 21). The position of the comparison level foralternatives on a person’s hypothetical outcome continuumis based largely on the range of outcomes believed to exist inthe next best alternative relationship, and as soon as currentperceived outcomes drop below comparison level for alter-natives, the person is motivated to leave the relationship.
Several points become relevant regarding customer loy-alty. First, Thibaut and Kelley (1959) suggest that thegreater the distance between the comparison level for alter-natives and actual outcomes, the closer the person comes tomaximizing the rewards–cost trade-off in the relationship—therefore, the greater is the dependence and commitment onthe part of the customer to continue the relationship. Recentresearch has shown the fundamental role that commitment
plays in the construct of customer loyalty (Assael 1987;Morgan and Hunt 1994), as well as the close relationshipdependence and commitment have in relational exchanges(Bendapundi and Berry 1997; Ganesan 1994).
Second, the outcome continuum allows for the relativepositions of comparison level, comparison level for alterna-tives, and actual outcomes to differ (Thibaut and Kelley1959), such that certain orderings are suggestive of strong,or true, customer loyalty, whereas other orderings suggestconditions similar to spurious loyalty (e.g., Day 1969; Dickand Basu 1994). For example, when a customer’s compari-son level exceeds actual outcomes as well as the comparisonlevel for alternatives, the customer is relatively dissatisfiedyet is also relatively dependent on the relationship—a situa-tion that is analogous to spurious loyalty. Thus, the applica-tion of comparison-level theory to customer loyaltyprocesses exhibits a certain degree of theoretical discrimi-nation in regard to the different types of customer loyalty.
Finally, a closer inspection of switching behavior in lightof the dynamics of comparison levels provides further insightinto the loyalty phenomenon. As perceived outcomes fallbelow a person’s comparison level for alternatives, that personis motivated to leave the relationship, the consideration set foravailable alternatives is reduced, and the comparison level foralternatives falls to represent the next best set of outcomes thatcould be attained (Thibaut and Kelley 1959). As such, com-pared with other customer groups, dissatisfied switchers arelikely to move from a state in which both outcomes and thecomparison level are below the comparison level for alterna-tives to a state in which perceived outcomes are significantlyabove both the comparison level and the comparison level foralternatives—a situation that is conducive to higher levels ofboth satisfaction and loyalty. Prior research has provided alimited test of this proposition, showing that consumers withpoor prior experience exhibit higher satisfaction and repeatpurchase intentions with the new brand (LaTour and Peat1980; Mazursky, LaBarbera, and Aiello 1987).
Customers who switch for other reasons or customerswho do not switch at all will experience relatively smallshifts in their comparison level and comparison level foralternatives largely because perceived actual outcomes withtheir current service provider change little and their consid-eration set for available alternatives remains relativelyunchanged. The likely result of such mechanics is sugges-tive of considerable differences in both satisfaction and loy-alty between customers who have switched serviceproviders because of dissatisfaction and other customergroups. This leads us to hypothesize the following:
H7: Compared with satisfied switchers and stayers, dissatisfiedswitchers are more loyal to their current service.
Intuitively, it appears that customers who have switchedservice providers for reasons other than dissatisfaction areless likely to hold negative attitudes and feelings towardtheir previous service provider. Many of these customers arelikely to remember their previous service provider in a pos-itive light and factor their previous experience into currentexpectations, emotions, and behavior. Although these vari-ous psychological constructs have been conceptualized to beantecedents to customer loyalty (Dick and Basu 1994), one

70 / Journal of Marketing, July 2000
particularly important variable appears to be the conativeantecedent of perceived switching costs. Higher perceivedswitching costs are believed to result in higher loyalty atti-tudes and intentions. Because satisfied switchers have priorexperience with other service providers as well as theprocess of switching service providers, it can reasonably beassumed that the inhibiting influence of perceived switchingcosts will be less prevalent within this group and subse-quently will have a negative influence on the formation ofloyalty.
We also see evidence in the brand-switching literature,which has shown that consumers who switch because ofextrinsic factors (e.g., coupons, price) are more likely toexhibit lower satisfaction and repeat purchase intentionswith the switched-to brand than consumers who are intrinsi-cally motivated (e.g., dissatisfaction, the desire to try a newbrand) (LaBarbera and Mazursky 1983; Mazursky, LaBar-bera, and Aiello 1987). Given this evidence, we have a basisfor suggesting that the satisfied switchers are likely toexhibit lower levels of loyalty than their nonswitching coun-terparts. Therefore, we hypothesize the following:
H8: Compared with stayers, satisfied switchers are less loyal totheir current service providers.
Research MethodInstrument Design and Data Collection
To test the hypotheses, we designed an instrument to collectinformation on (1) consumers’ use of banking services (e.g.,presence of accounts in more than one bank; type ofaccounts held; whether the customer had switched banks; ifso, why), (2) overall satisfaction with the current primarybank, (3) satisfaction with the individual aspects of thebanking service, (4) purchase and ego involvement associ-ated with the choice and usage of the bank, (5) consumers’sense of loyalty toward the bank, and (6) demographic char-acteristics. Trained interviewers obtained the data for thestudy over the telephone. We pretested the instrument on asmall sample (n = 10), and on the basis of the results of thepretest, we reduced the length of the instrument and refinedthe script.
Trained interviewers, using the final script, conductedthe interviews, which lasted an average of 12 minutes. Thesample was randomly drawn from the residential section ofthe current local telephone directory of a major metropolitanarea in the southeast region of the United States. Samplingunits were selected from the directory proportionate to thealphabetical listings. Because this approach toward sam-pling excludes households with unlisted numbers, it (unlikea random-digit dialing approach) has the potential to intro-duce biases. However, the bias can be considered minimal,given the relatively low proportion of unlisted numbers inthe general population.
Respondents were first asked two screening questions tocheck whether they currently have an account (any type)with a bank and qualify them as the household decisionmaker regarding banking services. Also, because some cus-tomers were likely to have accounts in multiple banks, therespondents (in such cases) were specifically requested to
answer all the questions with respect to their primary bank,that is, the bank they consider their major banking servicesupplier.
Calls were made during weekday evening hours to max-imize the probability of reaching the decision maker. Inter-viewers made 828 calls, which resulted in 217 completedinterviews. A total of 333 calls resulted in no answer, a busysignal, or no contact after two callback attempts. Refusalstotaled 278, which resulted in an effective response rate of43.8% (217/495). Seventeen of the completed interviewswere later considered unusable because of missing values,which resulted in 200 usable responses.
Measures of Constructs
To classify customers into the three hypothesized groups onthe basis of their switching behavior, respondents were askeda two-part question: (1) whether their current bank was theirfirst bank or they had switched from a previous bank and (2)if they had switched, the reason they switched from their pre-vious bank to their current bank. The options for switchingincluded (1) overall dissatisfaction with the service of the pre-vious bank or (2) reasons other than dissatisfaction (e.g., jobrelocation, moving out of the previous bank’s service area, theprevious bank closed down or was bought out by a differentbank). Respondents were then placed into one of three cate-gories: (1) those for whom their current bank was their firstbank (i.e., those who had never switched—the stayers), (2)those who switched because they were dissatisfied overallwith the service they received from their previous bank (i.e.,the dissatisfied switchers), and (3) those who switched for rea-sons other than dissatisfaction (i.e., the satisfied switchers).
We hypothesize that these three groups differ in their sat-isfaction with the service of their current bank, their level ofpurchase and ego involvement with the banking service, andtheir loyalty behaviors toward the current bank. Several mea-sures of these three constructs have been proposed and empir-ically validated in the literature. The items used to measurethese constructs in this research were obtained from priorstudies that were most relevant to the current research setting.
For example, measures of consumer satisfaction found inthe literature include those proposed by Anderson and Sulli-van (1993), Bearden and Teel (1983), Churchill and Suprenant(1982), Fornell (1992), Fornell and colleagues (1996), Oliva,Oliver, and MacMillan (1992), Oliver (1980, 1992, 1993),Oliver and Swan (1989), Rust and Zahorik (1993), Tse andWilton (1988) and Westbrook and Oliver (1981). On the basisof prior research measures, we measure satisfaction in twoways. First, we obtained a global measure of satisfaction bymeans of a single item: “Overall, how satisfied are you withyour bank?” Second, to measure consumers’ satisfaction withthe various aspects of the banking service, we employed ascale comprising 11 items. Given the boundaries of thisresearch study, the scale was composed mostly of items devel-oped by Rust and Zahorik (1993). On the basis of an exami-nation of the literature and of focus groups conducted in a pre-vious study, Rust and Zahorik (1993) identify nine keyattributes that define customers’ ongoing relationships withtheir primary bank. Two items were added to this nine-itemscale, and all items were measured on a five-point Likert scalethat ranged from “very dissatisfied” to “very satisfied.”
Customer Base of Service Providers / 71
The literature also provides several definitions and mea-sures of involvement (Cohen 1983). Because of the currentresearch context, we restricted the measures of involvementto those that apply specifically to purchase and ego involve-ment. We used a total of nine items adapted from prior stud-ies (Beatty and Smith 1987; Bloch 1982; Bloemer andKasper 1995; Laurent and Kapferer 1985; Mittal 1989; Mit-tal and Lee 1989; Richins and Bloch 1986; Salma andTashchian 1985; Zaichkowsky 1985) to measure theinvolvement constructs.
Finally, early studies on brand loyalty measure loyalty onthe basis of repeat patronage or repeat purchase intentions.But researchers generally agree that operationalizing loyaltysimply as repeat patronage is too simplistic and does not cap-ture the multidimensionality of the construct (Bloemer andKasper 1995; Day 1969; Dick and Basu 1994; Jacoby andChestnut 1978; Jacoby and Kyner 1973). In line with thisargument, recent studies have defined and measured loyaltyusing multiple items including repeat patronage, self-statedretention, price insensitivity, resistance to counterpersua-sion, and the likelihood of spreading positive word of mouth(e.g., Dick and Basu 1994; Fornell 1992; Fornell et al. 1996;Jacoby and Kyner 1973). Adapting these measures, we usesix related items to operationalize the customer loyalty con-struct. We measured the items for both involvement and loy-alty constructs on a five-point Likert scale that ranged from“strongly disagree” to “strongly agree.”
Data Analysis and ResultsA preliminary analysis of the data revealed that the respon-dents were almost evenly split by sex (51.5% male and 48.5%female). Approximately 47% of the respondents were 35years of age or younger, and the average household income ofapproximately 36% of the sample was greater than $50,000.Almost 57% of the sample had earned at least an undergradu-ate degree, and approximately 62% of the sample was mar-ried. Of the 200 respondents, 27% were stayers, 15.5% weredissatisfied switchers, and the remaining 57.5% were satisfiedswitchers. The percentage of dissatisfied switchers seems tobe in line with the findings of Rust and Zahorik (1993), whoreport that approximately 21% of switchers were dissatisfiedwith their previous bank. Overall, the data revealed good vari-ance in the responses for all other items measured. In Table 1,we provide a correlation matrix of the research constructs.
Overall Satisfaction
H1 and H2 pertain to differences among the three groups inregard to their overall satisfaction with their current primarybank. H1 states that compared with satisfied switchers andstayers, dissatisfied switchers are more satisfied with theircurrent service providers, and H2 states that satisfied switch-ers are less satisfied with their current service providers thanstayers. To test these hypotheses, we compared group meanson the overall satisfaction item using analysis of variance(ANOVA). The results (see Table 2) reveal that the groupsdiffer significantly in their overall satisfaction with theircurrent bank. Furthermore, the results show that the dissat-isfied switchers (mean score = 4.61) are significantly moresatisfied with their current bank than the other two groups
and that the satisfied switchers (mean score = 4.04) are sig-nificantly less satisfied than the stayers (mean score = 4.28).This provides support for hypotheses H1 and H2.
To test the subsequent hypotheses related to group differ-ences with regard to satisfaction with the individual aspects ofthe service, involvement, and loyalty, the individual measuresof these constructs were factor analyzed to determine theirmeasurement properties and dimensionality. For the satisfac-tion items, a scree plot of the eigenvalues indicated a four-fac-tor solution. In Table 3, we present the items and the corre-sponding factor loadings. Four items loaded highly on the firstfactor. Because these items referred to problem-solving andhuman dimensions of the bank, they were interpreted as the“people factor.” Three items loaded on the second factor,which was labeled “locational convenience,” and the third fac-tor was characterized as “ease of transaction” and includedthree items. One item, which refers to satisfaction with the costof checking account, loaded on its own and was termed the“cost factor.” Furthermore, the test of intercorrelation amongthe items loading on the individual factors suggests a highdegree of reliability: Cronbach’s coefficient alphas valueswere .92, .86, and .75, respectively, for the first three factors.
A factor analysis of the involvement items revealed a two-factor solution. The six items loading on the first factor corre-sponded to being involved with the particular purchase deci-sion of choosing a bank. Therefore, this factor was interpretedas “purchase involvement.” The second factor, which con-tained three items, pertains to the “ego involvement” dimen-sion. In Table 4, we present the involvement items and the cor-responding factor loadings. The coefficient alphas for the itemsloading on the factors are .84 and .71, respectively, which indi-cates an acceptable level of reliability (Nunnally 1978).
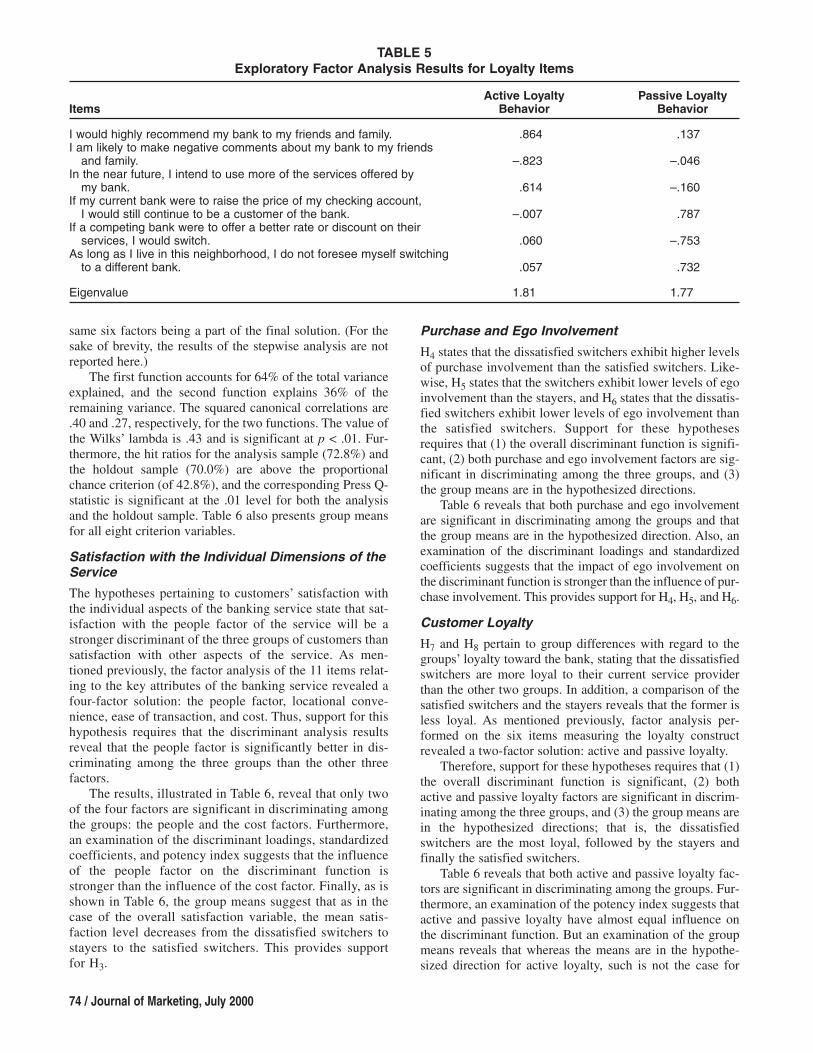
A factor analysis of the six items that measured customers’loyalty toward their current banks revealed a clean two-factorsolution. We present the items and the corresponding factorloadings in Table 5. On the basis of prior research findings, weexpected all six items to load highly on a single factor. Thisresult (a two-factor solution), though surprising, makes intu-itive sense. The three items that load on the first factor corre-spond to customers’ willingness to spread positive word ofmouth and their intentions to use more of the bank’s services.The remaining three items loading on the second factor corre-spond to competitive price immunity and self-stated retention.Therefore, we label our first factor “active loyalty” and the sec-ond factor “passive loyalty.” The coefficient alphas for theitems loading on the factors are .77 and .72, respectively, whichindicates an acceptable level of reliability (Nunnally 1978).
For a test of the remainder of our hypotheses, we per-formed a multiple discriminant analysis. We used discrimi-nant analysis, because this method determines the ability ofthe criterion variables to discriminate among the threegroups of customers. To check the validity of the models, weemployed a proportional 50/50 split-sample validationapproach, and we present the results for both the analysisand the holdout sample for each of the three cases.
To test H3–H8, we performed individual discriminantanalyses using the four satisfaction, the two involvement,and the two loyalty dimensions. Subsequently, we per-formed an overall discriminant analyses that included alleight factors as criterion variables. Because the results of the

72 / Journal of Marketing, July 2000
TAB
LE
1C
orr
elat
ion
Mat
rix
Ove
rall
Peo
ple
Lo
cati
on
alE
ase
of
Pu
rch
ase
Eg
oA
ctiv
eP
assi
veS
atis
fact
ion
Fact
or
Co
nven
ien
ceTr
ansa
ctio
nC
ost
Invo
lvem
ent
Invo
lvem
ent
Loy
alty
Loy
alty
1.00
(.01
)
.60
1.00
(.01
)(.
01)
.10
.09
1.00
(.17
)(.
23)
(.01
)
.07
.03
.31
1.00
(.30
)(.
68)
(.01
)(.
01)
.31
.41
–.03
–.01
1.00
(.01
)(.
01)
(.65
)(.
83)
(.01
)
.04
.13
–.05
–.07
.04
1.00
(.58
)(.
06)
(.49
)(.
30)
(.60
)(.
01)
.20
.19
–.01
.02
.05
.06
1.00
(.01
)(.
01)
(.99
)(.
76)
(.49
)(.
41)
(.01
)
.27
.23
.02
–.14
.15
.24
.12
1.00
(.01
)(.
01)
(.81
)(.
05)
(.04
)(.
01)
(.10
)(.
01)
.17
.16
.04
.06
.06
.09
.28
.05
1.00
(.01
)(.
03)
(.59
)(.
44)
(.41
)(.
20)
(.01
)(.
50)
(.01
)

Customer Base of Service Providers / 73
Measure
Overall, how satisfied areyou with your bank?
Groups
Stayers(n = 54)
Satisfied switchers(n = 115)
Dissatisfied switchers(n = 31)
Mean Scoresa
4.28(.0001)
4.04(.0001)
4.61(.0001)
Difference BetweenMeansb
Stayers versus satisfied switchers .24
Stayers versus dissatisfied switchers –.33
Satisfied switchers versus dissatisfied switchers –.57
TABLE 2Overall Satisfaction Measure: Difference Between Group Means
aNumbers in the parentheses represent p values.bThe differences between group means were all significant at the p = .05 level.
TABLE 3Exploratory Factor Analysis Results for Satisfaction Items
People Locational Ease ofItems Factor Convenience Transaction Cost
The friendliness of the bank employees .910 .037 –.005 .112How well the bank managers know me .842 .006 .005 .183How well the bank listens to my needs .939 .025 .016 .016The quality of service offered by the bank .890 .080 .034 .117How close the bank is to my home .057 .791 .209 –.056How close the bank is to my place of employment –.001 .914 .100 .016How convenient the bank is to my route to work .067 .905 .089 .004The number of ATM machines the bank has around town –.024 .241 .689 –.167How many tellers are available during busy times .064 .090 .871 .068How convenient the banking hours are –.004 .072 .850 .064The cost of a checking account .301 –.027 –.006 .937
Eigenvalue 3.31 2.36 2.02 1.07
TABLE 4Exploratory Factor Analysis Results for Involvement Items
Purchase EgoItems Involvement Involvement
I constantly compare the prices and rates offered by various banks in my area. .796 –.040I visited multiple banks in the area before I opened an account with the current bank. .887 .046I compared the prices and rates of several banks in my area before I selected
my current bank. .858 –.004After deciding on my current bank, I have discussed my choice with family and friends. .551 .125After deciding on my current bank, I have compared my bank with other banks in
the area. .726 –.084After deciding on my current bank, I have weighed the pros and cons of my choice. .632 .093The brand image of the bank played a major role in my decision to become a customer
of the bank. .053 .632The bank I use says a lot about who I am. .031 .822It is important for me to choose a bank that “feels” right. –.009 .795
Eigenvalue 3.39 1.74
individual discriminant analyses were in complete agree-ment with the overall analyses, we restrict our discussion tothe findings of the overall analyses. In Table 6, we providethe results of the three-group discriminant analysis per-formed with all eight factors included as criterion variables.Both discriminant functions are significant, and the results
reveal that six of the eight factors are significant in discrim-inating among the groups. The potency indices suggest thaton the basis of relative discriminatory power, the variablescan be ordered as follows: the people factor, cost, egoinvolvement, purchase involvement, active loyalty, and pas-sive loyalty. A stepwise discriminant analysis resulted in the
74 / Journal of Marketing, July 2000
TABLE 5Exploratory Factor Analysis Results for Loyalty Items
Active Loyalty Passive LoyaltyItems Behavior Behavior
I would highly recommend my bank to my friends and family. .864 .137I am likely to make negative comments about my bank to my friends
and family. –.823 –.046In the near future, I intend to use more of the services offered by
my bank. .614 –.160If my current bank were to raise the price of my checking account,
I would still continue to be a customer of the bank. –.007 .787If a competing bank were to offer a better rate or discount on their
services, I would switch. .060 –.753As long as I live in this neighborhood, I do not foresee myself switching
to a different bank. .057 .732
Eigenvalue 1.81 1.77
same six factors being a part of the final solution. (For thesake of brevity, the results of the stepwise analysis are notreported here.)
The first function accounts for 64% of the total varianceexplained, and the second function explains 36% of theremaining variance. The squared canonical correlations are.40 and .27, respectively, for the two functions. The value ofthe Wilks’ lambda is .43 and is significant at p < .01. Fur-thermore, the hit ratios for the analysis sample (72.8%) andthe holdout sample (70.0%) are above the proportionalchance criterion (of 42.8%), and the corresponding Press Q-statistic is significant at the .01 level for both the analysisand the holdout sample. Table 6 also presents group meansfor all eight criterion variables.
Satisfaction with the Individual Dimensions of theService
The hypotheses pertaining to customers’ satisfaction withthe individual aspects of the banking service state that sat-isfaction with the people factor of the service will be astronger discriminant of the three groups of customers thansatisfaction with other aspects of the service. As men-tioned previously, the factor analysis of the 11 items relat-ing to the key attributes of the banking service revealed afour-factor solution: the people factor, locational conve-nience, ease of transaction, and cost. Thus, support for thishypothesis requires that the discriminant analysis resultsreveal that the people factor is significantly better in dis-criminating among the three groups than the other threefactors.
The results, illustrated in Table 6, reveal that only twoof the four factors are significant in discriminating amongthe groups: the people and the cost factors. Furthermore,an examination of the discriminant loadings, standardizedcoefficients, and potency index suggests that the influenceof the people factor on the discriminant function isstronger than the influence of the cost factor. Finally, as isshown in Table 6, the group means suggest that as in thecase of the overall satisfaction variable, the mean satis-faction level decreases from the dissatisfied switchers tostayers to the satisfied switchers. This provides supportfor H3.
Purchase and Ego Involvement
H4 states that the dissatisfied switchers exhibit higher levelsof purchase involvement than the satisfied switchers. Like-wise, H5 states that the switchers exhibit lower levels of egoinvolvement than the stayers, and H6 states that the dissatis-fied switchers exhibit lower levels of ego involvement thanthe satisfied switchers. Support for these hypothesesrequires that (1) the overall discriminant function is signifi-cant, (2) both purchase and ego involvement factors are sig-nificant in discriminating among the three groups, and (3)the group means are in the hypothesized directions.
Table 6 reveals that both purchase and ego involvementare significant in discriminating among the groups and thatthe group means are in the hypothesized direction. Also, anexamination of the discriminant loadings and standardizedcoefficients suggests that the impact of ego involvement onthe discriminant function is stronger than the influence of pur-chase involvement. This provides support for H4, H5, and H6.
Customer Loyalty
H7 and H8 pertain to group differences with regard to thegroups’ loyalty toward the bank, stating that the dissatisfiedswitchers are more loyal to their current service providerthan the other two groups. In addition, a comparison of thesatisfied switchers and the stayers reveals that the former isless loyal. As mentioned previously, factor analysis per-formed on the six items measuring the loyalty constructrevealed a two-factor solution: active and passive loyalty.
Therefore, support for these hypotheses requires that (1)the overall discriminant function is significant, (2) bothactive and passive loyalty factors are significant in discrim-inating among the three groups, and (3) the group means arein the hypothesized directions; that is, the dissatisfiedswitchers are the most loyal, followed by the stayers andfinally the satisfied switchers.
Table 6 reveals that both active and passive loyalty fac-tors are significant in discriminating among the groups. Fur-thermore, an examination of the potency index suggests thatactive and passive loyalty have almost equal influence onthe discriminant function. But an examination of the groupmeans reveals that whereas the means are in the hypothe-sized direction for active loyalty, such is not the case for

Customer Base of Service Providers / 75
TAB
LE
6O
vera
ll D
iscr
imin
ant
An
alys
is R
esu
lts*
Sta
nd
ard
ized
Co
effi
cien
tD
iscr
imin
ant
Lo
adin
gs
Un
ivar
iate
FG
rou
p M
ean
s
Po
ten
cyD
issa
tisf
ied
Sat
isfi
edA
ttri
bute
Fu
nct
ion
1F
un
ctio
n 2
Fu
nct
ion
1F
un
ctio
n 2
Rat
ioP
rob
abili
tyIn
dex
Sw
itch
ers
Sw
itch
ers
Sta
yers
Peo
ple
fact
or**
.65
.34
.62
.51
34.7
8.0
1.3
404.
633.
614.
20Lo
catio
nal c
onve
nien
ce.0
6.1
8.0
8.1
1.8
7.4
2.0
083.
973.
803.
93E
ase
of t
rans
actio
n.1
8–.
26.0
7–.
06.4
7.6
2.0
043.
843.
733.
69C
ost**
*.3
7.4
7.4
9.5
426
.38
.01
.259
4.42
3.08
4.05
Pur
chas
e in
volv
emen
t**.3
5–.
46.2
9–.
349.
82.0
1.0
953.
442.
992.
69E
go in
volv
emen
t**
–.53
.51
–.28
.49
14.2
5.0
1.1
372.
813.
223.
67A
ctiv
e lo
yalty
†.2
5–.
37.3
0–.
176.
90.0
1.0
684.
103.
283.
46P
assi
ve lo
yalty
**–.
36.2
2–.
20.3
06.
03.0
1.0
582.
813.
313.
60
Fu
nct
ion
1F
un
ctio
n 2
Eig
enva
lue
(pro
port
ion)
.64
.36
Squ
ared
can
onic
alco
rrel
atio
n.4
0.2
7
Val
ue
FP
rob
abili
ty
Wilk
s’la
mbd
a.4
312
.24
.01
Per
cen
t C
orr
ectl
y C
lass
ifie
d (
Hit
Rat
io)
Ana
lysi
s sa
mpl
e72
.8%
Hol
dout
sam
ple
70.0
%P
ropo
rtio
nal c
hanc
e cr
iterio
n42
.8%
Pre
ss Q
-sta
tistic
69.1
4(a
naly
sis
sam
ple)
(.01
)P
ress
Q-s
tatis
tic60
.50
(hol
dout
sam
ple)
(.01
)
*Ast
epw
ise
disc
rimin
ant
anal
ysis
rev
eale
d th
at t
he s
ame
six
of t
he e
ight
fac
tors
wer
e si
gnifi
cant
in d
iscr
imin
atin
g am
ong
the
thre
e gr
oups
.**
Gro
up m
eans
are
sig
nific
antly
diff
eren
t at
the
p=
.05
leve
l.**
*The
diff
eren
ce in
mea
ns b
etw
een
diss
atis
fied
and
satis
fied
switc
hers
and
bet
wee
n st
ayer
s an
d sa
tisfie
d sw
itche
rs is
sig
nific
ant
at t
he p
= .
05 le
vel.
† The
diff
eren
ce in
mea
ns b
etw
een
diss
atis
fied
and
satis
fied
switc
hers
and
bet
wee
n di
ssat
isfie
d sw
itche
rs a
nd s
taye
rs is
sig
nific
ant
at t
he p
= .
05 le
vel.

76 / Journal of Marketing, July 2000
passive loyalty. The dissatisfied switchers are not higher inpassive loyalty than the other groups. Indeed, they exhibitthe lowest levels of passive loyalty. The group means indi-cate that the stayers exhibit the highest passive loyalty, fol-lowed by the satisfied switchers and finally the dissatisfiedswitchers. This finding thus provides only partial support forH7 and H8. The implications of this finding are discussedsubsequently.
Finally, to check for differences based on the duration ofstay with the current service provider, we split the groups intotwo (less than five years and more than five years). A test ofgroup means revealed no significant difference in satisfac-tion, loyalty, and involvement measures for all three groups ofcustomers. The small size of the subgroups (particularly thedissatisfied switchers and the stayers) prevented us fromusing duration of stay as a continuous variable in the analysis.
Premise for Study 2Although the findings of Study 1 that support the hypothe-ses offer rich academic and managerial implications, someother relevant issues, if explored, have the potential to offerfurther insights in this area. First, given our focus on a ser-vice industry in one geographic location, replication in alarger sample would help establish the external validity ofthese findings. Second, Study 1 reveals some interestingresults regarding the influence of past switching behavior onsubsequent satisfaction levels, but it provides little insightregarding (1) the relevant time frame in which these effectsare likely to operate or (2) the effects of any prior switcheson current satisfaction levels. Finally, although we definedand tested these three distinct customer groups on the basisof their switching or a lack of switching experience, we havelittle knowledge as to the potential differences within thesethree customer groups in terms of other relevant variables,such as commitment, dependence, and risk aversion.
Therefore, we conducted Study 2 with the objective ofreplicating the findings of Study 1 and offering some theo-retical and empirical insights on the abovementioned issues.It is imperative to state here that the issues addressed herehave not been fully explored in the literature and warrant theundivided attention of a broader research study. Therefore,we treat these issues here as largely exploratory and make afirst attempt to understand these relationships and providesome guidelines for further research that focuses on theseissues in greater breadth and depth. We now discuss each ofthese three issues in greater detail.
Duration of Stay
The literature suggests that time influences expectations andsatisfaction in several important ways. Research investigat-ing expectations in satisfaction and service quality evalua-tions suggests that as time spent as a customer with theprovider increases, the expectations used as a basis of com-parison tend to adjust to the new service provider. For exam-ple, Boulding and colleagues (1993) argue that consumers’current perceptions of service quality of a firm just after aservice contact are in part influenced by their prior expecta-tions of what will and what should transpire during the con-tact. They argue that over time, will expectations are
updated with each new service encounter and prior willexpectations. Applied here, this suggests that for satisfactionjudgments arrived at through the expectancy–disconfirma-tion paradigm, it is expected that customers adapt over timeto the new levels of service provided by the switched-tofirm.
Furthermore, researchers have also suggested that withthe passage of time, customers are more likely to employsimilar types of expectations. For example, Woodruff,Cadotte, and Jenkins (1983) theorize that customers withextensive brand experience are more likely to employ focalbrand expectations than customers with limited brand expe-rience, who in turn are more likely to employ experience-based norms. The implication of this research is that astenure with the brand (or firm) increases, customers arelikely to employ common sets of expectations (focal brand),with the effect of mitigating large discrepancies in satisfac-tion scores early in their tenure with the firm. These argu-ments lead us to pose the following question:
RQ1: Do the differences among the three groups in terms oftheir overall level of satisfaction change with increasingtenure with the switched-to bank?
More generally, is there a relationship between durationof stay with the current bank and a customer’s overall satis-faction with the bank? Theory generally does not providespecific guidance regarding the relevant time frames inwhich the hypothesized relationships are supposed to oper-ate. Although we found no significant difference among thegroups based on duration of stay (five years), further inves-tigation with an adequate sample size would be particularlyuseful in providing insights into this important and relevantissue on postswitching behavior.
Mixed Switching Experiences
In addition to the effects of duration of stay on levels of satis-faction, the literature suggests that differences also exist in sat-isfaction with the current bank among customers with multipleswitching experiences. Research in memory recall bias (Folkes1994) and heuristic processing (Tversky and Kahneman 1974)suggests that the most emotionally charged and atypical expe-riences are likely to play a large role in establishing future com-parison standards. For example, Folkes (1988, 1994) notes thatpast experiences that are distinctive and easily distinguishedfrom others are likely to be sampled more readily by con-sumers when they recall service experiences and establishexpectations. This is particularly true when consumers elabo-rate on such distinctive events and attach strong affective tracesto these memories. Even when consumers have difficultyrecalling specific events or are not motivated to do so, heuris-tic processing that relies on recalling past service exemplars isoften employed. In the current context, a dissatisfied switch isassumed to be more emotionally taxing than a satisfied switch,which would then imply that a dissatisfied switch (irrespectiveof when it occurred) might be the most salient one.
In contrast, recency bias suggests that the most recentswitching event plays an influential role in establishing thecomparison standards for the current service experience.Essentially, recency bias suggests that people are morelikely to recall more recent events than more distant ones

Customer Base of Service Providers / 77
(Crano 1977; Greene 1986; Pieters and Bijmolt 1997). Thisoccurs in part because of retroactive interference (Burke andSrull 1988) and context-dependent (Greene 1986) memoryprocesses, as well as because more recent events/memoriesare easier to discriminate (Crowder 1976). In this study,recency bias suggests that the more recent switching experi-ence is likely to be given more weight in developing futureexpectancies, irrespective of whether the most recent switchwas a dissatisfied or a satisfied switch.
In summary, recency bias theory suggests that the mostrecent service experience plays a dominant role in establish-ing future expectancies. In contrast, research in memoryrecall bias and heuristic processing suggests that the mostemotionally taxing and distinctive service experience playsa major role in establishing future expectancies. AlthoughStudy 1 provides evidence that the three customer groupsidentified in this study differ significantly in their satisfac-tion with the current service provider on the basis of theirmost recent switching experience (or lack thereof), we haveno information on the motivations for any previous switchesand their possible impact on the current level of satisfaction.In simple terms, in a two-switch sequence, does the reasonfor switching from the bank at time t – 2 to the bank at timet – 1 influence customers’ satisfaction with their currentbank (bank at time t)?
We classify customers as satisfied switchers or dissatisfiedswitchers on the basis of their most recent switching experi-ence and report that on average, the dissatisfied switchersexhibit a higher level of satisfaction with the current serviceprovider than the satisfied switchers. However, the customersclassified as satisfied switchers on the basis of their mostrecent switching experience could have switched previouslybecause of either dissatisfaction or satisfaction. The same istrue for those customers classified as dissatisfied switchers. Itwould be interesting to know whether the reasons for any priorswitches play a role in influencing the satisfaction with the cur-rent service provider. In other words, are there differences insatisfaction levels within the satisfied switcher group based ontheir previous switching experiences? The same question canbe asked of the dissatisfied switchers. Such an analysis wouldprovide us with some insight as to which switch, the mostrecent or the most emotionally taxing, is the most salientregarding comparison levels employed with the current serviceprovider. Hence, we formulate our second research question:
RQ2: Are there differences in the current levels of satisfactionamong customers with mixed switching experiences?
Within-Group Differences Based on Other Rele-vant Variables
Finally, although Study 1’s results show that the three groupsbased on the switching behavior differ in terms of their satis-faction and involvement with and loyalty toward the bank,there could exist subgroups within these three homogeneousgroups that differ in terms of other relevant variables. Anunderstanding of these differences (if any) within the groupswould provide some insights into how the subgroups differ interms of their satisfaction, involvement, and loyalty behaviors.
Prior research on maintaining customer relationships(e.g., Bendapudi and Berry 1997; Morgan and Hunt 1994),
as well as related research on switching behavior (e.g., Raju1980), suggests that the constructs of dependence, commit-ment, and risk aversion are particularly important for betterunderstanding the reasons customers stay with a firm.Dependence and commitment have been associated withseveral critical outcomes (Ganesan 1994; Morgan and Hunt1994) and reflect fundamental differences in the way a cus-tomer views an ongoing relationship (Bendapudi and Berry1997). Risk aversion reflects a general exploratory tendencythat is relevant to understanding a customer’s propensity toswitch or stay for intrinsic reasons (Raju 1980). We brieflyreview each of these three constructs.
First, customers exhibiting high levels of commitmentare more likely to maintain a dedication-based relationship,in which customers are motivated to maintain the relation-ship because they genuinely want to (Bendapudi and Berry1997; Morgan and Hunt 1994). Customers who are highlycommitted to an ongoing relationship are also likely to seekgreater relationship expansion and enhancement, identifystrongly with the partner, view such a relationship as a team,engage in behaviors such as open advocacy of the partner(Bendapudi and Berry 1997), cooperate with the partner,and stay in the relationship (Morgan and Hunt 1994). There-fore, commitment appears to be an influential variable onseveral attitudinal and behavioral variables measured here.
Second, customers who are highly dependent on a rela-tionship are more likely to maintain a constraint-based rela-tionship, or a relationship in which customers believe that theymust remain in the relationship, not that they want to (Benda-pudi and Berry 1997). Constraint-based relationships lead topreservation of the relationship only as long as the perceivedconstraints exist (Bendapudi and Berry 1997). Customers highin dependence are more likely to acquiesce to the partner’srequests or policies and, in line with reactance theory (Brehm1966), actively seek alternatives (Bendapudi and Berry 1997).
Third, customers who are particularly risk averse areless likely to take risks or be adventurous (Raju 1980). Riskaversion/risk taking has long been viewed as a manifestationof human exploratory behavior, such that the amount of riska consumer is willing to take in a choice situation is seen asa larger effort to adjust the level of actual stimulation to theoptimal level (Baumgartner and Steenkamp 1996; Berlyne1960; Raju 1980). Prior research has supported the notionthat being loyal to a brand is a strategy consumers employto control the risk inherent in certain buying situations (e.g.,Arndt 1968). Therefore, customers high in risk aversion arelikely to exhibit differences in loyalty toward the currentservice provider compared with customers who are less riskaverse. Taken together, the evidence from research ondependence, commitment, and risk aversion provides thebasis for the following research question:
RQ3: Are there subgroups within the three main customergroups that differ in terms of commitment, dependence,and risk aversion, and if so, do they exhibit significantdifferences in their overall satisfaction, involvement, andloyalty behaviors?
We first discuss the data collection process involved inthe second study and then discuss the results of the replica-tion analyses. Subsequently, we report the results of the
78 / Journal of Marketing, July 2000
analyses conducted to investigate each of the three researchquestions. Following this, we discuss our findings from bothstudies, offer theoretical and practical implications, and dis-cuss limitations and future research opportunities.
Study 2: Instrument Design, DataCollection, and Preliminary AnalysesAs mentioned previously, we conducted Study 2 to replicatethe findings of Study 1 and to address other interestingissues. Again, we used a telephone interview method to col-lect the data and adopted all the screening procedures usedin the first study. However, in the second study we used arandom-digit dialing approach to identify potential respon-dents located in the Northeast and the Southwest regions ofthe United States.
In total, 6678 calls were made; 1763 of these were madeto businesses, government entities, or nonworking numbers,and 376 calls reached either fax machines or modems. The
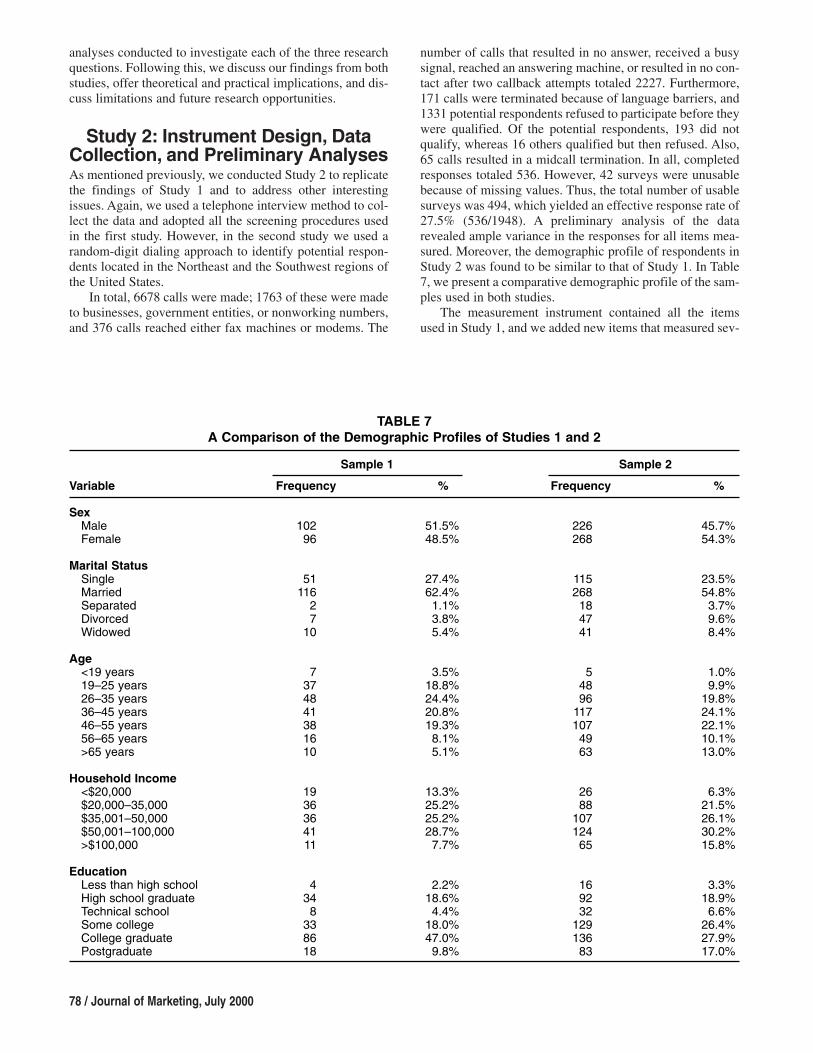
number of calls that resulted in no answer, received a busysignal, reached an answering machine, or resulted in no con-tact after two callback attempts totaled 2227. Furthermore,171 calls were terminated because of language barriers, and1331 potential respondents refused to participate before theywere qualified. Of the potential respondents, 193 did notqualify, whereas 16 others qualified but then refused. Also,65 calls resulted in a midcall termination. In all, completedresponses totaled 536. However, 42 surveys were unusablebecause of missing values. Thus, the total number of usablesurveys was 494, which yielded an effective response rate of27.5% (536/1948). A preliminary analysis of the datarevealed ample variance in the responses for all items mea-sured. Moreover, the demographic profile of respondents inStudy 2 was found to be similar to that of Study 1. In Table7, we present a comparative demographic profile of the sam-ples used in both studies.
The measurement instrument contained all the itemsused in Study 1, and we added new items that measured sev-
TABLE 7A Comparison of the Demographic Profiles of Studies 1 and 2
Sample 1 Sample 2
%
45.7%54.3%
23.5%54.8%3.7%9.6%8.4%
1.0%9.9%
19.8%24.1%22.1%10.1%13.0%
6.3%21.5%26.1%30.2%15.8%
3.3%18.9%6.6%
26.4%27.9%17.0%
Frequency
226268
115268184741
54896
1171074963
2688
10712465
169232
12913683
%
51.5%48.5%
27.4%62.4%1.1%3.8%5.4%
3.5%18.8%24.4%20.8%19.3%8.1%5.1%
13.3%25.2%25.2%28.7%7.7%
2.2%18.6%4.4%
18.0%47.0%9.8%
Frequency
10296
51116
27
10
7374841381610
1936364111
4348
338618
Variable
SexMaleFemale
Marital StatusSingleMarriedSeparatedDivorcedWidowed
Age<19 years19–25 years26–35 years36–45 years46–55 years56–65 years>65 years
Household Income<$20,000$20,000–35,000$35,001–50,000$50,001–100,000>$100,000
EducationLess than high schoolHigh school graduateTechnical schoolSome collegeCollege graduatePostgraduate

Customer Base of Service Providers / 79
eral other constructs to investigate the issues mentioned pre-viously. First, in addition to measuring the reasons forswitching from the previous bank (i.e., the bank at time t –1) to the current bank (i.e., the bank at time t), we measuredrespondents’ reasons for switching from their bank at timet – 2 to the bank at time t – 1. Also, we measured respon-dents’ overall satisfaction with their previous bank (time t –1) and the duration of stay (in years) at the current and pre-vious banks.
Second, to address RQ3, we included three additionalmeasures in Study 2: dependence on the current bank, com-mitment to the current bank, and risk aversion. We mea-sured all three constructs using established scales from theliterature. The measure for commitment, based on a scaleused by Morgan and Hunt (1994), contained three items: (1)“The relationship that I share with my bank is somethingthat the bank and I are very committed to,” (2) “The rela-tionship that I share with my bank is something that is veryimportant to me,” and (3) “The relationship that I share withmy bank is something that deserves my maximum effort tomaintain.” The scale measuring dependence, adapted from ameasure employed by Ping (1993), included the followingthree items: (1) “In general, it would be a hassle changingbanks,” (2) “It would take a lot of time and effort changingbanks,” and (3) “For me, the emotional and financial costsof switching banks are high.”
Finally, we measured risk aversion using items adaptedfrom a scale used by Raju (1980): (1) “I am very cautious intrying new/different products,” (2) “I would rather stickwith a brand I usually buy than try something I am not verysure of,” and (3) “I enjoy taking chances in buying unfamil-iar brands just to get some variety in my purchases.” Allthree constructs comprised only three items to keep thequestionnaire to a reasonable length, and we measured themon a five-point Likert scale that ranged from “strongly dis-agree” to “strongly agree.” We then factor analyzed thesenine items, and a scree plot of the eigenvalues revealed aclean three-factor solution. All items loaded highly on theappropriate factor, and there were no significant cross-load-ings. Furthermore, the coefficient alphas for the items load-ing on the commitment, dependence, and risk aversion fac-tors are .82, .76, and .74, respectively, which indicates anacceptable level of reliability (Nunnally 1978).
1In addition to validating the findings of Study 1 and empiricallyexamining the issues posed in the research questions, the analysesin Study 2 data reveal some other interesting findings. First, themean overall satisfaction scores of the satisfied switchers withtheir previous bank were significantly higher (3.97) than those ofthe dissatisfied switchers (2.41). This result provides a validitycheck for classifying the switchers as satisfied and dissatisfied interms of their switching experience. Second, the satisfied switchersseemed more satisfied with their previous bank (3.97) than withtheir current bank (3.81). Although this difference is not statisti-cally significant, it is in line with the premise and the argumentspresented in this study regarding satisfaction and loyalty behaviorof satisfied switchers toward their current bank. Finally, as wasmentioned in the discussion of RQ2, only one respondent hadswitched twice because of dissatisfaction. Although the samplesize of one is too small to make any statistical inferences, it sug-gests that there is no evidence of chronic dissatisfaction among therespondents of this study.
Study 2 Results1
Replication of Study 1. To test H1 and H2, we usedANOVA to compare group means on the overall satisfactionitem obtained from the larger sample. The results, shown inTable 8, reveal that the groups are significantly differentwith regard to their overall satisfaction with their currentbank. Furthermore, the results show that the mean satisfac-tion level decreases from the dissatisfied switchers to stay-ers to satisfied switchers. This provides support for H1 andH2 and replicates the results of Study 1.
In the same manner as in Study 1, we tested group dif-ferences with regard to satisfaction with the individualaspects of the service, involvement, and loyalty. We againfactor analyzed the measures of these constructs to deter-mine their measurement properties and dimensionality. Forall constructs, the factor solution and item loadings thatemerged were similar to those obtained in Study 1 (theresults of the factor analyses can be obtained from theauthors). Again, we employed multiple discriminant analy-sis to test H3–H8. Furthermore, we performed a proportional50/50 split-sample validation to check the validity of themodels. We present the three-group discriminant analysiswith all eight factors in Table 9.
Measure
Overall, how satisfied areyou with your bank?
Groups
Stayers(n = 203)
Satisfied switchers(n = 212)
Dissatisfied switchers(n = 79)
Mean Scoresa
4.18(.0001)
3.81(.0001)
4.58(.0001)
Difference BetweenMeansb
Stayers versus satisfied switchers .37
Stayers versus dissatisfied switchers –.40
Satisfied switchers versus dissatisfied switchers –.77
TABLE 8Overall Satisfaction Measure: Difference Between Group Means (Study 2)
aNumbers in the parentheses represent p values.bThe differences between group means were all significant at the p = .05 level.

80 / Journal of Marketing, July 2000
TAB
LE
9O
vera
ll D
iscr
imin
ant
An
alys
is R
esu
lts
(Stu
dy
2)*
Sta
nd
ard
ized
Co
effi
cien
tD
iscr
imin
ant
Lo
adin
gs
Un
ivar
iate
FG
rou
p M
ean
s
Po
ten
cyD
issa
tisf
ied
Sat
isfi
edA
ttri
bute
Fu
nct
ion
1F
un
ctio
n 2
Fu
nct
ion
1F
un
ctio
n 2
Rat
ioP
rob
abili
tyIn
dex
Sw
itch
ers
Sw
itch
ers
Sta
yers
Peo
ple
fact
or**
.44
.23
.57
.44
39.2
1.0
1.2
954.
473.
604.
01Lo
catio
nal c
onve
nien
ce.0
0–.
13.0
6–.
06.4
5.6
3.0
044.
124.
034.
00E
ase
of t
rans
actio
n–.
11–.
35.1
2–.
011.
43.2
4.0
113.
913.
793.
80C
ost**
.39
.35
.52
.53
36.0
4.0
1.2
734.
393.
203.
86P
urch
ase
invo
lvem
ent†
.41
–.41
.49
–.52
32.5
1.0
1.2
473.
562.
912.
80E
go in
volv
emen
t**–.
42.2
2–.
21.4
09.
23.0
1.0
712.
853.
083.
27A
ctiv
e lo
yalty
**.4
1.0
6.5
9.2
237
.14
.01
.279
4.03
3.04
3.33
Pas
sive
loya
lty**
*–.
14.5
2–.
11.7
417
.54
.01
.135
2.89
2.97
3.52
Fu
nct
ion
1F
un
ctio
n 2
Eig
enva
lue
(pro
port
ion)
.77
.23
Squ
ared
can
onic
al
corr
elat
ion
.35
.13
Val
ue
FP
rob
abili
ty
Wilk
s’la
mbd
a.5
715
.46
.01
Per
cen
t C
orr
ectl
y C
lass
ifie
d (
Hit
Rat
io)
Ana
lysi
s sa
mpl
e71
.6%
Hol
dout
sam
ple
66.5
%P
ropo
rtio
nal c
hanc
e cr
iterio
n37
.8%
Pre
ss Q
-sta
tistic
128.
2(a
naly
sis
sam
ple)
(.01
)P
ress
Q-s
tatis
tic96
.0(h
oldo
ut s
ampl
e)(.
01)
*Ast
epw
ise
disc
rimin
ant
anal
ysis
rev
eale
d th
at t
he s
ame
six
of t
he e
ight
fac
tors
wer
e si
gnifi
cant
in d
iscr
imin
atin
g am
ong
the
thre
e gr
oups
.**
Gro
up m
eans
are
sig
nific
antly
diff
eren
t at
the
p=
.05
leve
l.**
*The
diff
eren
ce in
mea
ns b
etw
een
diss
atis
fied
switc
hers
and
sta
yers
and
bet
wee
n st
ayer
s an
d sa
tisfie
d sw
itche
rs is
sig
nific
ant
at t
he p
= .
05 le
vel.
† The
diff
eren
ce in
mea
ns b
etw
een
diss
atis
fied
and
satis
fied
switc
hers
and
bet
wee
n di
ssat
isfie
d sw
itche
rs a
nd s
taye
rs is
sig
nific
ant
at t
he p
= .
05 le
vel.

Customer Base of Service Providers / 81
Recall that in Study 1, only two of the four satisfactionfactors (the people factor and cost) were significant in dis-criminating among the groups. In Study 2, as is shown inTable 9, the discriminant analysis results were consistentwith this finding. Furthermore, an examination of thepotency index suggests that the role of the people (problem-solving) factor is strongest in discriminating among thethree groups. In Table 9, we also show that the group meansare in the hypothesized direction. Similarly, an examinationof Table 9 regarding the roles of purchase involvement, egoinvolvement, and active and passive loyalty reveals that allfour factors are significant in discriminating among thegroups and the means are quite similar to those obtained inStudy 1. However, in both samples, the dissatisfied switch-ers exhibit the highest levels of active loyalty. In all, theresults of Study 2 replicate the findings of Study 1 closelyand thus provide repeated support for H3–H8.
Duration of stay. To examine whether the differencesamong the three customer groups in their overall satisfactionwith the current bank change with an increase in tenure withthe bank, we categorized the respondents into four groupson the basis of their duration of stay with the current bank:(1) one year or less, (2) two to five years, (3) six to ten years,and (4) more than ten years. We tested the difference amongthe mean overall satisfaction scores for the three groupsacross the four time periods, and we present the results inTable 10. The results reveal that the mean overall satisfac-tion score of dissatisfied switchers is significantly different(at the p = .05 level) from that of the other two groups for
the first three time periods and is not significantly differentfor the fourth time period. Moreover, the overall satisfactionwith the current bank seems to decline with time for dissat-isfied switchers, from a high of 4.87 for those who had spentone year or less with the bank to 4.30 for dissatisfied switch-ers who have been with the current bank for more than tenyears. Furthermore, no significant discernible patterns couldbe observed in the overall satisfaction scores of the othertwo groups over time.
Mixed switching experiences. To uncover the precisenature of the customers who have multiple switching expe-riences, we collected data on the reasons for switching forthe two previous switching events. Of the total sample of494 respondents, 79 were dissatisfied switchers, 212 weresatisfied switchers, and 203 were stayers. Thus, 291 respon-dents had switched from their bank at time t – 1 to the cur-rent bank at time t (79 + 212). Of the 291, only 92 hadswitched banks once before (i.e., from the bank at time t – 2to the bank at time t – 1). Two did not respond to the ques-tion regarding the reason for switching from t – 2 to t – 1.
Analysis revealed that of the sample of mixed-experi-ence switchers (n = 90), the mean overall satisfaction score(with the current bank) for customers who reported a dissat-isfied switch followed by a dissatisfied switch was 5.00 (n =1). For customers who reported a satisfied switch followedby a dissatisfied switch, the mean was 4.81 (n = 21). Like-wise, the mean for customers who reported a dissatisfiedswitch followed by a satisfied switch was 4.23 (n = 13), andthe mean for customers who reported a satisfied switch fol-lowed by a satisfied switch was 3.76 (n = 55).
An ANOVA conducted on the sample of mixed-experi-ence switchers (n = 90; overall F = 5.46) revealed significantdifferences (at the p = .05 level) only between the secondand fourth groups, that is, between the satisfied → dissatis-fied and the satisfied → satisfied customers. Furthermore,we reanalyzed this data after removing the one respondentwho indicated a dissatisfied → dissatisfied sequence andfound nearly identical results (F = 7.81, mean scores identi-cal, same groups significantly different). In Table 11, wepresent the results of the analysis.
The results reveal no significant difference in the meanoverall satisfaction scores of mixed-experience customerswho are similarly classified currently as either dissatisfiedswitchers (i.e., between the dissatisfied → dissatisfied andthe satisfied → dissatisfied groups) or satisfied switchers(i.e., between the dissatisfied → satisfied and the satisfied→ satisfied groups). Although the sample size precluded theinclusion of duration of stay with the current or previous
TABLE 11Testing the Effects of Prior Switching Experiences on Satisfaction with Current Bank
Reason for Switching Reason for Switching Mean Current from Bank at (t – 2) from Bank at (t – 1) Satisfaction Current Switchingto Bank at (t – 1) to Current Bank (t) Score n Classification
Dissatisfied Dissatisfied 5.00 1 Dissatisfied switcherSatisfied Dissatisfied 4.81 21 Dissatisfswitcher*Dissatisfied Satisfied 4.23 13 Satisfied switcherSatisfied Satisfied 3.76 55 Satisfied switcher*
TABLE 10Influence of Duration of Stay on Overall
Satisfaction Scores
Dissatisfied SatisfiedTime Period Switchers Switchers Stayers
One year 4.87 3.63 4.10and less* (n = 15) (n = 43) (n = 20)
Two to five 4.62 3.69 4.31years* (n = 24) (n = 65) (n = 42)
Six to ten 4.60 4.00 4.09years* (n = 20) (n = 52) (n = 45)
More than 4.30 3.87 4.21ten years (n = 20) (n = 52) (n = 96)
*The difference in the mean score between dissatisfied switchersand the other two groups is significant at the p = .05 level.
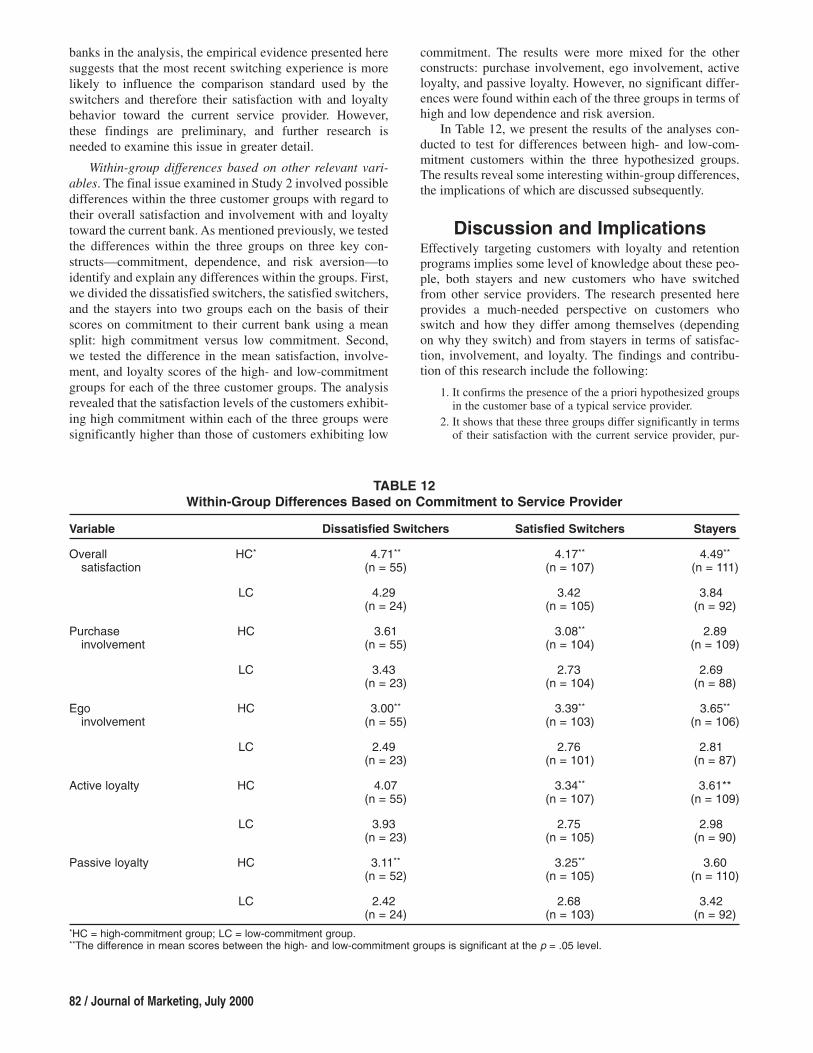
82 / Journal of Marketing, July 2000
banks in the analysis, the empirical evidence presented heresuggests that the most recent switching experience is morelikely to influence the comparison standard used by theswitchers and therefore their satisfaction with and loyaltybehavior toward the current service provider. However,these findings are preliminary, and further research isneeded to examine this issue in greater detail.
Within-group differences based on other relevant vari-ables. The final issue examined in Study 2 involved possibledifferences within the three customer groups with regard totheir overall satisfaction and involvement with and loyaltytoward the current bank. As mentioned previously, we testedthe differences within the three groups on three key con-structs—commitment, dependence, and risk aversion—toidentify and explain any differences within the groups. First,we divided the dissatisfied switchers, the satisfied switchers,and the stayers into two groups each on the basis of theirscores on commitment to their current bank using a meansplit: high commitment versus low commitment. Second,we tested the difference in the mean satisfaction, involve-ment, and loyalty scores of the high- and low-commitmentgroups for each of the three customer groups. The analysisrevealed that the satisfaction levels of the customers exhibit-ing high commitment within each of the three groups weresignificantly higher than those of customers exhibiting low
commitment. The results were more mixed for the otherconstructs: purchase involvement, ego involvement, activeloyalty, and passive loyalty. However, no significant differ-ences were found within each of the three groups in terms ofhigh and low dependence and risk aversion.
In Table 12, we present the results of the analyses con-ducted to test for differences between high- and low-com-mitment customers within the three hypothesized groups.The results reveal some interesting within-group differences,the implications of which are discussed subsequently.
Discussion and ImplicationsEffectively targeting customers with loyalty and retentionprograms implies some level of knowledge about these peo-ple, both stayers and new customers who have switchedfrom other service providers. The research presented hereprovides a much-needed perspective on customers whoswitch and how they differ among themselves (dependingon why they switch) and from stayers in terms of satisfac-tion, involvement, and loyalty. The findings and contribu-tion of this research include the following:
1. It confirms the presence of the a priori hypothesized groupsin the customer base of a typical service provider.
2. It shows that these three groups differ significantly in termsof their satisfaction with the current service provider, pur-
TABLE 12Within-Group Differences Based on Commitment to Service Provider
Variable Dissatisfied Switchers Satisfied Switchers Stayers
Overall HC* 4.71** 4.17** 4.49**
satisfaction (n = 55) (n = 107) (n = 111)
LC 4.29 3.42 3.84(n = 24) (n = 105) (n = 92)
Purchase HC 3.61 3.08** 2.89involvement (n = 55) (n = 104) (n = 109)
LC 3.43 2.73 2.69(n = 23) (n = 104) (n = 88)
Ego HC 3.00** 3.39** 3.65**
involvement (n = 55) (n = 103) (n = 106)
LC 2.49 2.76 2.81(n = 23) (n = 101) (n = 87)
Active loyalty HC 4.07 3.34** 3.61**(n = 55) (n = 107) (n = 109)
LC 3.93 2.75 2.98(n = 23) (n = 105) (n = 90)
Passive loyalty HC 3.11** 3.25** 3.60(n = 52) (n = 105) (n = 110)
LC 2.42 2.68 3.42(n = 24) (n = 103) (n = 92)
*HC = high-commitment group; LC = low-commitment group.**The difference in mean scores between the high- and low-commitment groups is significant at the p = .05 level.

Customer Base of Service Providers / 83
chase and ego involvement processes, and loyalty towardthe service provider. The results indicate that dissatisfiedswitchers are the most satisfied customers and are mostlikely to engage in active loyalty behaviors, whereas stayers,who exhibit higher satisfaction than satisfied switchers butlower satisfaction than the dissatisfied switchers, are morelikely to exhibit passive loyalty behaviors. Satisfied switch-ers are the least satisfied customers and fall between theother two groups in terms of both active and passive loyaltybehaviors.
3. It replicates the research results of Study 1 in a larger sam-ple obtained from two geographical regions, which thus pro-vides external validation of the findings.
4. It empirically examines the impact of duration of stay withthe current bank on a customer’s overall satisfaction withthe bank. The results suggest that the difference observed inthe overall satisfaction scores among the three groupsdecreases with increasing tenure with the switched-to bank.
5. It investigates the impact of prior switching experiences onsatisfaction with the current service provider. The resultssuggest that irrespective of the reasons for the priorswitches, the most recent switching experience is the mostsalient for predicting customer satisfaction with the currentservice provider.
6. It identifies differences within the three hypothesized groupsin terms of their commitment to the current service provider.
Implications
A different perspective on customer loyalty behaviors.Active loyalty behavior can be defined as customers’ proac-tive behaviors or behavioral intentions that require consciousand deliberate effort to undertake. Although initiation ofthese behaviors does not appear to require changes in the ser-vice relationship or service environment, these behaviorsmay exceed mere repeat patronage to include positive wordof mouth and expansion of service usage. However, passiveloyalty behavior entails the elasticity of a customer’s behav-iors or behavioral intentions to significant changes in the ser-vice relationship or service environment. Price insensitivityand self-stated retention have been found here to constitutepassive loyalty behavior. Several theoretical explanationscan be offered as to why the dissatisfied switchers are morelikely to engage in active loyalty behavior, whereas stayersare likely to exhibit higher levels of passive loyalty behavior.
Research on emotions, satisfaction, and cognitive disso-nance provides a basis for a better understanding of why dis-satisfied switchers are more likely to engage in active loy-alty behaviors. First, prior research shows that consumersare likely to engage in more word-of-mouth behavior whenthey have significant emotional experiences (Westbrook1987) or increases in satisfaction (Swan and Oliver 1989),both of which are associated with the dissatisfied switchers.Second, dissonance theory suggests that dissatisfied switch-ers are more likely to experience elevated levels of appre-hension (dissonance), even perhaps indefinitely (Oliver1997), because their prior negative experiences remain inthe set of knowable potential outcomes that they perceive ashaving a nonzero probability of recurrence (see Oliver andWiner 1987). When higher levels of dissonance can beexpected in a customer group, higher levels of dissonance-reducing activity should also be prevalent—activities thatmay include the active loyalty behaviors evidenced by the
dissatisfied switchers. However, dissonance effects do notnecessarily preclude the stayers or other customer groupsfrom engaging in similar active loyalty behaviors.
Research on switching costs and involvement can pro-vide insight as to why stayers are more likely to exhibitstronger passive loyalty. Specifically, the lack of experien-tial knowledge of competitive offerings can contribute toperceived switching costs, particularly through learning-curve effects (Dick and Basu 1994; Guiltinan 1989). Thus,stayers, by definition, lack experiential knowledge; may bemore likely to perceive higher switching costs than the othertwo groups; and therefore are more likely to remain loyal toa service provider, even under conditions of dissatisfaction(Oliva, Oliver, and MacMillan 1992).
Second, social judgment theory (Sherif, Sherif, andNebergall 1965) predicts that highly involved people exhibitmore negative evaluations of communications from com-petitors, because high involvement is associated with anextended latitude of rejection of competitive offerings.Because the stayers exhibit both higher ego involvementand higher resistance to competitive pressure, as embodiedin their higher passive loyalty, this theoretical explanationmay be relevant to these findings.
Potential transition from a heterogeneous to a homoge-neous consumer base. Our research provides preliminaryevidence that suggests that with an increase in the durationof stay at the current bank, the differences in the overall sat-isfaction scores among the three groups decrease. In otherwords, over time all three customer groups exhibit similarlevels of satisfaction with the bank.
This empirical evidence, if validated across different ser-vice settings, may provide insight into the approximate timeframe for predictions made by several major theories (e.g.,comparison-level theory, experience-based norms). Forexample, Woodruff, Cadote and Jenkins (1983) suggest thatconsumers with extensive experience with the focal brand aremore likely to use the focal brand as the basis for expecta-tions. Applied here, this suggests that with the passage oftime, all customers who stay with their current bank begin toemploy a similar set of expectations based on experience withtheir current bank. What is not specified by prior research,however, is the specific length of time it takes for this to hap-pen. Further examination of this empirical finding would adda significant dimension to our understanding of switchingbehavior and customer loyalty. The key lies in determiningthe specific length of time across several industries.
Considerations in managing the customer groups. Ourfindings suggest that service firms in the retail bankingindustry fundamentally are faced with managing three dis-tinct, internal customer groups—dissatisfied switchers, sat-isfied switchers, and stayers—that differ in their satisfactionwith, loyalty toward, and involvement with the firm. Whatis needed, in light of the research presented here, is an effortto recognize the heterogeneity inherent in a firm’s customerbase (at least for the first ten years) and treat those segmentsdifferently with regard to potential investment strategy. Inparticular, service firms are faced with some critical ques-tions. First, which of these three customer groups warrantstrategic investment? Our results suggest that two customer

84 / Journal of Marketing, July 2000
groups—the dissatisfied switchers and the stayers—havethe potential to provide differential value above and beyondmere repeat patronage. However, we caution that thoughthese groups of customers appear to be candidates for firminvestments in acquisition and retention, further customervalue assessment that explicitly identifies the profitability ofthese customer groups is required (e.g., Blattberg andDeighton 1996).
Second, how can service providers maximize the long-term value provided by the various customer groups? Theresults we present in Table 12 suggest that significant dif-ferences exist between high- and low-commitment cus-tomers within the three customer groups. In other words,firms may be positioned to extract additional value, in termsof satisfaction and loyalty behavior, from each of these cus-tomer groups by focusing on a strategy of building commit-ment to the relationship with the firm.
For example, although the dissatisfied switchers exhibithigher levels of satisfaction, active loyalty, and purchaseinvolvement than the other two groups, they also exhibitlower levels of passive loyalty and ego involvement. Givenour results, if firms can increase commitment among the dis-satisfied switchers, they are likely to realize a significantincrease in (1) ego involvement and (2) passive loyaltybehaviors. Furthermore, an additional benefit may be real-ized in increasing high overall satisfaction to even higherlevels, which has been suggested by researchers to be key totrue long-term loyalty (e.g., Jones and Sasser 1995).
The results also show that stayers exhibit lower levels ofactive loyalty behaviors and satisfaction than dissatisfiedswitchers. As we illustrate in Table 12, increasing commit-ment among stayers is likely to increase both of these vari-ables significantly. The last customer group, the satisfiedswitchers, exhibits moderate to low levels of satisfaction,loyalty behavior, and involvement. The findings indicatethat increasing commitment among these customers is likelyto increase (1) overall satisfaction, (2) purchase and egoinvolvement, and (3) active and passive loyalty behaviors.In summary, when potential areas of investment across thethree customer groups are considered, building commitmentappears to be a particularly efficient mechanism for increas-ing the incremental value of a firm’s customer base.
Conclusion, Limitations, and FutureResearch Directions
The research presented here provides a unique and detailedinvestigation of what happens to customers after they switchservice providers. This affords a new perspective in cus-tomer switching and loyalty research: that of the switched-to firm. The findings of this research show important differ-ences in the customer base of a service provider andadvance the knowledge of postswitching phenomena.
Although this research makes contributions to theknowledge in this area, several limitations and futureresearch opportunities deserve mention. First, we cautionthat these results are confined to the retail banking industry,and further research is needed to validate and generalizethese results to broader settings. However, despite thiscaveat, the study findings could be generalized to services
that share some common characteristics with the bankingindustry. For example, the model proposed and tested in thisstudy might be applicable to services that reflect the follow-ing traits: (1) switching is largely initiated by the customer,either because of dissatisfaction or other reasons (e.g., job-related relocation), and not by the industry (i.e., competitivepoaching is relatively uncommon); (2) switching costs arerelatively high and/or consumer involvement with the prod-uct/service is high; (3) customer contact and personal rela-tionship issues take precedence over other aspects of the ser-vice in terms of selection, satisfaction, and switching; and(4) local presence of the service provider is desirable.
Legal services, accounting, insurance, and traditionalbrokerage services share some of these traits with banks.Because choices among these services tend to be high-involvement decisions, the personal relationship betweenthe contact person and the customer is often more essentialrelative to other aspects of the service than it is in servicessuch as cable television. Furthermore, with regard to theseservices, switching to another provider often requires thetime, effort, and monetary costs of evaluating informationbefore switching. There are also time, effort, and associatedcosts of learning about the new service routine and rulessubsequent to switching. However, our findings may notapply to services such as airline travel, hotels, or, for thatmatter, online banking or brokerage services, because thecharacteristics we discuss do not necessarily apply to theseservices.
Second, researchers have noted biases in self-reports ofsatisfaction (see Peterson and Wilson 1992), and as such themeasures of satisfaction must be considered against thisbackdrop. Third, although the current research findings sug-gest that the dissatisfied switchers and the highly committedstayers have the potential to be more profitable to the firm,further research should attempt to measure the lifetimevalue of the customer groups explicitly. An examination ofthe differences in the profitability of the groups may offerconcrete guidelines to firms in their quest for acquiring andretaining the right customers. Furthermore, future studiescould attempt to integrate the current findings with priorswitching research. For example, an approach similar to thecurrent research but that instead uses Keveaney’s (1995)customer switching framework would provide more detailedinsights to switching and postswitching attitudes and behav-iors. This would require a large sample.
Fourth, as mentioned previously, the research questionsaddressed in Study 2 are broader in scope and warrantgreater attention than could be afforded in this study. Thetemporal aspect of changes in the service firm’s customerbase is a fascinating area in need of further investigation.For example, does our ten-year milestone apply to otherindustries, and are there other critical milestones in thetenure of a customer with a service firm? As noted by Gar-dial and colleagues (1993, p. 556), “Longitudinal researchdesigns may be needed to explore how comparison stan-dards change over time, from prepurchase to various usagepoints successively removed from purchase.” Furthermore,other recent research calls for future studies to clarify therelative importance of the various comparison standardscustomers employ over time (Mittal, Kumar, and Tsiros

Customer Base of Service Providers / 85
1999), as well as provide a better understanding of the ongo-ing, dynamic, and context-specific nature of satisfaction(Fournier and Mick 1999). We recognize the difficulty inundertaking such research, but this appears to be a criticalarea for future studies.
A related finding addresses the notion of which switch—the most recent or the most emotionally taxing—is thesalient switch. Although the limited evidence presented heresuggests that the most recent switch is important, the possi-bility exists that the mere presence of an emotionally taxingdissatisfied switch in a customer’s history may be enough toaffect current satisfaction. Specifically, this memory islikely to factor into the set of knowable potential outcomesand thereby affect current expectations and levels of satis-faction (see Oliver and Winer 1987). What is needed isinformation on more than two switching events. A furtherconsideration would be the inclusion of duration of stay inany future switching-sequence model.
Similarly, research on the chronically dissatisfied cus-tomer segment (customers who exhibit repeated patterns ofdissatisfied switching) appears to be worthwhile. Althoughwe found only one person who switched twice in successionbecause of dissatisfaction, if such customers exist in largenumbers they could well be the bane of service firms. Froma theoretical perspective, it is also conceivable that such cus-tomers may not conform to our switching model or, for thatmatter, to other models that examine updating processes onsatisfaction and service quality (e.g., Boulding et al. 1993).
Furthermore, although the current study did not find anysignificant difference within the groups in terms of depen-
dence and risk aversion, these constructs warrant furtherdetailed examination. Recent research suggests that for rela-tional customers, trust and commitment are likely to beimportant antecedents of future patronage intentions,whereas for customers who are more transaction-oriented,future patronage appears to be driven more by overall satis-faction (Garbarino and Johnson 1999). A related area to bepursued stems from the findings that stayers who exhibitlower levels of commitment are likely to be more dissatis-fied than stayers who exhibit higher levels of commitment.This may suggest that today’s dissatisfied stayers may wellbe tomorrow’s dissatisfied switchers. This issue warrantsmore attention to improve our understanding of when andwhy customers defect.
Finally, our two-factor solution of the customer loyaltymeasures has clear analogies to Oliver’s (1997) model, inwhich loyalty is seen as progressing through four stages:cognitive, affective, conative, and action loyalty. Ouractive loyalty construct describes behaviors above andbeyond mere repeat patronage, such as word of mouth andexpansion of service usage, and appears similar to Oliver’s(1997) notion of affective loyalty. Our passive loyalty fac-tor describes behaviors related to a customer’s willingnessto continue patronizing the service provider and suscepti-bility to competitive actions and appears to resembleOliver’s (1997) notion of conative loyalty. However,although these similarities seem logical, drawing suchcomparisons is exploratory and post hoc. Further researchis needed to delineate the factors within the loyaltyconstruct.
REFERENCESAnderson, Eugene W. (1994), “Cross-Category Variation in Cus-
tomer Satisfaction and Retention,” Marketing Letters, 5 (1),19–30.
———, Claes Fornell, and Donald Lehman (1994), “CustomerSatisfaction, Market Share, and Profitability: Findings fromSweden,” Journal of Marketing, 58 (July), 53–66.
——— and Mary W. Sullivan (1993), “The Antecedents and Con-sequences of Customer Satisfaction for Firms,” Marketing Sci-ence, 12 (Spring), 125–43.
Anderson, James C. and James A. Narus (1990), “A Model of Dis-tributor Firm and Manufacturer Firm Working Partnerships,”Journal of Marketing, 54 (January), 42–58.
Arndt, Johan (1968), “Word of Mouth Advertising and PerceivedRisk,” in Perspectives in Consumer Behavior, Harold H. Kas-sarjian and Thomas S. Robertson, eds. Glenview, IL: Scott,Foresman, 330–36.
Assael, Henry (1987), Consumer Behavior and Marketing Action,3d ed. Boston: PWS-Kent.
Baumgartner, Hans and Jan-Benedict E.M. Steenkamp (1996),“Exploratory Consumer Buying Behavior: Conceptualizationand Measurement,” International Journal of Research in Mar-keting, 13 (2), 121–37.
Bearden, William O. and Jesse E. Teel (1983), “Selected Determi-nants of Consumer Satisfaction and Complaint Reports,” Jour-nal of Marketing Research, 20 (February), 21–28.
Beatty, Sharon, Lynn R. Kahle, and Pamela Homer (1988), “TheInvolvement-Commitment Model: Theory and Implications,”Journal of Business Research, 16 (2), 149–67.
——— and Scott M. Smith (1987), “External Search Effort: AnInvestigation Across Several Product Categories,” Journal ofConsumer Research, 14 (June), 83–95.
Bendapudi, Neeli and Leonard L. Berry (1997), “Customers’ Moti-vations for Maintaining Relationships with Service Providers,”Journal of Retailing, 73 (Spring), 15–37.
Berlyne, D.E. (1960), Conflict, Arousal and Curiosity. New York:McGraw-Hill.
Berry, Leonard L. (1983), “Relationship Marketing,” in EmergingPerspectives on Services Marketing, Leonard L. Berry, LynnShostack, and Gregory Upah, eds. Chicago: American Market-ing Association, 25–28.
Bitner, Mary Jo, Bernard M. Booms, and Lois A. Mohr (1994),“Critical Service Encounters: The Employee’s Viewpoint,”Journal of Marketing, 58 (October), 95–106.
Blattberg, Robert C. and John Deighton (1996), “Manage Market-ing by the Customer Equity Test,” Harvard Business Review, 74(July/August), 136–44.
Bloch, Peter H. (1982), “Involvement Beyond the PurchaseProcess: Conceptual Issues and Empirical Investigation,” inAdvances in Consumer Research, Vol. 9, Andrew Mitchell, ed.Ann Arbor, MI: Association for Consumer Research, 413–17.
——— and Marsha L. Richins (1983), “A Theoretical Model forthe Study of Product Importance Perceptions,” Journal of Mar-keting, 47 (Summer), 69–81.
Bloemer, Jose M.M. and Hans D.P. Kasper (1995), “The ComplexRelationship Between Consumer Satisfaction and Brand Loy-alty,” Journal of Economic Psychology, 16 (July), 311–29.
Boulding, William, Ajay Kalra, Richard Staelin, and Valerie Zei-thaml (1993), “A Dynamic Process Model of Service Quality:From Expectations to Behavioral Intentions,” Journal of Mar-keting Research, 30 (February), 7–27.
Brehm, Jack W. (1966), A Theory of Psychological Reactance.New York: Academic Press.

86 / Journal of Marketing, July 2000
Burke, Raymond R. and Thomas K. Srull (1988), “CompetitiveInterference and Consumer Memory for Advertising,” Journalof Consumer Research, 15 (June), 55–68.
Cadotte, Ernest R., Robert B. Woodruff, and Roger L. Jenkins(1987), “Expectations and Norms in Models of Consumer Sat-isfaction,” Journal of Marketing Research, 24 (August),305–14.
Churchill, Gilbert A., Jr., and Carol Surprenant (1982), “An Inves-tigation into the Determinants of Customer Satisfaction,” Jour-nal of Marketing Research, 19 (November), 491–504.
Cohen, Joel B. (1983), “Involvement and You: 1000 Great Ideas,”in Advances in Consumer Research, Vol. 10, Richard Bagozziand A. Tybout, eds. Ann Arbor, MI: Association for ConsumerResearch, 325–28.
Crano, William D. (1977), “Primacy and Recency in Retention ofInformation and Opinion Change,” Journal of Social Psychol-ogy, 101 (February), 87–96.
Crosby, Lawrence A., Kenneth R. Evans, and Deborah Cowles(1990), “Relationship Quality in Services Selling: An Interper-sonal Influence Perspective,” Journal of Marketing, 54 (July),68–81.
——— and Nancy Stephens (1987), “Effects of Relationship Mar-keting on Satisfaction, Retention, and Prices in the Life Insur-ance Industry,” Journal of Marketing Research, 24 (Novem-ber), 404–11.
Crowder, R.D. (1976), Principles of Learning and Memory. Hills-dale, NJ: Lawrence Erlbaum Associates.
Czepiel, John A. (1990), “Service Encounters and Service Rela-tionships: Implications for Research,” Journal of BusinessResearch, 20 (1), 13–21.
Day, George S. (1969), “A Two-Dimensional Concept of BrandLoyalty,” Journal of Advertising, 9 (3), 29–35.
Dick, Alan S. and Kunal Basu (1994), “Customer Loyalty: Towardan Integrated Conceptual Framework,” Journal of the Academyof Marketing Science, 22 (2), 99–113.
Dowling, Graham R. and Mark Uncles (1997), “Do Customer Loy-alty Programs Really Work?” Sloan Management Review, 38(Summer), 71–82.
Folkes, Valerie S. (1988), “The Availability Heuristic and Per-ceived Risk,” Journal of Consumer Research, 15 (June), 13–23.
——— (1994), “How Consumers Predict Service Quality: WhatDo They Expect?” in Service Quality: New Directions in The-ory and Practice, Roland T. Rust and Richard L. Oliver, eds.Thousand Oaks, CA: Sage Publications, 108–22.
Fornell, Claes (1992), “A National Customer Satisfaction Barome-ter: The Swedish Experience,” Journal of Marketing, 56 (Janu-ary), 6–21.
———, Michael D. Johnson, Eugene W. Anderson, Jaesung Cha,and Barbara Everitt Bryant (1996), “The American CustomerSatisfaction Index: Nature, Purpose, and Findings,” Journal ofMarketing, 60 (October), 7–18.
Fournier, Susan and David Glen Mick (1999), “Rediscovering Sat-isfaction,” Journal of Marketing, 63 (October), 5–23.
Ganesan, Shankar (1994), “Determinants of Long-Term Orienta-tion in Buyer–Seller Relationships,” Journal of Marketing, 58(April), 1–19.
Garbarino, Ellen and Mark S. Johnson (1999), “The DifferentRoles of Satisfaction, Trust and Commitment in CustomerRelationships,” Journal of Marketing, 63 (April), 70–87.
Gardial, Sarah Fisher, D. Scott Clemons, Robert B. Woodruff,David W. Schumann, and Mary Jane Burns (1993), “Compar-ing Consumers’ Recall of Prepurchase and Postpurchase Prod-uct Evaluation Experiences,” Journal of Consumer Research,20 (March), 548–60.
Goff, Brent G., James S. Boles, Danny N. Bellenger, and CarrieStojack (1997), “The Influence of Salesperson Selling Behav-iors on Customer Satisfaction with Products,” Journal ofRetailing, 73 (Summer), 171–84.
Greene, Robert L. (1986), “Sources of Recency Effects in FreeRecall,” Psychological Bulletin, 99 (2), 221–28.
Guiltinan, Joseph P. (1989), “A Classification of Switching Costswith Implications for Relationship Marketing,” in 1989 AMAWinter Educators’Conference: Marketing Theory and Practice,T.L. Childers, R.P. Bagozzi, and J.P. Peter, eds. Chicago: Amer-ican Marketing Association, 216–20.
Helson, Harry (1964), Adaptation-Level Theory. New York: Harperand Row.
Houston, Michael J. and L.M. Rothschild (1978), “A Paradigm forResearch on Consumer Involvement,” Working Paper No. 11-77-46, University of Wisconsin, Madison.
Iacobucci, Dawn and Amy Ostrom (1996), “Commercial and Inter-personal Relationships: Using the Structure of InterpersonalRelationships to Understand Individual-to-Individual, Individ-ual-to-Firm, and Firm-to-Firm Relationships in Commerce,”International Journal of Research in Marketing, 13 (February),53–72.
Jacoby, Jacob and Robert W. Chestnut (1978), Brand Loyalty:Measurement and Management. New York: John Wiley &Sons.
——— and David B. Kyner (1973), “Brand Loyalty vs. RepeatPurchasing Behavior,” Journal of Marketing Research, 10(February), 1–9.
Jones, Thomas O. and Earl W. Sasser Jr. (1995), “Why SatisfiedCustomers Defect,” Harvard Business Review, 73 (Novem-ber/December), 88–99.
Keaveney, Susan (1995), “Customer Switching Behavior in Ser-vice Industries: An Exploratory Study,” Journal of Marketing,59 (April), 71–82.
Kelley, Scott W., K. Douglas Hoffman, and Mark A. Davis (1993),“A Typology of Retail Failures and Recoveries,” Journal ofRetailing, 69 (Winter), 429–52.
LaBarbera, Priscilla and David Mazursky (1983), “A LongitudinalAssessment of Consumer Satisfaction/Dissatisfaction: TheDynamic Aspect of the Cognitive Process,” Journal of Market-ing Research, 20 (November), 393–404.
LaTour, Stephen A. and Nancy C. Peat (1979), “Conceptual andMethodological Issues in Consumer Satisfaction Research,” inAdvances in Consumer Research, Vol. 6, William F. Wilkie, ed.Ann Arbor, MI: Association for Consumer Research, 431–37.
——— and ——— (1980), “The Role of Situationally-ProducedExpectations, Others’ Experiences, and Prior Experience inDetermining Consumer Satisfaction,” in Advances in Con-sumer Research, Vol. 7, Jerry C. Olson, ed. Ann Arbor, MI:Association for Consumer Research, 588–92.
Laurent, Gilles and Jean-Noel Kapferer (1985), “Measuring Con-sumer Involvement Profiles,” Journal of Marketing Research,22 (February), 41–53.
Mazursky, David, Priscilla LaBarbera, and Al Aiello (1987),“When Consumers Switch Brands,” Psychology and Market-ing, 4 (Spring), 17–30.
Mittal, Banwari (1989), “Measuring Purchase Decision Involve-ment,” Psychology and Marketing, 6 (2), 147–62.
——— and Myung-soo Lee (1989), “A Causal Model of Con-sumer Involvement,” Journal of Economic Psychology, 10(November), 363–89.
Mittal, Vikas, Pankaj Kumar, and Michael Tsiros (1999),“Attribute-Level Performance, Satisfaction and BehavioralIntentions over Time: A Consumption-System Approach,”Journal of Marketing, 63 (April), 88–101.
Morgan, Robert M. and Shelby D. Hunt (1994), “The Commit-ment-Trust Theory of Relationship Marketing,” Journal ofMarketing, 58 (July), 20–38.
Nunnally, Jum C. (1978), Psychometric Theory. New York:McGraw-Hill.
O’Brien, Louise and Charles Jones (1995), “Do Rewards Really Cre-ate Loyalty?” Harvard Business Review, 73 (May/June), 75–83.

Customer Base of Service Providers / 87
Oliva, Terence, Richard L. Oliver, and Ian MacMillan (1992), “ACatastrophe Model For Developing Service Satisfaction Strate-gies,” Journal of Marketing, 56 (July), 83–95.
Oliver, Richard L. (1980), “A Cognitive Model of the Antecedentsand Consequences of Satisfaction Decisions,” Journal of Mar-keting Research, 17 (November), 460–69.
——— (1992), “An Investigation of the Attribute Basis of Emo-tion and Related Affects in Consumption: Suggestions for aStage-Specific Satisfaction Framework,” in Advances in Con-sumer Research, Vol. 19, John Sherry and Brian Sternthal, eds.Ann Arbor, MI: Association for Consumer Research, 237–44.
——— (1993), “Cognitive, Affective, and Attribute Bases of theSatisfaction Response,” Journal of Consumer Research, 20(December), 418–30.
——— (1997), Satisfaction: A Behavioral Perspective on the Con-sumer. Boston: Richard D. Irwin/McGraw-Hill.
——— and John E. Swan (1989), “Consumer Perceptions of Inter-personal Equity and Satisfaction in Transactions: A Field Sur-vey Approach,” Journal of Marketing, 53 (April), 21–35.
——— and Russell S. Winer (1987), “A Framework for the For-mation and Structure of Consumer Expectations: Review andPropositions,” Journal of Economic Psychology, 8 (December),469–99.
Ostrom, Amy and Dawn Iacobucci (1995), “Consumer Tradeoffsand the Evaluation of Services,” Journal of Marketing, 59 (Jan-uary), 17–28.
Parasuraman, A., Valarie A. Zeithaml, and Leonard L. Berry(1985), “A Conceptual Model of Service Quality and Its Impli-cations for Future Research,” Journal of Marketing, 49 (Fall),41–50.
———, ———, and ——— (1988), “SERVQUAL: A Multiple-Item Scale for Measuring Consumer Perceptions of ServiceQuality,” Journal of Retailing, 64 (Spring), 12–37.
———, ———, and ——— (1994), “Reassessment of Expecta-tions as a Comparison Standard in Measuring Service Quality:Implications for Further Research,” Journal of Marketing, 58(January), 111–24.
Pearlin, Leonard I. and Carmi Schooler (1978), “The Structure ofCoping,” Journal of Health and Social Behavior, 19 (March),2–21.
Peterson, Robert A. and William Wilson (1992), “Measuring Cus-tomer Satisfaction: Fact and Artifact,” Journal of Academy ofMarketing Science, 20 (1), 61–71.
Pieters, Rik G.M. and Tammo H.A. Bijmolt (1997), “ConsumerMemory for Television Advertising: A Field Study of Duration,Serial Position, and Competition Effects,” Journal of ConsumerResearch, 23 (March), 362–72.
Ping, Robert A. (1993), “The Effects of Satisfaction and StructuralConstraints on Retailer Exiting, Voice, Loyalty, Opportunismand Neglect,” Journal of Retailing, 69 (Fall), 320–52.
Raju, P.S. (1980), “Optimum Stimulation Level: Its Relationship toPersonality, Demographics and Exploratory Behavior,” Journalof Consumer Research, 7 (December), 272–82.
Reichheld, Frederick F. (1993), “Loyalty-Based Management,”Harvard Business Review, 71 (March/April), 64–73.
——— and David W. Kenny (1990), “The Hidden Advantages ofCustomer Retention,” Journal of Retail Banking, 4 (Winter),19–23.
——— and Thomas Teal (1996), The Loyalty Effect. Boston: Har-vard Business School Press.
Richins, Marsha L. and Peter H. Bloch, (1986), “After the NewWears Off: The Temporal Context of Product Involvement,”Journal of Consumer Research, 13 (September), 280–85.
Rust, Ronald T. and Anthony J. Zahorik (1993), “Customer Satis-faction, Customer Retention, and Market Share,” Journal ofRetailing, 69 (Summer), 193–215.
Salma, Mark E. and Armen Tashchain (1985), “Selected Socioeco-nomic and Demographic Characteristics Associated with Pur-chasing Involvement,” Journal of Marketing, 49 (Winter),72–82.
Sherif, Carolyn W., Musafer Sherif, and Roger E. Nebergall(1965), Attitude and Attitude Change. Philadelphia: Saunders.
Sherif, Musafer and H. Cantril (1947), The Psychology of Ego-Involvement. New York: John Wiley & Sons.
Swan, John E. and Richard L. Oliver (1989), “Post-purchase Com-munications by Consumers,” Journal of Retailing, 65 (Winter),516–33.
Thibaut, John W. and Harold H. Kelley (1959), The Social Psy-chology of Groups. New York: John Wiley & Sons.
Tse, David K. and Peter C. Wilton (1988), “Models of ConsumerSatisfaction Formation: An Extension,” Journal of MarketingResearch, 25 (May), 204–12.
Tversky, Amos and Daniel Kahneman (1974), “Judgement UnderUncertainty: Heuristics and Biases,” Science, 185 (September),1124–31.
Westbrook, Robert A. (1981), “Sources of Consumer Satisfactionwith Retail Outlets,” Journal of Retailing, 57 (Fall), 68–85.
——— (1987), “Product/Consumption-Based Affective Re-sponses and Post-purchase Processes,” Journal of MarketingResearch, 24 (August), 258–70.
——— and Richard L. Oliver (1981), “Developing Better Mea-sures of Consumer Satisfaction: Some Preliminary Results,” inAdvances in Consumer Research, Vol. 8, Kent B. Monroe, ed.Ann Arbor, MI: Association for Consumer Research, 94–99.
Woodruff, Robert B., Ernest R. Cadotte, and Roger L. Jenkins(1983), “Modeling Consumer Satisfaction Processes UsingExperience-Based Norms,” Journal of Marketing Research, 20(August), 296–304.
Zaichkowsky, Judith Lynne (1985), “Measuring the InvolvementConstruct,” Journal of Consumer Research, 12 (December),341–52.
Zeithaml, Valarie A., Leonard L. Berry, and A. Parasuraman(1993), “The Nature and Determinants of Customer Expecta-tions of Service,” Journal of the Academy of Marketing Sci-ence, 21 (Winter), 1–12.
———, ———, and ——— (1996), “The Behavioral Consequencesof Service Quality,” Journal of Marketing, 60 (April), 31–46.