
Understanding the CFO and Translating Metrics the CFO and Translating Metrics . ... Creating...
60
Click To Edit Master Title Style Workshop Part 1 and 2 Energy to Finance: Understanding the CFO and Translating Metrics Wednesday, May 11 th
Transcript of Understanding the CFO and Translating Metrics the CFO and Translating Metrics . ... Creating...
Click To Edit Master Title Style
Workshop Part 1 and 2 Energy to Finance: Understanding the CFO and Translating Metrics Wednesday, May 11th
2016 RILA Workshop
Energy to Finance: Understanding the CFO and Translating Metrics
May 11, 2016
This resource was completed with support from the Department of Energy’s Office of Energy Efficiency and Renewable Energy and the Better Buildings Initiative to highlight innovative proven energy solutions from market leaders in the Retail sector. Find more ideas at the Better Buildings Solution Center at betterbuildingssolutioncenter.energy.gov
Created by:

© 2015 Deloitte 3
Welcome Erin Hiatt, RILA
© 2015 Deloitte 4
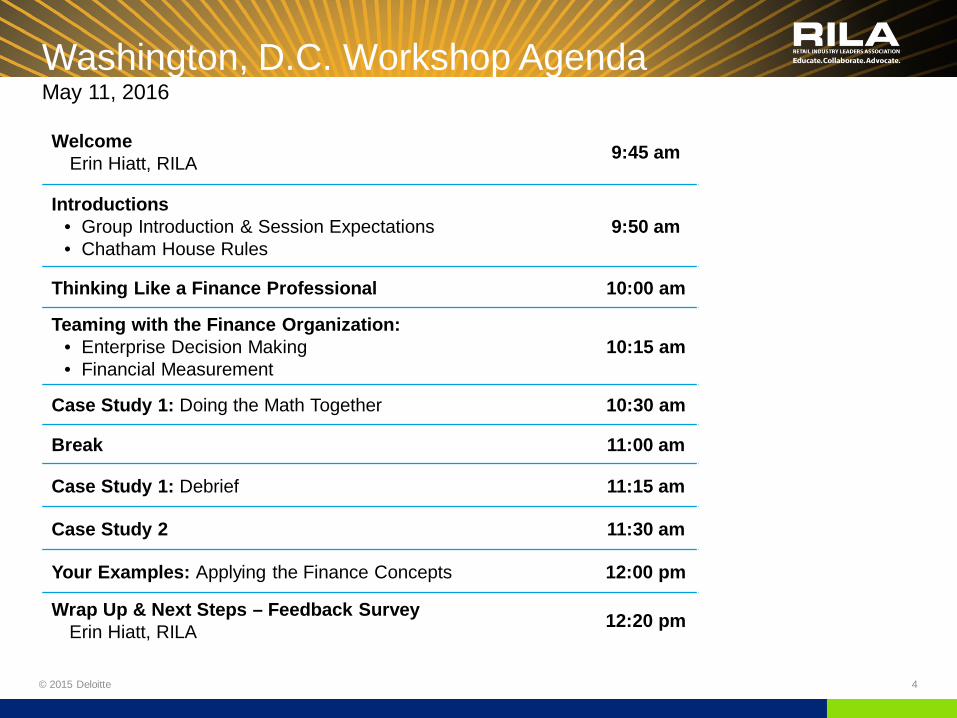
Washington, D.C. Workshop Agenda May 11, 2016
Welcome Erin Hiatt, RILA 9:45 am
Introductions • Group Introduction & Session Expectations • Chatham House Rules
9:50 am
Thinking Like a Finance Professional 10:00 am
Teaming with the Finance Organization: • Enterprise Decision Making • Financial Measurement
10:15 am
Case Study 1: Doing the Math Together 10:30 am
Break 11:00 am
Case Study 1: Debrief 11:15 am
Case Study 2 11:30 am
Your Examples: Applying the Finance Concepts 12:00 pm
Wrap Up & Next Steps – Feedback Survey Erin Hiatt, RILA 12:20 pm

© 2015 Deloitte 5
Introductions What do you most hope to learn in today’s workshop?
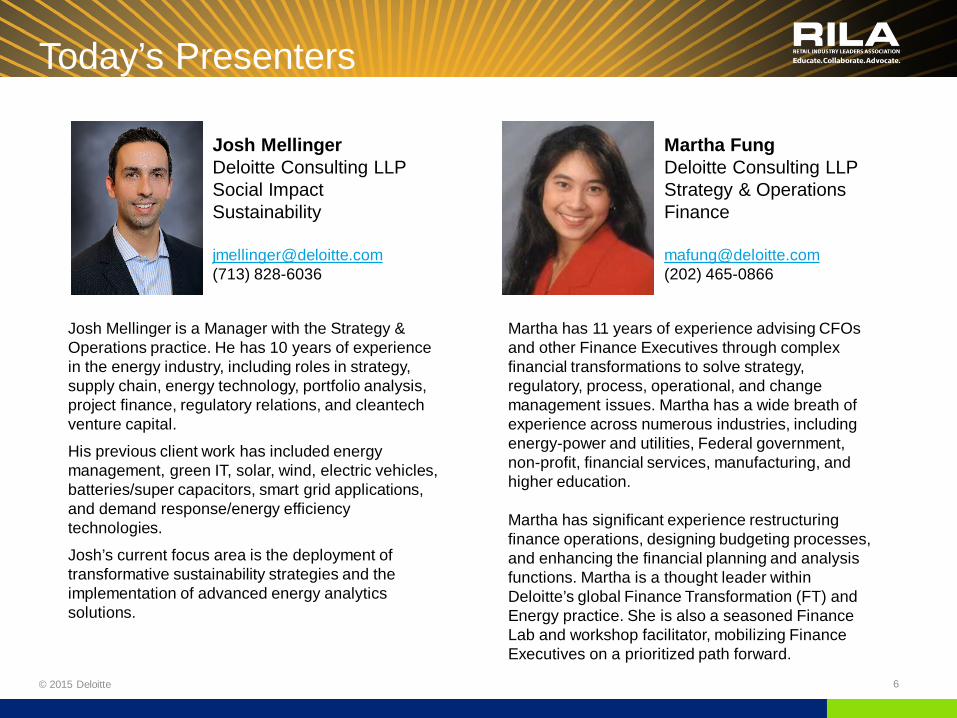
Today’s Presenters
Martha Fung Deloitte Consulting LLP Strategy & Operations Finance [email protected] (202) 465-0866
6 © 2015 Deloitte
Martha has 11 years of experience advising CFOs and other Finance Executives through complex financial transformations to solve strategy, regulatory, process, operational, and change management issues. Martha has a wide breath of experience across numerous industries, including energy-power and utilities, Federal government, non-profit, financial services, manufacturing, and higher education. Martha has significant experience restructuring finance operations, designing budgeting processes, and enhancing the financial planning and analysis functions. Martha is a thought leader within Deloitte’s global Finance Transformation (FT) and Energy practice. She is also a seasoned Finance Lab and workshop facilitator, mobilizing Finance Executives on a prioritized path forward.
Josh Mellinger Deloitte Consulting LLP Social Impact Sustainability [email protected] (713) 828-6036
Josh Mellinger is a Manager with the Strategy & Operations practice. He has 10 years of experience in the energy industry, including roles in strategy, supply chain, energy technology, portfolio analysis, project finance, regulatory relations, and cleantech venture capital.
His previous client work has included energy management, green IT, solar, wind, electric vehicles, batteries/super capacitors, smart grid applications, and demand response/energy efficiency technologies.
Josh’s current focus area is the deployment of transformative sustainability strategies and the implementation of advanced energy analytics solutions.
© 2015 Deloitte 7
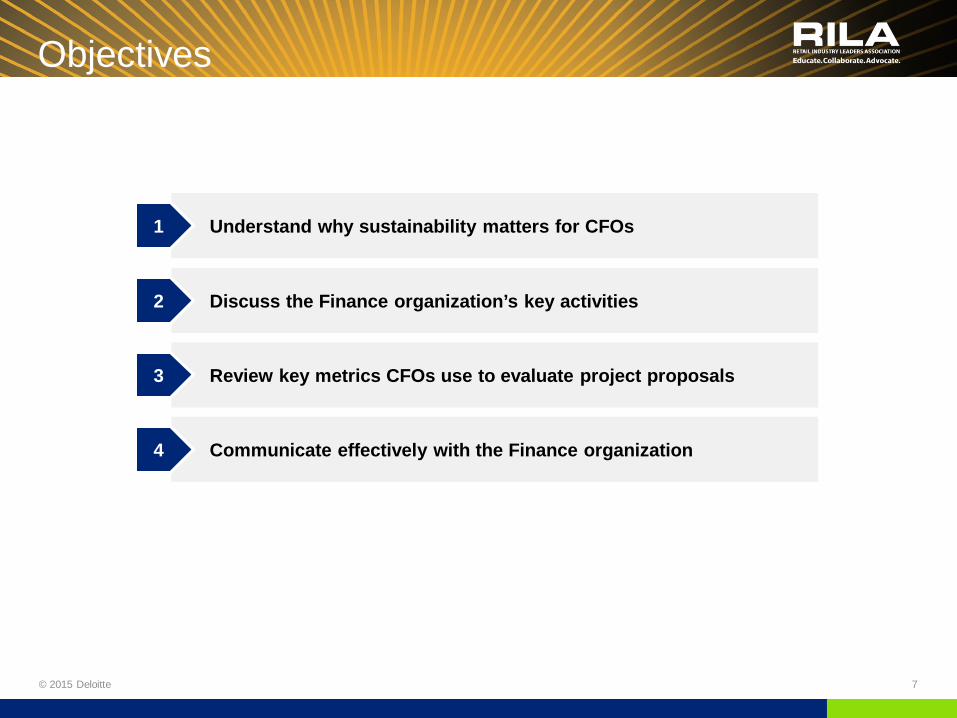
Understand why sustainability matters for CFOs 1
Discuss the Finance organization’s key activities 2
Review key metrics CFOs use to evaluate project proposals 3
Communicate effectively with the Finance organization 4
Objectives
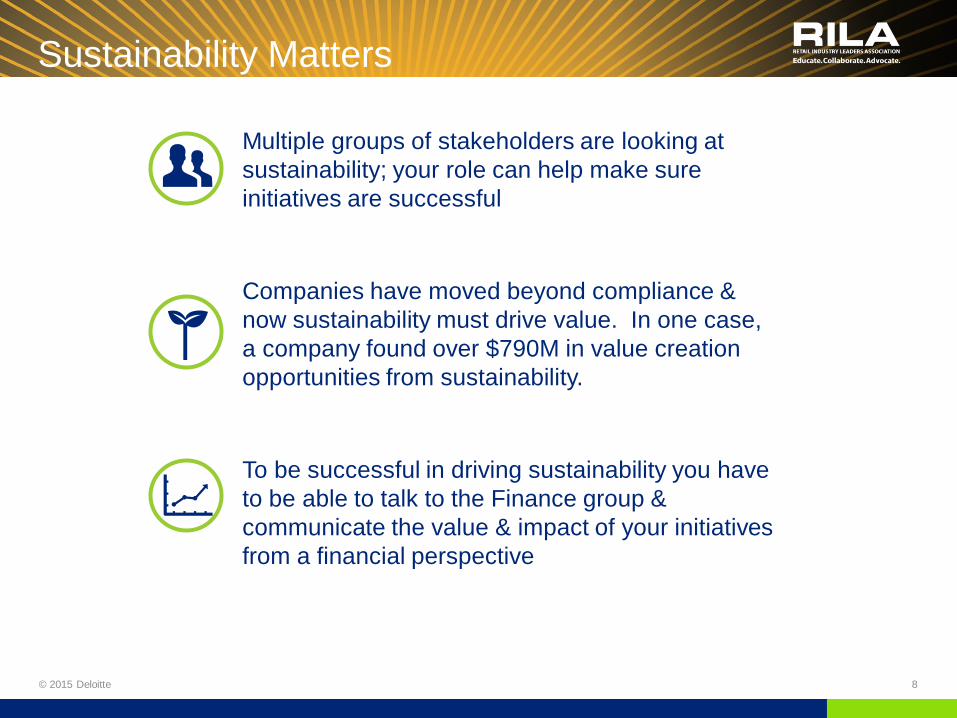
Sustainability Matters
8
Multiple groups of stakeholders are looking at sustainability; your role can help make sure initiatives are successful
Companies have moved beyond compliance & now sustainability must drive value. In one case, a company found over $790M in value creation opportunities from sustainability.
To be successful in driving sustainability you have to be able to talk to the Finance group & communicate the value & impact of your initiatives from a financial perspective
© 2015 Deloitte

© 2015 Deloitte 9
Thinking Like a Finance Professional
© 2015 Deloitte 10
Strategist
Operator
Steward
Catalyst
Finance Function
Role
Responsibilities
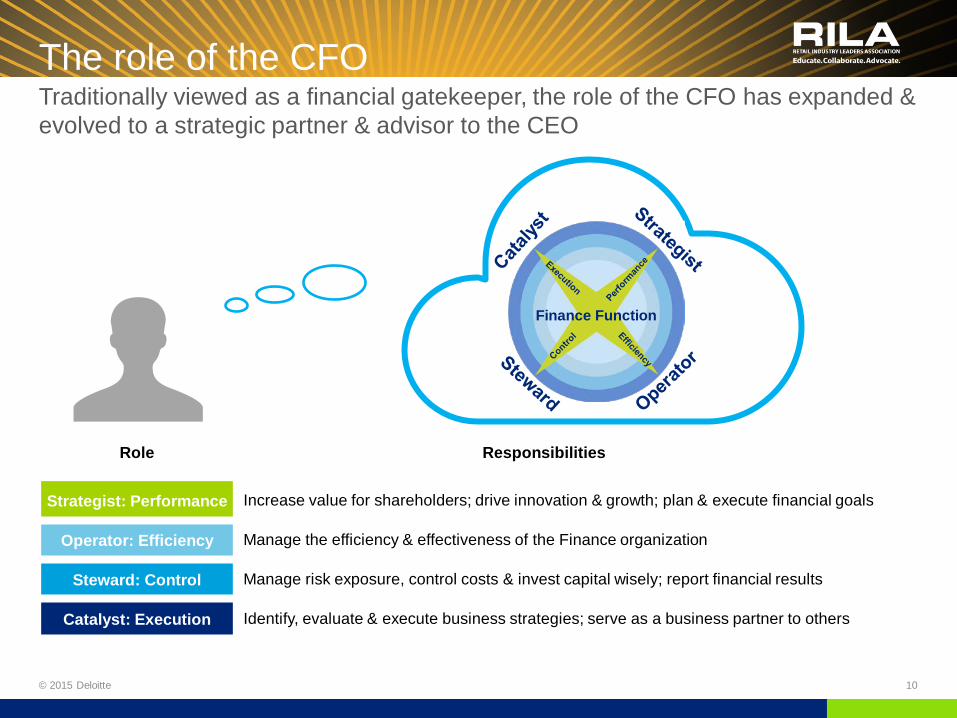
Strategist: Performance Increase value for shareholders; drive innovation & growth; plan & execute financial goals
Operator: Efficiency Manage the efficiency & effectiveness of the Finance organization
Steward: Control Manage risk exposure, control costs & invest capital wisely; report financial results
Catalyst: Execution Identify, evaluate & execute business strategies; serve as a business partner to others
The role of the CFO Traditionally viewed as a financial gatekeeper, the role of the CFO has expanded & evolved to a strategic partner & advisor to the CEO
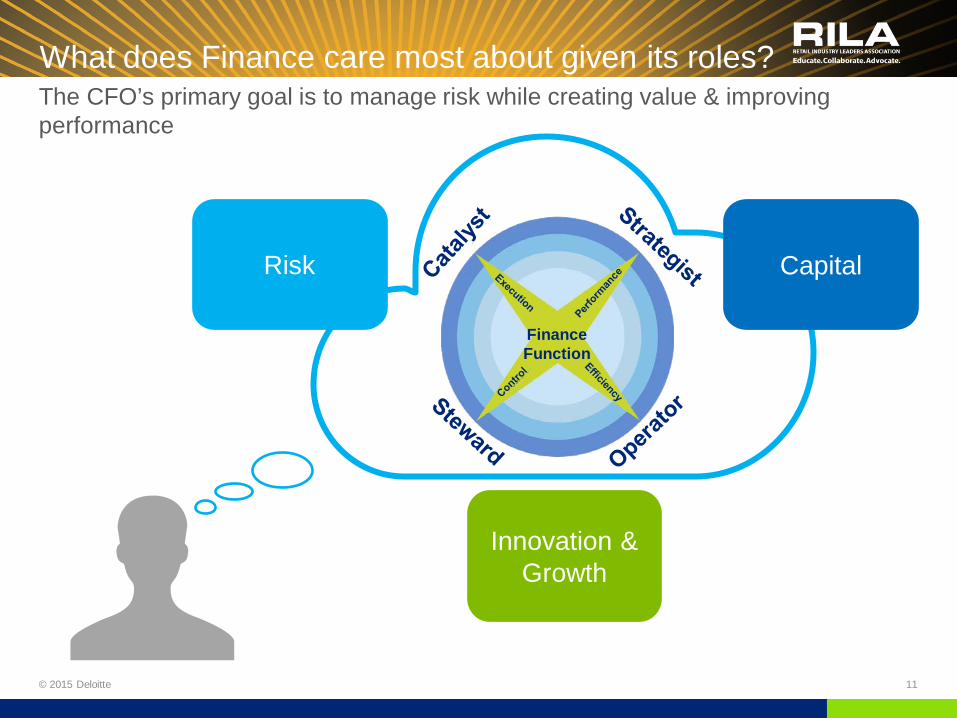
What does Finance care most about given its roles?
© 2015 Deloitte 11
The CFO’s primary goal is to manage risk while creating value & improving performance
Risk
Innovation & Growth
Strategist
Operator
Steward
Catalyst
Finance Function
Capital
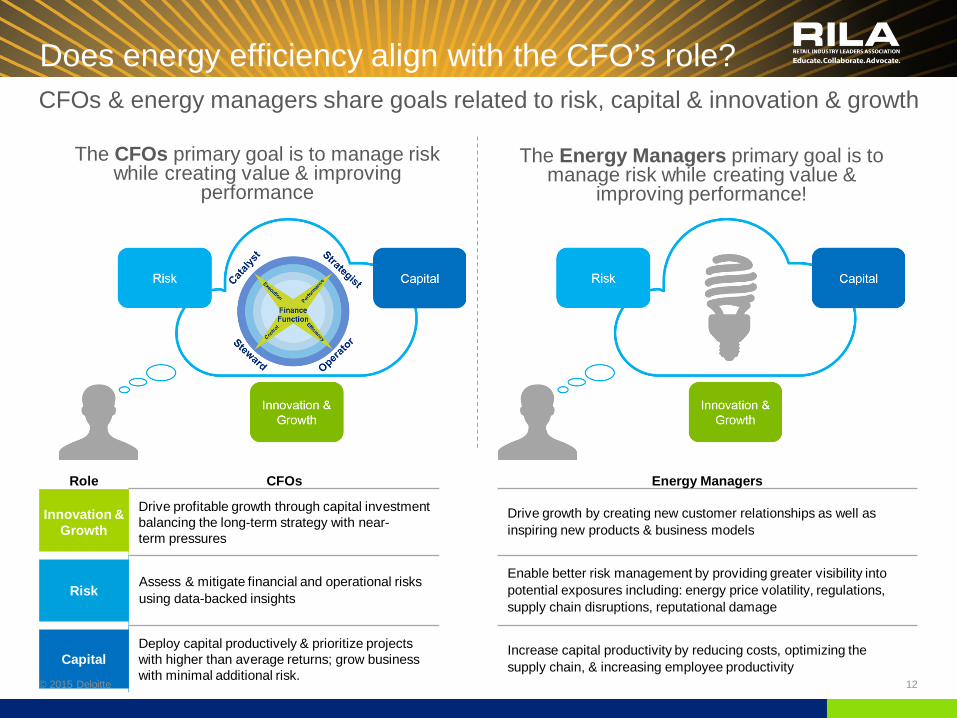
Role CFOs Energy Managers
Innovation & Growth
Drive profitable growth through capital investment balancing the long-term strategy with near- term pressures
Drive growth by creating new customer relationships as well as inspiring new products & business models
Risk Assess & mitigate financial and operational risks using data-backed insights
Enable better risk management by providing greater visibility into potential exposures including: energy price volatility, regulations, supply chain disruptions, reputational damage
Capital Deploy capital productively & prioritize projects with higher than average returns; grow business with minimal additional risk.
Increase capital productivity by reducing costs, optimizing the supply chain, & increasing employee productivity
Does energy efficiency align with the CFO’s role?
The Energy Managers primary goal is to manage risk while creating value &
improving performance!
The CFOs primary goal is to manage risk while creating value & improving
performance
CFOs & energy managers share goals related to risk, capital & innovation & growth
© 2015 Deloitte 12

© 2015 Deloitte 13
Teaming with the Finance Organization: Planning, Budgeting, Forecasting, & Performance Management
SHAREHOLDER VALUE
PERFORMANCE MGMT
BUDGETING STRATEGIC PLANNING
FORECASTING
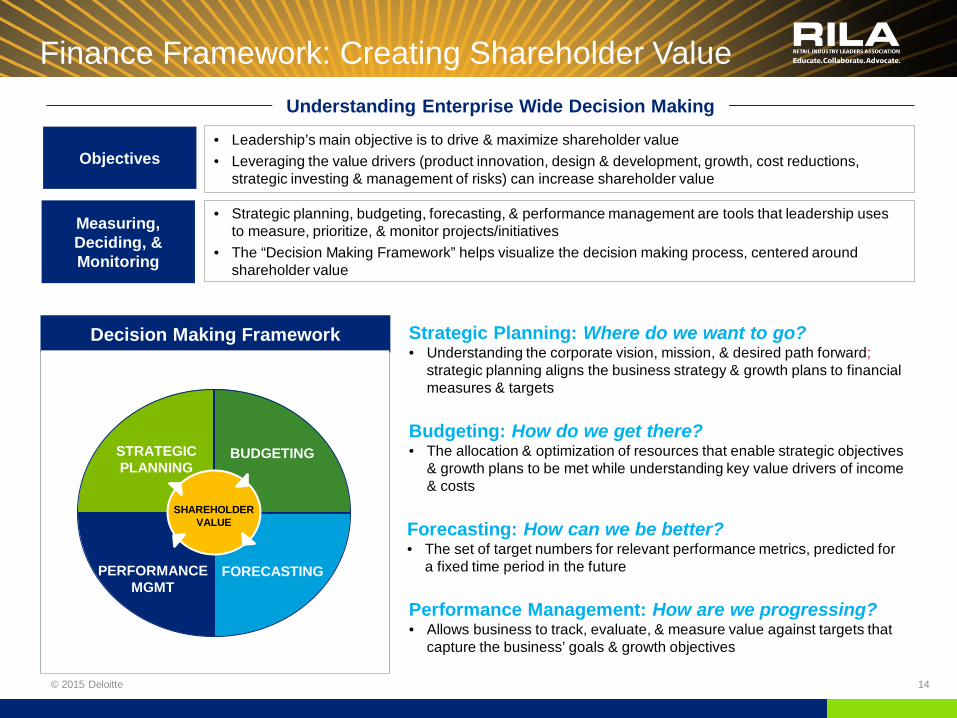
Finance Framework: Creating Shareholder Value
14 © 2015 Deloitte
Objectives • Leadership’s main objective is to drive & maximize shareholder value • Leveraging the value drivers (product innovation, design & development, growth, cost reductions,
strategic investing & management of risks) can increase shareholder value
Measuring, Deciding, & Monitoring
• Strategic planning, budgeting, forecasting, & performance management are tools that leadership uses to measure, prioritize, & monitor projects/initiatives
• The “Decision Making Framework” helps visualize the decision making process, centered around shareholder value
Decision Making Framework
SHAREHOLDER VALUE
PERFORMANCE MGMT
BUDGETING STRATEGIC PLANNING
FORECASTING
Understanding Enterprise Wide Decision Making
Strategic Planning: Where do we want to go? • Understanding the corporate vision, mission, & desired path forward;
strategic planning aligns the business strategy & growth plans to financial measures & targets
Budgeting: How do we get there? • The allocation & optimization of resources that enable strategic objectives
& growth plans to be met while understanding key value drivers of income & costs
Forecasting: How can we be better? • The set of target numbers for relevant performance metrics, predicted for
a fixed time period in the future
Performance Management: How are we progressing? • Allows business to track, evaluate, & measure value against targets that
capture the business’ goals & growth objectives
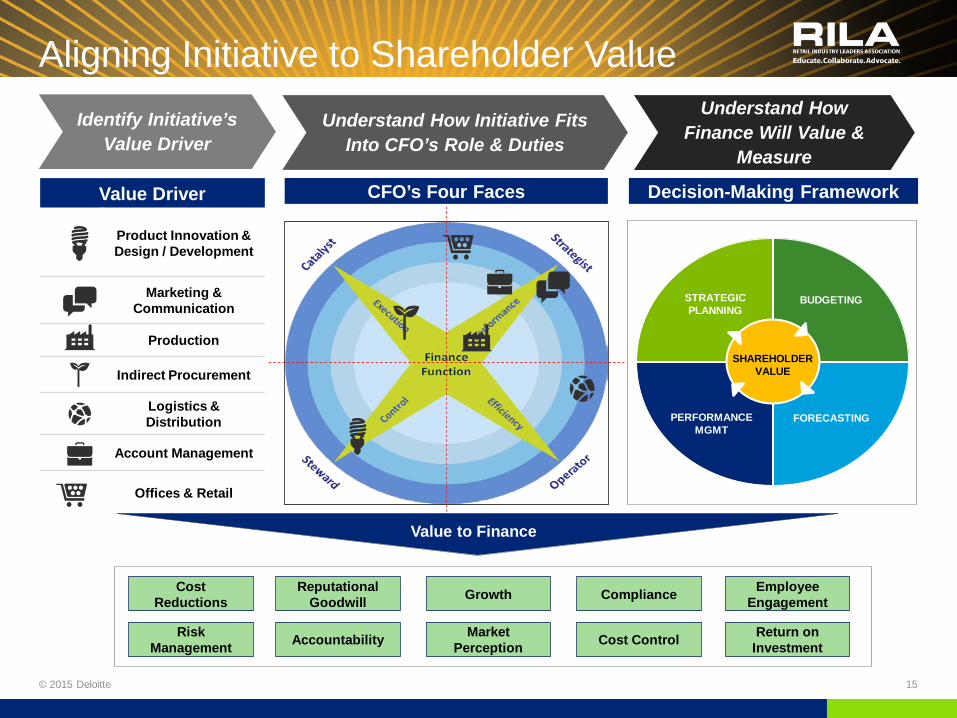
Value Driver
Product Innovation & Design / Development
Marketing & Communication
Production
Indirect Procurement
Logistics & Distribution
Account Management
Offices & Retail
Identify Initiative’s Value Driver
Understand How Initiative Fits Into CFO’s Role & Duties
Understand How Finance Will Value &
Measure
SHAREHOLDER VALUE
PERFORMANCE MGMT
BUDGETING STRATEGIC PLANNING
FORECASTING
CFO’s Four Faces Decision-Making Framework
Cost Reductions
Return on Investment
Risk Management
Compliance Reputational Goodwill
Cost Control Accountability
Growth Employee Engagement
Market Perception
Value to Finance
Aligning Initiative to Shareholder Value
© 2015 Deloitte 15
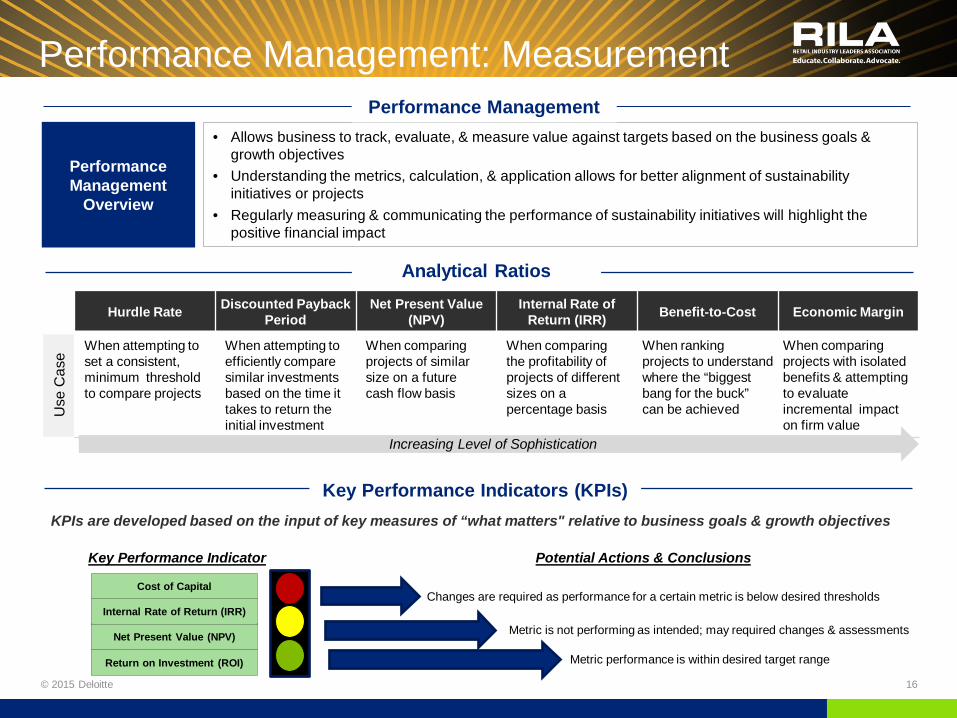
• Allows business to track, evaluate, & measure value against targets based on the business goals & growth objectives
• Understanding the metrics, calculation, & application allows for better alignment of sustainability initiatives or projects
• Regularly measuring & communicating the performance of sustainability initiatives will highlight the positive financial impact
Return on Investment (ROI)
Net Present Value (NPV)
Internal Rate of Return (IRR)
Cost of Capital
Performance Management
Overview
Performance Management
Performance Management: Measurement
KPIs are developed based on the input of key measures of “what matters" relative to business goals & growth objectives
Changes are required as performance for a certain metric is below desired thresholds
Metric is not performing as intended; may required changes & assessments
Metric performance is within desired target range
Key Performance Indicator Potential Actions & Conclusions
Hurdle Rate Discounted Payback Period
Net Present Value (NPV)
Internal Rate of Return (IRR) Benefit-to-Cost Economic Margin
Use
Cas
e
When attempting to set a consistent, minimum threshold to compare projects
When attempting to efficiently compare similar investments based on the time it takes to return the initial investment
When comparing projects of similar size on a future cash flow basis
When comparing the profitability of projects of different sizes on a percentage basis
When ranking projects to understand where the “biggest bang for the buck” can be achieved
When comparing projects with isolated benefits & attempting to evaluate incremental impact on firm value
Increasing Level of Sophistication
Analytical Ratios
Key Performance Indicators (KPIs)
© 2015 Deloitte 16
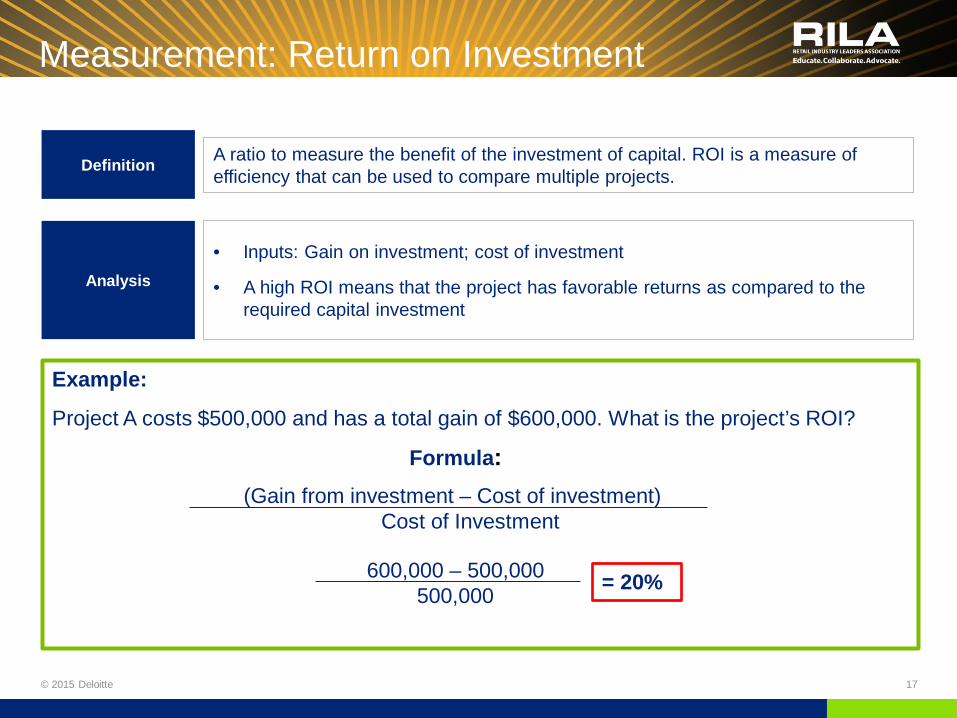
Measurement: Return on Investment
© 2015 Deloitte 17
Definition A ratio to measure the benefit of the investment of capital. ROI is a measure of efficiency that can be used to compare multiple projects.
Analysis
• Inputs: Gain on investment; cost of investment
• A high ROI means that the project has favorable returns as compared to the required capital investment
Example:
Project A costs $500,000 and has a total gain of $600,000. What is the project’s ROI?
(Gain from investment – Cost of investment) Cost of Investment
Formula:
600,000 – 500,000 500,000 = 20%
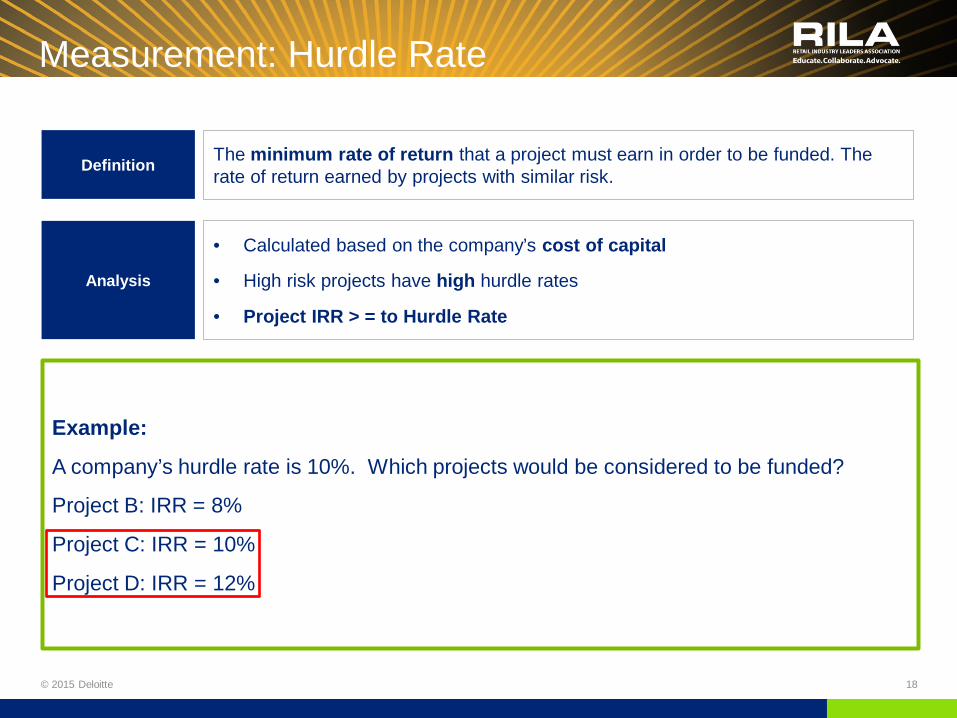
Measurement: Hurdle Rate
© 2015 Deloitte 18
Definition The minimum rate of return that a project must earn in order to be funded. The rate of return earned by projects with similar risk.
Analysis
• Calculated based on the company’s cost of capital
• High risk projects have high hurdle rates
• Project IRR > = to Hurdle Rate
Example:
A company’s hurdle rate is 10%. Which projects would be considered to be funded?
Project B: IRR = 8%
Project C: IRR = 10%
Project D: IRR = 12%
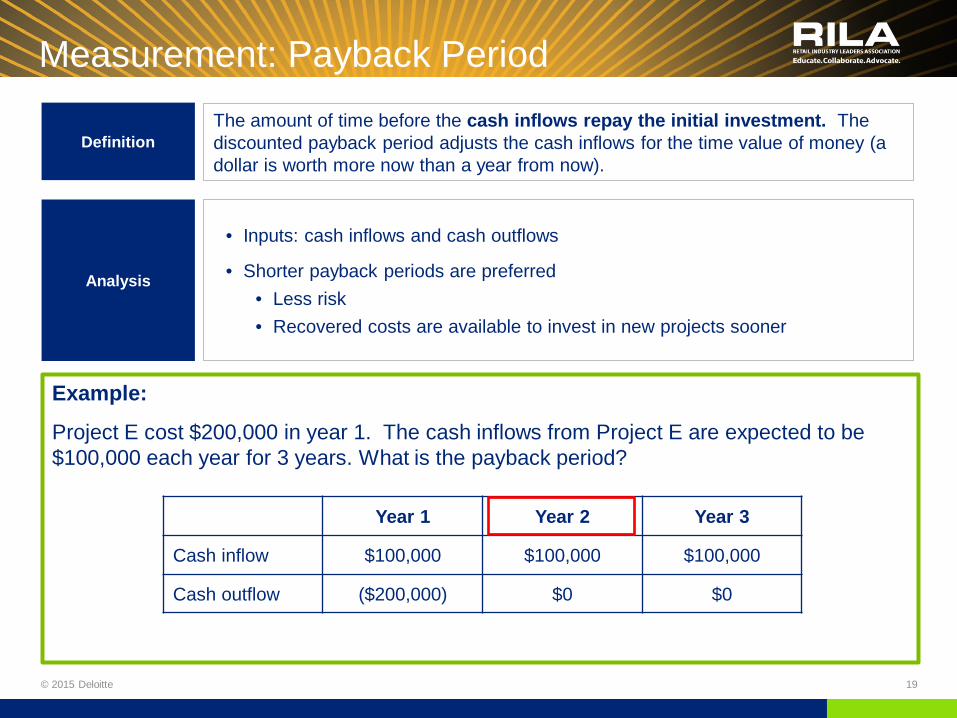
Measurement: Payback Period
© 2015 Deloitte 19
Definition The amount of time before the cash inflows repay the initial investment. The discounted payback period adjusts the cash inflows for the time value of money (a dollar is worth more now than a year from now).
Analysis
• Inputs: cash inflows and cash outflows
• Shorter payback periods are preferred • Less risk • Recovered costs are available to invest in new projects sooner
Example:
Project E cost $200,000 in year 1. The cash inflows from Project E are expected to be $100,000 each year for 3 years. What is the payback period?
Year 1 Year 2 Year 3
Cash inflow $100,000 $100,000 $100,000
Cash outflow ($200,000) $0 $0

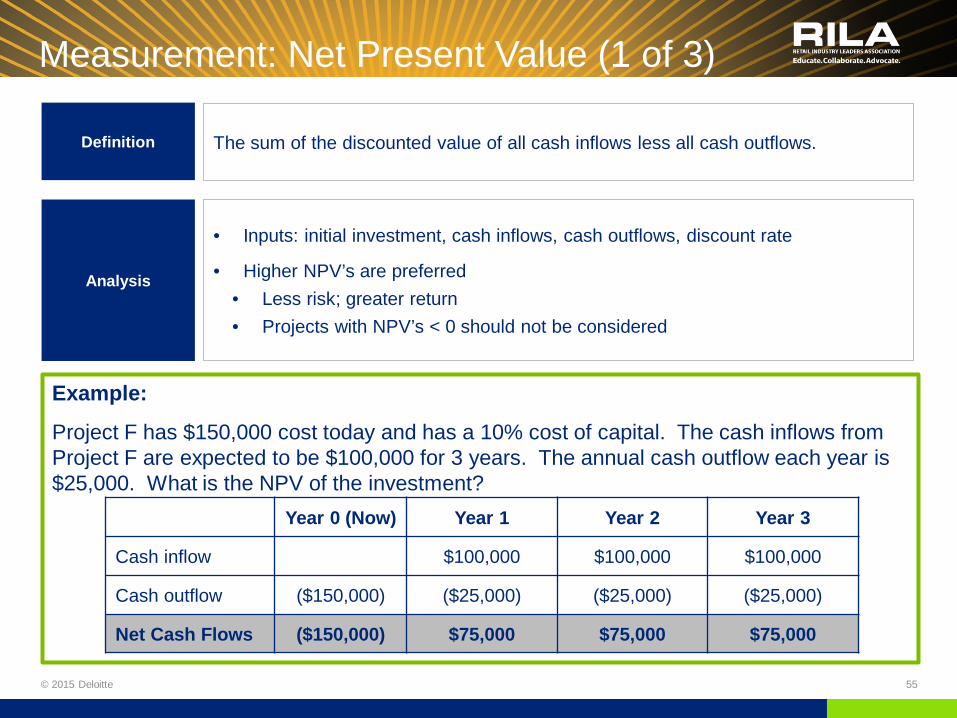
Measurement: Net Present Value (1 of 3)
© 2015 Deloitte 20
Definition The sum of the discounted value of all cash inflows less all cash outflows.
Analysis
• Inputs: initial investment, cash inflows, cash outflows, discount rate
• Higher NPV’s are preferred • Less risk; greater return • Projects with NPV’s < 0 should not be considered
Example:
Project F has $150,000 cost today and has a 10% cost of capital. The cash inflows from Project F are expected to be $100,000 for 3 years. The annual cash outflow each year is $25,000. What is the NPV of the investment?
Year 0 (Now) Year 1 Year 2 Year 3
Cash inflow $100,000 $100,000 $100,000
Cash outflow ($150,000) ($25,000) ($25,000) ($25,000)
Net Cash Flows ($150,000) $75,000 $75,000 $75,000

Measurement: Net Present Value (2 of 3)
© 2015 Deloitte 21
Step 1: Identify Cash Flows
Step 2: Discount Cash Flows
Net Cash Flow $75,000 (1+discount rate)^year (1+.1)^1
Year 0 (Now) Year 1 Year 2 Year 3
Cash inflow $100,000 $100,000 $100,000
Cash outflow ($150,000) ($25,000) ($25,000) ($25,000)
Net Cash Flows ($150,000) $75,000 $75,000 $75,000
Formula: Year 1 Example:
Year 0 (Now) Year 1 Year 2 Year 3
Net Cash Flows ($150,000) $75,000 $75,000 $75,000
Present Value ($150,000) $68,182 $61,983 $56,349
Measurement: Net Present Value (3 of 3)
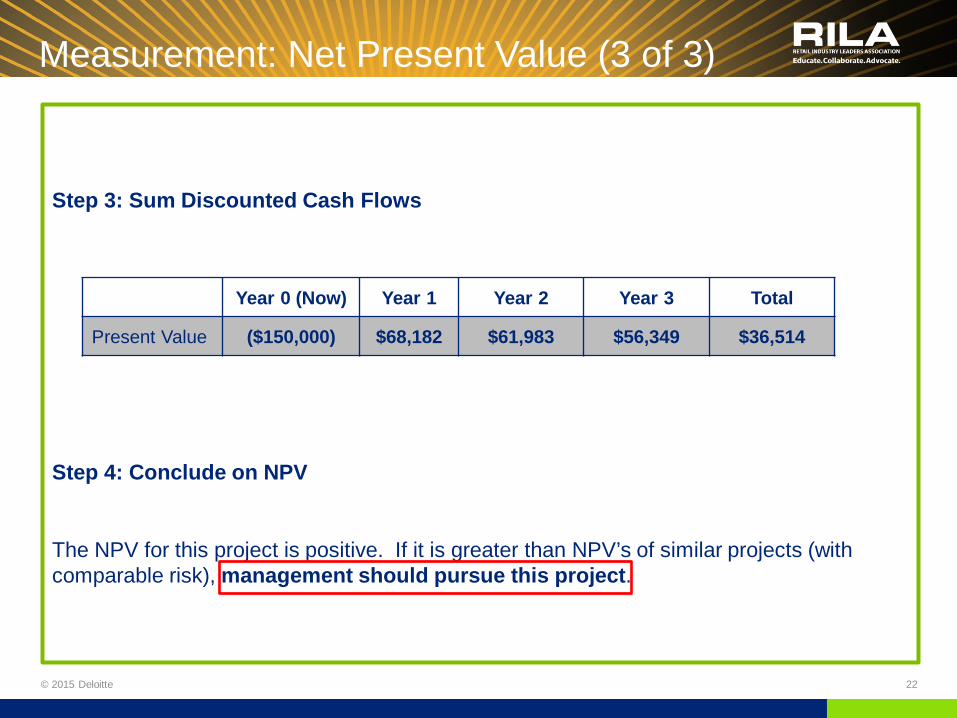
© 2015 Deloitte 22
Step 3: Sum Discounted Cash Flows
Step 4: Conclude on NPV
The NPV for this project is positive. If it is greater than NPV’s of similar projects (with comparable risk), management should pursue this project.
Year 0 (Now) Year 1 Year 2 Year 3 Total
Present Value ($150,000) $68,182 $61,983 $56,349 $36,514

Measurement: Internal Rate of Return (IRR)
© 2015 Deloitte 23
Definition The discount rate at which the NPV equals zero.
Analysis • Iterative process of inputting interest rates
• Measure to compare projects of different sizes
Example:
Project G costs $150,000 now and has a 10% hurdle rate. The cash inflows from Project G are expected to be $100,000 for 3 years. The annual cash outflow each year is $25,000. What is the IRR of the investment?
Year 0 (Now) Year 1 Year 2 Year 3
Cash inflow $100,000 $100,000 $100,000
Cash outflow ($150,000) ($25,000) ($25,000) ($25,000)
Net Cash Flows ($150,000) $75,000 $75,000 $75,000

Measurement: IRR (2 of 2)
© 2015 Deloitte 24
Calculate NPV with different discount rates until you obtain a value of zero:
The IRR falls between 23% and 24%. Further iteration results in an IRR of approximately 23.4%. The IRR is greater than the hurdle rate of 10%.
This value can be compared to other projects of difference sizes to gauge relative returns. If it is greater than IRR’s of similar projects (with comparable risk), management should pursue this project.
Discount Rate NPV
20% $7,986
23% $853
24% ($1,402)
25% ($3,600)
30% ($13,792)

© 2015 Deloitte 25
Case Study 1

Framing the Conversation: Types of Analyses
© 2015 Deloitte 26
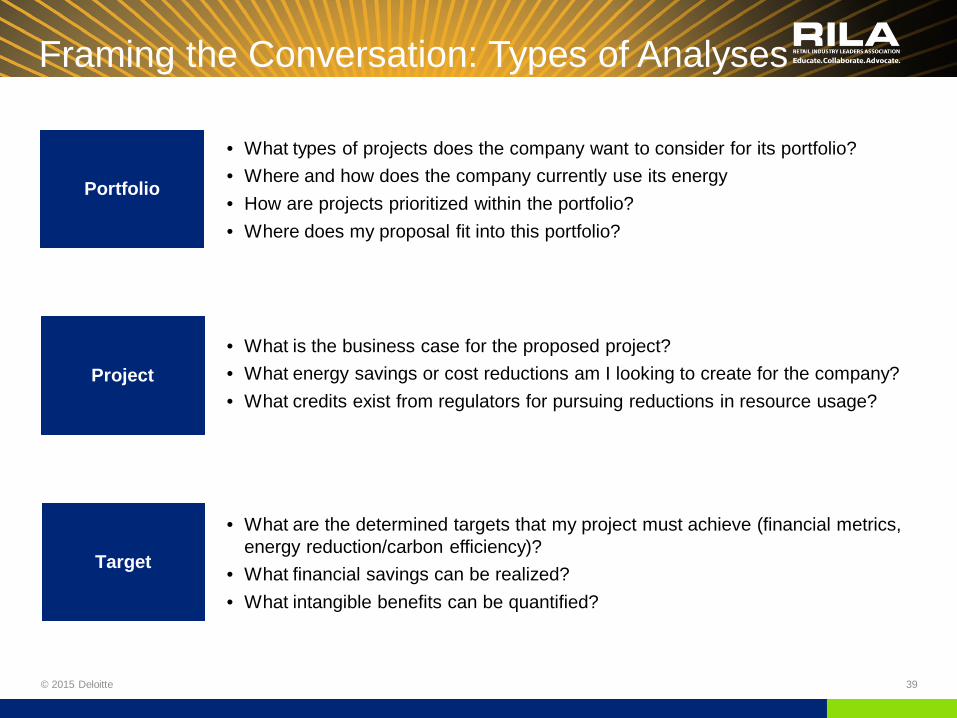
• What types of projects does the company want to consider for its portfolio? • Where and how does the company currently use its energy • How are projects prioritized within the portfolio? • Where does my proposal fit into this portfolio?
Portfolio
Project
Target
• What is the business case for the proposed project? • What energy savings or cost reductions am I looking to create for the company? • What credits exist from regulators for pursuing reductions in resource usage?
• What are the determined targets that my project must achieve (financial metrics, energy reduction/carbon efficiency)?
• What financial savings can be realized? • What intangible benefits can be quantified?
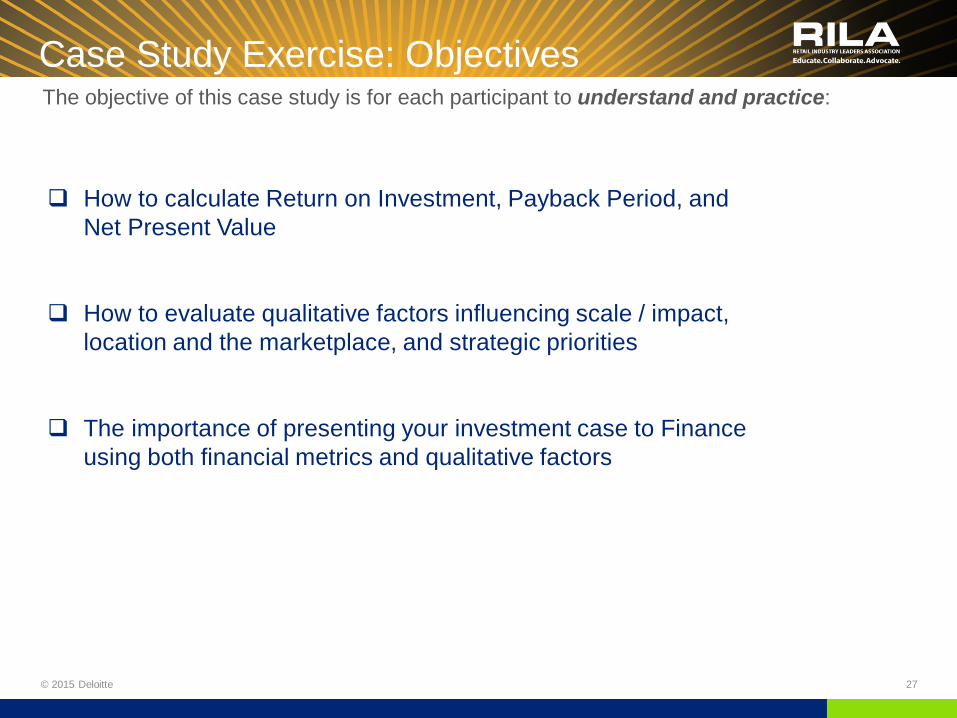
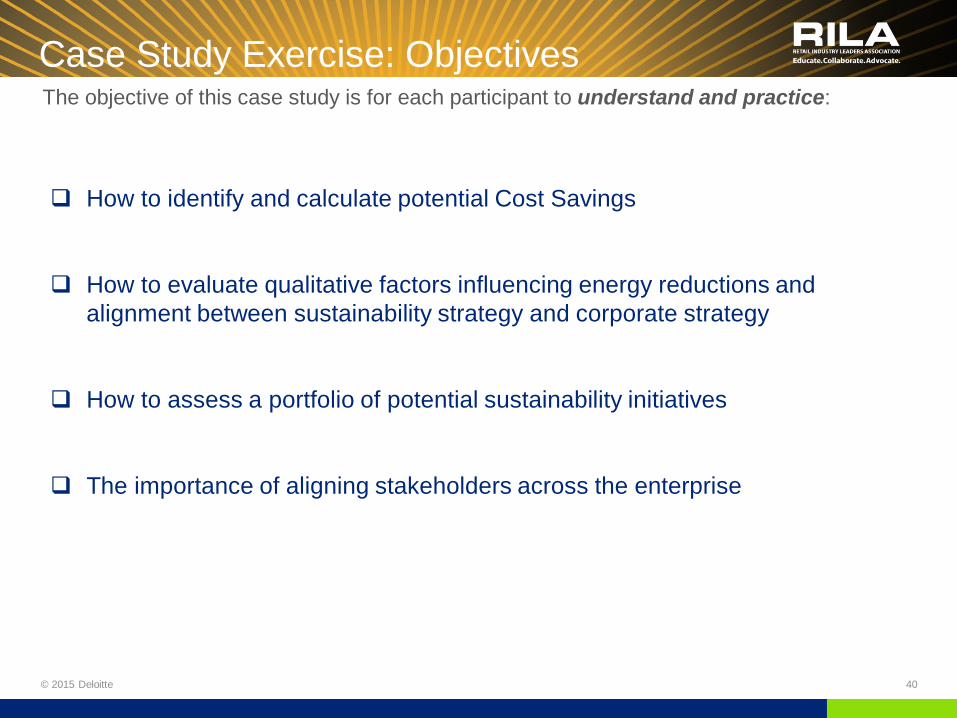
Case Study Exercise: Objectives
© 2015 Deloitte 27
How to calculate Return on Investment, Payback Period, and
Net Present Value
How to evaluate qualitative factors influencing scale / impact, location and the marketplace, and strategic priorities
The importance of presenting your investment case to Finance using both financial metrics and qualitative factors
The objective of this case study is for each participant to understand and practice:
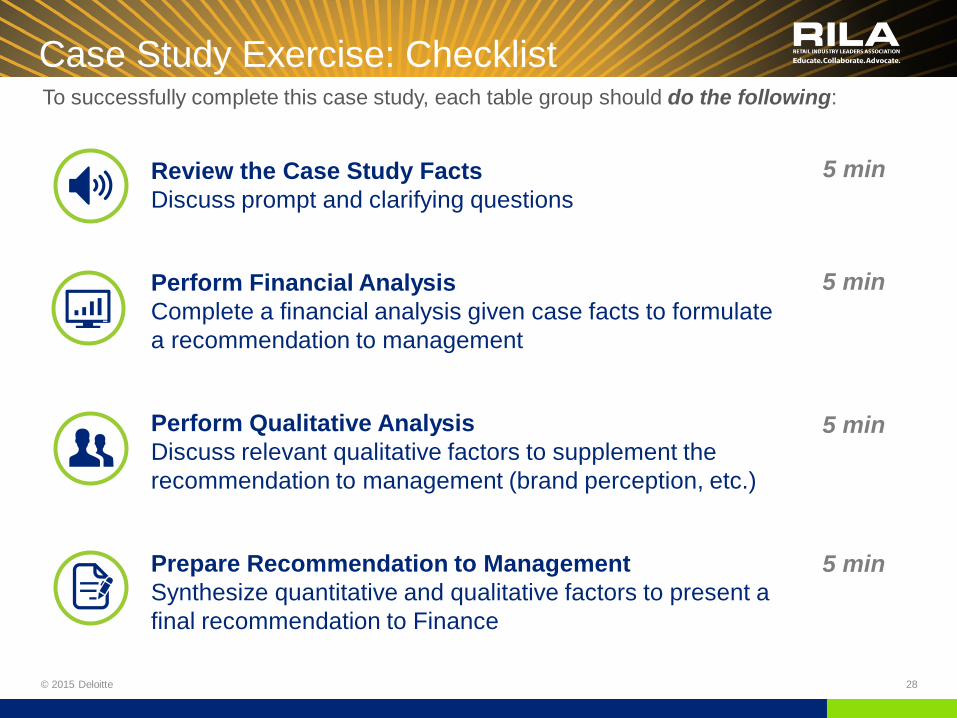
Case Study Exercise: Checklist
© 2015 Deloitte 28
5 min
Review the Case Study Facts Discuss prompt and clarifying questions Perform Financial Analysis Complete a financial analysis given case facts to formulate a recommendation to management Perform Qualitative Analysis Discuss relevant qualitative factors to supplement the recommendation to management (brand perception, etc.) Prepare Recommendation to Management Synthesize quantitative and qualitative factors to present a final recommendation to Finance
5 min
5 min
5 min
To successfully complete this case study, each table group should do the following:
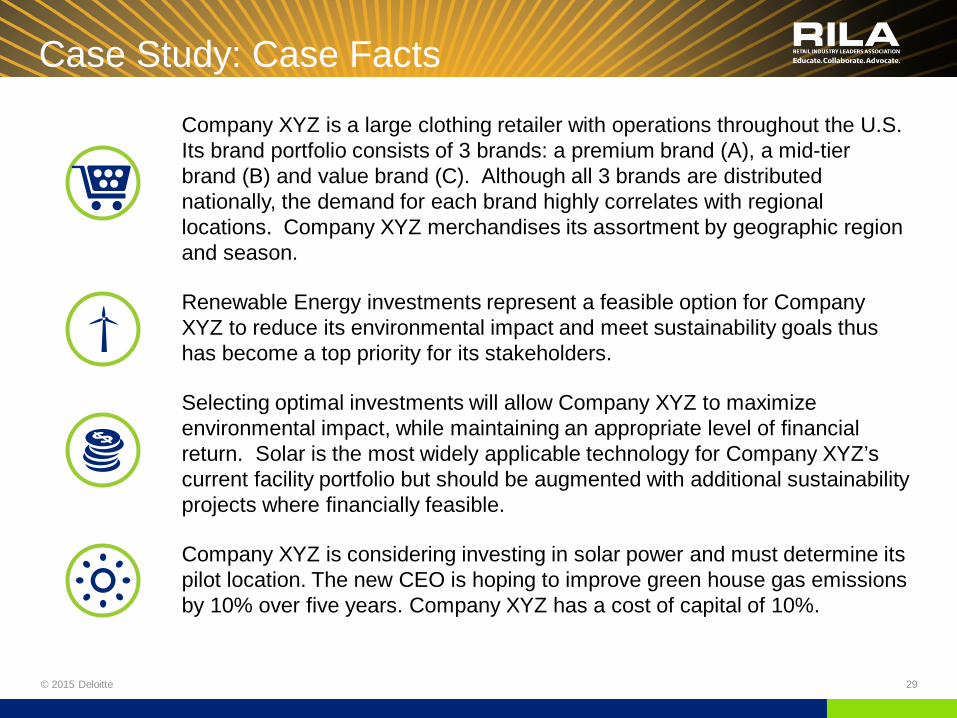
Case Study: Case Facts
© 2015 Deloitte 29
Company XYZ is a large clothing retailer with operations throughout the U.S. Its brand portfolio consists of 3 brands: a premium brand (A), a mid-tier brand (B) and value brand (C). Although all 3 brands are distributed nationally, the demand for each brand highly correlates with regional locations. Company XYZ merchandises its assortment by geographic region and season.
Renewable Energy investments represent a feasible option for Company XYZ to reduce its environmental impact and meet sustainability goals thus has become a top priority for its stakeholders.
Selecting optimal investments will allow Company XYZ to maximize environmental impact, while maintaining an appropriate level of financial return. Solar is the most widely applicable technology for Company XYZ’s current facility portfolio but should be augmented with additional sustainability projects where financially feasible.
Company XYZ is considering investing in solar power and must determine its pilot location. The new CEO is hoping to improve green house gas emissions by 10% over five years. Company XYZ has a cost of capital of 10%.
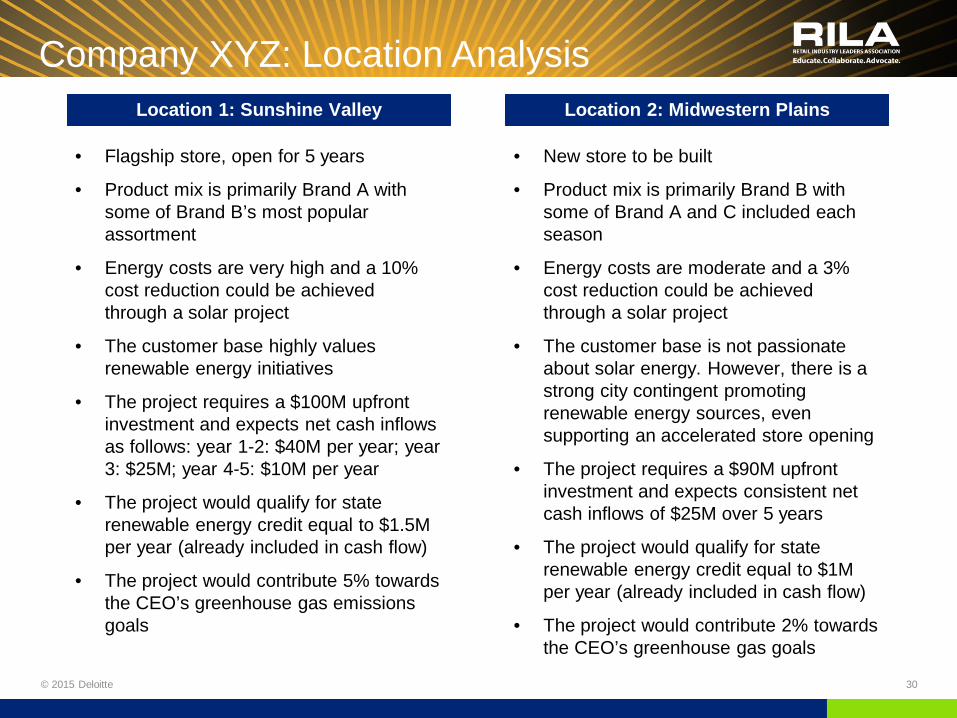
Company XYZ: Location Analysis
© 2015 Deloitte 30
• Flagship store, open for 5 years
• Product mix is primarily Brand A with some of Brand B’s most popular assortment
• Energy costs are very high and a 10% cost reduction could be achieved through a solar project
• The customer base highly values renewable energy initiatives
• The project requires a $100M upfront investment and expects net cash inflows as follows: year 1-2: $40M per year; year 3: $25M; year 4-5: $10M per year
• The project would qualify for state renewable energy credit equal to $1.5M per year (already included in cash flow)
• The project would contribute 5% towards the CEO’s greenhouse gas emissions goals
Location 1: Sunshine Valley Location 2: Midwestern Plains
• New store to be built
• Product mix is primarily Brand B with some of Brand A and C included each season
• Energy costs are moderate and a 3% cost reduction could be achieved through a solar project
• The customer base is not passionate about solar energy. However, there is a strong city contingent promoting renewable energy sources, even supporting an accelerated store opening
• The project requires a $90M upfront investment and expects consistent net cash inflows of $25M over 5 years
• The project would qualify for state renewable energy credit equal to $1M per year (already included in cash flow)
• The project would contribute 2% towards the CEO’s greenhouse gas goals
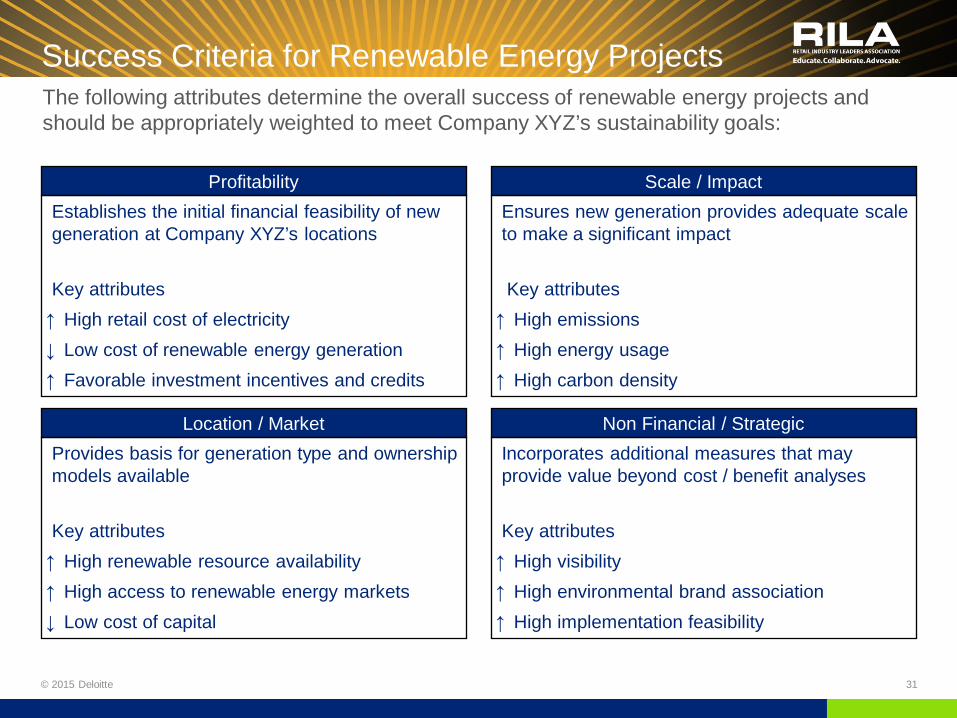
Success Criteria for Renewable Energy Projects
© 2015 Deloitte 31
The following attributes determine the overall success of renewable energy projects and should be appropriately weighted to meet Company XYZ’s sustainability goals:
Profitability Establishes the initial financial feasibility of new generation at Company XYZ’s locations Key attributes ↑ High retail cost of electricity ↓ Low cost of renewable energy generation ↑ Favorable investment incentives and credits
Scale / Impact Ensures new generation provides adequate scale to make a significant impact Key attributes ↑ High emissions ↑ High energy usage ↑ High carbon density
Location / Market Provides basis for generation type and ownership models available Key attributes ↑ High renewable resource availability ↑ High access to renewable energy markets ↓ Low cost of capital
Non Financial / Strategic Incorporates additional measures that may provide value beyond cost / benefit analyses Key attributes ↑ High visibility ↑ High environmental brand association ↑ High implementation feasibility
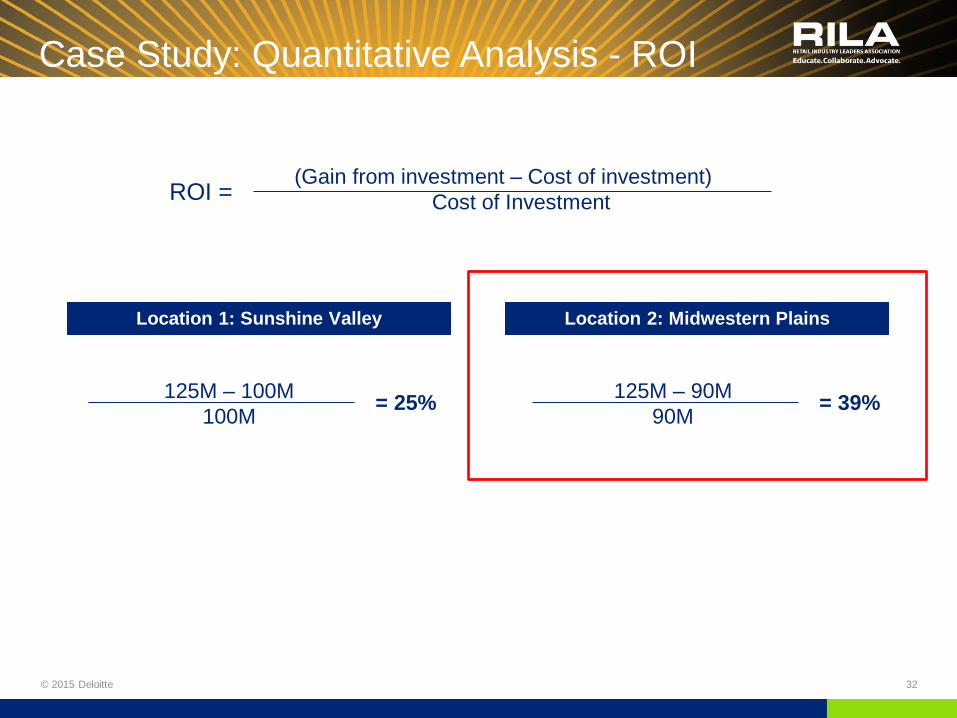
Case Study: Quantitative Analysis - ROI
© 2015 Deloitte 32
Location 1: Sunshine Valley Location 2: Midwestern Plains
(Gain from investment – Cost of investment) Cost of Investment ROI =
125M – 90M 90M = 39% 125M – 100M
100M = 25%
Case Study: Quantitative Analysis – Payback
© 2015 Deloitte 33
Location 1: Sunshine Valley Location 2: Midwestern Plains
Outflow Inflow
Investment ($100M)
Year 1 $40M
Year 2 $40M
Year 3 $25M
Year 4 $10M
Year 5 $10M
Outflow Inflow
Investment ($90M)
Year 1 $25M
Year 2 $25M
Year 3 $25M
Year 4 $25M
Year 5 $25M
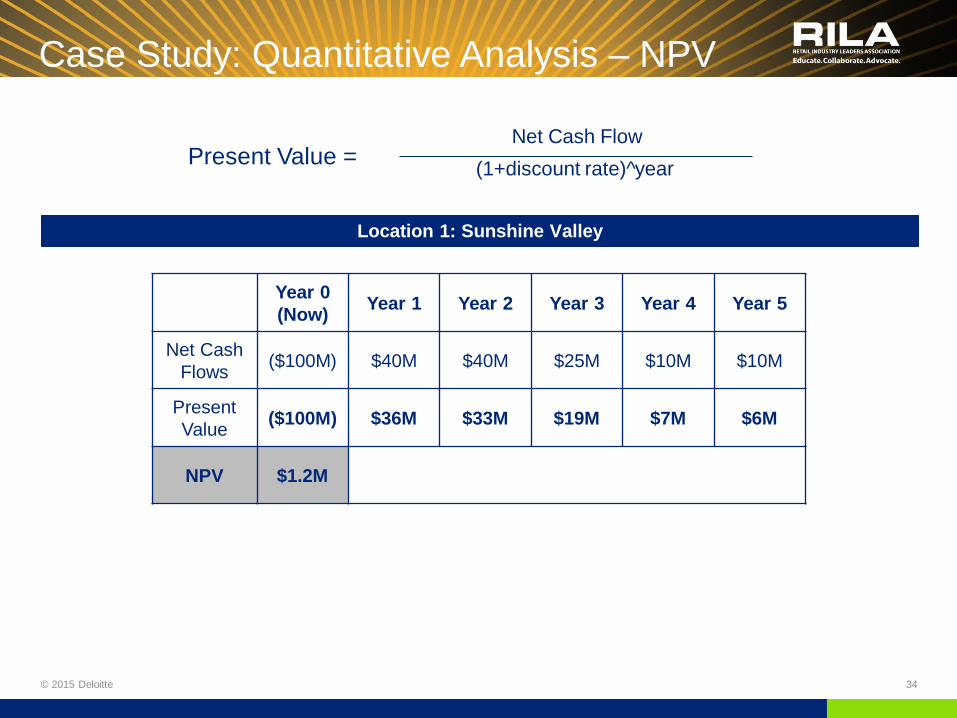
Case Study: Quantitative Analysis – NPV
© 2015 Deloitte 34
Location 1: Sunshine Valley
Net Cash Flow (1+discount rate)^year Present Value =
Year 0 (Now) Year 1 Year 2 Year 3 Year 4 Year 5
Net Cash Flows ($100M) $40M $40M $25M $10M $10M
Present Value ($100M) $36M $33M $19M $7M $6M
NPV $1.2M

Case Study: Quantitative Analysis – NPV
© 2015 Deloitte 35
Location 2: Midwestern Plains
Net Cash Flow (1+discount rate)^year Present Value =
Year 0 (Now) Year 1 Year 2 Year 3 Year 4 Year 5
Net Cash Flows ($90M) $25M $25M $25M $25M $25M
Present Value ($90M) $23M $21M $19M $17M $16M
NPV $4.8M
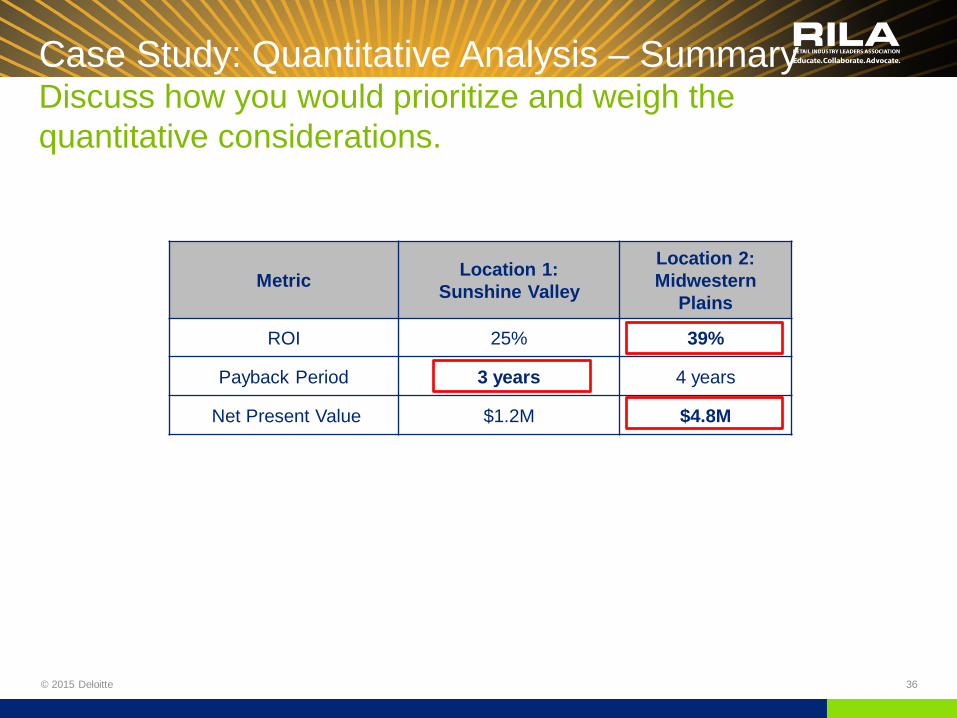
Case Study: Quantitative Analysis – Summary Discuss how you would prioritize and weigh the quantitative considerations.
© 2015 Deloitte 36
Metric Location 1: Sunshine Valley
Location 2: Midwestern
Plains
ROI 25% 39%
Payback Period 3 years 4 years
Net Present Value $1.2M $4.8M
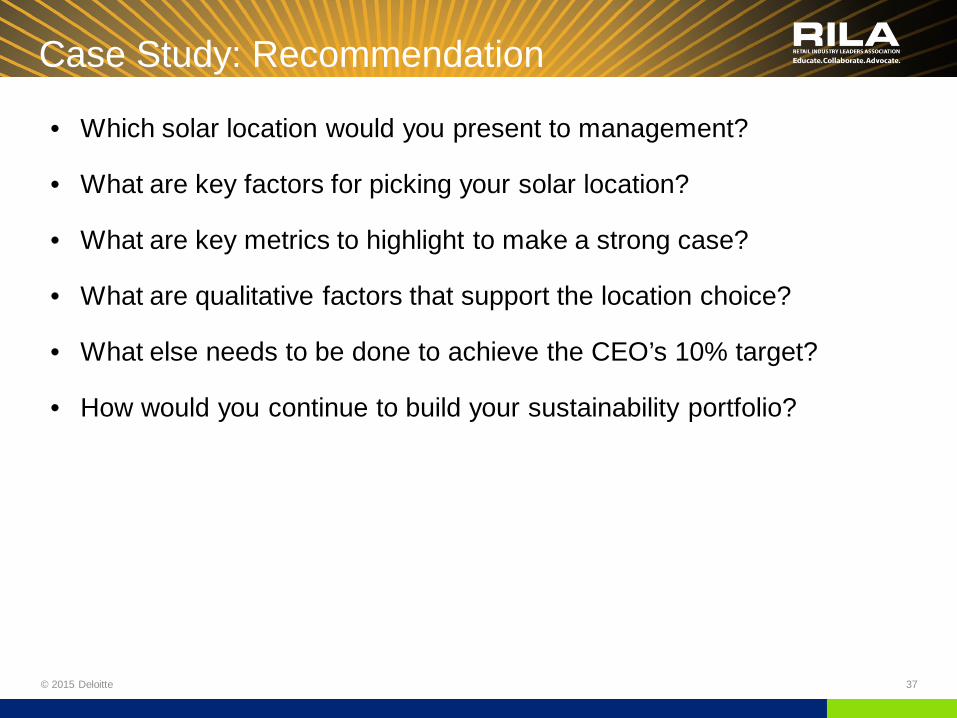
Case Study: Recommendation
© 2015 Deloitte 37
• Which solar location would you present to management?
• What are key factors for picking your solar location?
• What are key metrics to highlight to make a strong case?
• What are qualitative factors that support the location choice?
• What else needs to be done to achieve the CEO’s 10% target?
• How would you continue to build your sustainability portfolio?

© 2015 Deloitte 38
Case Study 2
Framing the Conversation: Types of Analyses
© 2015 Deloitte 39
• What types of projects does the company want to consider for its portfolio? • Where and how does the company currently use its energy • How are projects prioritized within the portfolio? • Where does my proposal fit into this portfolio?
Portfolio
Project
Target
• What is the business case for the proposed project? • What energy savings or cost reductions am I looking to create for the company? • What credits exist from regulators for pursuing reductions in resource usage?
• What are the determined targets that my project must achieve (financial metrics, energy reduction/carbon efficiency)?
• What financial savings can be realized? • What intangible benefits can be quantified?
Case Study Exercise: Objectives
© 2015 Deloitte 40
How to identify and calculate potential Cost Savings
How to evaluate qualitative factors influencing energy reductions and alignment between sustainability strategy and corporate strategy
How to assess a portfolio of potential sustainability initiatives
The importance of aligning stakeholders across the enterprise
The objective of this case study is for each participant to understand and practice:

Case Study Exercise: Checklist
© 2015 Deloitte 41
5 min
Review the Case Study Facts Discuss prompt and clarifying questions Perform Financial Analysis Complete a financial analysis given case facts to formulate a recommendation to management Perform Qualitative Analysis Discuss relevant qualitative factors to supplement the recommendation to management (brand perception, etc.) Prepare Recommendation to Management Synthesize quantitative and qualitative factors to present a final recommendation to Finance
5 min
5 min
5 min
To successfully complete this case study, each table group should do the following:
Case Study: Case Facts
© 2015 Deloitte 42
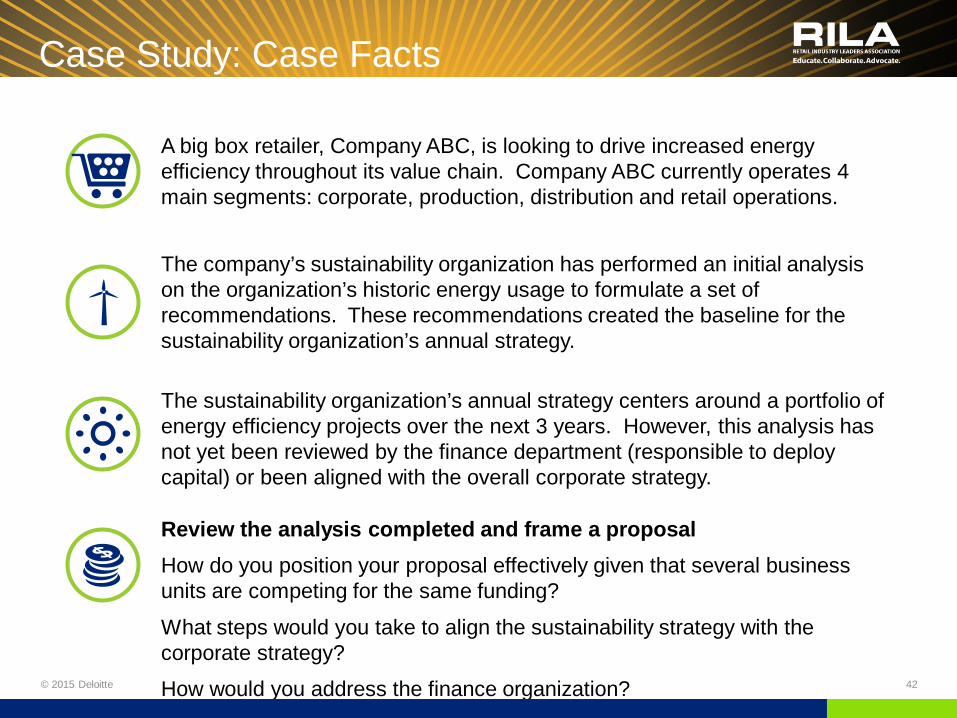
A big box retailer, Company ABC, is looking to drive increased energy efficiency throughout its value chain. Company ABC currently operates 4 main segments: corporate, production, distribution and retail operations.
The sustainability organization’s annual strategy centers around a portfolio of energy efficiency projects over the next 3 years. However, this analysis has not yet been reviewed by the finance department (responsible to deploy capital) or been aligned with the overall corporate strategy.
Review the analysis completed and frame a proposal How do you position your proposal effectively given that several business units are competing for the same funding?
What steps would you take to align the sustainability strategy with the corporate strategy?
How would you address the finance organization?
The company’s sustainability organization has performed an initial analysis on the organization’s historic energy usage to formulate a set of recommendations. These recommendations created the baseline for the sustainability organization’s annual strategy.
Company ABC: Energy Expenditure Analysis
43
$100.0
$80.0
$60.0
$40.0
$0
$20
$40
$60
$80
$100
$120
Retail Production Distribution Center Corporate
$ M
illio
ns
2014 Total Energy Expenditures by Division
40
15
5 Facilities
Transportation
Other
2014 Distribution Expenditures by Type
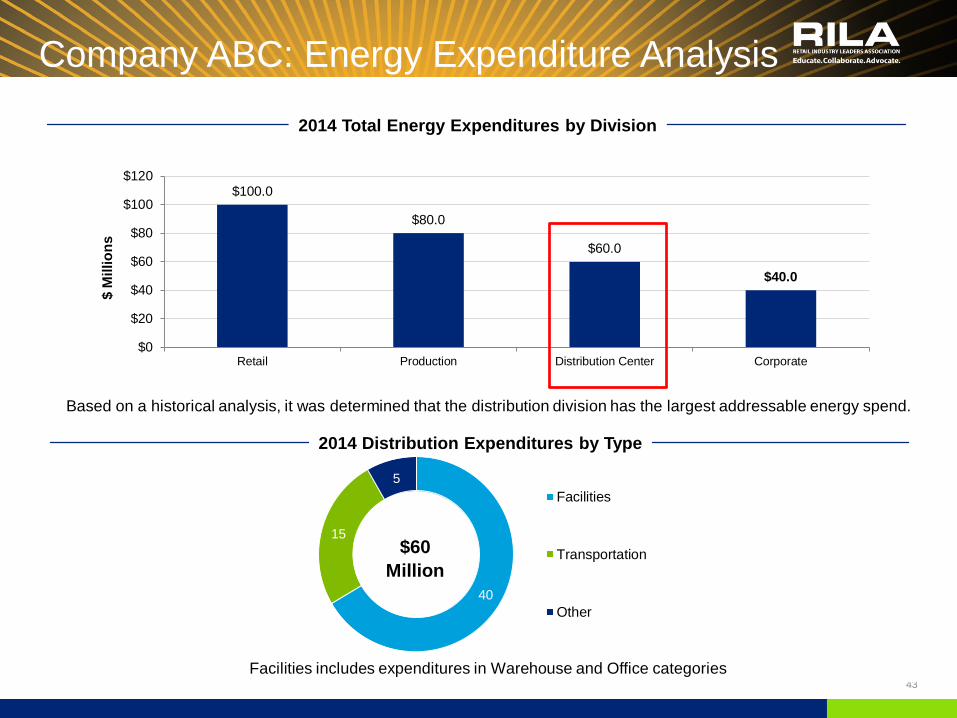
Based on a historical analysis, it was determined that the distribution division has the largest addressable energy spend.
$60 Million
Facilities includes expenditures in Warehouse and Office categories
© 2015 Deloitte 44
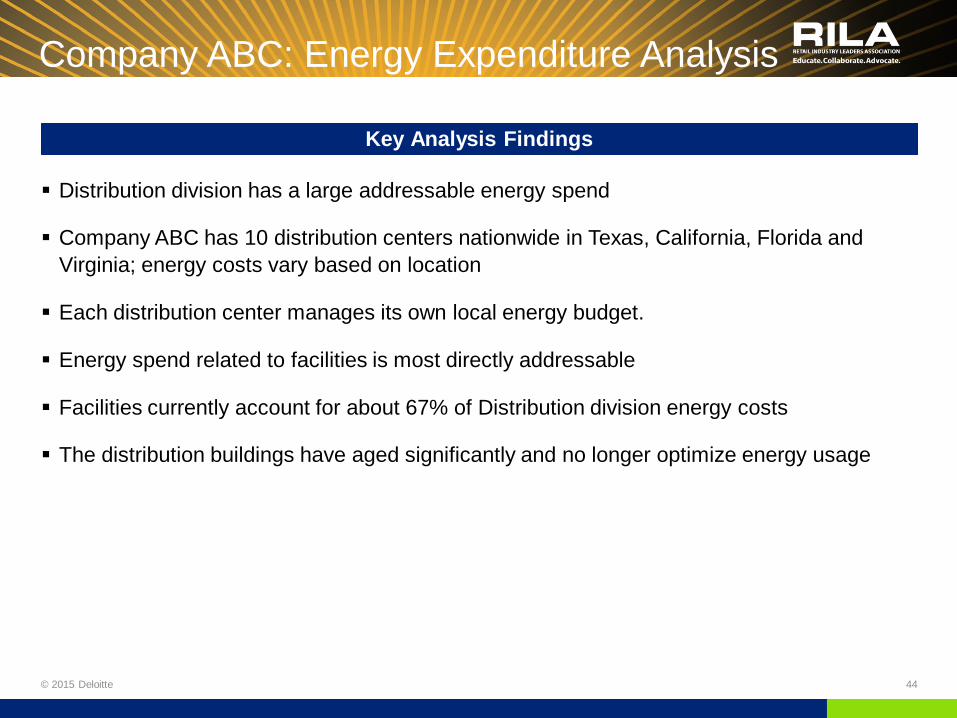
Distribution division has a large addressable energy spend
Company ABC has 10 distribution centers nationwide in Texas, California, Florida and Virginia; energy costs vary based on location
Each distribution center manages its own local energy budget.
Energy spend related to facilities is most directly addressable
Facilities currently account for about 67% of Distribution division energy costs
The distribution buildings have aged significantly and no longer optimize energy usage
Key Analysis Findings
Company ABC: Energy Expenditure Analysis
Energy Efficiency Portfolio
© 2015 Deloitte 45
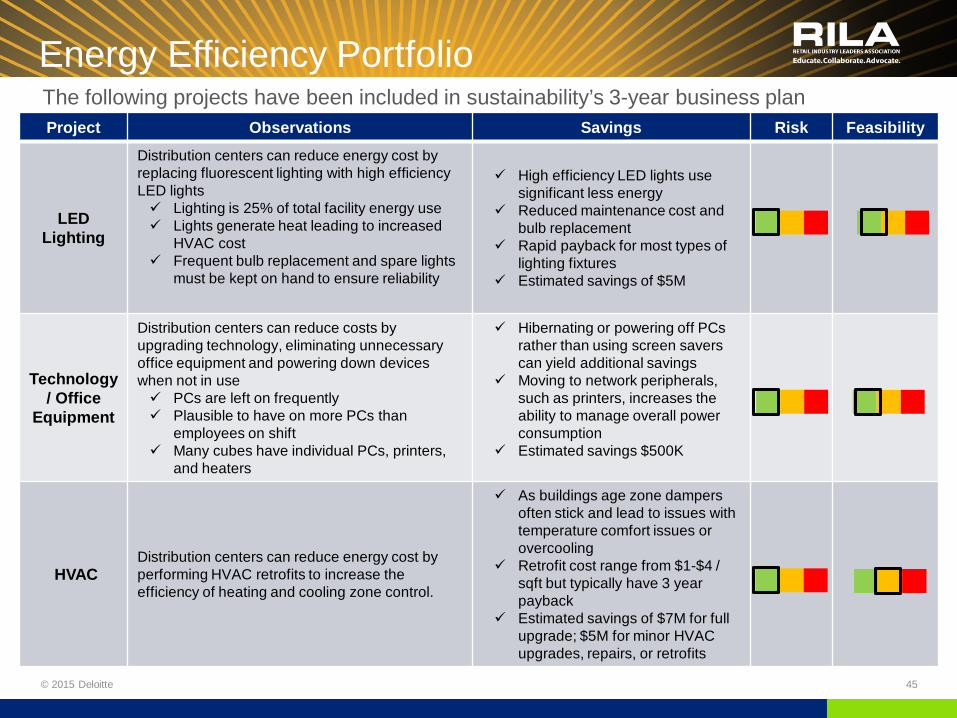
The following projects have been included in sustainability’s 3-year business plan Project Observations Savings Risk Feasibility
LED Lighting
Distribution centers can reduce energy cost by replacing fluorescent lighting with high efficiency LED lights Lighting is 25% of total facility energy use Lights generate heat leading to increased
HVAC cost Frequent bulb replacement and spare lights
must be kept on hand to ensure reliability
High efficiency LED lights use significant less energy
Reduced maintenance cost and bulb replacement
Rapid payback for most types of lighting fixtures
Estimated savings of $5M
Technology/ Office
Equipment
Distribution centers can reduce costs by upgrading technology, eliminating unnecessary office equipment and powering down devices when not in use PCs are left on frequently Plausible to have on more PCs than
employees on shift Many cubes have individual PCs, printers,
and heaters
Hibernating or powering off PCs rather than using screen savers can yield additional savings
Moving to network peripherals, such as printers, increases the ability to manage overall power consumption
Estimated savings $500K
HVAC Distribution centers can reduce energy cost by performing HVAC retrofits to increase the efficiency of heating and cooling zone control.
As buildings age zone dampers often stick and lead to issues with temperature comfort issues or overcooling
Retrofit cost range from $1-$4 / sqft but typically have 3 year payback
Estimated savings of $7M for full upgrade; $5M for minor HVAC upgrades, repairs, or retrofits
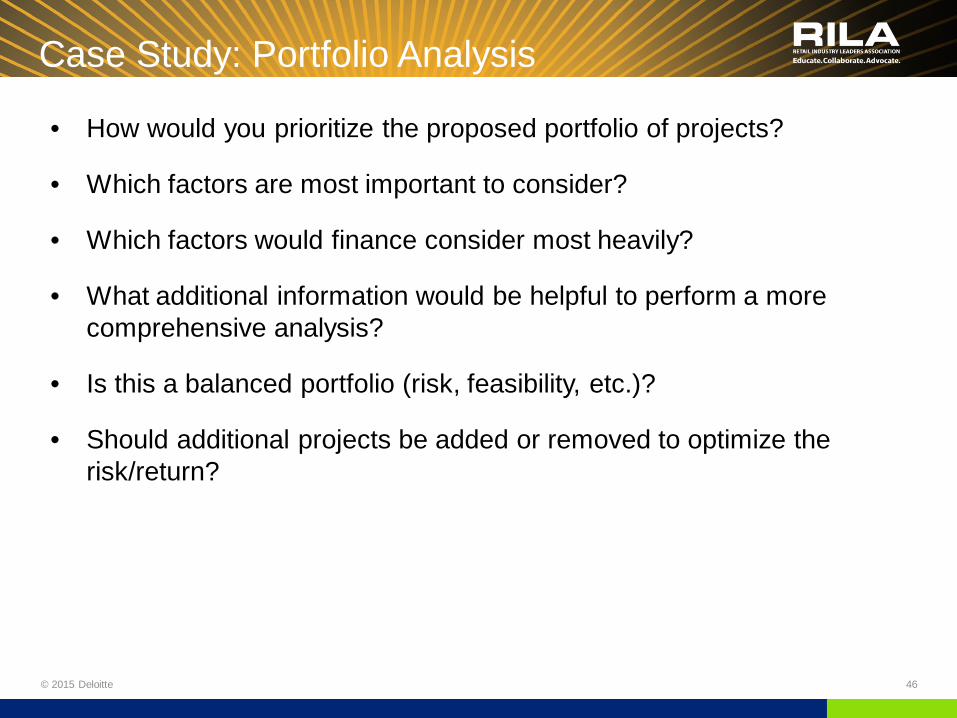
Case Study: Portfolio Analysis
© 2015 Deloitte 46
• How would you prioritize the proposed portfolio of projects?
• Which factors are most important to consider?
• Which factors would finance consider most heavily?
• What additional information would be helpful to perform a more comprehensive analysis?
• Is this a balanced portfolio (risk, feasibility, etc.)?
• Should additional projects be added or removed to optimize the risk/return?

© 2015 Deloitte 47
Your Examples Applying Finance Concepts to Your Real World Examples
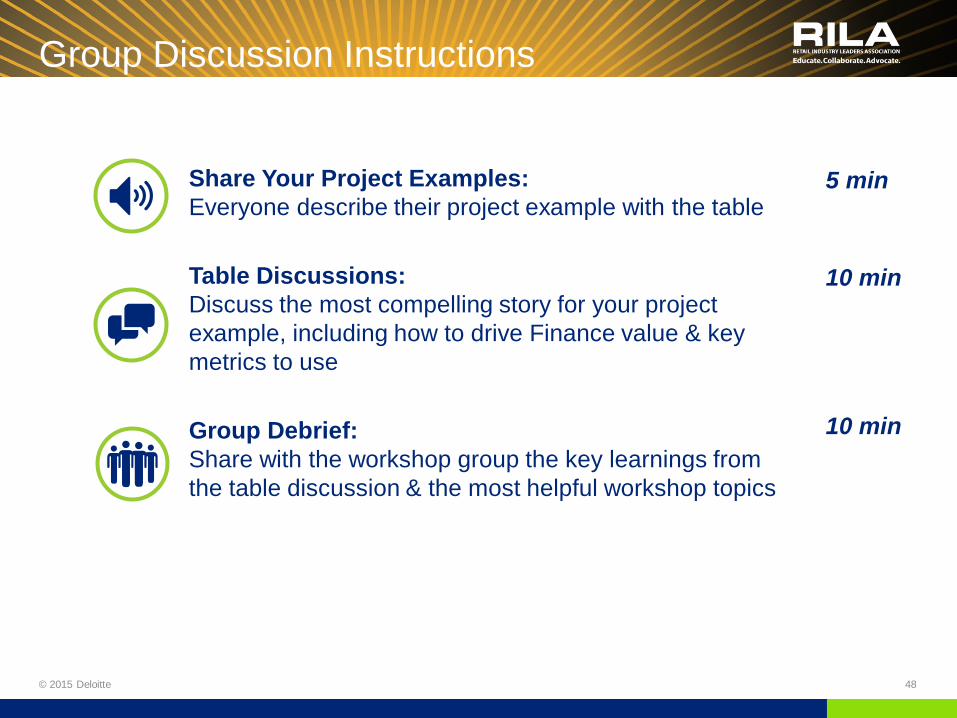
Group Discussion Instructions
48 © 2015 Deloitte
5 min
10 min
10 min
Share Your Project Examples: Everyone describe their project example with the table
Table Discussions: Discuss the most compelling story for your project example, including how to drive Finance value & key metrics to use
Group Debrief: Share with the workshop group the key learnings from the table discussion & the most helpful workshop topics

© 2015 Deloitte 49
Wrap Up and Q&A

© 2015 Deloitte 50
Appendix
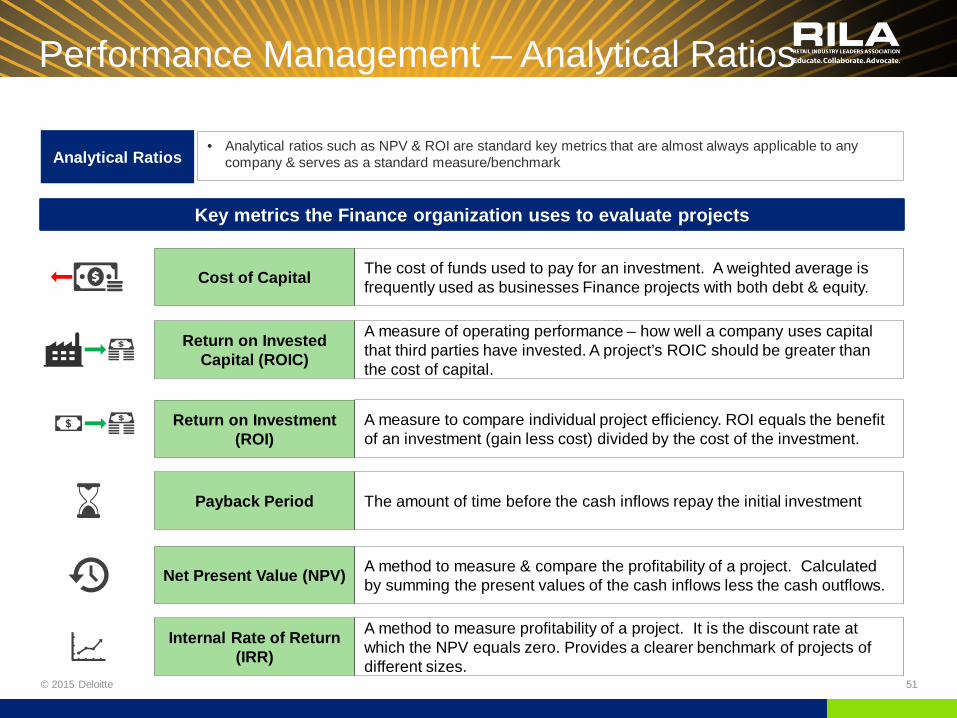
• Analytical ratios such as NPV & ROI are standard key metrics that are almost always applicable to any company & serves as a standard measure/benchmark
Key metrics the Finance organization uses to evaluate projects
Return on Invested Capital (ROIC)
Return on Investment (ROI)
Net Present Value (NPV)
Internal Rate of Return (IRR)
Cost of Capital
A method to measure & compare the profitability of a project. Calculated by summing the present values of the cash inflows less the cash outflows.
A method to measure profitability of a project. It is the discount rate at which the NPV equals zero. Provides a clearer benchmark of projects of different sizes.
The cost of funds used to pay for an investment. A weighted average is frequently used as businesses Finance projects with both debt & equity.
A measure of operating performance – how well a company uses capital that third parties have invested. A project’s ROIC should be greater than the cost of capital.
A measure to compare individual project efficiency. ROI equals the benefit of an investment (gain less cost) divided by the cost of the investment.
Analytical Ratios
Performance Management – Analytical Ratios
© 2015 Deloitte 51
Payback Period The amount of time before the cash inflows repay the initial investment

Measurement: Return on Investment
© 2015 Deloitte 52
Definition A ratio to measure the benefit of the investment of capital. ROI is a measure of efficiency that can be used to compare multiple projects.
Analysis
• Inputs: Gain on investment; cost of investment
• A high ROI means that the project has favorable returns as compared to the required capital investment
Example:
Project A costs $500,000 and has a total gain of $600,000. What is the project’s ROI?
(Gain from investment – Cost of investment) Cost of Investment
Formula:
600,000 – 500,000 500,000 = 20%

Measurement: Hurdle Rate
© 2015 Deloitte 53
Definition The minimum rate of return that a project must earn in order to be funded. The rate of return earned by projects with similar risk.
Analysis
• Calculated based on the company’s cost of capital
• High risk projects have high hurdle rates
• Project IRR > = to Hurdle Rate
Example:
A company’s hurdle rate is 10%. Which projects would be considered to be funded?
Project B: IRR = 8%
Project C: IRR = 10%
Project D: IRR = 12%

Measurement: Payback Period
© 2015 Deloitte 54
Definition The amount of time before the cash inflows repay the initial investment. The discounted payback period adjusts the cash inflows for the time value of money (a dollar is worth more now than a year from now).
Analysis
• Inputs: cash inflows and cash outflows
• Shorter payback periods are preferred • Less risk • Recovered costs are available to invest in new projects sooner
Example:
Project E cost $200,000 in year 1. The cash inflows from Project E are expected to be $100,000 each year for 3 years. What is the payback period?
Year 1 Year 2 Year 3
Cash inflow $100,000 $100,000 $100,000
Cash outflow ($200,000) $0 $0
Measurement: Net Present Value (1 of 3)
© 2015 Deloitte 55
Definition The sum of the discounted value of all cash inflows less all cash outflows.
Analysis
• Inputs: initial investment, cash inflows, cash outflows, discount rate
• Higher NPV’s are preferred • Less risk; greater return • Projects with NPV’s < 0 should not be considered
Example:
Project F has $150,000 cost today and has a 10% cost of capital. The cash inflows from Project F are expected to be $100,000 for 3 years. The annual cash outflow each year is $25,000. What is the NPV of the investment?
Year 0 (Now) Year 1 Year 2 Year 3
Cash inflow $100,000 $100,000 $100,000
Cash outflow ($150,000) ($25,000) ($25,000) ($25,000)
Net Cash Flows ($150,000) $75,000 $75,000 $75,000
Measurement: Net Present Value (2 of 3)
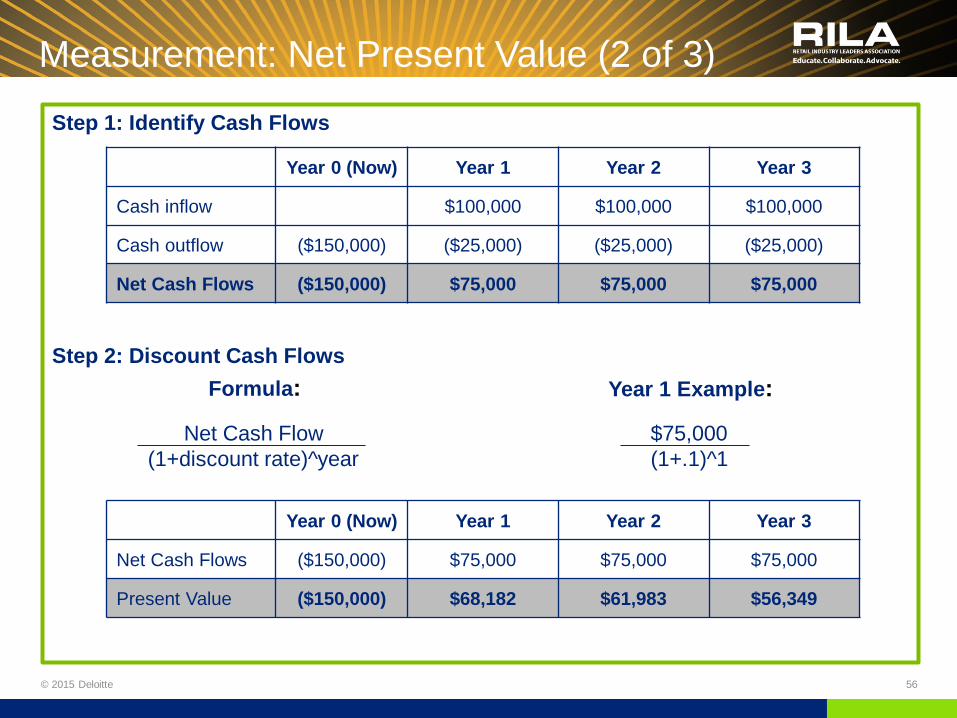
© 2015 Deloitte 56
Step 1: Identify Cash Flows
Step 2: Discount Cash Flows
Net Cash Flow $75,000 (1+discount rate)^year (1+.1)^1
Year 0 (Now) Year 1 Year 2 Year 3
Cash inflow $100,000 $100,000 $100,000
Cash outflow ($150,000) ($25,000) ($25,000) ($25,000)
Net Cash Flows ($150,000) $75,000 $75,000 $75,000
Formula: Year 1 Example:
Year 0 (Now) Year 1 Year 2 Year 3
Net Cash Flows ($150,000) $75,000 $75,000 $75,000
Present Value ($150,000) $68,182 $61,983 $56,349

Measurement: Net Present Value (3 of 3)
© 2015 Deloitte 57
Step 3: Sum Discounted Cash Flows
Step 4: Conclude on NPV
The NPV for this project is positive. If it is greater than NPV’s of similar projects (with comparable risk), management should pursue this project.
Year 0 (Now) Year 1 Year 2 Year 3 Total
Present Value ($150,000) $68,182 $61,983 $56,349 $36,514
Measurement: Internal Rate of Return (IRR)
© 2015 Deloitte 58
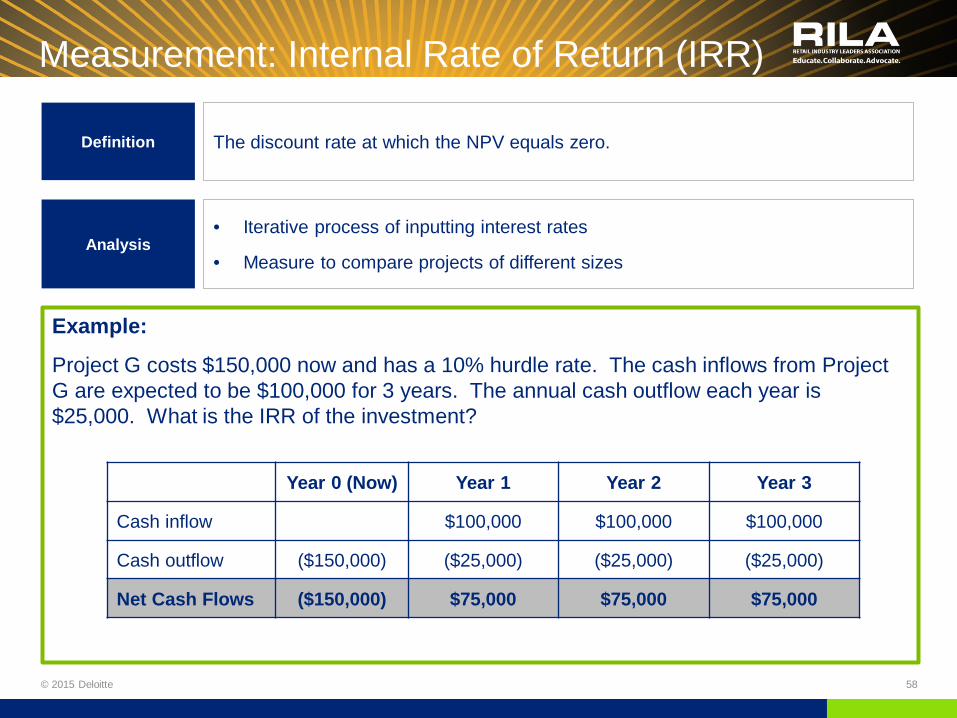
Definition The discount rate at which the NPV equals zero.
Analysis • Iterative process of inputting interest rates
• Measure to compare projects of different sizes
Example:
Project G costs $150,000 now and has a 10% hurdle rate. The cash inflows from Project G are expected to be $100,000 for 3 years. The annual cash outflow each year is $25,000. What is the IRR of the investment?
Year 0 (Now) Year 1 Year 2 Year 3
Cash inflow $100,000 $100,000 $100,000
Cash outflow ($150,000) ($25,000) ($25,000) ($25,000)
Net Cash Flows ($150,000) $75,000 $75,000 $75,000
Measurement: IRR (2 of 2)
© 2015 Deloitte 59
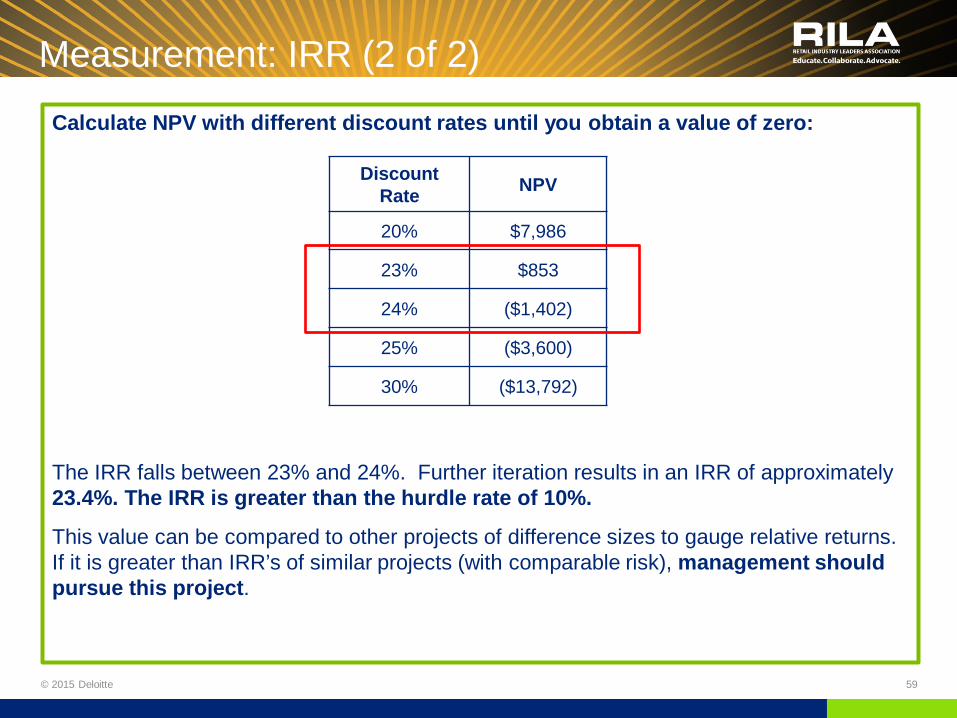
Calculate NPV with different discount rates until you obtain a value of zero:
The IRR falls between 23% and 24%. Further iteration results in an IRR of approximately 23.4%. The IRR is greater than the hurdle rate of 10%.
This value can be compared to other projects of difference sizes to gauge relative returns. If it is greater than IRR’s of similar projects (with comparable risk), management should pursue this project.
Discount Rate NPV
20% $7,986
23% $853
24% ($1,402)
25% ($3,600)
30% ($13,792)
60
This material is based upon work supported by the Department of Energy, Office of Energy Efficiency and Renewable Energy (EERE), under Award Number DE-EE0007062. This report was prepared as an account of work sponsored by an agency of the United States Government. Neither the United States Government nor any agency thereof, nor any of their employees, makes any warranty, express or implied, or assumes any legal liability or responsibility for the accuracy, completeness, or usefulness of any information, apparatus, product, or process disclosed, or represents that its use would not infringe privately owned rights. Reference herein to any specific commercial product, process, or service by trade name, trademark, manufacturer, or otherwise does not necessarily constitute or imply its endorsement, recommendation, or favoring by the United States Government or any agency thereof. The views and opinions of authors expressed herein do not necessarily state or reflect those of the United States Government or any agency thereof.
© 2015 Deloitte