Understanding the Capabilities of Your Surface Measurement ... · Understanding the Capabilities of...
41
Understanding the Capabilities of Your Surface Measurement System Erik Novak June 2012
Transcript of Understanding the Capabilities of Your Surface Measurement ... · Understanding the Capabilities of...

Understanding the Capabilities of Your Surface Measurement SystemErik NovakJune 2012

Bruker-Nano History
• 1960: Bruker Corporation founded (Karlsruhe, Germany)• 1962: Sloan Technology founded (1986: Acquired by Veeco)• 1982: Wyko Corporation founded (1997: Acquired by Veeco)• 1987: Digital Instruments founded (1998: Acquired by Veeco)• 2010: Bruker-Nano founded (Tucson, Santa Barbara, Camarillo)
• Technology driven– Over 180 Patents
(AFM & Profilers)– Numerous National
Technology Awards
New Bruker-Nano manufacturing facility in Tucson, AZ
© Copyright Bruker Corporation. All rights reserved

July 3, 2012 Slide 3Bruker NSB Stylus and Optical Unit R&D Status Update 08OCT10 V1.4
Bruker Confidential Information© Copyright 2010, Bruker Inc. All Rights Reserved
Bruker Stylus and Optical Metrology Unit is a Leader in Surface Measurement Innovation
• Leader in Optical Profiling• World’s first non-contact profiler using phase shifting interferometry• World’s first white light profiler• World’s first self calibrating optical Profiler• Interferometric, confocal, and bright-field imaging technologies
• Leader in Stylus Profiling• Over 50 years of the lowest-noise stylus profilers• First thin-film capable stylus system• First 300mm stylus system• First and only quick tip exchange for maximum measurement flexibility
• More than 8,000 optical and stylus instruments worldwide• More than 40 staff devoted to instrument development and applications
• Over 60 patents in Optical and Stylus Measurement Techniques• 25% of Tucson development team have doctorate degrees• 7 Major industry awards for innovation

Key Drivers Are Encouraging Greater Surface Control
• Miniaturization• A given tolerance is now a greater percentage of the part dimensions• Friction and wear behaviors are different at the micro-scale
• Outsourcing• Many vendors meet unwritten performance requirements• Matching multiple vendors often requires additional specifications
• Regulatory Improvements• Emissions requirements for transportation• Efficiency goals for lighting and appliances• Recycling requirements
• Warranty/Reliability Roadmaps• Expectations of lifetime continually increase
• Differentiation• Appearance• Highest quality product
July 3, 2012 Slide 4

Key Considerations for Choosing Your Metrology System
• What are you measuring?• Part Dimension• Feature Size (heights, widths)• Roughness• Key parameters• Dynamic, static, encapsulated?• Today, tomorrow…
• How well do you need to measure it?• Accuracy• Repeatability• Gage
• Who will be measuring it?• Engineers• Skilled operators• Multiple unskilled users
• Matching needs• Standards (ISO, ASME…)• Legacy systems• Other metrology systems
(vendors, customers, other sites, same site)
• How quickly do you need data?• Long term research• Failure analysis• Production monitoring
7/3/2012 5

Multiple Surface Metrology Technologies Serve Diverse Needs
• AFM: Highest lateral resolution with multiple modes and applications• 3D Microscopy using WLI: Highest vertical resolution, non-contact high-speed 3D
measurements• Stylus: Low noise contact profiling with excellent measurement repeatability
Atomic Force MicroscopyNanoscale characterization of electrical, magnetic, compositional and material properties
Optical ProfilingNon-contact 3D measurement of surface texture and roughness
Stylus ProfilingMeasure thin film step heights, stress and surface texture
7/3/2012 6© Copyright Bruker Corporation. All rights reserved
7
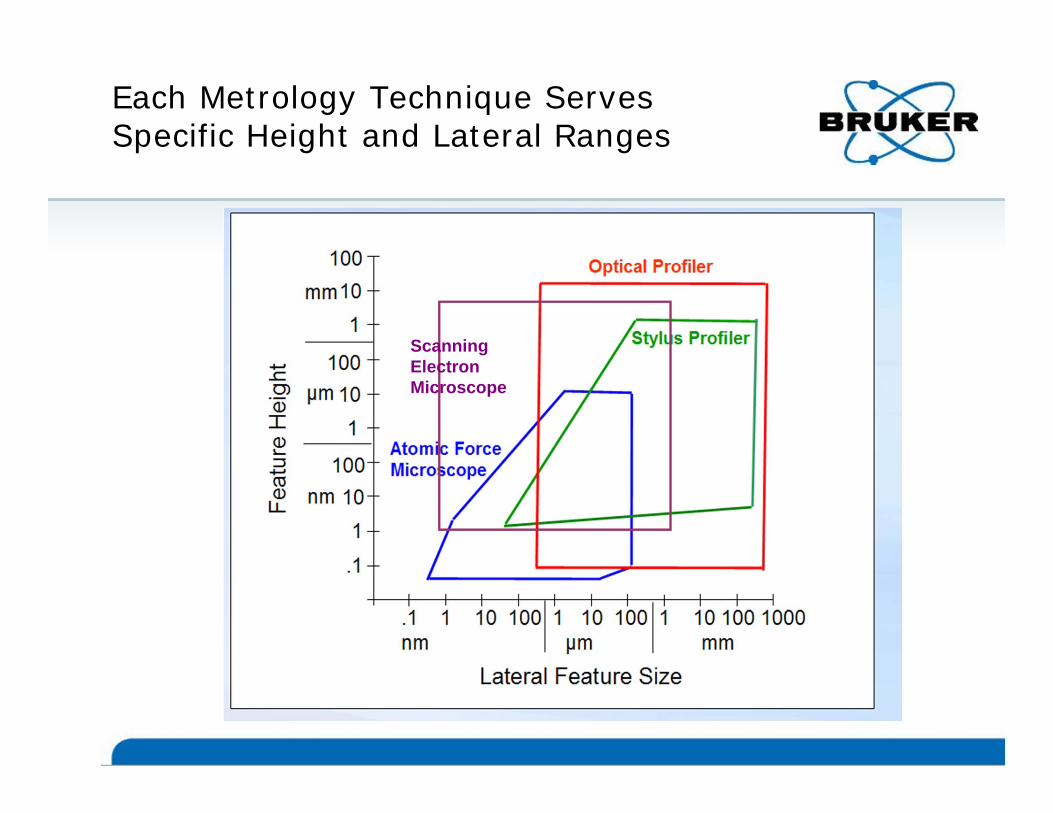
Each Metrology Technique Serves Specific Height and Lateral Ranges
Scanning Electron Microscope

Some System Choices Are Simple…But Most Are Not
• No physical access to the part (encapsulated, deeply recessed): 3D Microscope
• Nm-level lateral and vertical resolution: AFM
• Single or few traces for bow, roughness, shape: stylus
7/3/2012 8

09
Mature Technologies Offer a Variety of Specialized Configurations
Increasing Functionality and Automation
GT-K1 GT-X8GT-X3GT-K0
NPFlex SP9900

10
Accuracy, Precision, and Resolution Are All Necessary For Good Metrology
• Precision is the repeatability of a measurement result
• Accuracy is closeness of the average result to a true value
• Both are essential for proper metrology
• Precision relates to resolution, but is not the same
High precision, low accuracy High accuracy, low precision

Resolution Specifications Are Often Confusing
• Mathematical resolution is often used instead of something relating to a measurement• Some systems claim <1pm resolution. The helium (smallest) atom is 31pm
in diameter!• 20 significant digits might not be meaningful, nor might 16 camera bits
• Lateral resolution often confused with pixel (or sample) spacing• For contact systems, the resolution is different along the scan direction as
compared to between scan lines• For microscopes, optics often determine the resolvable feature size• Even when not optics limited you need at least 2 (preferably 3 or 4) pixels
across a feature to resolve it
7/3/2012 11
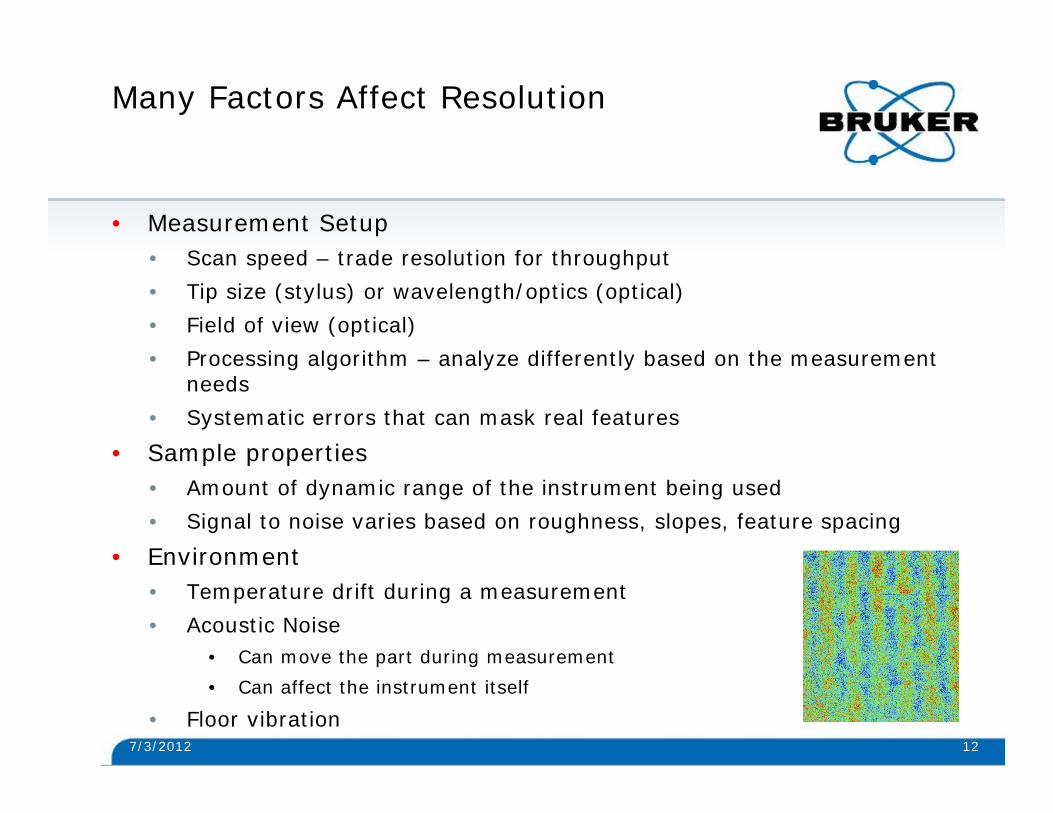
Many Factors Affect Resolution
• Measurement Setup• Scan speed – trade resolution for throughput• Tip size (stylus) or wavelength/optics (optical)• Field of view (optical)• Processing algorithm – analyze differently based on the measurement
needs• Systematic errors that can mask real features
• Sample properties• Amount of dynamic range of the instrument being used• Signal to noise varies based on roughness, slopes, feature spacing
• Environment• Temperature drift during a measurement• Acoustic Noise
• Can move the part during measurement• Can affect the instrument itself
• Floor vibration7/3/2012 12

7/3/2012 13
Data Point Density Sometimes Affects Resolution, But Might Not
• Optical systems often limited by the camera at low resolutions• At high magnifications (>20X) most all optical systems are
limited by the optics • Stylus systems typically limited by the tip size, but can be
limited by sampling rate in X or Y directions• Even AFM’s must account for the tip on fine geometries

Submicron lateral resolution: 50nm stylus
50nm stylus can successfully accessbase of 270nm deep trench
300nm270nm

Lateral Resolution of Microscopes Are Determined by the Optics and the Camera
System is called:
“detector limited” if >> 0.6 / NA “optics limited” if << 0.6 / NA
Effective lateral spatial sampling = = / Mwhere = pixel spacing & M = magnification
Detector
Optical systemObject
space

16
Optics Must Provide the Required Detail and Sampling
5X 10X
20X50X
Monocrystalline Solar Cell
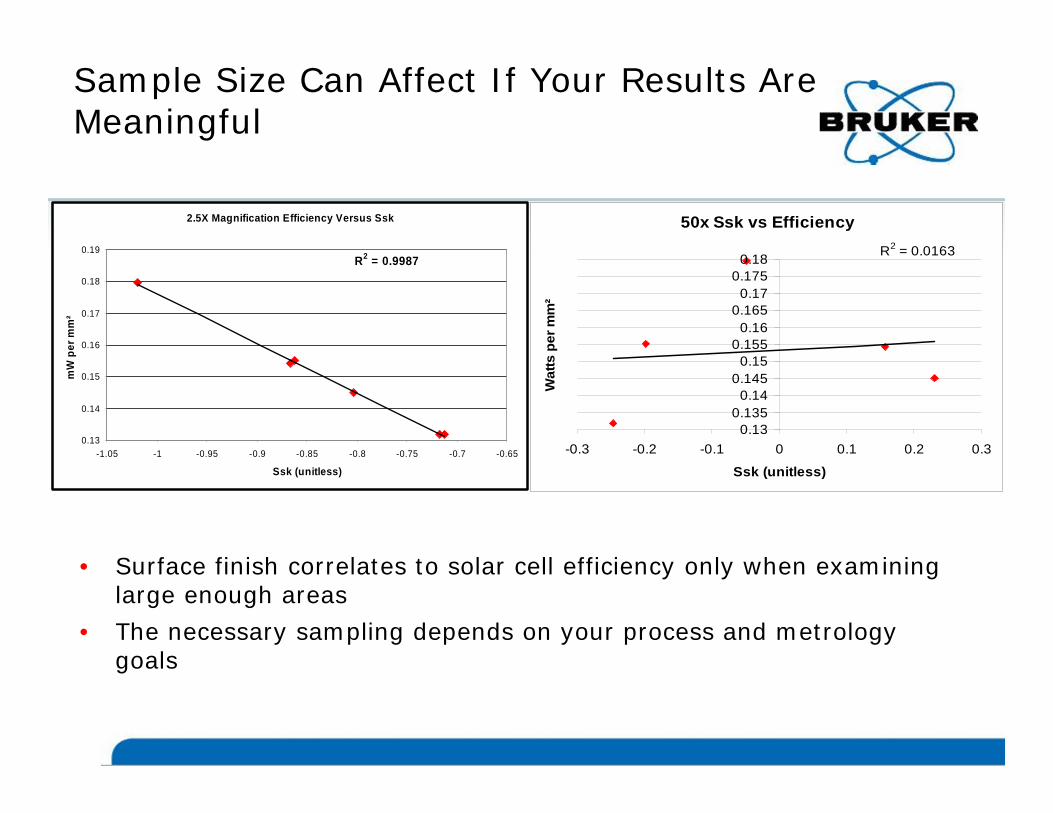
Sample Size Can Affect If Your Results Are Meaningful
2.5X Magnification Efficiency Versus Ssk
R2 = 0.9987
0.13
0.14
0.15
0.16
0.17
0.18
0.19
-1.05 -1 -0.95 -0.9 -0.85 -0.8 -0.75 -0.7 -0.65
Ssk (unitless)
mW
per
mm
²
• Surface finish correlates to solar cell efficiency only when examining large enough areas
• The necessary sampling depends on your process and metrology goals
50x Ssk vs EfficiencyR2 = 0.0163
0.130.135
0.140.145
0.150.155
0.160.165
0.170.175
0.18
-0.3 -0.2 -0.1 0 0.1 0.2 0.3
Ssk (unitless)
Wat
ts p
er m
m²

July 3, 2012 Bruker Nano Surfaces BusinessStylus and Optical Metrology Unit
5X 20X10X 50X 100X
Ra=7nmRa=12nmRa=74nmRa=472nm Ra=4nm
Only a few objectives usable for measurement
• Plots below show the signal used to determine the surface for a line of pixels as you go through focus.
• Signal changes drastically with the magnification.
Sample Size Can Affect Resolution: Confocal gives High Noise at Lower Magnifications

Ra=4 nm Ra=4 nm Ra=4 nm
19
50 100X
Interferometric 3D Microscopes Are Unaffected by Magnification
Ra=4 nm Ra=4 nm Ra=4 nm Ra=4 nm
5X 20X10X 50X1X 2.5X
Any objective can be used for measurement
• Plots below show the signal used to determine the surface for a line of pixels as you go through focus.
• Signal is unchanged no matter the magnification.

Knowing Your Resolution Target Can Be Difficult
• What size defects or deviations matter?• What parameters are important?
• Roughness • Does Ra mean the same thing to you and your customer (or vendor)?
• Heights• Curvature• Width• Defect Count• Structure size
• What tolerance is acceptable on those parameters• Each parameter will be resolved differently even with the same
measurements!
• What areal coverage is needed for statistical significance?
7/3/2012 20
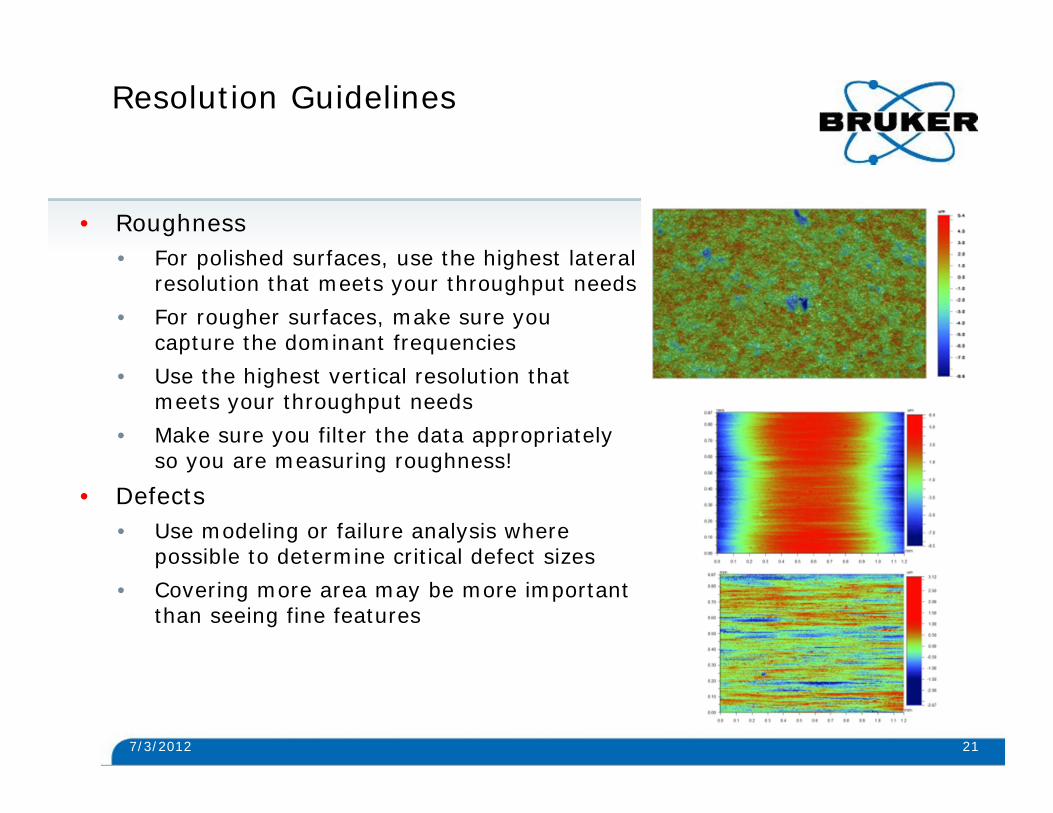
Resolution Guidelines
• Roughness• For polished surfaces, use the highest lateral
resolution that meets your throughput needs• For rougher surfaces, make sure you
capture the dominant frequencies• Use the highest vertical resolution that
meets your throughput needs• Make sure you filter the data appropriately
so you are measuring roughness!
• Defects• Use modeling or failure analysis where
possible to determine critical defect sizes• Covering more area may be more important
than seeing fine features
7/3/2012 21

Optimizing Resolution is a Balancing Game
• Many Tradeoffs• Setup complexity
• Reference subtraction• Alignments• Fixturing
• Measurement time• Scan speed• Averaging• Sample spacing and field of view
• Data processing choices• Filter selection• Data interpolation
• Analysis results• How many calculations?• How is a part pass/failed?
22
0.5 seconds - .5nm noise floor
10 seconds - .02nm noise floor

Two ‘bad’ metrics: Magnification and Sampling
• Magnification:• Optics companies define as ratio of pixel size on part to pixel size on camera.
• 100X magnification with a 10mm camera means 100nm pixel spacing
• Some companies define this as ratio of pixel size on part to screen size:• Comes from SEM world• Typically you see 20,000 to 100,000X magnification for a 100X objective• So if you had a movie projector, you could get 10,000,000X magnification!
• Better to use field of view (scan length for stylus), since it relates to the area you measure
• Sampling:• How closely together you can take data• Some companies with 30 µm spot size or 20 µm stylus tips talk about 100nm
sampling – this doesn’t help you see anything• Sometimes sampling relates to lateral resolution, but often does not
• A 50X objective may have 100 nm sampling, but only resolves 350nm features
• Use lateral resolution or measurable feature size instead, and ensure that it’s measured against what feature sizes can be seen
23

24
System Accuracy Will Be Affected By Your Calibration Standards
• Step uncertainty is quite large at 0.5 to 2.5%• Creates ‘empty’ performance as it is several orders of magnitude
worse than repeatability of the system• Better calibrated steps are quite expensive: >$10K each• Example: Step repeatability is 0.05% but your calibration standard is
1% accurate. Your result could just be very consistently wrong…how do you use the data? Why bother with such good repeatability?
• Below are values from a typical step standard vendor.Nominal Step Value (µm)
Typical Uncertainty (µm)
Typical Uncertainty (%)
0.1 +/- 0.0021 +/- 2.2
2 +/- 0.018 +/- 0.95
10 +/- 0.070 +/- 0.7
25 +/- 0.151 +/- 0.6
50 +/- 0.266 +/- 0.55

25
Some Systems Can Self Calibrate
• Separate signal continuously monitors the measurement
• This is known as a second-level traceable, internal standard…close to an “absolute” standard.
• Each scan is monitored continuously over the entire scan range
• Uncertainty can be significantly reduced
• Stability improves as well as environmental factors are continuously accounted for
Sample
Beamsplitter
Illuminator
Reference signaldetector(s)
CCDReference signal module
Laser
Mirror on the scanner
Reference mirror
Measurement Signal
Mirror
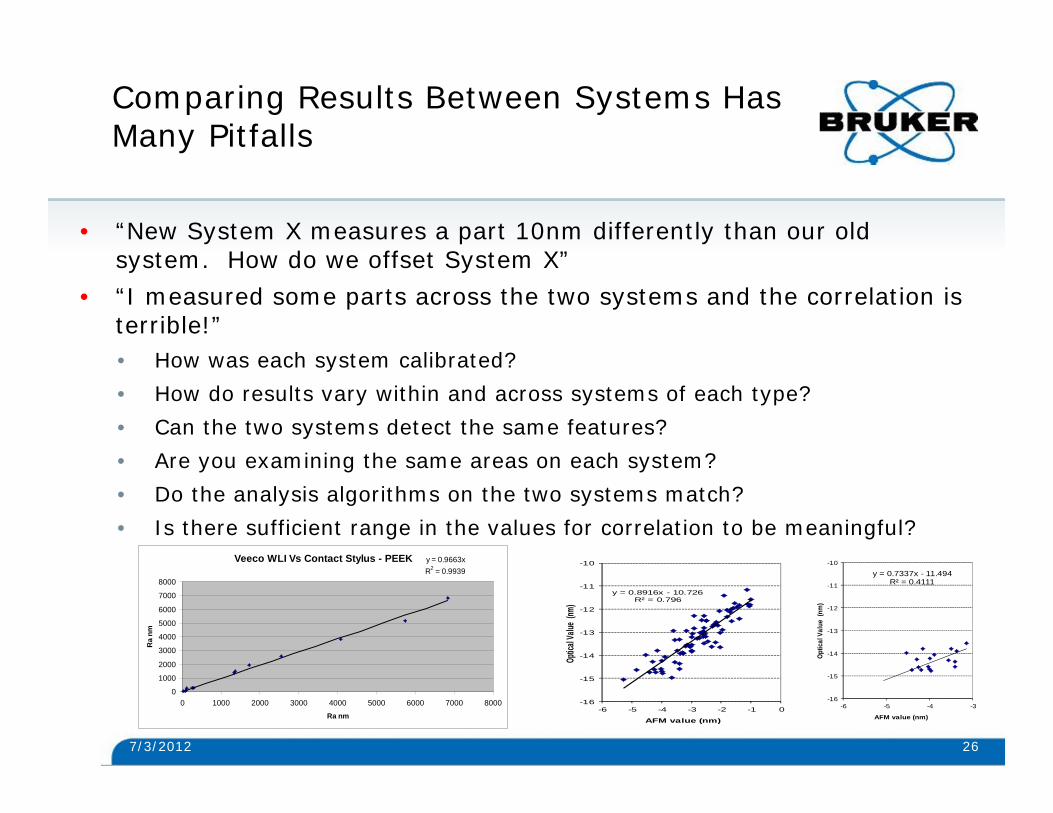
Comparing Results Between Systems Has Many Pitfalls
• “New System X measures a part 10nm differently than our old system. How do we offset System X”
• “I measured some parts across the two systems and the correlation is terrible!”• How was each system calibrated?• How do results vary within and across systems of each type?• Can the two systems detect the same features?• Are you examining the same areas on each system?• Do the analysis algorithms on the two systems match?• Is there sufficient range in the values for correlation to be meaningful?
7/3/2012 26
Veeco WLI Vs Contact Stylus - PEEK y = 0.9663xR2 = 0.9939
0
1000
2000
3000
4000
5000
6000
7000
8000
0 1000 2000 3000 4000 5000 6000 7000 8000Ra nm
Ra
nm
y = 0.8916x - 10.726R² = 0.796
-16
-15
-14
-13
-12
-11
-10
-6 -5 -4 -3 -2 -1 0
Optic
al Va
lue (n
m)
AFM value (nm)
y = 0.7337x - 11.494R² = 0.4111
-16
-15
-14
-13
-12
-11
-10
-6 -5 -4 -3
Optic
al V
alue
(nm
)
AFM value (nm)

27
Standard Error is Used to Evaluate Agreement Between Two Systems
• Good for parts with small range in values compared to the average
• Assumes measurement of the same features
• Two methods are considered agreeable to twice the calculated standard error
• Avoids having to know the true sample standard deviation required by the correlation coefficient
222
221
2
TsysTsys
TR
Correlation coefficient
Standard error: standard deviation of the difference
22
21
2syssysSE

Visual Comparisons Might Be Enough to Give Confidence in Results
Dektak 1
Dektak Wyko
Wyko 1

Numerical Correlation Might Vary Depending on the Parameter
90% Correlation! 86% Correlation!
Linear Regression Graphs
Dektak and Optical Data for Key S Parameters
99% correlation!
Offsets are due to differing lateral resolutionsGood correlation means consistent process control is possible

30
Roughness Standards Can Also Demonstrate 3D Microscopy Correlation to Contact Profilometry
Veeco WLI Vs Contact Stylus - PEEK
1
10
100
1000
10000
MedicalGrade
Polished
InjectedMolded
LightlyStoned
StonedthenBead
Blasted
Polishedfinish
600 GritPaperfinish
600 GritStonefinish
WornTop Hip
JointVirgin
WornMiddle
Hip JointVirgin
WornBottom
Hip JointVirgin
WornTop Hip
JointCarbon
WornMiddle
Hip JointCarbon
WornBottom
Hip JointCarbon
Ra
nm
NP Flex Dektak

The Most Important Thing for Choosing a Measurement System: Measure YOUR Sample YOURSELF
• Don’t rely on a scripted demonstration to make any determinations
• Perform the measurement yourself• Intuitive?• Simple setup?
• Measure time to data• Change some variables, see
what happens
7/3/2012 31

Understand The System Performance For Your Needs
• Compare sequential measurements• Subtract results and examine the
stability• Quick test of ‘true’ resolution
• How do results vary over time?• Over the course of a day• Overnight• Weekly
• Do you have the standards you need to control the metrology?• Sometimes a step or flat is fine• Might need a ‘golden’ part
7/3/2012 32
10µm Step with Continuous Calibration StdDev=5.9nm
10050
10100
10150
10200
10250
10300
10350
8/21 8/24 8/27 8/30 9/2 9/5 9/8 9/11Date
Hei
ght (
nm)
65
70
75
80
85
Tem
pera
ture
(deg
ree
F)
StepAvg Upper Step Limit Lower Step Limit Sample Temperature

3
Averaging Can Reduce Noise and ImproveVertical Resolution
• Random (most) noise reduces by the square root of the number of averages.
• Averaging can help see finer detail than is otherwise possible.
• Examining Difference Measurements can tell you the noise floor you are achieving.
• Averaging may not help in loud or high vibration environments
Ra of Difference Measurement vs. # of averages
00.050.1
0.150.2
0.250.3
0 50 100 150 200 250
# of Averages
Ra
(nm
34
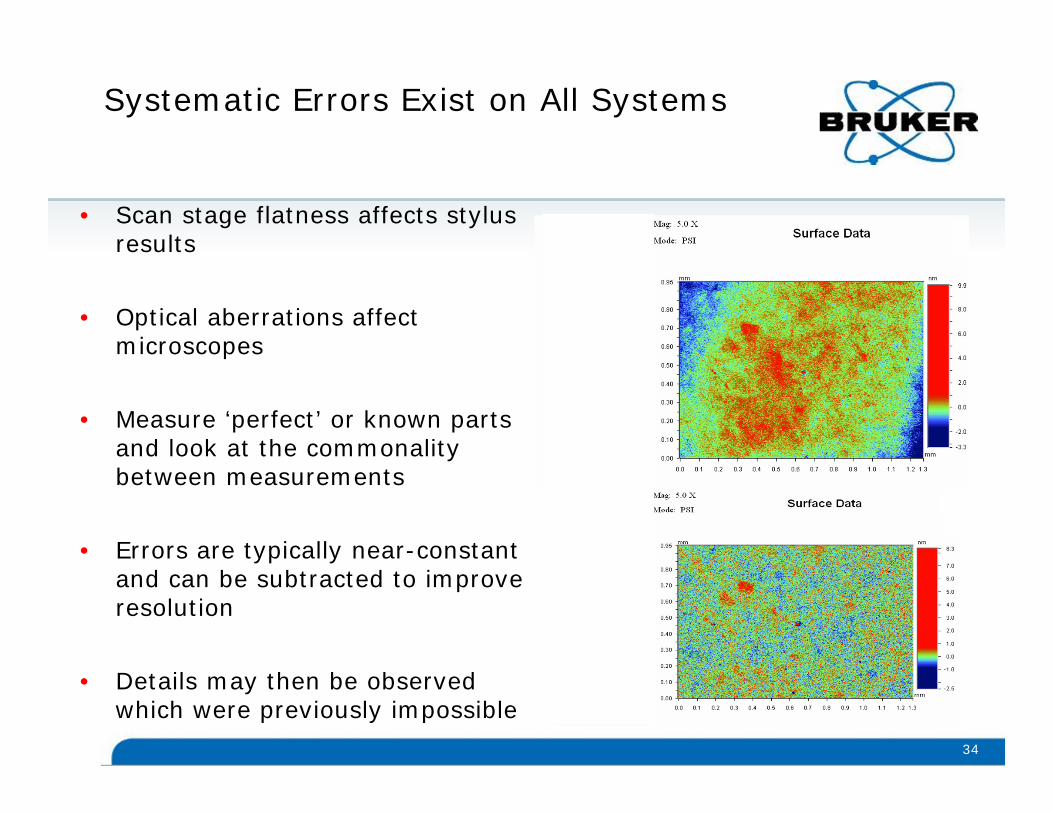
Systematic Errors Exist on All Systems
• Scan stage flatness affects stylus results
• Optical aberrations affect microscopes
• Measure ‘perfect’ or known parts and look at the commonality between measurements
• Errors are typically near-constant and can be subtracted to improve resolution
• Details may then be observed which were previously impossible

ISO Compliance of Analyses Should Be Verified Where Necessary
• Vendors should have verified using NIST, NPL, or other recognized standards bodies
• Dozens of 2D and 3D primary parameters are associated with standards
357/3/2012

System Throughput or Time to Data Should be Understood
• Part preparation• Part load and mounting• Finding the measurement area
• Automated vs. manual• Tolerant of errors?
• Setting up the measurement• Measurement time• Analysis time• Report generation/databasing
• Often ‘measurement time’ is <1/3 overall time to data
• Be wary of ‘scan speed’
7/3/2012 36

You Control Many Factors That Affect System Performance
• System placement• Near air vents?• Near sources of vibration?• Stable temperature?
• Part Fixturing• One of the most important elements for reliable results• Vacuum? Clamping?• Does the fixture deform the part?• Do you need pattern recognition due to placement variation?
• System setup• Simple optimization can improve throughput and stability• Proper analyses • Advanced training will save time and money• Production mode can limit operator choices
7/3/2012 37

7/3/2012 38
The ‘Right’ System May Be More Than One System! • AFM: Highest lateral resolution with multiple modes and
applications• 3D Microscopes: Highest Z resolution, non-contact high-speed 3D
measurements• Stylus: High Z with excellent measurement repeatability
Atomic Force MicroscopyNanoscale characterization of electrical, magnetic, compositional and material properties
Optical ProfilingNon-contact 3D measurement of surface texture and roughness
Stylus ProfilingMeasure thin film step heights, stress and surface texture
7/3/2012 38

7/3/2012 39
The ‘Right’ System May Be More Than One System! • AFM: Highest lateral resolution with multiple modes and
applications• 3D Microscopes: Highest Z resolution, non-contact high-speed 3D
measurements• Stylus: High Z with excellent measurement repeatability
Atomic Force MicroscopyNanoscale characterization of electrical, magnetic, compositional and material properties
Optical ProfilingNon-contact 3D measurement of surface texture and roughness
Stylus ProfilingMeasure thin film step heights, stress and surface texture
7/3/2012 39

Choosing a Measurement System Is Not Simple
• Does the system have the required performance on your parts, with your people, in your environment
• Is additional capability (automation, self-calibration, mechanical stability) worth the investment?• How critical are the results?• How quickly do you need feedback?• How will a given increase in yield help your business?
• Are you getting the solution you need?• Is it flexible enough for the long term• Do you have access to the required expertise• Will the provider be there for you
7/3/2012 40

www.bruker.com
© Copyright Bruker Corporation. All rights reserved.
Thank You!Questions?