Understanding the Basics of Irrigation Design, Installation - STMA
169
Design, Installation and Management of Irrigation Systems…. STMA, San Antonio, 2014
Transcript of Understanding the Basics of Irrigation Design, Installation - STMA

Design, Installation and
Management of Irrigation
Systems….
STMA, San Antonio, 2014

Let’s talk “water”…

Understanding Irrigation Basic Design
is the FIRST step to understanding
outdoor water conservation and
developing safe playing surfaces!
Why Am I Here?!

Irrigation System Design Workshop (1
day)
Hydraulics
Design Capacity
Equipment Selection
Precipitation Rates
Equipment Layout/ Zoning
Pipe Sizing
Scheduling

Irrigating High Traffic Areas


What Should I Consider for a Retro
and/ or New System?
Site specifics - problems and potentials
Location
Water source/ water quality
Available hydraulics
Equipment

Water Source & Water Quality
Metered system
Well & pump – sand/ silt
Reclaimed - salts
Gray – biodegradable
fluids
Gravity


Competent Irrigation Design

Core Basics:
Why Do We Need to Understand These?
Sites Specifics
Hydraulics
Design Capacity
Precipitation Rates
Equipment Selection
ET
IR
KC

Where to Start?
Design…..

Available Hydraulics
Back to the
basics… • Pressure
• Volume
• Velocity

Irrigation Hydraulics
Sprinkler performance
Uniform coverage
System cost
Affect:

#1 Biggest Variable
in a System?
*Irrigation Hydraulics
*Pressure!!

Pressure…..
The force of water, measured
in PSI (pounds per square
inch) or Feet of Head
What are the two ways to create
water pressure in a system?
Water Pressure
weight of water
pump (mechanical
pressurization)

Water Facts
What water weighs at 60° F:
1 cubic foot (ft3) = 1728 cu. in. = 62.43
lbs
1 cubic inch (in3) = 0.0361 lbs

1 Cubic Foot of Water
12 in.
12 in.
12 in.
(1 ft.3 of water)

Water Pressure from 1 Foot of Water
1 in.
1 in.
12 in.
0.433 psi
12 in.3 x 0.0361 lbs/in.3 = 0.433 lbs

Facts to Memorize
a column of water 1 ft. high = 0.433 psi
a column of water 1 ft. high = 1 ft. of
head
2.31 feet of head = 1 psi (2.31 x 0.433)

Does Container Shape Make a Difference?
1 ft. high
0.433 psi at the bottom

Pressure in Pool vs.... Lake
10 ft.
Divers
Swimming Pool Lake
Diver at 10 ft.
Pressure on diver in pool and lake 4.33 psi (10 ft. x 0.433 psi/ft = 4.33 psi)

Pressure Change vs. Elevation
1 foot of elevation change = 0.433
psi change

Static & Dynamic
Pressure Static Pressure: water at rest
Dynamic Pressure: water in
motion (working pressure)

Sprinkler System Static
Pressure - Gain
Water Meter
8 ft.
Control Valve
60 psi (Static Pressure)
63.46 psi (Static Pressure)
M
Elevation View

Sprinkler System Static
Pressure - Loss
Water Meter
40 ft.
60 psi (Static Pressure)
42.68 psi (Static Pressure)
Control Valve
M
Elevation View


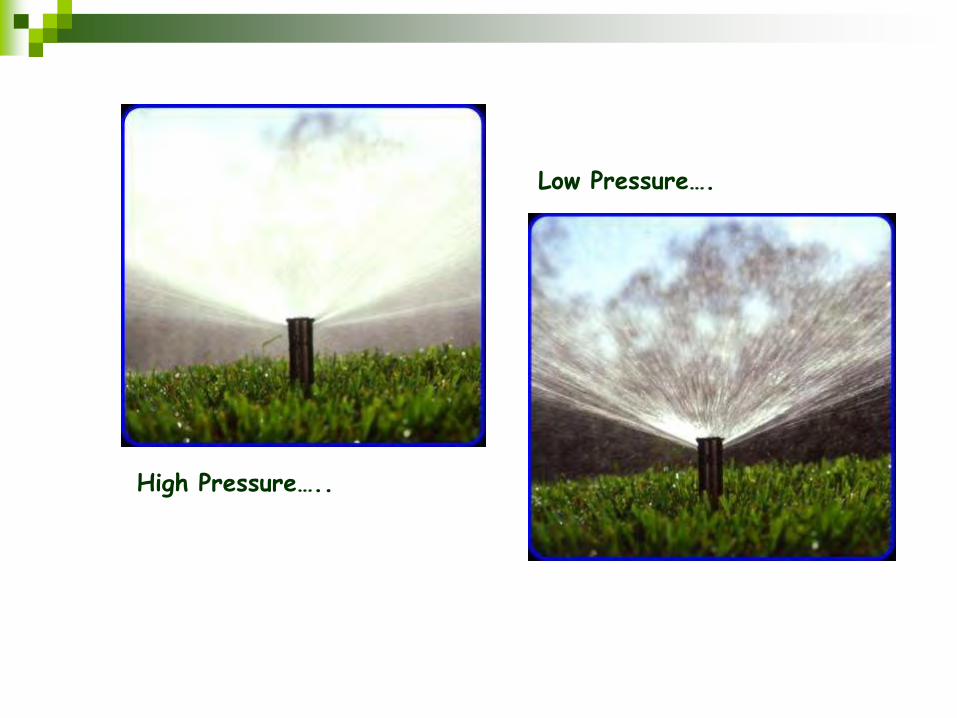
High Pressure…..
Low Pressure….

Determining Pressures….
Liquid filled
Pitot Tube
Dynamic
pressure w/ pitot
tube
Static pressure w/ gauge

Pressure Gauges…
Pitot
Tubes….

Water Movement in
Irrigation Systems

Volume

What is Volume?
Flow. The amount of
water, measured in GPM
(gallons per minute) or
GPH (gallons per hour)

Volume….
Different nozzles demand different flows
Varying pressures cause differing flows
Flow….

Volume….
Flow….

Velocity

What is Velocity?
The speed at which water travels,
measured in FPS (feet per second)
Maximum speed: 5 fps
Factors Affecting Friction
Loss in Pipe
velocity
inside diameter
roughness
length

Velocity
Velocity 2.97 fps
Velocity 6.67 fps
8 gpm - 1-in. Sch 40 PVC
18 gpm - 1-in. Sch 40 PVC
Pressure Loss = 1.59 psi/100 ft. of pipe
Pressure Loss = 7.12 psi/100 ft. of pipe

Roughness
10 gpm - 1-in. Sch 40 Standard Steel Pipe
Velocity 3.71 fps
10 gpm - 1-in. Sch 40 PVC
Pressure Loss = 2.40 psi/100 ft. of pipe
Pressure Loss = 5.08 psi/100 ft. of pipe
Roughness C=150
Roughness C=100
Velocity 3.71 fps

Length
Velocity 3.70 fps
10 gpm - 1-in. Sch 40 PVC
Pressure Loss = 2.40 psi total
100 feet of pipe
10 gpm - 1-in. Sch 40 PVC
Pressure Loss = 4.80 psi total
200 feet of pipe
Velocity 3.70 fps

Irrigation
Hydraulics…
Minimize Your
Friction Losses!
It affects your Pressure!!

What comes first in designing an
efficient system?
Determine available flow
Determine pressure available at point
of connection
Estimate pressure available for
sprinkler operation
Estimate the number of sprinklers
that can be operated on a single zone
*Design Capacity

M
POC
Delivery Line
Water Meter
Service Line
Water Source - City Water Main
Definitions:
City Water Main: Municipal water line bringing
water to project
Service Line: Connects city main to water meter
Delivery Line: Line between water meter and POC
Point of Connection [POC] Location where system
is
connected to water supply

Dynamic Pressure (psi) at Design Capacity (gpm)
at POC (67.00 psi)... but how much pressure will be
available at the Highest Head?
M
POC
5 ft
12 ft
1-1/4 in - Sch 40 PVC Delivery Line - 65 ft
1 in. - Water Meter
1 in. Type “K” Copper - Service Line - 25 ft
Water Source - City Water Main - 80 psi
Site of Highest Head In System
10 ft
Design Capacity
Sample Problem
How Much Pressure is Available for Sprinkler Operation?

Calculation of Dynamic Pressure at Design
Capacity
pressure loss in the service line
pressure loss in the delivery line
pressure loss in the water meter
pressure loss in the isolation valves
pressure loss in the other system
components
Estimate Dynamic Pressure at Point of Connection using Design Capacity

Determine Design Capacity
pressure loss through the water
meter
volume through the meter
velocity through the service line
Three Factors Restricting Available Flow:

through
through the
Velocity
Determine Design Capacity
“Rule of Three”
B. Determine Design Capacity
GPM With
Factor Restriction Restriction
10 Pressure loss Not to exceed 10% of available
the water meter. psi at the source (Line 1) GPM
11 Volume Not to exceed 75% of maximum
water meter. safe flow of the meter. GPM
12 through the Velocity not to exceed 7.5 fps
service line. (Main to meter) GPM
13 Design Capacity Lowest GPM of the three flows rates - lines 10, 11, and 12.
GPM

Estimating the Pressure Available
at the “Worst Case” Head
pressure changes due to the change in
elevation
1/3 of the dynamic pressure is lost
through valves, pipe and fittings
2/3 of the dynamic pressure remains
available for sprinkler operation

Design Capacity
Worksheet

Equipment Selection…

Equipment Selection
What’s new? What saves water and could
help you sell the job?
Check with your local Irrigation distributor &
manufacturer’s rep
Obtain new product catalogues at
tradeshows!
Check with your local sales representative
Ask your neighbor

Component Locations…

Volkswagen

Cadillac…

Design Goal:
Have all sprinklers controlled by
one valve within + or – 10% of the
pressure at which they were
designed to operate!
Example: 60 psi dynamic operating
pressure = 54 psi to 66 psi at each
sprinkler for optimum performance.
Sprinkler Placement
type and size of the planting areas
(hydrozones)
the manufacturer’s maximum spacing
ratings
the effect of wind on spacing

Sprinkler Placement
Considerations
the size of the hydrozone
flow and pressure available for the
system
select the sprinkler pattern that
provides the least overspray

What You Need to Know
design with head-to-head coverage
place heads in corners
place heads around the perimeters
place heads in the middle

Friction Loss Charts

Friction Loss Charts
determine “friction loss” in pipe
determine velocity
use pressure losses and/or velocities
to size pipe
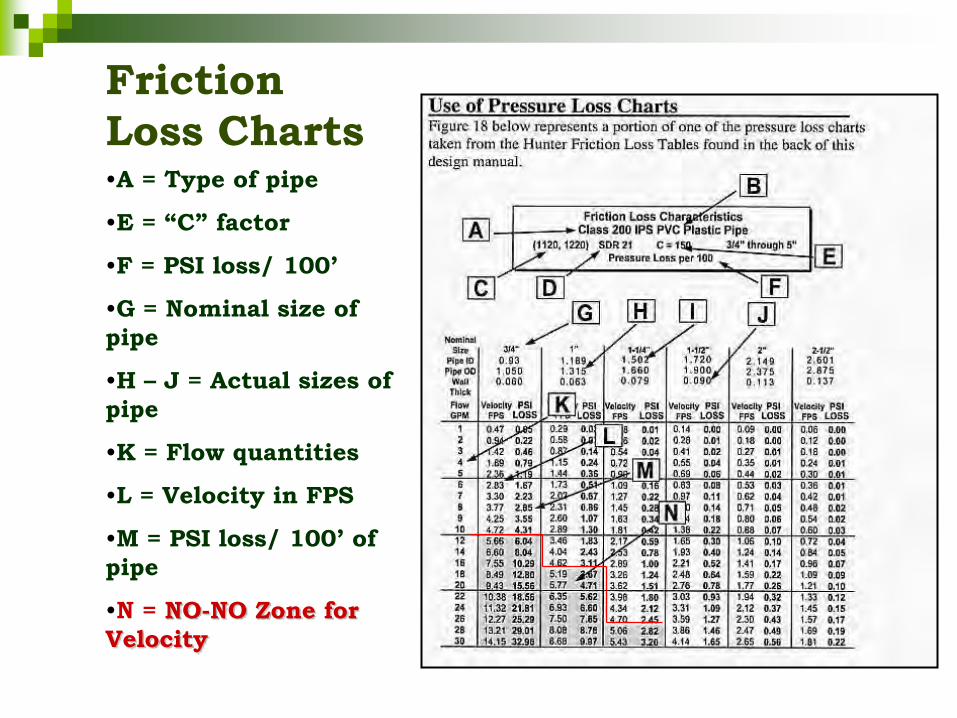
Friction
Loss Charts •A = Type of pipe
•E = “C” factor
•F = PSI loss/ 100’
•G = Nominal size of
pipe
•H – J = Actual sizes of
pipe
•K = Flow quantities
•L = Velocity in FPS
•M = PSI loss/ 100’ of
pipe
•N = NO-NO Zone for
Velocity

Velocity Limit Pipe Sizing
Maintains low velocity to reduce potential
water hammer
Maximum velocities usually:
PVC: 5 fps
Polyethylene: 6 fps
Copper: 7 to 7.5 fps
If used in lateral lines can result in
excessive pressure variation

Velocity Limit Pipe Sizing Maximum PVC Mainline Flow Rates*
•If other pipe types are used, maximum flow rates determined by appropriate velocity for pipe type.
Pipe Size and Type Maximum Flow Rate
At 5 FPS
1/2” Schedule 40 PVC 4.7 GPM
3/4” Schedule 40 PVC 8.3 GPM
1” Schedule 40 PVC 13.5 GPM
1 - 1/4” Schedule 40 PVC 23.4 GPM
1 - 1/2” Schedule 40 PVC 31.8 GPM
2” Class 315 PVC 50.2 GPM
2 - 1/2” Class 315 PVC 73.5 GPM
3” Class 315 PVC 109 GPM

Velocity Limit Pipe Sizing Maximum SDR PE Mainline Flow Rates*
1” SDR Polyethylene 1 - 1 -
2” SDR Polyethylene 2 -
•If other pipe types are used, maximum flow rates determined
by appropriate velocity for pipe type.
Pipe Size and Type Maximum Flow Rate
At 6 FPS
1/2” SDR Polyethylene 5.7 GPM
3/4” SDR Polyethylene 10.0 GPM
16.2 GPM
1/4” SDR Polyethylene 28.0GPM
1/2” SDR Polyethylene 38.1 GPM
62.8 GPM
1/2” SDR Polyethylene 89.6 GPM
3” SDR Polyethylene 138.4 GPM

Zoning of Sprinklers
Match precipitation rates or….
Same type sprinklers zoned together
Understand water windows
+ or – 10% rule

Mainline Sizing Single Valve vs. Multiple Valve Operation
Residential through medium
commercial projects:
ONLY ONE valve operates at a time.
Large commercial projects, parks, golf
courses and agricultural projects:
Multiple valves operate
simultaneously.

Velocity Limit Sizing
Sample Problem - PVC Mainline
Single Valve Operation
C
A
D F
5 3/4"
E G
15
22
50
25 5
B POC
50
Irrigation Control Valve
Flow in gpm
Mainline Pipe Lateral Line Pipe

Velocity Limit Sizing
Sample Problem
PVC Mainline
Single Valve Operation
Pipe Size and Type
Maximum FlowRate
At 5 FPS (GPM)
1/2” Schedule 40 PVC 4
3/4” Schedule 40 PVC 8
1” Schedule 40 PVC 13
1-1/4” Schedule 40 PVC 23
1-1/2” Schedule 40 PVC 32
2” Class 315 PVC 50
C
A
D F
5
E G
15
22
50
25 5
B POC
¾”
1 ¼”
1 ¼”
2”
2”
1 ½”
2”

Hunter I20 ADS #8 nozzle = 8 gpm at 50 psi
PVC Class 200, sized appropriately
Hunter ICV, sized appropriately
Typical Zone Sizing
60 psi
32 gpm 24 gpm 16 gpm 8 gpm
¾” 1” 1 1/4” 2”
3.77 fps 4.62 fps 4.34 fps 2.30 fps
8 gpm

Hunter I20 ADS #8 nozzle = 8 gpm at 60 psi
PVC Class 200, sized appropriately
Hunter ICV, sized appropriately
Sprinkler System Flow and psi Loss
Nozzle change to 15 gpm
What happens to friction loss? What are velocities?
60 psi
32 gpm – 46 gpm 24 gpm – 31 gpm 16 gpm – 23 gpm 8 gpm – 15 gpm
¾” 1” 1 ¼” 2”
Nozzle change
to 15 gpm
7.08 fps 6.7 fps 5.5 fps 4.42 fps

Irrigation
Hydraulics…
Minimize Your
Friction Losses!
It affects your Pressure!!


Decoder Systems Usage
and Applications

How Decoder Systems Work The Basic Decoder
• Interprets encoded signal from controller •Acts as a relay. •Waterproof potting compound (solid epoxy)
•

Decoders come in many sizes
1, 2, 4, & 6-station decoders Two-way decoders activation confirms & reports Each output can be individually activated
ICD-600, 400, 200 & 100

Why Decoders? Save Copper Wire
Decoder Systems typically use 60% less copper wire, an expensive, non-renewable resource.
Less Labor
Run More Stations, Over Longer Distances (up to 15,000ft/4.5km)
Flexibility!
Easy to add valves after initial installation… no spare wires or trenching.
Troubleshooting- only 2 wires to solve.
Lightning Resistance- fewer copper paths in-ground
Easy to Repair.

Two-wire technology for large systems
Traditional systems require at least one wire
per valve, plus common ground wires.
A large system can easily have 100 wires, running
thousands of feet… with copper at $??.00 per
pound.

Conserving Time and Resources Save wire (and labor) in large installations Electrically efficient: operate more stations with less power Expand systems after installation, without costly trenching Simplify large-system troubleshooting!
Conventional Wiring
Decoder Wiring

How Decoder Systems Work
The single pair of wire is run from the controller through the area to be irrigated. Usually with the main pipeline.
A decoder is spliced into the two-wire path.
Additional decoders are spliced in as needed.
Decoders, in turn, are connected to their solenoids.

Station addresses
How Decoder Systems Work When the controller turns on a station, it sends power down the wire pair, along with the digital Station Number for the decoder.
23 23 23 23 23 23 23 23 23
When the decoder hears his own “Address”, he applies voltage to the solenoid.

Two-wire technology for large systems
Decoder technology allows us to run multiple
valves over a single pair of wires… for miles!
The power for the solenoids and a
digital signal (for the zone we want
to operate), are sent over the same
2 wires.

Where Decoder Systems Work Best
• Systems with 24 valves and larger are usually the best candidates for decoder applications.
• Phased projects where it would be difficult and expensive to run wires back to a controller, or where the final number of zones is undetermined...
Estates
Commercial Projects
Industrial Parks Sports Fields
Cemeteries
Multi-Family Home projects Zoos...

Decoders- the Flexible Choice for a Changing World Decoders are only required as they are needed
It is possible to start at the furthest point, with the bare minimum number of decoders…
…as phased projects build out, add decoders, when you add the valves
• If the plan is changed, just
splice in another decoder • No additional programming at the
controller, except to add a run time.

Planning Your Wire Paths Place a decoder by each 24VAC valve (standard solenoids)
Max distance from controller to furthest decoder on each path:
Follow Manufacturer's specs.
Max distance from decoder to solenoid, 150 ft (recommended maximum)
= Decoder
= Earth Ground

Planning Your Wire Paths Two-wire paths may be spliced!
Follow splice rules
Use pipe trenches to route wire cheapest way
Use a different colored cable for each path.
Max wire distance applies to each wire path- from controller to each end of each run (10k/15k ft.)
= Decoder
= Earth Ground

Design…..
“Other Considerations”…

Local Codes…

Local Codes…
Irrigation Wires and Cables
& Electrical Code Requirements
(NEC® and CEC®)

Local Codes…

Other Design Criteria
Main line size – two zones at
one time
Equipment selection
Hydro zones
Infields
Synthetic surfaces

Synthetic

Synthetic

Check with your local Irrigation
distributor
Obtain new product catalogues at
this tradeshow!
Check with your local sales
representative
Ask your neighbor
Equipment Selection

Equipment Selection

Key Buzzwords…(quick quiz)
Pr
Ir
Et
Kc
Back to the Basics…
Precipitation
Rates…(Pr)

What is a “Precipitation Rate”?
A) How fast water is applied as
measured in inches per hour (in/hr)
B) An amount of water applied over a
period of time, usually measured in
inches per hour
or


Are all Precipitation
Rates the Same?
high 1.0 in/hr and above
medium 0.5 to 1.0 in/hr
low 0.5 in/hr and below

High…
Medium
…
Low….

34650 x GPM (for any arc)
Degrees Arc x Head Spacing x Row Spacing P = r
The Sprinkler Spacing
Method…

The Sprinkler Spacing
Method…

96.25 x Total GPM
Total Area P = r
The Total Area Method…

2 Full circle x 8.0 GPM = 16 GPM
6 Half circle x 4.0 GPM = 24 GPM
4 Quarter circle x 2.0 GPM = 8 GPM
Total = 48 GPM
Total Area 40 ft. x 60 ft. = 2400 sq. ft.
Full circle sprinkler - 8.0 GPM
Half circle sprinkler - 4.0 GPM
Quarter circle sprinkler - 2.0 GPM
Total Area Method…
60 ft
40 ft
Matched Precipitation Rates
all the heads have similar precipitation
rates
sprinklers by themselves do not have
matched precipitation rates
matched precipitation rates can help to
avoid wet and dry spots AND help save
water!

Quarter Circle Head
Half Circle Head
Full Circle Head
Area Covered 78.5 sq. ft. - 4 GPM
Area Covered 157 sq. ft. - 4 GPM
Area Covered 314 sq. ft. - 4 GPM
Heads WITHOUT
Matched Precipitation Rates
4 GPM
2 GPM 1 GPM
2 GPM 1 GPM 1 GPM
1 GPM

Quarter Circle Head
Half Circle Head
Full Circle Head
Area Covered 78.5 sq. ft. - 1 GPM
Area Covered 157 sq. ft. - 2 GPM
Area Covered 314 sq. ft. - 4 GPM
Matched Precipitation Rates
1 GPM
1 GPM 1 GPM
1 GPM 1 GPM 1 GPM
1 GPM

Match precipitation rates through scheduling the controller!

Infiltration Rate – (IR)

What is an Infiltration Rate?
The rate that water moves
into the soil surface,
measured in in./hr (inches
per hour)
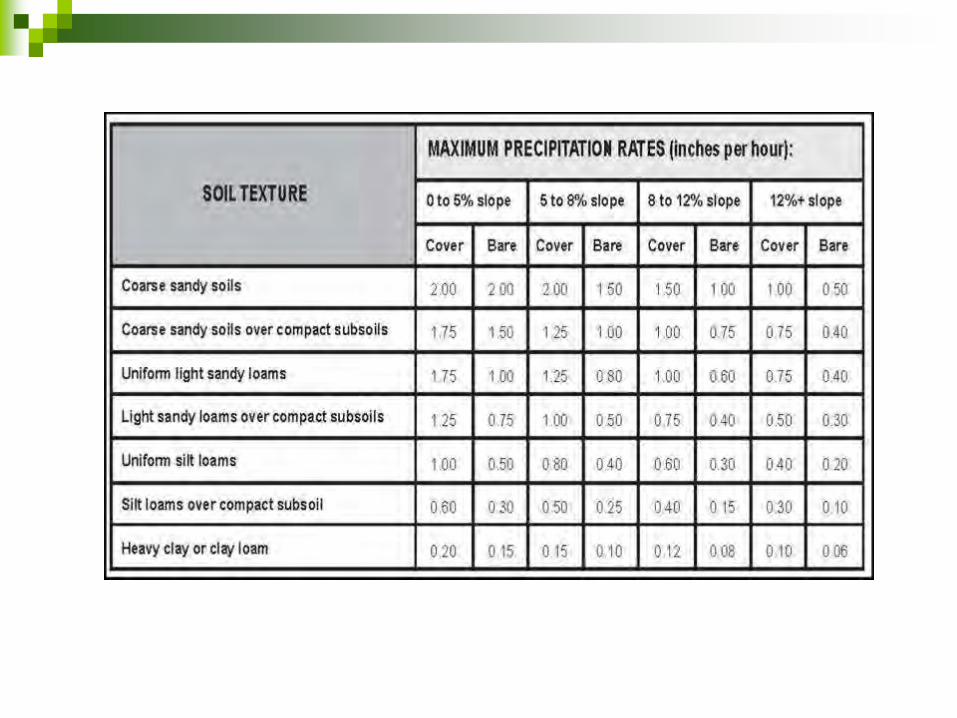
Sprinkler Head Selection
When selecting sprinkler
heads, it is necessary to
limit their precipitation rate
to the infiltration rate of the
soil

Evapotranspiration Rate (ET)
Evapotranspiration Rate…
The rate at which water is
transpired by the plant and
evaporated from the soil.

What Affects ET?
Wind
Humidity
Temperature
SOLAR RADIATION

Potential ET Rates
Cool Humid 0.10 – 0.15
Cool Dry 0.15 – 0.20
Warm Humid 0.15 – 0.20
Warm Dry 0.20 – 0.25
Hot Humid 0.20 – 0.30
Hot Dry 0.30 – 0.50

Crop Coefficient (Kc)
or
Plant Factor

Crop Coefficient…
Factor used to compensate for differences in plant usage. (% of ET)

Different Plants
Have Different
Needs.


Scheduling:
T = 60 x Eto x Kc PR x EA

Scheduling
EXAMPLE:
Kc = cool season turf = .80
ETo = .25”/ day
DU = 70%
Soil = sandy loam
PR = .50”/ hr.
T = 60 x ETo x Kc T = 60 x .25 x .80
PR x DU .50 x .70
T = 12.0 T = 34 minutes run time .35

How it All Comes
Together in the Field

Installation Criteria
Main line & lateral depth
Sprinklers and quick couplers Grade
Boxes
Trenches properly backfilled and compacted
Provide a color-coded, laminated
“As-Built” for controller box

Installation…

Proper Installation
Heights

Proper Installation Practices…
DBRY-6

Professional Irrigation
Installation
Site inspections are cheap insurance
policies!

Efficient Irrigation Maintenance/
Management

Efficient Irrigation
Maintenance/ Management…

Efficient Irrigation
Maintenance/ Management

Maintenance Check-list
Set pressures to specifications
Adjust heads to correct grades
No missing heads or broken sprinklers
No interference to heads by landscape
Annual equipment check-up
Understand proper winterization &
spring start-up techniques

Education Opportunities

Fantastic!!

What does it all
mean?
=

Complexities? Simplicities? Pitfalls!

Q & A

Troubleshooting
Irrigation Systems

Minimize the need to
“Troubleshoot” a System by
Maintaining and Inspecting
Your System on a Regular
Basis!
Irrigation Troubleshooting

Troubleshooting Sequence
Confirm Water Supply
Backflow devices
Automatic Controller
Field Wiring
Valves
Sprinkler Heads
Pipe and Fittings

Confirm Water Supply…
Is system pressurized?
Is supply line connected?
Is master valve flow control open?
Are any manual/ isolation valves
closed?

Backflow Devices…
Is device open and operating?
Check petcocks for debris in lines
Check isolation valves
Consult manufacturer’s
instructions
Electrical Problems
Troubleshooting Sequence
Seek to Isolate the Problem into One
of Three Areas (in this order):
1) Clock
2) Field Wiring
3) Solenoid

Automatic Controller…
No Operation or Display
No 120V power supply
Blown fuse, overload or short
Tripped circuit breaker
Damaged controller

Automatic Controller…
No Program Execution
Bad programming
No field connection (cut, loose, disconnected
wiring)
Sensors activated
Valve and/ or meter turned off
No controller output power

Automatic Controller…
No Controller Output
No power supply to field
Blown field common line fuse (24V)
Tripped field common line breaker (24V)
Loose connector for field wiring
No output operated device connected

Most Common Controller
Problems
Programming Error - must have: Start
Time, Run Time, Days to Water, Correct
day and Time
Total System Failure (no 120 V incoming)
No Output to Valves (no 24 V outgoing)
Is A Sensor (rain, wind or freeze) Active?
Meters – (Voltmeter: to check controller;
Ohm meter: to check field wiring)

Field Wiring…
Bad splices due to improper use of
connectors
Broken or nicked field wires
Use cable fault locators to track
problems
Ohm meter for field wiring checks
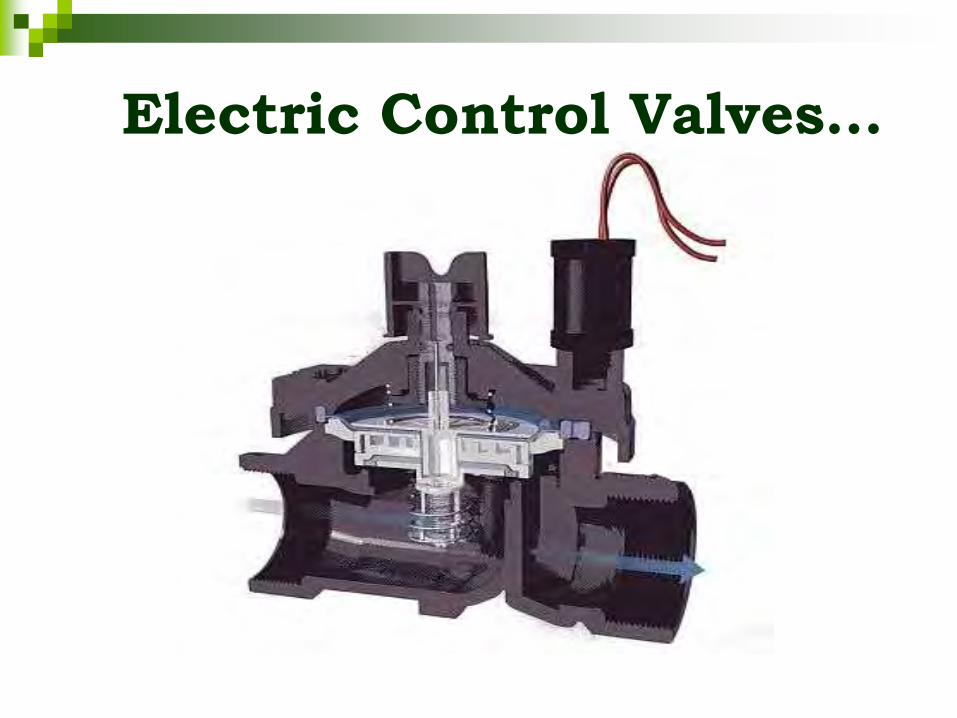
Electric Control Valves…

CC
Forward Solenoid Flow Valve

Forward Solenoid Flow Valve

Forward Solenoid Flow Valve

Electric Control Valves…
Valve does not close
Damaged diaphragm
Seats are corroded or broken
Upper chamber filter is plugged
Worn or damaged solenoid
Flow control handle turned full open
Manual bleed screw is corroded
Valve has been disassembled in field and
reassembled improperly

Electric Control Valves…
Valve does not open
Bad solenoid
No power to solenoid from controller
Insufficient voltage at valve
Flow control turned down
Solenoid port/ path is plugged
Flow demand to low for valve specs
If pressure regulated, regulator could be
damaged or incorrectly adjusted

Sprays Heads…
Severe misting…too much pressure
Install regulating device or turn down flow control
handle on valve
Spray pattern spiking – plugged orifice
Water puddling at sprinkler
Popup stroke too small
Head buried too low
Low head drainage – check valve
Vertical stream of water around riser
Worn or damaged wiper seal; cap not on tight

Spray Heads…
High psi
Adj. psi Internal psi regulator
Leaky cap/ wiper seal

Rotors…
Gear (ball & cam) Drives
Non-rotation Stator mechanism is blocked by debris
Reversing springs misaligned
Water leaking around riser
Worn or damaged wiper seal
Water puddling around sprinkler
Head buried too low
Low head drainage
Spray distorted by adjustment screw
Back off screw

Rotors…

Rotors…
Gear Drives
Too low of pressure
Change nozzle to smaller flow (increase run-time)
Open flow control handle on valve
Check for semi-closed isolation valves
Divide zone; add another valve
Add booster pump

Pipe and Fittings Maintenance Check-list
Use Swing Joints on all Heads
Solvent Cement PVC fittings
Properly
Clamp Poly Pipe Properly
Proper Burial Depth for all Piping
Thrust blocks where required
Winterize (Blow-out) System
Properly

Irrigation System
Troubleshooting…
“The Ideal System applies water uniformly, is easy to repair and maintain and is operationally simple.”